Page 1
UNIVERSIDADE ESTADUAL DE CAMPINAS
FACULDADE DE ENGENHARIA DE ALIMENTOS
FLÁVIO CARDOSO DE MATOS
BEHAVIOR ANALYSIS OF THE SOLID-LIQUID EQUILIBRIUM OF
FATTY SYSTEMS THROUGH OF THE USE DIFFERENTIAL
SCANNING CALORIMETRY
ANÁLISE DO COMPORTAMENTO DO EQUILÍBRIO SÓLIDO-
LÍQUIDO DE SISTEMAS GRAXOS ATRAVÉS DO USO DA
CALORIMETRIA EXPLORATÓRIA DIFERENCIAL
CAMPINAS - SP
2017
Page 2
FLÁVIO CARDOSO DE MATOS
BEHAVIOR ANALYSIS OF THE SOLID-LIQUID EQUILIBRIUM OF
FATTY SYSTEMS THROUGH OF THE USE DIFFERENTIAL SCANNING
CALORIMETRY
ANÁLISE DO COMPORTAMENTO DO EQUILÍBRIO SÓLIDO-LÍQUIDO
DE SISTEMAS GRAXOS ATRAVÉS DO USO DA CALORIMETRIA
EXPLORATÓRIA DIFERENCIAL
Orientador: Eduardo Augusto Caldas Batista
Coorientadora: Mariana Conceição da Costa
CAMPINAS - SP
2017
Tese de doutorado apresentada à Faculdade
de Engenharia de Alimentos da Universidade
Estadual de Campinas como parte dos
requisitos exigidos para a obtenção do título
de Doutor em Engenharia de Alimentos.
Thesis presented to the Faculty of Food
Engineering of the University of Campinas in
partial fulfillment of the requirements for the
degree of Doctor in Food Engineering.
ESTE EXEMPLAR CORRESPONDE À VERSÃO
FINAL DE TESE DEFENDIDA PELO ALUNO
FLÁVIO CARDOSO DE MATOS E ORIENTADA
PELO PROF.DR. EDUARDO AUGUSTO
CALDAS BATISTA.
Page 3
Agência(s) de fomento e nº(s) de processo(s): CAPES; FAPESP: 2012/05027-1; CNPq:
479533/2013-0, 308616/2014-6.
Ficha catalográfica
Universidade Estadual de Campinas
Biblioteca da Faculdade de Engenharia de Alimentos
Claudia Aparecida Romano - CRB 8/5816
Informações para Biblioteca Digital
Título em outro idioma: Behavior analysis of the solid-liquid equilibrium of fatty systems
through of the use differential scanning calorimetry
Palavras-chave em inglês:
Solid-liquid equilibrium
Fatty systems
Differential scanning calorimetry
Thermodynamic modeling
Área de concentração: Engenharia de Alimentos
Titulação: Doutor em Engenharia de Alimentos
Banca examinadora:
Eduardo Augusto Caldas Batista [Orientador]
Marcos Rogério Mafra
Moisés Teles dos Santos
Rafael Mauricio Matricarde Falleiro
Rodrigo Corrêa Basso
Data de defesa: 21-02-2017
Programa de Pós-Graduação: Engenharia de Alimentos
Matos, Flávio Cardoso de, 1983-
M428a Análise do comportamento do equilíbrio sólido-líquido de sistemas graxos
através do uso da calorimetria exploratória diferencial / Flávio Cardoso de Matos. –
Campinas, SP: [s.n.], 2017.
Orientador: Eduardo Augusto Caldas Batista.
Coorientador: Mariana Conceição da Costa.
Tese (doutorado) – Universidade Estadual de Campinas, Faculdade de
Engenharia de Alimentos.
1. Equilíbrio sólido-líquido. 2. Sistemas graxos. 3. Calorimetria exploratória
diferencial. 4. Modelagem termodinâmica. I. Batista, Eduardo Augusto Caldas. II.
Costa, Mariana Conceição da. III. Universidade Estadual de Campinas. Faculdade
de Engenharia de Alimentos. IV. Título.
Page 4
COMISSÃO EXAMINADORA
Prof. Dr. Eduardo Augusto Caldas Batista
Orientador – UNICAMP
Prof. Dr. Marcos Rogério Mafra
Membro Titular – UFPR
Prof. Dr. Moisés Teles dos Santos
Membro Titular–USP
Prof. Dr. Rafael Mauricio Matricarde Falleiro
Membro Titular – UNIFESP
Prof. Dr. Rodrigo Corrêa Basso
Membro Titular – UNIFAL
Prof. Dr. André Bernardo
Membro Suplente – UFSCAR
Prof. Dr. Jorge Fernando Brandão Pereira
Membro Suplente – UNESP
Prof. Dr. José Vicente Hallak D´Angelo
Membro Suplente – UNICAMP
Ata da defesa com as respectivas assinaturas dos membros encontra-se no processo de vida
acadêmica do aluno.
Page 5
AGRADECIMENTOS
Primeiramente agradeço a Deus por me amparar nos momentos difíceis, me dar força interior
para superar as dificuldades, mostrar os caminhos nas horas incertas e me suprir em todas as
minhas necessidades.
Aos meus pais, Flóris e Celestina, por todo exemplo de dedicação e perseverança, pela
compreensão, carinho e amizade e ao meu irmão Fabricio pela confiança, companheirismo e
amizade.
À Kellen, pelo amor, apoio e carinho nos momentos mais difíceis dessa jornada.
Ao Prof. Dr. Eduardo Augusto Caldas Batista, pela orientação e ensinamentos ao longo desse
trabalho.
À Prof.a
Drª. Mariana Conceição, pela coorientação, suporte e ensinamentos durante todo o
desenvolvimento do trabalho.
Aos amigos do ExTrAE, pelos agradáveis momentos de convivência.
Aos Professores Marcos Rogério, Moisés Teles, Rafael Mauricio e Rodrigo Corrêa pelas
atenciosas correções e valiosas sugestões a minha tese.
Enfim, à todos os que, direta e indiretamente, contribuíram para a realização deste trabalho.
Page 6
RESUMO
Misturas graxas são conhecidas por apresentar um comportamento de fusão complexo em
virtude da existência de uma grande variedade de formas cristalinas que cada composto pode
apresentar. O interesse envolvendo essa classe de compostos está relacionado com o
conhecimento de suas propriedades físicas, tais como textura, plasticidade e formas
polimórficas, que são relevantes para o desenvolvimento de diversos produtos na indústria de
alimentos, como margarinas, sorvetes, chocolates entre outros. O estudo do equilíbrio sólido-
líquido (ESL) de misturas graxas é de fundamental importância para a compreensão do
comportamento termodinâmico desses sistemas, sendo útil na concepção e aprimoramento de
operações unitárias que envolvam esses compostos. Diante disso, o objetivo desse trabalho foi
realizar o estudo do comportamento de fases no equilíbrio sólido-líquido de misturas de
compostos graxos com a intenção de compreender as transições de fases que ocorrem nesses
sistemas devido ao aumento da temperatura em diferentes composições. Para tanto, foram
construídos diagramas de equilíbrio sólido-líquido de misturas binárias formadas por
triacilglicerol + ácido graxo, triacilglicerol + álcool graxo, triacilglicerol + triacilglicerol e um
sistema ternário contendo triacilgliceróis. Os dados de equilíbrio sólido-líquido foram
determinados experimentalmente usando a calorimetria exploratória diferencial (Differential
Scanning Calorimetry, DSC). A microscopia óptica, com controle de temperatura, foi
utilizada para estudar a fase sólida e a transição sólido-líquido de algumas misturas. Os
desvios relativos médios de todas as temperaturas e entalpias molares de fusão dos compostos
puros em relação aos resultados da literatura foram menores que 0,35 % e 7,80 %,
respectivamente. Os resultados experimentais mostraram que todas as misturas binárias de
triacilgliceróis + ácidos graxos e triacilgliceróis + álcoois graxos apresentaram
comportamento eutético simples, algumas com formação de solução sólida próxima ao
triacilglicerol puro. Os resultados experimentais das misturas binárias e ternária compostas
por triacilgliceróis apresentaram comportamento eutético com formação parcial de solução
sólida próxima ao triacilglicerol de maior cadeia carbônica. Os parâmetros dos modelos
Margules de 3 sufixos e NRTL foram ajustados aos dados experimentais dos sistemas
binários constituídos por triacilgliceróis + ácidos graxos e triacilgliceróis + álcoois graxos
para a descrição da linha liquidus com desvios médios quadráticos menores que 1,52 K. Para
os sistemas binários compostos por triacilgliceróis, os parâmetros do modelo de Margules 2
sufixos foram ajustados aos dados experimentais para a descrição da fase líquida e sólida com
Page 7
desvios absolutos médios menores que 0,92 K. Esses parâmetros foram usados para a
predição do equilíbrio sólido-líquido do sistema ternário com desvio absoluto médio igual a
1,14 K. Em todos os casos, os modelos termodinâmicos conseguiram descrever os dados
experimentais de equilíbrio sólido-líquido com sucesso. A partir dos resultados experimentais,
as técnicas de DSC e microscopia óptica foram consideradas adequadas para as medidas dos
dados de equilíbrio sólido-líquido das misturas graxas desse estudo.
Palavras-chave: Equilíbrio sólido-líquido, sistemas graxos, calorimetria exploratória
diferencial, modelagem termodinâmica.
Page 8
ABSTRACT
Fatty mixtures are known to exhibit a very complex melting behavior, due to the existence of
a large variety of crystalline forms that each compound may exhibit. The interest in this class
of compounds is related to the knowledge of their physical properties, such as texture,
plasticity and polymorphic forms, which are relevant for the development of various products
in the food industry, such as margarines, ice cream, chocolates and others. The study of solid-
liquid equilibrium (SLE) of fatty mixtures is of fundamental importance for understanding the
thermodynamic behavior of these systems, which is useful in the design and improvement of
unit operations involving these compounds. Taking into account, the objective of this work
was to study the solid-liquid equilibrium behavior in mixtures of fatty compounds with the
intention of understanding phase transitions that occur in these systems due to the increase of
temperature in different compositions. Therefore, solid-liquid phase diagrams of binary
mixtures composed by triacylglycerol + fatty acid, triacylglycerol + fatty alcohol,
triacylglycerol + triacylglycerol and a ternary system composed by triacylglycerols were
constructed. Solid-liquid equilibrium data were experimentally determined using the
Differential Scanning Calorimetry (DSC). The optical microscopy with temperature control
was used to evaluate the solid phase and the solid-liquid transition of some mixtures. The
average relative deviations for all the melting temperatures and molar enthalpies of the pure
compounds in relation to the literature results were lower than 0.35 % and 7.80 %,
respectively. The experimental results showed that all binary mixtures of triacylglycerols +
fatty acids and triacylglycerols + fatty alcohols presented simple eutectic behavior, some with
formation of solid solution close to pure triacylglycerol. The experimental results of the
binary and ternary mixtures composed by triacylglycerols showed an eutectic behavior with
partial solid solution formation close to the triacylglycerol with the highest carbon chain. The
parameters of the three-suffix Margules and NRTL models were adjusted to the experimental
data of the binary systems constituted by triacylglycerols + fatty acids and triacylglycerols +
fatty alcohols for the description of the liquidus line with the root mean square deviations
lower than 1,52 K. For binary systems constituted by triacylglycerols, the parameters of the
two-suffix Margules model were fitted to the experimental data for the description of the
liquid and solid phase with the mean absolut deviations lower than 0.92 K. These parameters
were used for the prediction of the solid-liquid equilibrium of the ternary system with mean
absolute deviation equal to 1.14 K. In all cases, the thermodynamic models allowed to
Page 9
describe the experimental data successfully. From the experimental results, the techniques of
DSC and optical microscopy were considered suitable for the measurement of the solid-liquid
equilibrium of the studied fatty mixtures.
Keywords: Solid-liquid equilibrium, Fatty systems, Differential scanning calorimetry,
Thermodynamic modeling
Page 10
SUMÁRIO
CAPÍTULO 1 ............................................................................................................... 14
INTRODUÇÃO GERAL, OBJETIVOS E ESTRUTURA DA TESE ......................... 14
Referências bibliográficas ............................................................................................ 21
CAPÍTULO 2 ............................................................................................................... 23
REVISÃO BIBLIOGRÁFICA ..................................................................................... 23
2.1 Compostos graxos .............................................................................................. 24
2.2 Polimorfismo ...................................................................................................... 25
2.3 Critério do equilíbrio de fases ............................................................................ 28
2.3.1 Cálculo da relação das fugacidades de um componente puro nas fases líquida
e sólida ........................................................................................................................ 30
2.4 Modelos termodinâmicos para o cálculo do coeficiente de atividade da fase
líquida ........................................................................................................................... 34
2.4.1 Modelo de Margules ....................................................................................... 35
2.4.2 Modelo NRTL ................................................................................................. 36
2.5 Diagrama de fases do equilíbrio sólido–líquido ................................................. 38
2.6 Análise térmica e calorimetria ............................................................................ 43
2.6.1 Calorimetria Exploratória Diferencial (DSC) ................................................. 43
2.6.2 Descrição dos principais eventos térmicos em uma curva térmica diferencial ..
........................................................................................................................ 45
2.7 Equilíbrio sólido-líquido envolvendo compostos graxos ................................... 46
Referências bibliográficas ............................................................................................ 50
CAPÍTULO 3 ............................................................................................................... 57
BINARY SOLID-LIQUID EQUILIBRIUM SYSTEMS CONTAINING FATTY
ACIDS, FATTY ALCOHOLS AND TRIOLEIN BY DIFFERENTIAL SCANNING
CALORIMETRY ......................................................................................................... 57
ABSTRACT ................................................................................................................. 58
Page 11
3.1 Introduction ........................................................................................................ 58
3.2 Experimental ....................................................................................................... 59
3.2.1 Materials ........................................................................................................ 59
3.2.2 Preparation of binary mixture samples .......................................................... 60
3.2.3 Differential scanning calorimetry ................................................................... 60
3.2.4 SLE thermodynamic modeling ...................................................................... 61
3.3 Results and Discussion ....................................................................................... 63
3.4 Conclusions ........................................................................................................ 81
Acknowledgements ...................................................................................................... 81
Appendix A. Supplementary data ................................................................................. 82
References .................................................................................................................... 85
CAPÍTULO 4 ............................................................................................................... 89
BINARY SOLID-LIQUID EQUILIBRIUM SYSTEMS CONTAINING FATTY
ACIDS, FATTY ALCOHOLS AND TRILAURIN BY DIFFERENTIAL SCANNING
CALORIMETRY ......................................................................................................... 89
ABSTRACT ................................................................................................................. 90
4.1 Introduction ........................................................................................................ 90
4.2 Experimental ....................................................................................................... 91
4.2.1 Materials ......................................................................................................... 91
4.2.2 Preparation of binary mixture samples ........................................................... 92
4.2.3 Differential scanning calorimetry .................................................................. 92
4.2.4 Optical microscopy ......................................................................................... 93
4.2.5 SLE thermodynamics ...................................................................................... 93
4.3 Results and Discussion ....................................................................................... 94
4.4 Conclusions ...................................................................................................... 115
Acknowledgements .................................................................................................... 115
References .................................................................................................................. 116
Page 12
CAPÍTULO 5 ............................................................................................................. 121
BINARY SOLID–LIQUID EQUILIBRIUM SYSTEMS CONTAINING FATTY
ACIDS, FATTY ALCOHOLS AND TRIMYRISTIN BY DIFFERENTIAL
SCANNING CALORIMETRY .................................................................................. 121
ABSTRACT ............................................................................................................... 122
5.1 Introduction ...................................................................................................... 122
5.2 Experimental ..................................................................................................... 123
5.2.1 Materials ....................................................................................................... 123
5.2.2 Preparation of the Binary Mixture Samples ................................................. 124
5.2.3 Differential Scanning Calorimetry ................................................................ 124
5.2.4 Optical Microscopy ....................................................................................... 125
5.2.5 SLE Thermodynamic ................................................................................... 125
5.3 Results and Discussion ..................................................................................... 125
5.4 Conclusions ...................................................................................................... 149
Acknowledgments ...................................................................................................... 149
References .................................................................................................................. 150
CAPÍTULO 6 ............................................................................................................. 156
SOLID-LIQUID EQUILIBRIUM OF BINARY AND TERNARY SYSTEMS
COMPOSED BY TRIPALMITIN, TRISTEARIN AND TRIBEHENIN ................. 156
ABSTRACT ............................................................................................................... 157
6.1 Introduction ...................................................................................................... 157
6.2 Experimental section ........................................................................................ 158
6.2.1 Materials ....................................................................................................... 158
6.2.2 Preparation of binary and ternary mixture samples ...................................... 159
6.2.3 Differential scanning calorimetry ................................................................. 159
6.2.4 Optical microscopy ....................................................................................... 160
6.2.5 SLE thermodynamic modeling ..................................................................... 160
Page 13
6.3 Results and Discussion ..................................................................................... 161
6.3.1 Binary Mixtures ............................................................................................ 165
6.3.2 Ternary Mixtures .......................................................................................... 175
6.4 Conclusions ...................................................................................................... 186
Acknowledgements .................................................................................................... 186
Supplementary Materials ............................................................................................ 187
References .................................................................................................................. 190
CAPÍTULO 7 ............................................................................................................. 195
DISCUSSÃO GERAL ................................................................................................ 195
7.2 Referências bibliográficas ................................................................................ 207
CAPÍTULO 8 ............................................................................................................. 208
CONCLUSÕES GERAIS .......................................................................................... 208
8.1 Sugestões para trabalhos futuros ...................................................................... 211
Referências bibliográficas .......................................................................................... 212
ANEXO A – Compilação de alguns sistemas de compostos graxas que possuem dados
na literatura. ................................................................................................................ 223
ANEXO B – Neste anexo serão apresentadas as autorizações para publicação dos
artigos apresentados nos capítulos 3 e 4, respectivamente. ........................................ 232
Page 14
Capítulo 1 14
CAPÍTULO 1
INTRODUÇÃO GERAL, OBJETIVOS E ESTRUTURA DA TESE
Page 15
Capítulo 1 15
O consumo e a produção mundial de óleos e gorduras teve um aumento contínuo ao
longo dos últimos 25 anos sendo que a produção mundial de óleos e gorduras no ano de 2015
totalizou cerca de 177 milhões de toneladas com aumento total de produção estimado em 218
milhões de toneladas para o ano de 2025 (F.A.O., 2016). Os óleos e gorduras são compostos
principalmente por triacilgliceróis, juntamente com seus constituintes minoritários,
diacilgliceróis, monogliceróis, ácidos graxos, álcoois graxos entre outros. Esses compostos
formam um importante grupo utilizado na indústria de alimentos para produção de
margarinas, sorvetes, chocolates, entre outros, além de serem usados na elaboração de
produtos na indústria química e farmacêutica como surfactantes, agentes estruturantes para
emulsificação, gelificação e revestimento. Além da demanda para consumo humano, há
também uma demanda crescente pela produção de biodiesel que é produzido a partir da
reação de transesterificação de óleos e gorduras (BARBOSA; FILHO, 2011) e alguns estudos
afirmam que álcoois graxos, ácidos graxos podem ser utilizados como materiais de mudança
de fase (Phase Change Material, PCM) em processos de armazenamento térmico (SATO,
2001; GUNSTONE; HARWOOD; DIJKSTRA, 2007; SATO; UENO, 2011; WEI; HAN;
WANG, 2014).
Na indústria alimentícia é grande o número de misturas de óleos e gorduras utilizadas
no processamento de alimentos cuja qualidade final está relacionada com as suas propriedades
físico-químicas (COSTA, 2008) como a temperatura de fusão e a própria estrutura da fase
sólida, ou seja, a forma polimórfica presente em determinda condição de temperatura e
pressão. Sendo assim, o estudo do equilíbrio entre as diferentes fases sólidas e entre as fases
sólida e líquida dos óleos e gorduras e de seus componentes é importante para o controle de
qualidade, para desenvolvimento de produtos e de processos de separação, bem como para o
dimensionamento de equipamentos de purificação de compostos através do processo de
cristalização, por exemplo, cuja modelagem termodinâmica depende de informações do
equilíbrio de fases sólido-líquido (BRUIN, 1999; BARBOSA; FILHO, 2011; CARARETO,
2014). É devido ao significativo impacto desses compostos nos diferentes segmentos da
indústria, diversos estudos buscam descrever a influência que os triacilgliceróis, ácidos graxos
e álcoois graxos e alguns constituintes minoritários exercem sobre as propriedades físicas e
químicas dos óleos e gorduras e de seus produtos finais (TH DE et al., 2004; COSTA et al.,
2007; COSTA et al., 2010; CARARETO et al., 2011; ZUO; LI; WENG, 2011; MAXIMO;
COSTA; MEIRELLES, 2013; WEI; HAN; WANG, 2014).
Page 16
Capítulo 1 16
Esse trabalho teve por objetivo principal analisar o comportamento experimental do
equilíbrio sólido líquido (ESL) de misturas graxas ainda não encontradas na literatura e
proceder a sua modelagem termodinâmica, complementando dessa forma o banco de dados
com informações fundamentais para o desenvolvimento e aprimoramento dos processos de
separação e de produtos, seja por simulação computacional ou experimental. Para atender o
objetivo principal desse projeto os objetivos específicos foram:
Estudar o comportamento de 20 diagramas de fases de misturas binárias
formadas por triacilgliceróis + ácidos graxos, triacilgliceróis + álcoois graxos e
misturas de triacilgliceróis usando a técnica da calorimetria exploratória
diferencial;
Estudar o comportamento de um diagrama de fases ternário formado pela
mistura de triacilgliceróis usando a técnica da calorimetria exploratória
diferencial;
Estudar as transições na fase sólida de algumas misturas, utilizando a técnica
da microscopia óptica com controle de temperatura;
Analisar o comportamento do diagrama de fases ao se manter fixo o mesmo
triacilglicerol na mistura binária e substituir o ácido graxo por um álcool graxo
com o mesmo número de carbonos;
Modelar termodinamicamente os dados experimentais de equilíbrio sólido-
líquido das misturas binárias formadas por triacilgliceróis + ácidos graxos e
triacilgliceróis + álcoois graxos pelo ajuste dos parâmetros dos modelos de
Margules de 3 sufixos e NRTL para a descrição da linha liquidus;
Modelar termodinamicamente os dados experimentais do equilíbrio sólido-
líquido das misturas binárias formadas por triacilgliceróis pelo ajuste dos
parâmetros dos modelos de Margules de 2 e 3 sufixos para a descrição das
fases líquida e sólida;
Avaliar a predição do equilíbrio sólido-líquido das mistura ternária de
triacilgliceróis com o uso dos parâmetros ajustados aos dados experimentais
das misturas binárias de triacilgliceróis.
Os componentes graxos das misturas estudadas nesse trabalho estão apresentados nas
Tabelas 1.1 – 1.3, juntamente com sua fórmula química, massa molar e estrutura química.
Page 17
Capítulo 1 17
Tabela 1.1 Triacilgliceróis usados neste trabalho e suas propriedades.
Componentes Fórmula
química
Massa molar
(g/mol) Estrutura química
Trioleina C57H104O6 885,43
Trilaurina C39H74O6 639,02
Trimiristina C45H86O6 723,18
Tripalmitina C51H98O6 807,34
Triestearina C57H110O6 891,50
Tribehenina C69H134O6 1059,83
Page 18
Capítulo 1 18
Tabela 1.2 Ácidos graxos usados neste trabalho e suas propriedades.
Componentes Fórmula
química
Massa
molar
(g/mol)
Estrutura química
Ácido cáprico C10H20O2 172,26
Ácido láurico C12H24O2 200,32
Ácido mirístico C14H28O2 228,37
Ácido palmítico C16H32O2 256,42
Ácido esteárico C18H36O2 284,48
Tabela 1.3 Álcoois graxos usados neste trabalho e suas propriedades.
Componentes Fórmula
química
Massa
molar
(g/mol)
Estrutura química
1-Decanol C10H22O 158,28
1-Dodecanol C12H26O 186,34
1-Tetradecanol C14H30O 214,23
1-Hexadecanol C16H34O 242,44
1-Octadecanol C18H38O 270,49
A estrutura desse trabalho foi dividida em capítulos. Os assuntos abordados em cada
capítulo estão resumidos a seguir:
No Capítulo 2 é apresentada uma breve revisão da literatura sobre ESL de compostos
graxos. O capítulo apresenta uma compilação de artigos nos quais a técnica da calorimetria
exploratória diferencial foi utilizada para obtenção de dados de equilíbrio sólido-líquido de
compostos graxos.
Page 19
Capítulo 1 19
No Capítulo 3 é apresentado o artigo publicado na revista Fluid Phase Equilibria,
intitulado Binary Solid-Liquid Equilibrium Systems Containing Fatty Acids, Fatty alcohols
and Triolein by Differential Scanning Calorimetry, que teve como objetivo estudar o
comportamento do ESL de seis sistemas binários (Tabela 1.4). Os resultados experimentais
apresentam um comportamento eutético simples. O gráfico de Tammann foi utilizado para
validar o comportamento eutético. Os dados experimentais de ESL foram usados para o ajuste
dos parâmetros dos modelos de Margules de 3 sufixos e NRTL para o cálculo do coeficiente
de atividade.
No Capítulo 4 é apresentado o artigo publicado na revista Fluid Phase Equilibria,
intitulado Binary solid-liquid equilibrium systems containing fatty acids, fatty alcohols and
trilaurin by differential scanning calorimetry. Esse trabalho reporta os resultados
experimentais e calculados para seis sistemas binários (Tabela 1.4). Os resultados
apresentaram comportamento eutético simples e comportamento eutético com formação de
solução sólida. A formação de solução sólida foi confirmada pela técnica de microscopia
óptica e pelo gráfico de Tammann. Os dados experimentais de ESL foram usados para o
ajuste dos parâmetros dos modelos de Margules de 3 sufixos e NRTL para o cálculo do
coeficiente de atividade.
No Capítulo 5 intitulado Binary solid–liquid equilibrium systems containing fatty
acids, fatty alcohols and trimyristin by differential scanning calorimetry são apresentados os
resultados experimentais e calculados obtidos para cinco sistemas binários (Tabela 1.4). As
misturas binárias trimiristina + ácido cáprico, trimiristina + ácido láurico, trimiristina + 1-
dodecanol e trimiristina + 1-tetradecanol exibiram formação parcial de solução sólida. A
microscopia óptica e o gráfico de Tammann foram utilizados para confirmar a presença de
solução sólida e para validar o comportamento eutético, respectivamente. Os dados
experimentais de ESL foram usados para o ajuste dos parâmetros dos modelos de Margules de
3 sufixos e NRTL para o cálculo do coeficiente de atividade.
No Capítulo 6 intitulado Solid-liquid equilibrium of binary and ternary systems
composed by tripalmitin, tristearin and tribehenin são apresentados os resultados
experimentais e calculados para o ESL dos três sistemas binários e um ternário contendo
triacilgliceróis (Tabela 1.4). Foi observada a formação de solução sólida nós três sistemas
binários e no sistema ternário. Os dados experimentais de ESL dos sistemas binários foram
usados para o ajuste dos parâmetros dos modelos de Margules de 2 e de 3 sufixos para
Page 20
Capítulo 1 20
calcular a não idealidade de ambas as fases sólida e líquida. Esses parâmetros binários foram
usados na predição da não idealidade das fases sólida e líquida do sistema ternário.
O Capítulo 7 - Discussão Geral apresenta uma discussão dos principais resultados
obtidos.
O Capítulo 8 – Conclusões Gerais apresenta as principais conclusões observadas e
também apresenta sugestões para trabalhos futuros nos temas apresentados nesse trabalho.
Tabela 1.4 Sistemas estudados nesse trabalho.
Sistemas
Capítulo 3
Trioleina + ácido cáprico
Trioleina + ácido láurico
Trioleina + ácido mirístico
Trioleina + 1-decanol
Trioleina +1-dodecanol
Trioleina + 1-tetradecanol
Capítulo 4
Trilaurina + ácido mirístico
Trilaurina + ácido palmítico
Trilaurina + ácido esteárico
Trilaurina + 1-tetradecanol
Trilaurina + 1-hexadecanol
Trilaurina + 1-octadecanol
Capítulo 5
Trimiristina + ácido cáprico
Trimiristina + ácido láurico
Trimiristina + ácido esteárico
Trimiristina +1-dodecanol
Trimiristina +1-tetradecanol
Capítulo 6
Tripalmitina + triestearina
Tripalmitina + tribehenina
Triestearina + tribehenina
Tripalmitina + triestearina + tribehenina
Page 21
Capítulo 1 21
Referências bibliográficas
BARBOSA, D. F.; FILHO, P. A. P. Thermodynamic Modeling of Solid-Liquid Equilibrium
of Mixtures of Fatty Alcohols. Proceedings of the VI Brazilian Congress of Applied
Thermodynamics. Salvador - Bahia – Brazil. 2011.
BRUIN, S. Phase equilibria for food product and process design. Fluid Phase Equilibria, v.
158–160, p. 657-671. 1999.
CARARETO, N. D. D. SOLID-LIQUID EQUILIBRIUM AND FLASH POINT OF
FATTY MIXTURES. 2014. (Doutorado). Departamento de Engenharia de Alimentos,
Universidade Estadual de Campinas, Campinas.
CARARETO, N. D. D.; COSTA, M. C.; ROLEMBERG, M. P.; KRÄHENBÜHL, M. A.;
MEIRELLES, A. J. A. The solid–liquid phase diagrams of binary mixtures of even saturated
fatty alcohols. Fluid Phase Equilibria, v. 303, n. 2, p. 191.e1-191.e8. 2011.
COSTA, M. C. Determinação Experimental do Equilíbrio Sólido-Líquido de Sistemas
Binários de Ácidos Graxos Saturados: Estudo Detalhado da Fase Sólida. 2008.
(Doutorado). Departamento de Processos Químicos - DPQ, Universidade Estadual de
Campinas, Campinas, Laboratório de Propriedades Termodinâmicas - LPT.
COSTA, M. C.; ROLEMBERG, M. P.; BOROS, L. A. D.; KRÄHENBÜHL, M. A.; DE
OLIVEIRA, M. G.; MEIRELLES, A. J. A. Solid−Liquid Equilibrium of Binary Fatty Acid
Mixtures. Journal of Chemical & Engineering Data, v. 52, n. 1, p. 30-36. 2007.
COSTA, M. C.; ROLEMBERG, M. P.; DOS SANTOS, A. O.; CARDOSO, L. P.;
KR HENB HL, M. A.; MEIRELLES, A. J. A. Solid−Liquid Equilibrium of Tristearin with
Refined Rice Bran and Palm Oils. Journal of Chemical & Engineering Data, v. 55, n. 11, p.
5078-5082. 2010.
F.A.O. OECD-FAO Agricultural Outlook Available in www.fao.org. Acessed in
16/08/2016.
GUNSTONE, F. D.; HARWOOD, J. L.; DIJKSTRA, A. J. The Lipid Handbook. Third
Edition. CRC Press, 2007.
Page 22
Capítulo 1 22
MAXIMO, G. J.; COSTA, M. C.; MEIRELLES, A. J. A. Solid-liquid equilibrium of triolein
with fatty alcohols. Brazilian Journal of Chemical Engineering, v. 30, p. 33-43. 2013.
SATO, K. Crystallization behaviour of fats and lipids — a review. Chemical Engineering
Science, v. 56, n. 7, p. 2255-2265. 2001.
SATO, K.; UENO, S. Crystallization, transformation and microstructures of polymorphic fats
in colloidal dispersion states. Current Opinion in Colloid & Interface Science, v. 16, n. 5,
p. 384-390. 2011.
TH DE, L. et al. Liquid-Multiple Solid Phase Equilibria in Fats. In: (Ed.). Fat Crystal
Networks: CRC Press, 2004. p.481-709. (Food Science and Technology).
WEI, D.; HAN, S.; WANG, B. Solid–liquid phase equilibrium study of binary mixtures of n-
octadecane with capric, and lauric acid as phase change materials (PCMs). Fluid Phase
Equilibria, v. 373, n. 0, p. 84-88. 2014.
ZUO, J. G.; LI, W. Z.; WENG, L. D. Thermal performance of caprylic acid/1-dodecanol
eutectic mixture as phase change material (PCM). Energy and Buildings, v. 43, n. 1, p. 207-
210. 2011.
Page 23
Capítulo 2 23
CAPÍTULO 2
REVISÃO BIBLIOGRÁFICA
Page 24
Capítulo 2 24
2.1 Compostos graxos
Os compostos graxos são derivados de óleos e gorduras de origem vegetal ou animal
que em geral possuem uma boa solubilidade em solventes não polares e são insolúveis em
água (NILS; HANS, 2006). Óleos e gorduras são formados por triacilgliceróis (geralmente >
95% da composição total), diacilgliceróis, monoacilgliceróis, ácidos graxos livres e álcoois
graxos, mas também podem conter fosfolipídios, esteróis livres, ésteres de esteróis (tocoferóis
e tocotrienóis), hidrocarbonetos e vitaminas solúveis em gordura (GUNSTONE;
HARWOOD; DIJKSTRA, 2007; MUDGE; BELANGER; NIELSEN, 2008).
Os triacilgliceróis (TAGs), Figura 2.1 (a), são formados pela união de três ácidos
graxos a uma molécula de glicerol, cujas três hidroxilas (–OH) ligam-se aos radicais
carboxílicos (–COOH) dos ácidos graxos com a liberação de três moléculas de água
(GUNSTONE; HARWOOD; DIJKSTRA, 2007). Triacilgliceróis que apresentam em sua
estrutura três ácidos graxos idênticos são conhecidos como monoácidos de triacilgliceróis, já
os triacilgliceróis que apresentam em sua estrutura a presença de um ou mais diferentes ácidos
graxos são chamados de triacilgliceróis mistos (SCRIMGEOUR, 2005). Em geral, óleos e
gorduras podem conter mais de 500 moléculas diferentes de triacilgliceróis, o que faz com
que não apresentem um ponto de fusão distinto, mas sim uma faixa de temperatura de fusão
que acaba sendo um dos principais fatores que determinam as propriedades de produtos à base
de óleos e gorduras (WESDORP, L. H. , 1990; GUNSTONE; HARWOOD; DIJKSTRA,
2007).
Os ácidos graxos, Figura 2.1 (b), são ácidos carboxílicos formados a partir da hidrólise
dos acilgliceróis, cujo grupo carboxila (–COOH) está ligado a uma longa cadeia alquílica. São
classificados como saturados (sem ligações duplas), monoinsaturados (com uma ligação
dupla) ou poliinsaturados (com duas ou mais ligações duplas). O ponto de fusão da maioria
dos ácidos graxos saturados tende a aumentar com o número de carbonos. Já para os ácidos
graxos insaturados o ponto de fusão tende a diminuir com o aumento do número de duplas
ligações (GUNSTONE; HARWOOD; DIJKSTRA, 2007; SATHIVEL et al., 2008). Os ácidos
graxos são usados na fabricação de diferentes produtos entre os quais se podem mencionar
cosméticos, detergentes, lubrificantes e aditivos nutricionais (ECKERT et al., 2016).
Page 25
Capítulo 2 25
Figura 2.1 Estrutura molecular genérica dos componentes graxos: (a) triacilglicerol, (b) ácido
graxo e (c) álcool graxo.
Álcoois graxos, Figura 2.1 (c), é um nome genérico usado para uma série de
hidrocarbonetos alifáticos que apresentam um grupo hidroxila (–OH). A maior parte dos
álcoois graxos são saturados, no entanto, há um número limitado de compostos
monoinsaturados, que podem ser encontrados na natureza. Os álcoois graxos são naturalmente
encontrados em óleos e gorduras vegetais ou animais e podem ser aplicados na produção de
diversos produtos utilizados como emulsificantes, surfactantes e espessantes na indústria de
alimentos e farmacêutica (DANIEL; RAJASEKHARAN, 2003; MUDGE; BELANGER;
NIELSEN, 2008).
2.2 Polimorfismo
Compostos graxos podem apresentar diferentes formas cristalinas que dão origem a
diferentes fases sólidas. Segundo a literatura as diferentes fases sólidas existentes podem ser
divididas em polimorfismo e politipismo (GARTI; SATO, 1989; KANEKO; KUBOTA,
2011).
O polimorfismo é definido como a capacidade que um composto tem de se cristalizar
em diferentes estruturas cristalinas, através de uma variedade de conformações moleculares e
formas de empacotamento de moléculas, ou seja, sólidos com a mesma composição que
apresentam estruturas geométricas diferentes. Por consequência, cada polimorfo é uma fase
cristalina distinta. Essa característica faz com que um mesmo composto graxo apresente
diferentes pontos de fusão devido às suas diferentes estruturas cristalinas. As fases polimorfas
(a) (b) (c)
Page 26
Capítulo 2 26
apresentam simetria cristalina diferente e diferentes distâncias interatômicas e interplanares
(GARTI; SATO, 1989; PATRICK; PAUL, 2002).
Politipismo é um caso especial de polimorfismo, muito estudado nos materiais
cerâmicos e metálicos, sendo causado por uma mudança na sequência de empacotamento em
camadas da parte mais longa da cadeia carbônica em uma direção particular. Essa mudança no
empacotamento das cadeias só é percebida no arranjo tridimensional das células unitárias e
ocorre apenas quando a energia de interação entre as diferentes camadas é suficientemente
fraca para que a sequência de empacotamento das cadeias seja alterada (GARTI; SATO,
1989; PATRICK; PAUL, 2002). Essa característica faz com que um mesmo composto graxo
apresente maior solubilidade e menor estabilidade (SATO; KOBAYASHI; MORISHITA,
1988).
O estudo do equilíbrio de fases em sistemas graxos é particularmente complexo uma
vez que, dependendo das condições de cristalização, os compostos podem apresentar uma
variedade de formas cristalinas atribuídas principalmente a transições polimórficas.
Propriedades do cristal como tamanho, morfologia e formas polimórficas influenciam a
textura, aparência e funcionalidade de misturas graxas (MARANGONI; NARINE, 2002;
MARANGONI; WRIGHT, 2005; MARANGONI; WESDORP, 2012; SATO; UENO, 2014).
Triacilgliceróis, ácidos graxos e álcoois graxos podem apresentar diversas formas
polimórficas. Segundo Wesdorp, (1990), as três principais formas polimórficas encontradas
em triacilgliceróis são: a forma instável alfa (), a forma metaestável beta prima () e a
forma estável beta (). Segundo Moreno et al. (2007), a nomenclatura das diferentes formas
polimórficas em ácidos carboxílicos ainda é uma questão de muita confusão devido ao
elevado número de formas cristalinas e a semelhança das suas estruturas.
A transformação de uma forma polimórfica em outra é possível com ou sem a fusão,
Figura 2.2. Todas as três formas podem ser obtidas diretamente da fase líquida, ou através de
transformações de fase, passando de uma forma polimórfica menos estável para outra mais
estável (MARANGONI; WESDORP, 2012).
Page 27
Capítulo 2 27
Figura 2.2 Possíveis transformações polimórficas em triacilgliceróis e gorduras. Figura
adaptada (MARANGONI; WESDORP, 2012).
Dependendo da taxa de resfriamento ou aquecimento a temperatura de fusão dos
triacilgliceróis tende a variar de acordo com a sua forma estrutural. A forma () possui a
menor temperatura de transição, a forma () possui uma temperatura de transição
intermediária e a forma (), por sua vez, apresenta a maior temperatura de fusão (PISKA et
al., 2006; SATO; UENO, 2011).
As diferenças nas formas polimórficas resultam em empacotamentos moleculares
diferentes. São apresentados na Figura 2.3 os principais arranjos espaciais das formas
polimórficas encontradas em triacilgliceróis. Usualmente a literatura relaciona a forma
polimórfica mais estável () com a geometria triclínica, a forma metaestável () com a
geometria ortorrômbica e a terceira forma instável () com a geometria hexagonal (SATO,
2001; MARANGONI; WESDORP, 2012). Uma das técnicas mais utilizadas para se
determinar as estruturas polimórficas é a difratometria de raios-X (LAWLER; DIMICK,
2008).
Fusão
Page 28
Capítulo 2 28
Figura 2.3 Esquema representando o arranjo espacial das formas polimórficas (), () e (),
(a) forma instável hexagonal (), (b) forma metaestável ortorrômbica (), (c) forma estável
triclínico (). Figura adaptada (MARANGONI; WESDORP, 2012).
2.3 Critério do equilíbrio de fases
De acordo com a termodinâmica clássica, o critério de equilíbrio em um sistema
heterogêneo fechado que consiste de (π) fases e (m) componentes é estabelecido quando a
temperatura (T) é a mesma em todas as fases de modo que exista um equilíbrio térmico, a
pressão (P) é a mesma em todas as fases de modo que o equilíbrio mecânico exista e o
potencial químico ( ) de cada componente seja o mesmo em todas as fases de modo que
exista o equilíbrio químico. O sobrescrito entre parênteses indica a fase e o subscrito indica o
componente. Este conjunto de equações abaixo fornece os critérios básicos do equilíbrio de
fases (PRAUSNITZ; LICHTENTHALER; AZEVEDO, 1998).
TTT ...21
(2.1)
PPP ...21 (2.2)
1
2
1
1
1 ... (2.3)
2
2
2
1
2 ... (2.4)
Page 29
Capítulo 2 29
mmm ...21 (2.5)
Para estabelecer a relação de equilíbrio é conveniente substituir o termo potencial
químico pelo termo fugacidade )( f , uma vez que esse termo é mais próximo do sentindo
físico do que o conceito abstrato de potencial químico.
O ESL é estabelecido pela igualdade das fugacidades de cada componente i na fase
líquida (L) e sólida (S) e é usualmente descrito pela Equação (2.6) ou Equação (2.7)
(PRAUSNITZ; LICHTENTHALER; AZEVEDO, 1998).
L
i
S
i ff (2.6)
ou
OS
i
OL
i
L
i
L
i
S
i
S
iOL
i
L
i
L
i
OS
i
S
i
S
if
f
x
xfxfx
(2.7)
sendo que:
S
if e L
if são fugacidades do componente i puro na fase sólida e líquida,
respectivamente;
S
ix e L
ix são frações molares do componente i na fase sólida e líquida,
respectivamente;
S
i e L
i são coeficientes de atividade do componente i na fase sólida e líquida,
respectivamente;
OS
if e OL
if são fugacidade no estado padrão do componente i na fase sólida
e líquida, respectivamente.
A relação das fugacidades no estado padrão, descrita pela Equação (2.7), pode ser
calculada pela variação da energia de Gibbs molar, descrita em mais detalhes, a seguir.
Page 30
Capítulo 2 30
2.3.1 Cálculo da relação das fugacidades de um componente puro nas fases
líquida e sólida
A relação das duas fugacidades em ambas as fases sólida e líquida na Equação (2.7)
pode ser calculada pela variação da energia de Gibbs molar por um ciclo termodinâmico
representado na Figura 2.4. O estado padrão é definido como um líquido subresfriado puro a
uma temperatura abaixo da sua própria pressão de saturação e assumindo a solubilidade
insignificante do solvente na fase sólida (PRAUSNITZ; LICHTENTHALER; AZEVEDO,
1998).
Figura 2.4 Ciclo termodinâmico para o cálculo da variação da energia de Gibbs. Figura
adaptada (PRAUSNITZ; LICHTENTHALER; AZEVEDO, 1998).
A variação da energia de Gibbs molar para o componente que percorrer o caminho de
― a ‖ para ― d ‖ daG está relacionado com a fugacidade do sólido e com a fugacidade do
líquido subresfriado no estado padrão descrita pela Equação (2.8) (PRAUSNITZ;
LICHTENTHALER; AZEVEDO, 1998).
)(
)(
lnOS
i
OL
ida
f
fRTG (2.8)
Page 31
Capítulo 2 31
Esta alteração de energia de Gibbs também está relacionada com a variação da entalpia
e entropia (Equação (2.9)). Sabendo que tanto a entalpia como a entropia são funções de
estado e independem do caminho é possível substituir o caminho da pelo caminho
alternativo dcba representado na Figura 2.4. A variação da energia de Gibbs molar
para o componente que percorrer o caminho, de ―a‖ para ―d‖ está relacionado com a
fugacidade do sólido e do líquido. Esta alteração de energia de Gibbs também está relacionada
com a correspondente mudança da entalpia na Equação (2.10) e da entropia na Equação (2.11)
(PRAUSNITZ; LICHTENTHALER; AZEVEDO, 1998).
dadada STHG (2.9)
dccbbada HHHH (2.10)
dccbbada SSSS (2.11)
A Equação (2.10) pode ser reescrita em termos do calor específico )( pc e entalpia de
fusão do ponto triplo fusão
iTriploH ),( , como na Equação (2.12) (PRAUSNITZ;
LICHTENTHALER; AZEVEDO, 1998).
T
iTriploT
p
fusão
iTriploda dTcHH),(
),( (2.12)
sendo que a variação do calor específico é S
p
L
pp ccc , e que )( L
pc e )( S
pc são os calores
específicos do líquido e do sólido, respectivamente, e (T (triplo,i)) a temperatura no ponto triplo.
Similarmente, reescrevendo a Equação (2.11), tem-se a Equação (2.13) (PRAUSNITZ;
LICHTENTHALER; AZEVEDO, 1998).
Page 32
Capítulo 2 32
T
)i,Triplo(T
pfusão
)i,Triplo(da dTT
cSS (2.13)
No ponto triplo, a entropia de fusão é dada pela Equação (2.14).
),(
),(
),(
iTriplo
fusão
iTriplofusão
iTriploT
HS
(2.14)
Substituindo as Equações (2.9), (2.12), (2.13) e (2.14) na Equação (2.8) e assumindo
que )( pc é constante sobre uma faixa de temperatura de )i ,(triploTT , a relação das
fugacidades de um componente puros nas fases líquida e sólida é descrito pela Equação
(2.15), que relaciona a propriedade termodinâmica do composto puro com as não idealidades
das fases em equilíbrio e a composição dessas fases pode ser escrita por cada componente
presente no equilíbrio (PRAUSNITZ; LICHTENTHALER; AZEVEDO, 1998).
Tln11lnln
),(),(),(
),(
),(
)(
)(iTriplopiTriplopiTriplo
iTriplo
fusão
iTriplo
L
i
L
i
S
i
S
i
OS
i
OL
iT
R
c
T
T
R
c
T
T
RT
H
x
x
f
f
(2.15)
Normalmente, são feitas duas simplificações na Equação (2.15). Na primeira supõe-se
que a temperatura do ponto triplo e a entalpia de fusão na temperatura do ponto triplo se
aproximam bastante da temperatura normal de fusão e da entalpia de fusão nessa temperatura,
respectivamente; e, portanto, as diferenças entre essas duas temperaturas e entre as duas
entalpias, para a maioria das substâncias, são pequenas, podendo-se então substituir a
temperatura do ponto triplo pela temperatura normal de fusão do componente e a entalpia de
fusão na temperatura do ponto triplo pela entalpia de fusão na temperatura normal de fusão. A
segunda simplificação vem da diferença de magnitude entre os três termos apresentados do
lado direito da equação. O primeiro termo é significativamente maior que os demais, além
disso, os dois termos restantes tendem a se cancelar especialmente quando a temperatura de
fusão (T) é próxima da temperatura do ponto triplo. Assim é possível considerar somente os
termos que contêm a entalpia de fusão )( )i fusão,(H e desconsiderar os demais. Assume-se
Page 33
Capítulo 2 33
também que a diferença entre os calores específicos do líquido e sólido )( pc é independente
da temperatura e que não existe transição na fase sólida. Essas simplificações geram uma
diferença desprezível no resultado final. Assumindo a primeira simplificação e considerando
que não há transições na fase sólida, obtêm-se a Equação (2.16) (PRAUSNITZ;
LICHTENTHALER; AZEVEDO, 1998).
Tln11ln
i)fusão,()i fusão,()i fusão,(
)i fusão,(
)i fusão,( T
R
c
T
T
R
c
T
T
RT
H
x
x pp
L
i
L
i
S
i
S
i
(2.16)
Para as substâncias que sofrem transições na fase sólida, ou seja, mudança de uma
estrutura cristalina para outra quando a temperatura de interesse é menor do que a temperatura
de fusão, a Equação (2.16) deve ser modificada como já discutido por Preston et al. (1971) e
Choi e Mclaughlin (1983), resultando na Equação (2.17).
1
Tln11ln
i)fusão,()i fusão,()itrans,(
)itrans,(
)itrans,()i fusão,(
)i fusão,(
)i fusão,( T
T
T
R
c
T
T
RT
H
T
T
RT
H
x
x p
L
i
L
i
S
i
S
i
(2.17)
Sendo que T(trans,i) e ΔH(trans,i) são, respectivamente, a temperatura de transição e a
entalpia de transição do componente i puro na fase sólida.
Para as misturas que não sofrem transições na fase sólida e que cada composto se
cristaliza como um sólido puro, a atividade do componente i na fase sólida no equilíbrio,
representada por S
i
S
ix , pode ser substituída pela atividade do sólido puro S
i
S
ix =1. Portanto,
se para essas misturas ainda o termo contendo a diferença entre os calores específicos do
líquido e sólido )( pc for desprezível, a Equação (2.17) é simplificada na Equação (2.18) para
a descrição da linha liquidus do equilíbrio sólido-líquido (SLAUGHTER; DOHERTY, 1995;
PRAUSNITZ; LICHTENTHALER; AZEVEDO, 1998; BOROS, 2005).
1
1ln
)i fusão,(
)i fusão,(
)i fusão,(
T
T
RT
H
x L
i
L
i (2.18)
Page 34
Capítulo 2 34
2.4 Modelos termodinâmicos para o cálculo do coeficiente de atividade da
fase líquida
O desvio do comportamento ideal surge devido às interações entre diferentes
moléculas que são relacionadas com a energia de Gibbs molar em excesso Eg , que depende
basicamente da composição da mistura, temperatura e em menor proporção da pressão
(PRAUSNITZ; LICHTENTHALER; AZEVEDO, 1998; BOEKEL, 2008). Na obtenção da
equação do coeficiente de atividade é necessário partir da definição da energia de Gibbs
parcial molar em excesso E
ig , Equação (2.19) (PRAUSNITZ; LICHTENTHALER;
AZEVEDO, 1998; SMITH; VAN NESS; ABBOTT, 2000).
in,P,Ti
E
TE
ii
j
n
gngγlnRT
(2.19)
Sendo que Tn é o número de moles totais da mistura e in é o número de moles do
componente (i) na mistura e o i é o coeficiente de atividade do componente (i).
Existem diversos modelos termodinâmicos para o cálculo do coeficiente de atividade
disponíveis na literatura. Os modelos moleculares de Margules de 2 e 3 sufixos ( REID;
PRAUSNITZ; POULING, 1987) e NRTL (RENON, PRAUSNITZ, 1968), e os modelos
preditivos UNIFAC (FREDENSLUND; JONES; PRAUSNITZ, 1975) e UNIFAC Dortmund
(WEIDLICH; GMEHLING, 1987) foram utilizados na maioria dos estudos publicados no
grupo de pesquisa do laboratório de Extração, Termodinâmica Aplicada e Equilíbrio
(EXTRAE/FEA/UNICAMP) (COSTA et al., 2007; BOROS et al., 2009; COSTA et al.,
2010a; CARARETO et al., 2011; COSTA et al., 2011a; COSTA et al., 2011b; COSTA et al.,
2012; MAXIMO; COSTA; MEIRELLES, 2013; CARARETO et al., 2014; MAXIMO et al.,
2014a; MAXIMO et al., 2014b). Através desses estudos conclui-se que os modelos
moleculares de Margules de 2 e 3 sufixos e NRTL com os parâmetros ajustados aos dados
experimentais descreveram melhor o equilíbrio sólido-líquido. Diante disso, os modelos
Page 35
Capítulo 2 35
moleculares foram utilizados no cálculo do coeficiente de atividade das misturas estudadas
nesse trabalho. A seguir serão discutidos os modelos utilizados.
2.4.1 Modelo de Margules
A equação de Margules é um modelo empírico que foi desenvolvido para estimar o
coeficiente de atividade expressando através da Equação (2.20) a energia de Gibbs molar em
excesso.
ji
Exx.Ag (2.20)
Substituindo a Equação (2.20) na Equação (2.19) obtém-se a expressão para o
coeficiente de atividade mais conhecida como modelo de Margules de 2 sufixos, Equação
(2.21) com um parâmetro. Essa equação é usualmente utilizada para representar a fase líquida
e representa bem o desvio da idealidade de misturas líquidas simples, isto é, misturas de
moléculas de tamanhos, formas e naturezas químicas similares (SANDLER, 2006).
2
ji AxγlnRT ou 2
ij AxγlnRT (2.21)
O valor do parâmetro A depende das propriedades macroscópicas e moleculares de
ambas as espécies na mistura binária, seu valor pode ser positivo ou negativo e é geralmente
uma função da temperatura (SANDLER, 2006).
Para sistemas mais complicados, especialmente para misturas de moléculas diferentes,
uma possível generalização da Equação (2.20), pode ser escrita através da expansão Redlich-
Kister, Equação (2.22) (PRAUSNITZ; LICHTENTHALER; AZEVEDO, 1998).
...])xx(D)xx(C)xx(BA[xxg 3
21
2
212121
E (2.22)
Page 36
Capítulo 2 36
Sendo que A, B, C e D são os parâmetros dependentes da temperatura que devem ser
ajustados aos dados experimentais. O número de parâmetros que devem ser utilizados para
representar os dados experimentais depende da complexidade molecular da mistura
(PRAUSNITZ; LICHTENTHALER; AZEVEDO, 1998). Para o caso onde os parâmetros A e
B são diferentes de zero, mas os parâmetros C e D são iguais à zero, os coeficientes de
atividade dos compostos em uma mistura binária são expressos sob a forma da Equação (2.23)
conhecida como equação de Margules de 3 sufixos, com dois parâmetros A e B (SANDLER,
2006).
3
2
2
21 Bx4x)B3A(γlnRT ou 3
1
2
12 Bx4x)B3A(γlnRT (2.23)
As Equações (2.24 - 2.26) mostram as equações de Margules de 2 sufixos expandida
para um sistema ternário como descrita por Reid, Prausnitz e Pouling (1987).
32231312
2
313
2
2121 xx)AAA(xAxAγlnRT (2.24)
31132312
2
323
2
1122 xx)AAA(xAxAγlnRT (2.25)
21122313
2
223
2
1133 xx)AAA(xAxAγlnRT (2.26)
2.4.2 Modelo NRTL
Para misturas não ideais, o modelo NRTL (non-random, two-liquid) desenvolvido por
Renon e Prausnitz (1968), que se baseia no conceito de composição local e pode ser aplicado
tanto a sistemas parcialmente miscíveis quanto aos totalmente miscíveis, foi utilizado para
representar a fase líquida das misturas estudadas. Para uma mistura binária ele é representado
pelas Equações (2.27), (2.28) e (2.29) (PRAUSNITZ; LICHTENTHALER; AZEVEDO,
1998).
1212
1212
2121
212121
E
Gxx
G.τ
Gxx
Gτxx
RT
g (2.27)
Page 37
Capítulo 2 37
onde: RT
ggτ 2212
12
RT
ggτ 1121
21
(2.28)
)ταexp(G 121212 )ταexp(G 212121 (2.29)
O parâmetro ijg
é um parâmetro de energia característico da interação i-j. O
parâmetro ij está relacionado a não aleatoriedade da mistura, sendo que, para o caso em
que é igual à zero, o sistema é totalmente aleatório e o modelo se reduz à equação de
Margules de 2 sufixos. O modelo NRTL contém três parâmetros para uma mistura binária.
Um grande número de dados experimentais de sistemas binários indica que o valor de ij
varia na faixa de 0,20 a 0,47, sendo frequentemente utilizado o valor de 0,3 (PRAUSNITZ;
LICHTENTHALER; AZEVEDO, 1998).
Os coeficientes de atividade estão apresentados nas Equações (2.30) e (2.31)
(PRAUSNITZ; LICHTENTHALER; AZEVEDO, 1998).
2
2
2.
lnijij
ijij
jiji
ji
jijiGxx
G
Gxx
Gx
(2.30)
2
2
2.
lnjiji
jiji
ijij
ij
ijijGxx
G
Gxx
Gx
(2.31)
Para sistemas moderadamente não ideais o modelo NRTL não oferece vantagem sobre
a Equação de Margules de 3 sufixos. Já para misturas fortemente não ideais, em especial
sistemas parcialmente miscíveis, esse modelo frequentemente propicia uma boa representação
dos dados experimentais (PRAUSNITZ; LICHTENTHALER; AZEVEDO, 1998).
Page 38
Capítulo 2 38
2.5 Diagrama de fases do equilíbrio sólido–líquido
O comportamento do equilíbrio de fases é usualmente representado por meio do
diagrama de fases. Diagrama de fases é uma representação gráfica do estado físico de uma ou
mais substâncias em diferentes condições de temperatura ou pressão em função da
composição, utilizado para representar o número de fases que ocorrem em equilíbrio sendo
muito útil no entendimento dos efeitos de mudanças de estado da matéria para a formulação
de produtos, uma vez que permite definir não apenas uma faixa de composição aceitável, mas
também aperfeiçoar a ordem de adição de diferentes matérias-primas. As principais transições
encontradas em misturas graxas representadas através de diagramas de fases conforme
nomeou a literatura são: eutéticos e peritéticos, podendo esses sistemas formar ou não solução
sólida nas extremidades ou em toda extensão do diagrama de fases (PRAUSNITZ;
LICHTENTHALER; AZEVEDO, 1998; SATO, 2001; HUMPHREY; SURESH, 2004).
Os componentes de uma mistura quando em ESL, podem apresentar diversos
comportamentos gerando alguns tipos de sistemas, cada qual com uma característica própria
(COSTA, 2008). A classificação destes sistemas depende: do número de componentes, das
propriedades e miscibilidades desses componentes. As combinações possíveis aumentam em
número e complexidade, de acordo com o número de componentes do sistema Nyvlt (1977).
A tabela 2.1 apresenta as diferentes classificações para sistemas binários e ternários em
equilíbrio sólido-líquido.
Page 39
Capítulo 2 39
Tabela 2.1 Classificação para sistemas binários em equilíbrio sólido-líquido.
Número de
componentes Classificação Grupo Propriedades
2
I
Componentes imiscíveis na fase sólida.
a Componentes não formam um composto
estequiométrico.
a1 Componentes completamente miscíveis na fase
líquida.
a2 Componentes parcialmente miscíveis na fase líquida.
a3 Componentes imiscíveis na fase líquida.
b Componentes formam um composto estequiométrico.
b1 Composto estável até o seu ponto de fusão.
b2 Composto instável no seu ponto de fusão.
II
Componentes completamente miscíveis na fase
sólida.
a Componentes não formam um composto sólido
a1 Curva de fusão sem um máximo ou mínimo.
a2 Curva de fusão exibe um máximo ou mínimo.
b Componentes formam um composto sólido.
III
Componentes parcialmente miscíveis na fase sólida.
a Componentes possuem pontos de fusão próximos.
b Componentes possuem pontos de fusão distantes.
3
I
Componentes imiscíveis na fase sólida.
a Componentes que não formam um composto
estequiométrico.
b Componentes formam um composto estequiométrico.
b1 Compostos formando sistemas binários
b2 Compostos formando sistemas ternários
II
Componentes miscíveis na fase sólida.
a Componentes completamente miscíveis na fase
sólida.
b Componentes parcialmente miscíveis na fase sólida.
Fonte: Solid-liquid phase equilibria, NÝVLT (1977).
Os sistemas binários, nos quais os pontos de fusão das misturas se encontram abaixo
do ponto de fusão dos componentes puros são chamados sistemas eutéticos. Os sistemas
eutéticos são aqueles cujos componentes diferem no que diz respeito ao volume molecular,
forma polimórfica e não têm uma diferença drástica de ponto de fusão. É apresentado na
Figura 2.5 (a) o exemplo de um sistema binário com mistura eutética simples sem formação
de transição sólida categoria 2Ia1, Tabela 2.1 e na Figura 2.5 (b), um sistema com solubilidade
parcial formando uma solução sólida, categoria 2III-a, Tabela 2.1 (NYVLT, 1977;
WESDORP, L. H., 1990; HUMPHREY; SURESH, 2004; GAMSJAGER et al., 2008).
Page 40
Capítulo 2 40
No diagrama de fases da Figura 2.5 (a) e 2.5 (b) a linha Liquidus e a linha Solidus
delimitam as transições de fases, ou seja, são linhas de separações entre as diferentes regiões
do diagrama. A linha Liquidus é a linha de separação entre a região líquida do diagrama e a
região de mistura líquida + sólida. Acima desta linha apenas líquido pode existir. A linha
horizontal Solidus é a linha de separação entre a região sólida do diagrama e a região de
mistura líquida + sólida. Abaixo desta linha apenas sólido pode existir. O ponto eutético (e),
onde as linhas Liquidus e Solidus se encontram é definida como sendo o ponto no qual os dois
compostos A e B, na forma sólida, estão em equilíbrio com uma solução líquida de
composição específica (xe), ou seja, neste único ponto do diagrama é possível observar três
fases, que são a fase líquida e duas fases sólidas para uma mistura binária referentes ao
componente A e componente B (SMITH; VAN NESS; ABBOTT, 2000; COSTA, 2008).
Figura 2.5 Diagrama de fases de um sistema teórico eutético: (a) Sistema eutético simples, (b)
Sistema com solubilidade parcial na fase sólida. Figura adaptada (ARONS; LOOS, 1994;
HUMPHREY; SURESH, 2004).
Em sistemas binários, nos quais os dois componentes A e B formam uma segunda fase
sólida ou um composto intermediário C com proporção estequiométrica em relação aos
compostos puros através de uma reação química ou associação física entre as moléculas, é
chamada de reação peritética (SLAUGHTER; DOHERTY, 1995). A reação peritética é uma
reação isotérmica reversível entre duas fases, uma líquida e uma sólida, que forma no
resfriamento de um sistema binário, ternário ou de maior ordem uma, duas, ... (n-1, onde n é o
número de componentes) novas fases sólidas (GAMSJAGER et al., 2008).
Page 41
Capítulo 2 41
É apresentado na Figura 2.6 o diagrama de fases de um sistema peritético, categoria
2I-b1, Tabela 2.1. O ponto peritético (p) é definido pela composição e pela temperatura
peritética (Tp) que garantem que a sua composição se encontra entre as composições da fase
líquida e da fase sólida (HUMPHREY; SURESH, 2004).
Figura 2.6 Diagrama de fase de mistura binária para um sistema teórico peritético. Figura
adaptada (HUMPHREY; SURESH, 2004).
É apresentado na Figura 2.7 (a) um diagrama de fases ternário tridimensional. O
mesmo diagrama em projeção é apresentado na Figura 2.7 (b). Neste caso a composição é
medida ao longo dos lados da base do triângulo. A parte superior da figura mostra uma
superfície com linhas de contorno representando as temperaturas (NELSON, 2011).
Tem
pera
tura
(K
)
TA
TB
Linha Liquidus
Região líquida
Região sólido C +
sólido A
A B
Região
líquida +
sólido Bp
eTp
xp
Região
sólido C +
sólido B
Região
líquida +
sólido C
Região
líquida +
sólido A
Page 42
Capítulo 2 42
Figura 2.7 Representação de um sistema ternário: (a) Sistema ternário tridimensional
hipotético, (b) representação de um sistema ternário triangular. Figura adaptada (NELSON,
2011).
Na Figura 2.8 é apresentado um diagrama de fases ternário com reação peritética e
eutética. As relações binárias dos componentes A─B são mostrados esquematicamente, com
as setas que indicam as projeções dos pontos eutéticos e peritético para a base do triângulo.
As relações dos componentes A─B─C representam projeções das relações liquidus no espaço
ternário. Neste diagrama é possível ver a linha (p ─p´) que representa a reação na qual a
composição do composto B reage com a fase líquida para formar uma fase incongruente B´. O
ponto (p´) é um ponto peritético do sistema ternário e está a uma temperatura maior em
relação ao ponto eutético (e) na composição ternária (GANGULY, 2007).
Figura 2.8 Representação de um sistema ternário triangular com projeção binária. Figura
adaptada (GANGULY, 2007).
A
C
BPonto eutético
da mistura
binário
B+ C.
Ponto eutético
da mistura
ternário
A+B+C.
Ponto eutético
da mistura
binário A+C.
A
B
C
e
Região
sólido B + líquido
Região
sólido A + líquido
Região
sólido C + líquido
Ponto eutético da
mistura ternária
(a) (b)
e
Page 43
Capítulo 2 43
2.6 Análise térmica e calorimetria
Segundo a International Confederation for Thermal Analysis and Calorimetry
(ICTAC), a International Union of Pure and Applied Chemistry (IUPAC) e a American
Society for Testing and Materials (ASTM) ―Análise Térmica é um termo que abrange um
grupo de técnicas nas quais uma propriedade física ou química de uma substância, ou de seus
produtos de reação, é monitorada em função do tempo ou temperatura, enquanto a
temperatura da amostra, sob uma atmosfera específica, é submetida a uma programação
controlada‖.
2.6.1 Calorimetria Exploratória Diferencial (DSC)
Calorimetria Exploratória Diferencial (Differential Scanning Calorimetry - DSC) é
definida como uma análise na qual a medida da taxa de fluxo de calor para uma amostra é
descrita em função da temperatura ou do tempo. Tanto a amostra e a referência são mantidas a
uma mesma taxa de fluxo de calor ao longo de toda análise, à medida que a amostra sofre
alguma reação, seja ela endotérmica ou exotérmica, ocasionada pelo aumento de temperatura,
gera-se uma diferença de temperatura entre a amostra e a referência, e consequentemente uma
diferença na taxa de fluxo de calor (HÖHNE; HEMMINGER; FLAMMERSHEIM, 2003).
Uma amostra de massa conhecida é aquecida ou resfriada e as mudanças na sua
capacidade calorífica são rastreadas através da mudança no fluxo de calor. Através desta
técnica é possível acompanhar os eventos térmicos associados às alterações físicas ou
químicas da amostra, tais como transições de fase (fusão, ebulição, sublimação,
congelamento, inversões de estruturas cristalinas) ou reações de desidratação, de dissociação,
de decomposição, de óxido-redução, entre outras, capazes de causar variações de temperatura
entre a amostra e a referência (HEMMINGER; SARGE, 1998). A técnica fornece medidas
qualitativas e quantitativas sobre as mudanças físicas e químicas que envolvem processos
endotérmicos ou exotérmicos. Os eventos endotérmicos e exotérmicos são representados por
um desvio da linha base na curva térmica diferencial (HÖHNE; HEMMINGER;
FLAMMERSEIM, 2003). De maneira geral, transição de fase, fusão, desidratação, redução e
algumas reações de decomposição produzem efeitos endotérmicos, enquanto a cristalização,
oxidação e algumas reações de decomposição produzem efeitos exotérmicos (BROWN;
Page 44
Capítulo 2 44
GALLAGHER, 2008). Tal técnica foi utilizada por diversos autores no estudo do equilíbrio
sólido-líquido de misturas graxas (BOROS et al., 2009; DOMAŃSKA; MORAWSKI;
PIEKARSKA, 2009; COSTA et al., 2012; MAXIMO; COSTA; MEIRELLES, 2013;
CARARETO et al., 2014).
O DSC consiste de três componentes principais: o primeiro é o módulo que inclui a
base e a célula, o segundo é o controlador (software de análise de dados) e o terceiro é o
acessório de resfriamento. Existem dois tipos de equipamentos que são chamados de
Calorímetros Exploratórios Diferenciais, o DSC de compensação de potência e o DSC de
fluxo de calor. O DSC de compensação de potência, técnica utilizada neste trabalho, será
descrita em mais detalhes, a seguir.
A calorimetria exploratória diferencial é uma técnica amplamente utilizada no estudo
do ESL de componentes graxos. Através dessa técnica é possível determinar as temperaturas
envolvidas em cada evento térmico (SOLÍS; DURÁN, 2003). Além disso, é uma técnica na
qual se emprega pequena quantidade de amostra (0,1-20 mg) e tem tempo relativamente curto
de análise (AFAF; JAN, 2005) embora exista grande complexidade na análise dos eventos
térmicos representados em na curva térmica diferencial devido a sobreposição desses.
Os resultados encontrados através da técnica DSC não são medidas absolutas, pois o
fluxo de calor é medida dinamicamente, ou seja, os experimentos não são realizados em um
equilíbrio térmico, portanto os resultados obtidos devem ser relacionados com os valores
termodinâmicos absolutos através da calibração do equipamento. Consequentemente, os
resultados são influenciados pelo fluxo de calor entre outros fatores (GMELIN; SARGE,
1995).
Em um calorímetro de compensação de potência, a amostra e a referência são
dispostas em dois pequenos fornos, sendo que cada um tem uma unidade de aquecimento e
um sensor de temperatura (BROWN; GALLAGHER, 2008). A amostra e a referência estão
em condições isotérmicas, ou seja: a temperatura da amostra é igual à temperatura da
referência, o que é possível pelo uso de aquecedores individuais. Cada variação de
temperatura entre a amostra e a referência que ocorrer devido a algum evento térmico da
amostra deve ser compensada por uma mudança correspondente na unidade de aquecimento
de modo a anular esta diferença (HÖHNE; HEMMINGER; FLAMMERSEIM, 2003).
Page 45
Capítulo 2 45
2.6.2 Descrição dos principais eventos térmicos em uma curva térmica
diferencial
A Figura 2.9 apresenta os principais termos e eventos térmicos envolvidos nas curvas
térmicas diferenciais.
Figura 2.9 Principais eventos térmicos em uma Curva Térmica Diferencial. Temperatura
inicial do evento térmico (TI), Temperatura final do evento térmico (TF), Temperatura máxima
de pico (TP), Temperatura onset (TO).
Como mencionado anteriormente, os eventos térmicos que ocorrem em uma amostra
são representados como desvios da linha base. Diante disso é necessário saber identificar os
termos e os principais eventos térmicos em uma curva térmica diferencial.
Dentre os principais eventos térmicos envolvidos em uma curva térmica diferencial
podem-se citar:
A transição vítrea é a transição reversível em materiais amorfos (ou em regiões
amorfas de materiais semi-cristalinos) entre um estado sólido e um estado de
alta viscosidade sem sofrer fusão. Essa transição dá origem a um
comportamento de elasticidade na amostra. Exemplos de substâncias amorfas
que sofrem transição vítrea no seu processo de produção são alguns polímeros,
Page 46
Capítulo 2 46
vidros, borrachas e carboidratos (YAMAKI; PEDROSO; ATVARS, 2002;
CHUNG; LEE, LIM, 2002);
A cristalização é um processo natural ou artificial de formação de cristais
sólidos de uma solução homogênea. O processo de cristalização envolve as
etapas de nucleação e crescimento de cristais (GUIMARÃES; ZANOTTO,
2003);
Fusão é o nome dado ao processo de transição de fase de uma substância no
estado sólido para o estado líquido. A fusão é uma das transições mais
comumente medidas em um DSC e aparece como um desvio da linha base;
A decomposição de uma substância causada pelo calor denomina-se
decomposição térmica;
A temperatura inicial do evento térmico (TI) é onde a curva térmica começa a
desviar-se da linha base, ou seja, início do pico.
A temperatura final do evento térmico (TF) é quando a curva volta ao seu
estado inicial (linha base);
A temperatura onset (TO) é o ponto onde ocorre a intersecção da tangente da
linha de pico com a extrapolação da linha base;
A temperatura máxima de pico (TP) corresponde ao valor máximo de
temperatura medida no evento térmico.
2.7 Equilíbrio sólido-líquido envolvendo compostos graxos
Nesse tópico é descrito o estado da arte dos principais trabalhos na área de equilíbrio
sólido-líquido, utilizando misturas de compostos graxos, através da técnica de DSC.
Vários artigos vêm sendo publicados na literatura com a finalidade de destacar a
importância do estudo do equilíbrio sólido-líquido envolvendo componentes graxos, dentre
eles, pode-se citar alguns trabalhos publicados no grupo de pesquisa do laboratório de
Extração, Termodinâmica Aplicada e Equilíbrio (EXTRAE/FEA/UNICAMP). Costa, et al.
(2007) investigaram o equilíbrio sólido-líquido de sete misturas binárias de ácidos graxos
saturados (ácido cáprico + ácido láurico, ácido cáprico + ácido mirístico, ácido cáprico +
ácido palmitíco, ácido cáprico + ácido esteárico, ácido láurico + ácido mirístico, ácido láurico
Page 47
Capítulo 2 47
+ ácido palmítico, ácido láurico + ácido esteárico), os quais apresentaram ponto eutético e
peritético. Carareto et al. (2014b) estudaram o comportamento de cinco misturas binárias de
álcoois graxos (1-octanol + 1-dodecanol, 1-octanol + 1-tetradecanol, 1-decanol + 1-
tetradecanol, 1-decanol + 1-hexadecanol, 1-dodecanol + 1-octadecanol), os quais
apresentaram ponto eutético com ocorrência de solução sólida no diagrama de fases, na região
rica em álcool graxo de maior cadeia carbônica. Costa et al. (2011b) analisaram o
comportamento de duas misturas binária de triacilgliceróis (triestearina + tripalmitina,
tripalmitina + trioleina) e três misturas de triacilgliceróis com ácidos graxos (triestearina +
ácido palmítico, triestearina + ácido linoleico, tripalmitina + ácido oleico comercial), os quais
apresentaram ponto eutético. E por último, Maximo et al. (2013), estudaram o comportamento
de sistemas binários composto de triacilglicerol com álcoois graxos (trioleina + 1-
hexadecanol e trioleina + 1-octadecanol), os quais apresentaram três transições, a temperatura
de fusão, a transição sólido-líquido relacionada com a fusão de trioleina ou de uma mistura
eutética rica em trioleina e uma transição sólido-sólido relacionada com polimorfo beta da
trioleina. Todos esses trabalhos usaram a calorimetria exploratória diferencial (DSC) na
determinação do equilíbrio sólido-líquido (ESL) e tiveram como objetivo principal conhecer o
comportamento das transições de fases ocasionadas pelo efeito da temperatura.
Todos os sistemas graxos constituídos por triacilgliceróis com ácidos graxos,
triacilgliceróis com álcoois graxos e misturas de triacilgliceróis estudados pelo grupo de
pesquisa utilizando a técnica de DSC, juntamente com os desse trabalho são apresentados na
Tabela 2.2. Esse trabalho contribui para o entendimento do comportamento do equilíbrio
sólido-líquido de misturas graxas complexas, uma vez que os resultados experimentais e os
parâmetros dos modelos termodinâmicos ajustados podem ser utilizados no cálculo de
propriedades termodinâmicas de misturas multicomponentes, importantes para o
desenvolvimento de produtos e processos.
Na literatura, além dos trabalhos citados acima, muitos outros podem ser encontrados.
O trabalho de Wesdorp (1990) teve como objetivo desenvolver uma metodologia para
calcular a temperatura de fusão e a composição da fase sólida de triacilgliceróis. Como
resultado, esse trabalho conseguiu descrever o comportamento de diversas misturas binárias
de triacilgliceróis nas três principais formas polimórficas descritas anteriormente. Na mesma
linha de estudo, o trabalho de Won (1993) teve como objetivo desenvolver uma metodologia
para predizer as temperaturas de fusão e de solidificação e as composições de equilíbrio das
fases sólida e líquida nas diferentes formas polimórficas. Cedeño et al. (2001) mediram a
Page 48
Capítulo 2 48
temperatura de fusão e a entalpia de fusão de alguns ácidos graxos puros e de misturas
binárias e ternárias a fim de conhecer o comportamento dos compostos estudados. Zhang et
al. (2001) desenvolveram um estudo com o objetivo de descrever o comportamento das
transições de fases no equilíbrio sólido-líquido de misturas binárias de ácidos graxos.
Gandolfo et al. (2003) estudaram o comportamento do equilíbrio sólido-líquido de misturas
binárias de álcoois e ácidos graxos. Inoue et al. (2004) estudaram o comportamento de
misturas de ácidos graxos com o objetivo de entender melhor o equilíbrio sólido-líquido.
Nishimura et al. (2011) tiveram como objetivo determinar as propriedades de cristalização de
várias misturas binárias de ácidos graxos. Pesquisas de processos de cristalização de gorduras
e lipídios são revisadas por Sato e Ueno (2011), com ênfase nas propriedades cinéticas de
cristalização das diferentes fases sólidas dos sistemas puros e misturas. Tais revisões sugerem
que estudos mais aprofundados devem ser realizados para o perfeito entendimento do
processo de cristalização.
Apesar do grande interesse da comunidade científica no assunto que já trabalhou
muito na determinação de dados de equilíbrio sólido-líquido de compostos graxos, como
apresentado nas tabelas do ANEXO A e no artigo de Maximo et al. (2014), pode-se concluir
que ainda há algumas lacunas a serem preenchidas em relação aos dados de equilíbrio sólido-
líquido desses sistemas, por exemplo:
Misturas binárias e ternárias de triacilgliceróis, triacilgliceróis com ácidos graxos e
triacilgliceróis com álcoois graxos, a fim de estudar a natureza química dos
componentes no comportamento das fases líquida e sólida;
Misturas de compostos minoritários e de acilgliceróis parciais com triacilglicerol, a
fim de descrever a influência desses compostos no diagrama de fases verificando
assim a solubilidade e a cristalização dos mesmos;
Misturas de ésteres etílicos ou metílicos com ácidos graxos, álcoois graxos ou
triacilgliceróis para entendimento do comportamento de fases nas propriedades de
biodiesel.
Page 49
Capítulo 2 49
Tabela 2.2 Sistemas graxos estudados pelo grupo de pesquisa no laboratório EXTRAE,
utilizando a técnica de DSC.
Sistemas Referência
Triacilgliceróis + ácidos graxos
Trioleina + ácido cáprico Esse trabalho
Trioleina + ácido láurico Esse trabalho
Trioleina + ácido mirístico Esse trabalho
Trilaurina + ácido mirístico Esse trabalho
Trilaurina + ácido palmítico Esse trabalho
Trilaurina + ácido esteárico Esse trabalho
Trimiristina + ácido cáprico Esse trabalho
Trimiristina + ácido láurico Esse trabalho
Trimiristina + ácido esteárico Esse trabalho
Tricaprilina + ácido mirístico (COSTA et al., 2010b)
Tripalmitina + ácido oleico comercial (COSTA et al., 2011b)
Triestearina + ácido palmítico (COSTA et al., 2011b)
Triestearina + ácido linoleico (COSTA et al., 2011b)
Trioleina + ácido palmitíco (COSTA et al., 2011b)
Trilinolenina + ácido esteárico (COSTA et al., 2011b)
(COSTA et al., 2011b)
Triacilgliceróis + ácidos graxos Trioleina + 1-decanol Esse trabalho
Trioleina +1-dodecanol Esse trabalho
Trioleina + 1-tetradecanol Esse trabalho
Trilaurina + 1-tetradecanol Esse trabalho
Trilaurina + 1-hexadecanol Esse trabalho
Trilaurina + 1-octadecanol Esse trabalho
Trimiristina +1-dodecanol Esse trabalho
Trimiristina +1-tetradecanol Esse trabalho
Trilaurina + 1-hexadecanol (MAXIMO; COSTA; MEIRELLES, 2014)
Trilaurina + 1-octadecanol (MAXIMO; COSTA; MEIRELLES, 2014)
Trimiristina + 1-octadecanol (MAXIMO; COSTA; MEIRELLES, 2014)
Trimiristina + 1-octadecanol (MAXIMO; COSTA; MEIRELLES, 2014)
Tripalmitina + 1-hexadecanol (MAXIMO; COSTA; MEIRELLES, 2014)
Tripalmitina + 1-octadecanol (MAXIMO; COSTA; MEIRELLES, 2014)
Trioleina + 1-hexadecanol (MAXIMO; COSTA; MEIRELLES, 2013)
Trioleina + 1-octadecanol (MAXIMO; COSTA; MEIRELLES, 2013)
Triacilgliceróis + Triacilgliceróis
Tripalmitina + triestearina Esse trabalho
Tripalmitina + tribehenina Esse trabalho
Triestearina + tribehenina Esse trabalho
Tripalmitina + triestearina (COSTA et al., 2011b)
Tripalmitina + Trioleina (COSTA et al., 2011b)
Tripalmitina + triestearina + tribehenina Esse trabalho
Page 50
Capítulo 2 50
Referências bibliográficas
AFAF, K. E.; JAN, P. Lipid Oxidation Products and Methods Used for Their Analysis. In:
(Ed.). Analysis of Lipid Oxidation: AOCS Publishing, 2005.
ARONS, J. D. S.; LOOS, T. W. D. Phase Behavior: Phenomena, Significance, and Models.
In: SANDLER, S. I. (Ed.). Models for thermodynamic and phase equilibria calculations. .
New York: Marcel Dekker, 1994. p.363-505.
BOEKEL, M. A. J. S. V. Some Thermodynamic Activity Coefficient Models. In: (Ed.).
Kinetic Modeling of Reactions In Foods: CRC Press, 2008. (Food Science and
Technology).
BOROS, L. et al. Crystallization Behavior of Mixtures of Fatty Acid Ethyl Esters with Ethyl
Stearate. Energy & Fuels, v. 23, p. 4625-4629. 2009.
BOROS, L. A. D. Modelagem matemática e termodinâmica do equilíbrio sólidolíquido
de sistemas graxos. 2005. (Dissertação). Faculdade de Engenharia Química, Universidade
Estadual de Campinas, Campinas.
BROWN, M. E.; GALLAGHER, P. K. Chapter 1 Introduction to recent advances, techniques
and applications of thermal analysis and calorimetry. In: MICHAEL, E. B. e PATRICK, K.
G. (Ed.). Handbook of Thermal Analysis and Calorimetry: Elsevier Science B.V.,
v.Volume 5, 2008. p.1-12.
CARARETO, N. D. D.; CASTAGNARO, T.; COSTA, M. C.; MEIRELLES, A. J. A. The
binary (solid + liquid) phase diagrams of (caprylic or capric acid) + (1-octanol or 1-decanol).
The Journal of Chemical Thermodynamics, v. 78, p. 99-108. 2014a.
CARARETO, N. D. D.; COSTA, M. C.; ROLEMBERG, M. P.; KRÄHENBÜHL, M. A.;
MEIRELLES, A. J. A. The solid–liquid phase diagrams of binary mixtures of even saturated
fatty alcohols. Fluid Phase Equilibria, v. 303, n. 2, p. 191.e1-191.e8. 2011.
CARARETO, N. D. D.; DOS SANTOS, A. O.; ROLEMBERG, M. P.; CARDOSO, L. P.;
COSTA, M. C.; MEIRELLES, A. J. A. On the solid–liquid phase diagrams of binary mixtures
of even saturated fatty alcohols: Systems exhibiting peritectic reaction. Thermochimica
Acta, v. 589, n. 0, p. 137-147. 2014b.
Page 51
Capítulo 2 51
CEDE O, F. O.; PRIETO, M. A. M.; ESPINA, A.; GARC A, J. R. Measurements of
temperature and melting heat of some pure fatty acids and their binary and ternary mixtures
by differential scanning calorimetry. Thermochimica Acta, v. 369, n. 1–2, p. 39-50. 2001.
CHOI, P. B.; MCLAUGHLIN, E. Effect of a phase transition on the solubility of a solid.
AIChE Journal, v. 29, n. 1, p. 150-153. 1983.
CHUNG, H.-J.; LEE, E.-J.; LIM, S.-T. Comparison in glass transition and enthalpy relaxation
between native and gelatinized rice starches. Carbohydrate Polymers, v. 48, n. 3, p. 287-
298. 2002.
COSTA, M. C. Determinação Experimental do Equilíbrio Sólido-Líquido de Sistemas
Binários de Ácidos Graxos Saturados: Estudo Detalhado da Fase Sólida. 2008.
(Doutorado). Departamento de Processos Químicos - DPQ, Universidade Estadual de
Campinas, Campinas, Laboratório de Propriedades Termodinâmicas - LPT.
COSTA, M. C.; BOROS, L. A. D.; BATISTA, M. L. S.; COUTINHO, J. A. P.;
KRAEHENBUEHL, M. A.; MEIRELLES, A. J. A. Phase diagrams of mixtures of ethyl
palmitate with fatty acid ethyl esters. Fuel, v. 91, n. 1, p. 177-181. 2012.
COSTA, M. C.; BOROS, L. A. D.; COUTINHO, J. A. P.; KRAEHENBUEHL, M. A.;
MEIRELLES, A. J. A. Low-Temperature Behavior of Biodiesel: Solid-Liquid Phase
Diagrams of Binary Mixtures Composed of Fatty Acid Methyl Esters. Energy & Fuels, v. 25,
n. 7, p. 3244-3250. 2011a.
COSTA, M. C.; BOROS, L. A. D.; ROLEMBERG, M. P.; KR HENB HL, M. A.;
MEIRELLES, A. J. A. Solid−Liquid Equilibrium of Saturated Fatty Acids + Triacylglycerols.
Journal of Chemical & Engineering Data, v. 55, n. 2, p. 974-977. 2010a.
COSTA, M. C.; BOROS, L. A. D.; SOU A, J. A.; ROLEMBERG, M. P.; KR HENB HL,
M. A.; MEIRELLES, A. J. A. Solid–Liquid Equilibrium of Binary Mixtures Containing Fatty
Acids and Triacylglycerols. Journal of Chemical & Engineering Data, v. 56, n. 8, p. 3277-
3284. 2011b.
COSTA, M. C.; ROLEMBERG, M. P.; BOROS, L. A. D.; KRÄHENBÜHL, M. A.; DE
OLIVEIRA, M. G.; MEIRELLES, A. J. A. Solid−Liquid Equilibrium of Binary Fatty Acid
Mixtures. Journal of Chemical & Engineering Data, v. 52, n. 1, p. 30-36. 2007.
Page 52
Capítulo 2 52
COSTA, M. C.; ROLEMBERG, M. P.; DOS SANTOS, A. O.; CARDOSO, L. P.;
KR HENB HL, M. A.; MEIRELLES, A. J. A. Solid−Liquid Equilibrium of Tristearin with
Refined Rice Bran and Palm Oils. Journal of Chemical & Engineering Data, v. 55, n. 11, p.
5078-5082. 2010b.
DANIEL, J.; RAJASEKHARAN, R. Organogelation of plant oils and hydrocarbons by long-
chain saturated FA, fatty alcohols, wax esters, and dicarboxylic acids. Journal of the
American Oil Chemists' Society, v. 80, n. 5, p. 417-421. 2003.
DOMAŃSKA, U.; MORAWSKI, P.; PIEKARSKA, M. Solid−Liquid Phase Equilibria of 1-
Decanol and 1-Dodecanol with Fragrance Raw Materials Based on Cyclohexane. Journal of
Chemical & Engineering Data, v. 54, n. 4, p. 1271-1276. 2009.
ECKERT, K.-A.; DASGUPTA, S.; SELGE, B.; AY, P. Solid liquid phase diagrams of binary
fatty acid mixtures—Palmitic/stearic with oleic/linoleic/linolenic acid mixture.
Thermochimica Acta, v. 630, p. 50-63. 2016.
FREDENSLUND, A.; JONES, R. L.; PRAUSNITZ, J. M. Group-contribution estimation of
activity coefficients in nonideal liquid mixtures. AIChE Journal, v. 21, n. 6, p. 1086-1099.
1975.
GAMSJAGER, H.; LORIMER, J. W.; SCHARLIN, P.; SHAW, D. G. Glossary of terms
related to solubility. Pure and Applied Chemistry., v. v.80, n.2, p. p.233-276. 2008.
GANDOLFO, F. G.; BOT, A.; FLÖTER, E. Phase diagram of mixtures of stearic acid and
stearyl alcohol. Thermochimica Acta, v. 404, n. 1–2, p. 9-17. 2003.
GANGULY, J. Thermodynamics in Earth and Planetary Sciences. Berlin: Springer, 2007.
GARTI, N.; SATO, K. Crystallization and polymorphism of fats and fatty acids. First
Edition. New York: Marcel Dekker, 1989.
GMELIN, E.; SARGE, S. M. CALIBRATION OF DIFFERENTIAL SCANNING
CALORIMETERS. Pure and Applied Chemistry, v. 67, n. 11, p. 1789-1800. 1995.
GUIMARÃES, L. M.; ZANOTTO, E. D. Cristalização e taxa crítica de resfriamento para
vitrificação do poli(sebacato de decametileno). Química Nova, v. 26, p. 202-207. 2003.
Page 53
Capítulo 2 53
GUNSTONE, F. D.; HARWOOD, J. L.; DIJKSTRA, A. J. The Lipid Handbook. Third
Edition. CRC Press, 2007.
HEMMINGER, W.; SARGE, S. M. Chapter 1 - Definitions, Nomenclature, Terms and
Literature. In: MICHAEL, E. B. (Ed.). Handbook of Thermal Analysis and Calorimetry:
Elsevier Science B.V., v.Volume 1, 1998. p.1-73.
HÖHNE, G.; HEMMINGER, W.; FLAMMERSHEIM, H. J. Differential Scanning
Calorimetry. Springer, 2003.
HÖHNE, G. W. H.; HEMMINGER, W. F.; FLAMMERSEIM, H. J. Differential Scanning
Calorimetry. Springer, 2003.
HUMPHREY, K. L.; SURESH, S. N. Lipid Phase Behavior. In: (Ed.). Fat Crystal
Networks: CRC Press, 2004. p.83-114. (Food Science and Technology).
INOUE, T.; HISATSUGU, Y.; ISHIKAWA, R.; SUZUKI, M. Solid–liquid phase behavior of
binary fatty acid mixtures: 2. Mixtures of oleic acid with lauric acid, myristic acid, and
palmitic acid. Chemistry and Physics of Lipids, v. 127, n. 2, p. 161-173. 2004.
KANEKO, F.; KUBOTA, H. Vibrational spectroscopic study on the polytypism of n-alkanes
and fatty acids. Current Opinion in Colloid & Interface Science, v. 16, n. 5, p. 367-373.
2011.
LAWLER, P. J.; DIMICK, P. S. Crystallization and Polymorphism of Fats. In: (Ed.). Food
Lipids: CRC Press, 2008. (Food Science and Technology).
MARANGONI, A., G; WESDORP, L. H. Crystallography and Polymorphism. In: (Ed.).
Structure and Properties of Fat Crystal Networks, Second Edition: CRC Press, 2012.
p.19-44.
MARANGONI, A. G.; NARINE, S. S. Structure and Mechanical Properties of Fat Crystal
Networks. In: (Ed.). Physical Properties of Lipids: CRC Press, 2002.
MARANGONI, A. G.; WESDORP, L. H. Crystallography and Polymorphism. In: (Ed.).
Structure and Properties of Fat Crystal Networks, Second Edition: CRC Press, 2012.
p.19-44.
Page 54
Capítulo 2 54
MARANGONI, A. G.; WRIGHT, A. J. Physical Properties of Fats and Oils. In: (Ed.).
Handbook of Functional Lipids: CRC Press, 2005. p.135-162. (Functional Foods and
Nutraceuticals).
MAXIMO, G. J. et al. On the solid-liquid equilibrium of binary mixtures of fatty alcohols and
fatty acids. Fluid Phase Equilibria, v. 366, p. 88-98. 2014a.
MAXIMO, G. J.; COSTA, M. C.; COUTINHO, J. A. P.; MEIRELLES, A. J. A. Trends and
demands in the solid-liquid equilibrium of lipidic mixtures. RSC Advances, v. 4, n. 60, p.
31840-31850. 2014b.
MAXIMO, G. J.; COSTA, M. C.; MEIRELLES, A. J. A. Solid-liquid equilibrium of triolein
with fatty alcohols. Brazilian Journal of Chemical Engineering, v. 30, p. 33-43. 2013.
MAXIMO, G. J.; COSTA, M. C.; MEIRELLES, A. J. A. The Crystal-T algorithm: a new
approach to calculate the SLE of lipidic mixtures presenting solid solutions. Physical
Chemistry Chemical Physics, v. 16, n. 31, p. 16740-16754. 2014.
MORENO, E. et al. Polymorphism of even saturated carboxylic acids from n-decanoic to n-
eicosanoic acid. New Journal of Chemistry, v. 31, n. 6, p. 947-957. 2007.
MUDGE, S. M.; BELANGER, S. E.; NIELSEN, A. M. Fatty Alcohols - Anthropogenic and
Natural Occurrence in the Environment. In: (Ed.): RSC Publishing, 2008.
NELSON, S. A. Ternary Phase Diagrams. Crystallization in Ternary Systems.Available
in Tulane University. Acessed in
NILS, H.; HANS, S. Techniques and Applications in Lipid Analysis. In: (Ed.). Lipid
Analysis and Lipidomics: AOCS Publishing, 2006. p.3-26.
NISHIMURA, K. et al. Solid−Liquid Equilibria in Fatty Acid/Triglycerol Systems. Journal
of Chemical & Engineering Data, v. 56, n. 4, p. 1613-1616. 2011.
NYVLT, J. Solid-liquid phase equilibria. Amsterdam: Elsevier, 1977.
PATRICK, J. L.; PAUL, S. D. Crystallization and Polymorphism of Fats. In: (Ed.). Food
Lipids: CRC Press, 2002. (Food Science and Technology).
Page 55
Capítulo 2 55
PISKA, I.; ÁRUBOVÁ, M.; LOUŽECKÝ, T.; KARAMI, H.; FILIP, V. Properties and
crystallization of fat blends. Journal of Food Engineering, v. 77, n. 3, p. 433-438. 2006.
PRAUSNITZ, J. M.; LICHTENTHALER, R. N.; AZEVEDO, E. G. Molecular
Thermodynamics of Fluid-Phase Equilibria. Third Edition. Prentice Hall, 1998.
PRAUSNITZ, J. M.; PRESTON, G. T.; FUNK, E. W. Solubilities of hydrocarbons and
carbon dioxide in liquid methane and in liquid argon. The Journal of Physical Chemistry, v.
75, n. 15, p. 2345-2352. 1971.
REID, R. C.; PRAUSNITZ, J. M.; POULING, B. E. The Properties of Gases and Liquids.
New York: McGraw-Hill, 1987.
RENON, H.; PRAUSNITZ, J. M. Local compositions in thermodynamic excess functions for
liquid mixtures. AIChE Journal, v. 14, n. 1, p. 135-144. 1968.
SANDLER, S. I. Chemical, Biochemical, and Engineering Thermodynamics. 4E. John
Wiley & Sons, 2006.
SATHIVEL, S.; PRINYAWIWATKUL, W.; NEGULESCU, I.; KING, J. Determination of
Melting Points, Specific Heat Capacity and Enthalpy of Catfish Visceral Oil During the
Purification Process. Journal of the American Oil Chemists' Society, v. 85, n. 3, p. 291-
296. 2008.
SATO, K. Crystallization behaviour of fats and lipids — a review. Chemical Engineering
Science, v. 56, n. 7, p. 2255-2265. 2001.
SATO, K.; KOBAYASHI, M.; MORISHITA, H. Stability, occurrence and step morphology
of polymorphs and polytypes of stearic acid. Journal of Crystal Growth, v. 87, n. 2, p. 236-
242. 1988.
SATO, K.; UENO, S. Crystallization, transformation and microstructures of polymorphic fats
in colloidal dispersion states. Current Opinion in Colloid & Interface Science, v. 16, n. 5,
p. 384-390. 2011.
SATO, K.; UENO, S. Physical properties of fats in food. In: (Ed.). Fats in Food Technology
2e: John Wiley & Sons, Ltd, 2014. p.1-38.
Page 56
Capítulo 2 56
SCRIMGEOUR, C. Chemistry of Fatty Acids. In: (Ed.). Bailey's Industrial Oil and Fat
Products: John Wiley & Sons, Inc., 2005.
SLAUGHTER, D. W.; DOHERTY, M. F. Calculation of solid-liquid equilibrium and
crystallization paths for melt crystallization processes. Chemical Engineering Science, v. 50,
n. 11, p. 1679-1694. 1995.
SMITH, J. M.; VAN NESS, H. C.; ABBOTT, M. M. Introducao a termodinamica da
engenharia quimica. LTC, 2000.
SOLÍS, F. J. A.; DURÁN, B. C. Characterization of eutectic mixtures in different natural fat
blends by thermal analysis. European Journal of Lipid Science and Technology, v. 105, n.
12, p. 742-748. 2003.
WEIDLICH, U.; GMEHLING, J. A modified UNIFAC model. 1. Prediction of VLE, hE, and
.gamma..infin. Industrial & Engineering Chemistry Research, v. 26, n. 7, p. 1372-1381.
1987.
WESDORP, L. H. LIQUID-MULTIPLE SOLID PHASE EQUILIBRIA IN FATS -
THEORY AND EXPERIMENTS. 1990. (Doctoral Thesis). Chemicus, Delft University of
Technology., Delft.
WESDORP, L. H. LIQUID-MULTIPLE SOLID PHASE EQUILIBRIA IN FATS -
THEORY AND EXPERIMENTS. 1990. (doctoral Thesis). Chemicus, Delft University of
Technology, Delft.
WON, K. W. Thermodynamic model of liquid-solid equilibria for natural fats and oils. Fluid
Phase Equilibria, v. 82, n. 0, p. 261-273. 1993.
YAMAKI, S. B.; PEDROSO, A. G.; ATVARS, T. D. Z. O estado vítreo dentro da perspectiva
do curso de graduação em química (físico-química). Química Nova, v. 25, p. 330-334. 2002.
ZHANG, J.-J.; ZHANG, J.-L.; HE, S.-M.; WU, K.-Z.; LIU, X.-D. Thermal studies on the
solid–liquid phase transition in binary systems of fatty acids. Thermochimica Acta, v. 369,
n. 1–2, p. 157-160. 2001.
Page 57
Capítulo 3 57
CAPÍTULO 3
BINARY SOLID-LIQUID EQUILIBRIUM SYSTEMS CONTAINING
FATTY ACIDS, FATTY ALCOHOLS AND TRIOLEIN BY
DIFFERENTIAL SCANNING CALORIMETRY
(Published in Fluid Phase Equilibria, v. 404, p. 1 – 8, 2015)
Flávio Cardoso de Matos a, Mariana Conceição da Costa
b, Antonio José de Almeida
Meirelles a, Eduardo Augusto Caldas Batista
a*
a Department of Food Engineering, School of Food Engineering, University of Campinas,
Campinas, Brazil
b School of Applied Sciences, University of Campinas, R. Pedro Zaccaria 1300, 13484-350
Limeira, SP, Brazil
*Corresponding author. Fax: +55 19 3521 4027. E-mail address: [email protected]
(E.A.C. Batista).
Page 58
Capítulo 3 58
ABSTRACT
The solid–liquid phase diagrams of six binary mixtures composed of triolein plus fatty acids
(triolein (1) + capric acid (2), triolein (1) + lauric acid (3) and triolein (1) + myristic acid (4))
and triolein plus fatty alcohols (triolein (1) + 1-decanol (5), triolein (1) + 1-dodecanol (6) and
triolein (1) + 1-tetradecanol (7)) were studied by differential scanning calorimetry (DSC).
Experimental results clearly show that systems formed by triolein + capric acid, triolein + 1-
decanol and triolein + 1-dodecanol show eutectic behavior, while for the other binary
systems, the occurrence of an eutectic point very close to the melting temperature of pure
triolein was observed. Experimental data were used to adjust the parameters of the three-
suffix d and NRTL models.
Keywords: Solid–liquid equilibrium; Fatty systems; Differential scanning calorimetry; Phase
diagram; Thermodynamic modeling.
3.1 Introduction
Triacylglycerols, fatty acids and fatty alcohols are the main constituent of complex
lipids such as oils and fats, which are raw materials used to prepare several products in food,
chemistry and pharmaceutical industries, also being used as phase change materials for
thermal storage [1–3]. Triacylglycerols, fatty alcohols and fatty acids and their mixtures have
also been widely used as surfactant and structuring agents for emulsification with the ability
of forming gel [4–6].
The study of phase equilibrium plays an important role in food technology, since most
foods are multiphase dispersions [7,8]. Moreover, the behavior of the solid–liquid equilibrium
(SLE) in mixtures composed of organic compounds is of fundamental importance for
understanding the thermodynamic behavior of such systems and in phase equilibrium
calculations, they are required to predict stages and their compositions in various industrial
processes and operations [7,9].
Page 59
Capítulo 3 59
Differential scanning calorimetry (DSC) is a sensitive technique for the detection and
evaluation of phase transitions and has been successfully used to study the behavior of (SLE)
[3, 10–15]. Among the main advantages attributed to this technique, we can cite the use of
small amounts of sample (0.1–20 mg), relatively short time of analysis, no special care
required with respect the physical state of the sample, and any liquid or solid material can be
analyzed with the possibility of application in a wide temperature range with various heating
rate programs [16].
In the present study, solid–liquid equilibrium (SLE) data from binary mixtures were
measured by DSC; binary mixtures were represented by a single unsaturated triacylglycerol
plus a saturated fatty acid and the same triacylglycerol plus saturated fatty alcohol. The
chosen components of the binary mixtures were triolein as unsaturated triacylglycerol; capric,
lauric and myristic acids as the saturated fatty acids and 1-decanol, 1-dodecanol and 1-
tetradecanol as fatty alcohols.
3.2 Experimental
3.2.1 Materials
Highly pure components, as shown in Table 3.1 without further purification, were
used to prepare the binary samples. DSC was calibrated using indium (≥0.99 molar fraction,
CAS number 7440-74-6, certificated by PerkinElmer, USA), naphthalene (≥0.99 molar
fraction, CAS number 91-20-3) and decane standards (≥0.99 molar fraction, CAS number
124-18-5), both from Fluka Analytical (Germany), cyclohexane (≥0.999 molar fraction, CAS
number 110-82-7), from Sigma–Aldrich (USA), at heating rate of 1 K min.-1
.
Page 60
Capítulo 3 60
Table 3.1
Sources and purities of standard compounds used this work.
Chemical name Source CAS number Mass fraction puritya
Triolein Sigma–Aldrich (USA) 122-32-7 > 0.990
Capric acid Sigma–Aldrich (USA) 334-48-5 > 0.990
Lauric acid Sigma–Aldrich (USA) 143-07-7 > 0.990
Myristic acid Sigma–Aldrich (USA) 544-63-8 > 0.990
1-Decanol Sigma–Aldrich (Japan) 112-30-1 > 0.994
1-Dodecanol Fluka Analytical (Germany) 112-53-8 > 0.985
1-Tetradecanol Sigma–Aldrich (USA) 112-72-1 > 0.984 a As reported by the supplier.
3.2.2 Preparation of binary mixture samples
Binary samples were gravimetrically prepared by mixing known amounts of each
substance to cover the entire range of the phase diagram in steps of 0.1 in the molar fraction.
To quantify the mass of each pure compound, an analytical scale (AG Need Gravimetrics,
Dietikon) with accuracy of 210-4
g was used. The mixtures were melted in a Thermotrep
(Metrohm, Herisau) in order to ensure the complete homogenization in an inert nitrogen
atmosphere and were kept under refrigeration until analyses. The uncertainty of compositions,
obtained by error propagation from values of the weighed masses, was estimated as not higher
than 4 10-4
(in molar fractions).
3.2.3 Differential scanning calorimetry
Experimental data determination (melting temperatures and enthalpies) was
accomplished using differential scanning colorimeter (DSC 8500 PerkinElmer, USA)
equipped with a cooling system and operated within the temperature range from 248 K to 330
K. High-purity nitrogen (99.99%) was used as purge gas. Experimental data were
characterized at local room pressure p = 94.6 0.1 kPa.
Page 61
Capítulo 3 61
Samples (4–7 mg) were weighed into aluminum pans in micro-analytical scale (AD6,
PerkinElmer, USA), with precision of 210-6
g and sealed. Each sample was submitted to
pretreatment according to method described by Costa et al. [17] in order to erase previous
thermal histories. Samples were submitted to initial heating rate of 5 K min-1
, beginning at
room temperature and heating up to 15 K above the higher melting temperature of the mixture
component, remaining isothermally for 20 min. Then, samples were cooled at a rate of 1 K
min-1
up to 30 K below the smaller melting temperature for the mixtures of component,
remaining isothermally for 30 min. After pretreatment, each sample was analyzed at heating
rate of 1 K min-1
. The temperatures of the thermal events were calculated using the Pyris Data
Analysis software. The temperatures of each thermal event was determined through peak top
temperature, as proposed by Costa et al. [17] and enthalpies were determined from the area of
the corresponding peaks. The experimental standard deviation of pure compounds and
mixtures was determined in triplicate and was not higher than 0.49 K. Experimental
temperature uncertainty was determined by type-A method available in [18] was not higher
than 0.2. The melting enthalpy uncertainty of the indium, compound used to DSC calibration,
also was determined by type-A method which was not higher than 0.037 K and the standard
deviation was 0.063 K.
3.2.4 SLE thermodynamic modeling
The equilibrium condition is the equality of fugacities of each component in both
phases Eq. (3.1).
OL
i
L
i
L
i
OS
i
S
i
S
i fxfx (3.1)
Eq. (3.2) describes the solid–liquid equilibrium and associates the thermodynamic
properties of the pure compound with the nonideality of each phase, whose composition can
be given for each component present at the equilibrium [19].
Page 62
Capítulo 3 62
T
T
R
c
T
T
R
c
T
T
RT
H
f
f itripitrpiitr
itr
ifus
OS
i
OL
i ,,,,
,
,ln11ln
(3.2)
where OL
if and OS
if express the standard fugacity of each component i in the liquid (L) and
solid (S) phases, respectively. Eq. (3.2) in general is simplified considering that the difference
between the triple-point temperature (itrT ,) and the normal melting temperature is very small,
and the difference of the melting enthalpies Hifus, at these temperatures is also negligible.
Therefore, in practice, it is common to replace the normal melting temperature imT , by triple
point temperature itrT , and to use the melting enthalpy at the melting temperature. In
addition, the three terms on the right side of Eq. (3.2) are not of equal importance: the first
term is the dominant one, the second term is related to solid–solid transitions which the
Hitrans, is the transition enthalpy and itransT , is the transition temperature. The remaining
two terms, of opposite sign, have a tendency to cancel each other, especially if itrT , is not far
apart. Therefore, in many cases, it is sufficient to consider only the term that includes
Hifus, and to neglect the terms that include transition enthalpy Hitrans, and heat
capacity pic . Assuming these simplifications and considering that there are no solid–solid
transitions, Eq. (3.3) is obtained as below [19].
1ln
,
,
,
T
T
RT
H
x
x im
im
ifus
L
i
L
i
S
i
S
i
(3.3)
where S
ix and L
ix are the molar fractions of component i in the liquid (L) and solid (S)
phases, S
i and L
i are the activity coefficients of component i in the same phases.
Solid phase immiscibility is usually assumed for modeling fatty systems and
considering the solid phase as being a pure component 1S
i
S
ix .
In the liquid phase, activity coefficient calculation and the three-suffix Margules and
NRTL models where used. Downhill Simplex optimization method was used with the
Page 63
Capítulo 3 63
objective function (S) given in Eq. (3.4), in which N is the number of experimental
measurements and Ti represents the temperature uncertainty: as suggested in the study by
Costa et al. [17]. The root mean square deviation (RMSD) is frequently used to represent the
difference between values predicted by a model and observed values. Eq. (3.5) was used to
verify the agreement between calculated and experimental values.
N
i Ti
cal
ii TTS
1
2exp
2
1
(3.4)
N
i
cal
ii
N
TTRMSD
1
2exp
(3.5)
3.3 Results and Discussion
Table 3.2 presents the thermal properties of pure components obtained in this study,
data reported in literature and the experimental standard deviation. The average relative
deviation (ARD) for the melting temperatures and for the molar enthalpy of fusion of pure
components measured in this work workthis i, and data found in literature literature i, were
calculated according to Eq. (3.6), where N is the number of observations. ARD calculated for
melting temperature was equal to 0.18%, confirming that there are a good agreement between
experimental melting temperature determined in this study and those found in literature. The
ARD calculated for the molar enthalpy of fusion was equal to 5.83%. Although this value is
not as small as the value calculated for the melting temperature, 0.18%, it can be considered a
good result, since only comparing the molar enthalpies of fusion found in literature, it is
possible to note a significant difference between them, particularly for triolein and 1-
tetradecanol.
Page 64
Capítulo 3 64
1001
1 workhis,
, workhis,
N
i ti
literatureiti
NARD (3.6)
Fig. 3.1 presents the thermal curves of pure fatty compounds. Since some transitions
shown in this figure are not visible in the thermal curves, so they were highlighted. As can be
seen in this figure, capric acid presents a unique well-defined peak, which is attributed to its
melting temperature. Lauric acid and myristic acid present light inflection thermal event also
observed by Maximo et al. and Costa et al. [25,27]. As reported by Ventolà et al. [35], this
light inflection suggests the presence of a solid–solid transition overlapping the solid–liquid
phenomena highlighted by black arrow (see inserts in Fig. 3.1). In the same figure, it is
possible to observe that fatty alcohols (1-decanol, 1-dodecanol and 1-tetradecanol) also
exhibit overlapped peaks and triolein showed two well-defined peaks in the temperature range
studied. According to literature by Ventolà et al. [35], the presence of overlapped peaks can
indicate that polymorphic transitions probably occurred during the melting processes of these
fatty compounds; thus, determining the transition enthalpy by means of peak area
measurement does not lead to accurate and reliable values [27].
Page 65
Capítulo 3 65
Table 3.2
Thermal properties for pure fatty components: melting temperatures (Tm), transition temperature (T trans), molar enthalpy of fusion (∆Hfus) and
data from literature.
Component Ttrans/K
Tm/K
∆Hfus/
(kJ.mol-1
)
This worka Literature This work
a Literature This work
a Literature
Triolein 258.99b (± 0.28) 260.15 [20] 278.57 (± 0.04) 278.65 [20] 114.61 (± 0.65) -
- 277.95 [21] 100.00 [21]
- 278.15 [13] 115.56 [13]
Capric acid - 304.54 [22] 305.48 (± 0.10) 305.46 [22] 27.23 (± 0.36) -
- 304.25 [1] 27.22 [1]
- 304.65 [23] 28.55 [23]
- 304.95 [24] 28.60 [24]
- 305.28 [17] 28.20 [25]
Lauric acid 317.91 (± 0.15) 317.56 [22] 318.48 (± 0.49) 318.07 [22] 34.62 (± 0.97) -
- 317.82 [26] 34.69 [26]
- 318.29 [27] 38.70 [27]
- 316.15 [1] 35.46 [1]
- 317.45 [28] 36.30 [28]
Myristic acid 327.95 (± 0.3) 328.18 [22] 328.93 (± 0.18) 328.88 [22] 43.95 (± 0.12) -
- 327.45 [28] 45.20 [28]
- 326.56 [26] 40.12 [26]
- 328.88 [25] 48.35 [25]
- 327.01 [29] 43.41 [29]
1-Decanol 275.94 (± 0.29) 276.20 [14] 280.11 (± 0.22) 280.60 [14] 29.66 (± 0.84) 28.80 [14]
- 279.82 [30] 28.79 [30]
- 280.15 [31] 28.71 [31]
- 280.00 [32] 33.67 [32]
- 280.15 [31] 28.71 [31]
1-Dodecanol 296.95 (± 0.03) 296.40 [14] 297.53 (± 0.05) 297.80 [14] 38.46 (± 0.56) 38.40 [14]
- 296.95 [31] 38.42 [31]
Page 66
Capítulo 3 66
cont. Table 3.2
- 297.30 [32] 40.31 [32]
- 296.60 [33] 37.74 [33]
1-Tetradecanol 310.06 (± 0.35) 310.20 [14] 311.10 (± 0.20) 311.20 [14] 45.81 (± 0.87) 25.90 [14]
310.79 [34] 311.21 [34] 49.51 [34]
- 311.15 [31] 45.66 [31]
310.45 [27] 311.39 [27] 47.60 [27] a Uncertainty for melting temperature and melting enthalpy ± 0.30K and 0.037 kJ.mol
-1 respectively.
b Temperature of transition exothermic peak.
Fig. 3.1 Differential thermal curves of the pure components.
Page 67
Capítulo 3 67
Fatty substances have much more than one polymorphic form, and alpha (α), beta
prime (β') and beta (β) forms are the most widely studied. The α-form has the lowest melting
temperature, the β'-form is a metastable one with an intermediate melting temperature and the
β-form, the most stable one, is the last to melt in a heating procedure. All of them present
different fusion heats [20] and can be obtained directly from the liquid phase, or by phase
transformation, from a less stable polymorphic form after crystallization process [36].
Experimental SLE data obtained in this work by DSC techniques for system composed
of triolein plus fatty acid mixtures and triolein plus fatty alcohol mixtures are presented in
Tables 3.3-3.8.
Table 3.3
Experimental solid–liquid equilibrium data for triolein (1) + capric acid (2) for molar fraction
x, solid–solid transitions Ttrans, eutectic temperature Teut, melting temperature Tm, transitions
pure temperature Ttrans, pure and pressure p = 94.6 kPa.a
xtriolein Ttrans/K Teut/K Tm/K Ttrans, pure Solid phase
0.0000 305.48 2
0.1014 258.67 277.00 300.94 2
0.2001 260.92 276.85 296.84 2
0.3001 259.08 277.20 292.69 2
0.3995 259.90 277.22 289.46 2
0.5013 259.25 277.60 285.78 2
0.6010 260.51 277.44 282.81 2
0.6997 259.69 277.75 277.75 2
0.8008 259.89 277.73 278.17 1
0.8947 259.98 276.95 278.42 1
1.0000 278.57 258.99b 1
a Uncertainties for molar fraction, temperature and pressure are ±0.0004, ±0.30 K and ±0.1
kPa, respectively. b Temperature of transition exothermic peak.
Page 68
Capítulo 3 68
Table 3.4
Experimental solid–liquid equilibrium data for triolein (1) + lauric acid (3) for molar fraction
x, solid–solid transitions Ttrans, eutectic temperature Teut, melting temperature Tm, transitions
pure temperature Ttrans, pure and pressure p = 94.6 kPa.a
xtriolein Ttrans/K Teut/K Tm/K Ttrans, pure Solid phase
0.0000 318.48 317.91 3
0.0999 258.46 277.43 314.05 3
0.2001 258.81 277.62 310.51 3
0.2997 259.29 277.79 306.04 3
0.3997 259.60 277.98 304.55 3
0.4998 259.49 278.07 300.67 3
0.6008 258.71 277.74 296.49 3
0.6994 258.71 277.97 293.76 3
0.7975 258.59 277.87 287.23 3
0.8976 259.97 278.33 281.58 3
1.0000 278.57 258.99b 1
a Uncertainties for molar fraction, temperature and pressure are ±0.0004, ±0.30 K and ±0.1
kPa, respectively. b Temperature of transition exothermic peak.
Table 3.5
Experimental solid–liquid equilibrium data for triolein (1) + myristic acid (4) for molar
fraction x, solid–solid transitions Ttrans, eutectic temperature Teut, melting temperature Tm,
transitions pure temperature Ttrans, pure and pressure p = 94.6 kPa.a
xtriolein Ttrans/K Teut/K Tm/K Ttrans, pure Solid phase
0.0000 328.93 327.95 4
0.1000 259.04 277.65 324.94 4
0.2003 260.09 277.85 322.19 4
0.3003 261.09 278.27 319.88 4
0.3999 260.19 278.07 316.89 4
0.4996 259.99 278.18 314.15 4
0.6013 260.44 278.11 310.92 4
0.6999 260.69 278.54 308.07 4
0.8005 261.29 278.29 304.30 4
0.8989 260.35 277.91 292.22 4
1.0000 278.57 258.99b 1
a Uncertainties for molar fraction, temperature and pressure are ±0.0004, ±0.30 K and ±0.1
kPa, respectively. b Temperature of transition exothermic peak.
Page 69
Capítulo 3 69
Table 3.6
Experimental solid–liquid equilibrium data for triolein (1) + 1-decanol (5) for molar fraction
x, solid–solid transitions Ttrans, eutectic temperature Teut, melting temperature Tm, transition
temperature of mixture Ttrans,mix, transitions pure temperature Ttrans, pure and pressure p = 94.6
kPa.a
xtriolein Ttrans/K Teut/K Ttrans,mix/K Tm/K Ttrans, pure Solid phase
0.0000 280.11 275.94 5
0.0998 258.24 275.17 277.63 5
0.2005 257.76 275.21 276.73 5
0.2998 257.79 275.48 5
0.3987 257.99 275.83 5
0.5018 258.24 275.58 276.61 5
0.6007 258.00 275.57 276.80 1
0.6988 258.29 274.13 276.95 1
0.7987 258.36 272.87 277.67 1
0.8876 258.73 278.04 1
1.0000 278.57 258.99b 1
a Uncertainties for molar fraction, temperature and pressure are ±0.0004, ±0.30 K and ±0.1
kPa, respectively. b Temperature of transition exothermic peak.
Table 3.7
Experimental solid–liquid equilibrium data for triolein (1) + 1-dodecanol (6) for molar
fraction x, solid–solid transitions Ttrans, eutectic temperature Teut, melting temperature Tm,
transitions pure temperature Ttrans, pure, and pressure p = 94.6 kPa.a
xtriolein Ttrans/K Teut/K Tm/K Ttrans, pure Ttrans, pure Solid phase
0.0000 297.53 291.04 296.95 6
0.1004 257.82 276.39 295.29 6
0.1998 257.47 276.80 294.10 6
0.2998 257.15 276.69 292.34 6
0.4038 257.94 277.20 290.87 6
0.4996 258.02 277.29 289.04 6
0.5994 257.28 277.32 287.28 6
0.6994 259.50 277.63 285.24 6
0.8017 259.49 277.73 282.05 6
0.9018 258.79 278.19 1
1.0000 278.57 258.99b 1
a Uncertainties for molar fraction, temperature and pressure are ±0.0004, ±0.30 K and ±0.1
kPa, respectively.
b Temperature of transition exothermic peak.
Page 70
Capítulo 3 70
Table 3.8
Experimental solid–liquid equilibrium data for triolein (1) + 1-tetradecanol (7) for molar
fraction x. solid–solid transitions Ttrans. eutectic temperature Teut. melting temperature Tm.
transitions pure temperature Ttrans. pure and pressure p = 94.6 kPa.a
xtriolein Ttrans/K Teut/K Tm/K Ttrans. pure Solid phase
0.0000 311.10 310.06 7
0.1004 262.47 276.47 308.86 7
0.2002 261.77 277.10 307.55 7
0.3002 258.13 277.89 305.07 7
0.3996 258.6 277.65 304.45 7
0.4999 258.27 277.93 303.13 7
0.6001 257.90 277.80 300.72 7
0.7008 258.97 277.86 297.33 7
0.8007 259.52 277.17 291.49 7
0.9000 259.29 277.15 288.56 7
1.0000 278.57 258.99b 1
a Uncertainties for molar fraction, temperature and pressure are ±0.0004, ±0.30 K and ±0.1
kPa, respectively.
b Temperature of transition exothermic peak.
Fig. 3.2 presents the differential thermal curves obtained for system composed of
triolein (1) + capric acid (2). Once again, some transitions presented in this figure are not
easily visible due to their dimensions, so some details are highlighted. Except for the thermal
curves of pure components, three thermal events can be observed in this system. The first one
at the lowest temperature is attributed to β'-form cristallization indicated by exothermic peak,
the second one, at intermediate temperature, is attributed to eutectic reaction and the last one,
at the highest temperature, represents full sample melting. The same behavior has been
observed by Wei et al., Costa et al., and Maximo et al. [10,11,13]. The increase in molar
fraction of triolein causes a gradual decrease of the melting temperature up to reaching the
eutectic composition, after the eutectic composition, the melting temperature of the binary
mixtures increases again. At the same time, the intensity of the melting peaks decrease with
increasing triolein concentrations. This overlapping occurs due to the proximity of the
temperature values of each event. The other systems studied present similar thermal curve
behavior.
Page 71
Capítulo 3 71
Fig. 3.2 Triolein (1) + capric acid (2) system differential thermal curves.
Page 72
Capítulo 3 72
Fig. 3.3 shows the phase diagram of triolein (1) + capric acid (2) system that was
plotted using the peak top temperature of each differential thermal curve. In all phase
diagrams studied in this work, the behavior of systems was very similar, presenting only the
eutectic reaction. In this context, the phase diagrams of systems studied in this work presented
4 regions: region A, above the melting line of the phase diagram, is composed of a liquid
phase; in region B, solid capric acid coexists with the liquid mixture; in region C, solid
triolein coexists with the liquid mixture; region D shows only a solid phase formed by both
pure and crystallized independently.
Fig. 3.3 SLE phase diagram of the triolein (1) + capric acid (2) binary mixture: (×)
temperature of solid–solid transition; (■) eutectic reaction temperature; (○) experimental
melting point; (▲) temperature of transition of pure component; (—) three-suffix Margules;
(−∙−) NRTL model.
Fig. 3.4 presents the phase diagram of triolein (1) + lauric acid (3) and triolein (1) +
myristic acid (4) binary systems, Fig. 3.4 (a) and (b), respectively. Although the eutectic point
is not so clear in the phase diagrams of these two binary systems as the phase diagram
presented in Fig. 3.3, the occurrence of an eutectic point very close to the melting temperature
of triolein can be assumed. Similar behavior was also reported by Costa et al. [11].
Page 73
Capítulo 3 73
Fig. 3.4 SLE phase diagram of the binary mixtures: (a) triolein (1) + lauric acid (3) and (b) triolein (1) + myristic acid (4): (×) temperature of
solid–solid transition; (■) eutectic reaction temperature; (○) experimental melting point; (▲) temperature of transition of pure component; (—)
three-suffix Margules; (−∙−) NRTL model.
Page 74
Capítulo 3 74
Fig. 3.5 presents the phase diagram of triolein (1) + 1-decanol (5), triolein (1) + 1-
dodecanol (6) and triolein (1) + 1-tetradecanol (7) binary systems, Fig. 3.5 (a)–(c)
respectively. These phase diagrams showed a very similar behavior, except for the fact that
the eutectic points are located at different mixture composition of the phase diagram. In other
words, the eutectic point shift to higher triolein concentration values with increased fatty
alcohol carbon chain.
Page 75
Capítulo 3 75
Fig. 3.5 Solid-liquid equilibrium phase diagram obtained experimentally for the binary mixtures: (a) triolein (1) + 1-decanol (5), (b) triolein (1) +
1-dodecanol (6), (c) triolein (1) + 1-tetradecanol (7). (×) temperature of solid–solid transition; (■) eutectic reaction temperature; (○) experimental
melting point; (▲) temperature of transition of pure component, (∆) temperature of transition of mixture, (—) three-suffix Margules model.
Page 76
Capítulo 3 76
Figs. 3.6 and 3.7 show the enthalpy values of the eutectic reaction as a function of the
sample composition (Tammann plot) for all systems studied. According to literature [37] the
Tammann plot should present a linearly increasing value as a function of the mixture
composition up to reaching the eutectic point and, after that, it should decrease also linearly
up to reaching the pure component composition forming a perfect triangle. The triangle shape
will always be obtained even if the phase diagram shows the formation of a solid solution in
its extremes, but in this case, it does not start at the pure component composition [13, 22]. An
exception to this behavior is found when the eutectic point is very close to the pure
component concentration, in this case, the task of determine the eutectic composition becomes
very difficult due to peak overlapping. This behavior is observed for triolein (1) + lauric acid
(3) and triolein (1) + myristic acid (4) systems shown in Fig. 3.6 (b) and c and for the triolein
(1) + 1-tetradecanol (7) system shown in Fig. 3.7 (c). The Tammann plot of these mixtures
shows enthalpy value increasing with the system composition up to reaching the pure triolein
concentration. Although these mixtures show (r2
> 0.99) in the linear regression of
experimental data, it was not possible to calculate the exact eutectic composition.
Page 77
Capítulo 3 77
Fig. 3.6 Tammann plots of mixture triolein + fatty acid: (a) triolein (1) + capric acid (2), (b) triolein (1) + lauric acid (3), (c) triolein (1) +
myristic acid (4): (■) melting eutectic enthalpy, (—) Linear regression for data on and (---) hypothetical plot with a eutectic point.
Page 78
Capítulo 3 78
Fig. 3.7 Tammann plots of mixture triolein + fatty alcohol: (a) triolein (1) + 1-decanol (5), (b) triolein (1) + 1-dodecanol (6), (c) triolein (1) + 1-
tetradecanol (7): (■) melting eutectic enthalpy, (▲) temperature of transition of mixture, (—) Linear regression for data on and (---) hypothetical
plot with a eutectic point.
Page 79
Capítulo 3 79
On the other hand, the eutectic composition of the other systems was found when both
linear regressions are matched, as seen in Figs. 3.6 (a) and 3.7 (a) and (b). The eutectic
composition of triolein (1) + capric acid (2) system was 0.7059 in triolein molar fraction and
for triolein + 1-decanol (Fig. 3.7 (a)) and triolein + 1-dodecanol systems (Fig. 3.7 (b)), values
were 0.4028 and 0.7578 in triolein molar fraction, respectively. Also can see in (Fig. 3.7 (a))
the appearance of two points, indicating a transition of the mixture in the molar fractions of
triolein of 0.6988 and 0.7987.
The Tammann plots of the other triolein (1) + lauric acid (3), triolein (1) + myristic
acid (4) and triolein (1) + 1-tetradecanol (7) mixtures, respectively in Figs. 3.6 (b) and (c) and
7 (c) do not allow identifying the eutectic point similarly as experimental data presented in
phase diagrams. This behavior was also observed by Costa et al. and Maximo et al. [11,13]
and is an indication that the eutectic point occurs at concentrations very close to pure triolein.
Table 3.9 shows the adjusted parameters and the RMSD between calculated and
experimental data for three-suffix Margules and NRTL models. Both models adequately
describe the liquidus line of systems, since the RMSD values obtained are small. It is
interesting note that the Margules and NRTL models presents very similar results concerning
the eutectic temperature and composition except for the triolein (1) + capric acid (2) mixture,
for this system there is a slightly difference in the eutectic composition. According to the
NRTL model the eutectic point occurs at triolein concentrations of approximately 0.67 and
according to the three-suffix Margules model the eutectic point occurs at triolein
concentrations of approximately 0.72. The RMSD calculated for NRTL model is the double
of the RMSD calculated to the Margules model but considering the set of data it is not
possible to state that one model fits the experimental data better than the other, in a general
way and respecting some differences, the results obtained using both models were very good.
Page 80
Capítulo 3 80
Table 3.9
Adjusted parameters obtained for Margules Three-Suffix and NRTL models.
Systems
Three-suffix Margules NRTL (α12=0.30) RMSD
Aij
(J⋅mol-1
) Aji
(J⋅mol-1
) Δgij
(J⋅mol-1
) Δgji (J⋅mol
-1)
Three-suffix
Margules NRTL
Triolein (1) + capric acid (2) -628.41 2,916.45 -978.91 852.37 0.739 1.525
Triolein (1) + lauric acid (3) 223.88 1830.23 5975.71 -2457.54 0.977 0.672
Triolein (1) + myristic acid (4) -84.97 1647.36 5650.25 -2613.27 0.668 0.766
Triolein (1)+ 1-decanol (5) 3748.41 2445.46 406.65 3370.02 0.297 0.304
Triolein (1) + 1-dodecanol (6) 3080.82 3146.11 1920.67 1600.96 0.367 0.352
Triolein (1)+ 1-tetradecanol (7) 3875.74 4057.80 2590.80 2036.29 1.164 1.099
Page 81
Capítulo 3 81
3.4 Conclusions
Differential scanning calorimetry was used to construct the phase diagrams of triolein
(1) + capric acid (2), triolein (1) + lauric acid (3), triolein (1) + myristic acid (4)) triolein (1) +
1-decanol (5), triolein (1) + 1-dodecanol (6) and triolein (1) + 1-tetradecanol (7) systems. The
melting temperatures of pure compounds determined by this technique are in good agreement
with literature data.
The liquidus lines of systems studied were adequately described by three-suffix
Margules and NRTL models. Although both models indicate the occurrence of eutectic point
in the triolein + lauric acid system, triolein + myristic acid system and triolein + 1-
tetradecanol systems, this point cannot be exactly determined due to the difficulty of
measuring experimental data in the region close to pure triolein.
Acknowledgements
The authors wish to acknowledge CAPES, FAPESP (2008/56258-8 and 2012/05027-
1) and CNPq (483340/2012-0, 479533/2013-0, 309780/2014-4, 308616/2014-6 and
305870/2014-9) for their financial support.
Page 82
Capítulo 3 82
Appendix A. Supplementary data
Supplementary data associated with this article can be found, in the online version, at
(http://dx.doi.org/10.1016/j.fluid.2015.06.015).
Fig. 1 Differential thermal curves of system triolein + lauric acid.
Fig. 2 Differential thermal curves of system triolein + myristic acid.
Page 83
Capítulo 3 83
Fig. 3 Differential thermal curves of system triolein + 1-decanol.
Fig. 4 Differential thermal curves of system triolein +1-dodecanol.
Page 84
Capítulo 3 84
Fig. 5 Differential thermal curves of system triolein +1-tetradecanol.
Page 85
Capítulo 3 85
References
[1] D. Wei, S. Han, B. Wang, Solid–liquid phase equilibrium study of binary mixtures of n-
octadecane with capric, and lauric acid as phase change materials (PCMs), Fluid Phase
Equilibria, 373 (2014) 84-88.
[2] F.D. Gunstone, J.L. Harwood, A.J. Dijkstra, The Lipid Handbook, Third Edition ed., CRC
Press, 2007.
3 M.C. Costa, L.A.D. Boros, J.A. Souza, M.P. Rolemberg, M.A. Kr henb hl, A.J.A.
Meirelles, Solid–Liquid Equilibrium of Binary Mixtures Containing Fatty Acids and
Triacylglycerols, Journal of Chemical & Engineering Data, 56 (2011) 3277-3284.
[4] H.M. Schaink, K.F. van Malssen, S. Morgado-Alves, D. Kalnin, E. van der Linden,
Crystal network for edible oil organogels: Possibilities and limitations of the fatty acid and
fatty alcohol systems, Food Research International, 40 (2007) 1185-1193.
[5] J. Daniel, R. Rajasekharan, Organogelation of plant oils and hydrocarbons by long-chain
saturated FA, fatty alcohols, wax esters, and dicarboxylic acids, J Amer Oil Chem Soc, 80
(2003) 417-421.
[6] F.G. Gandolfo, A. Bot, E. Flöter, Phase diagram of mixtures of stearic acid and stearyl
alcohol, Thermochimica Acta, 404 (2003) 9-17.
[7] S. Bruin, Phase equilibria for food product and process design, Fluid Phase Equilibria,
158–160 (1999) 657-671.
[8] G.P. Rangaiah, Evaluation of genetic algorithms and simulated annealing for phase
equilibrium and stability problems, Fluid Phase Equilibria, 187–188 (2001) 83-109.
[9] M. Tadie, I. Bahadur, P. Reddy, P.T. Ngema, P. Naidoo, N. Deenadayalu, D.
Ramjugernath, Solid–liquid equilibria measurements for binary systems comprising (butyric
acid + propionic or pentanoic acid) and (heptanoic acid + propionic or butyric or pentanoic or
hexanoic acid), The Journal of Chemical Thermodynamics, 57 (2013) 485-492.
[10] D. Wei, X. Zhang, H. Li, Solid–liquid phase equilibrium study of n-octadecane + lauryl
alcohol binary mixtures, The Journal of Chemical Thermodynamics, 60 (2013) 94-97.
Page 86
Capítulo 3 86
11 M.C. Costa, L.A.D. Boros, M.P. Rolemberg, M.A. Kr henb hl, A.J.A. Meirelles,
Solid−Liquid Equilibrium of Saturated Fatty Acids + Triacylglycerols, Journal of Chemical
& Engineering Data, 55 (2010) 974-977.
[12] C.-C. Huang, Y.-P. Chen, Measurements and model prediction of the solid–liquid
equilibria of organic binary mixtures, Chemical Engineering Science, 55 (2000) 3175-3185.
[13] G.J. Maximo, M.C. Costa, A.J.A. Meirelles, Solid-liquid equilibrium of triolein with
fatty alcohols, Brazilian Journal of Chemical Engineering, 30 (2013) 33-43.
[14] N.D.D. Carareto, A.O. dos Santos, M.P. Rolemberg, L.P. Cardoso, M.C. Costa, A.J.A.
Meirelles, On the solid–liquid phase diagrams of binary mixtures of even saturated fatty
alcohols: Systems exhibiting peritectic reaction, Thermochimica Acta, 589 (2014) 137-147.
[15] M.C. Costa, M.P. Rolemberg, A.O. dos Santos, L.P. Cardoso, M.A. Kr henb hl, A.J.A.
Meirelles, Solid−Liquid Equilibrium of Tristearin with Refined Rice Bran and Palm Oils,
Journal of Chemical & Engineering Data, 55 (2010) 5078-5082.
[16] K.E. Afaf, P. Jan, Lipid Oxidation Products and Methods Used for Their Analysis, in:
Analysis of Lipid Oxidation, AOCS Publishing, 2005.
[17] M.C. Costa, M.P. Rolemberg, L.A.D. Boros, M.A. Krähenbühl, M.G. de Oliveira, A.J.A.
Meirelles, Solid−Liquid Equilibrium of Binary Fatty Acid Mixtures, Journal of Chemical &
Engineering Data, 52 (2007) 30-36.
[18] Nist, National Institute of Standards and Technology. Uncertainty of Measurement
Results, (2000), Available in http://physics.nist.gov/cuu/Uncertainty/index.html Acessed in
08/01/2015.
[19] J.M. Prausnitz, R.N. Lichtenthaler, E.G. de Azevedo, Molecular Thermodynamics of
Fluid-Phase Equilibria, Third Edition ed., Prentice Hall, 1998.
[20] R.H. Ferguson, E.S. Lutton, The Polymorphism of Triolein, Journal of the American
Chemical Society, 69 (1947) 1445-1448.
[21] L.H. Wesdorp, Liquid-Multiple Solid Phase Equilibria In Fats - Theory and
Experiments., in, Chemicus, Delft University of Technology., Delft, 1990.
Page 87
Capítulo 3 87
[22] M.C. Costa, M.P. Rolemberg, A.J.A. Meirelles, J.A.P. Coutinho, M.A. Krähenbühl, The
solid–liquid phase diagrams of binary mixtures of even saturated fatty acids differing by six
carbon atoms, Thermochimica Acta, 496 (2009) 30-37.
[23] S. Song, L. Dong, S. Chen, H. Xie, C. Xiong, Stearic–capric acid eutectic/activated-
attapulgiate composite as form-stable phase change material for thermal energy storage,
Energy Conversion and Management, 81 (2014) 306-311.
[24] T. Inoue, Y. Hisatsugu, M. Suzuki, Z. Wang, L. Zheng, Solid–liquid phase behavior of
binary fatty acid mixtures: 3. Mixtures of oleic acid with capric acid (decanoic acid) and
caprylic acid (octanoic acid), Chemistry and Physics of Lipids, 132 (2004) 225-234.
[25] M.C. Costa, M. Sardo, M.P. Rolemberg, J.A.P. Coutinho, A.J.A. Meirelles, P. Ribeiro-
Claro, M.A. Krähenbühl, The solid–liquid phase diagrams of binary mixtures of consecutive,
even saturated fatty acids, Chemistry and Physics of Lipids, 160 (2009) 85-97.
[26] A.K. Misra, M. Misra, G.M. Panpalia, A.K. Dorle, Thermoanalytical and Microscopic
Investigation of Interaction between Paracetamol and Fatty Acid Crystals, Journal of
Macromolecular Science, Part A, 44 (2007) 685-690.
[27] G.J. Maximo, N.D.D. Carareto, M.C. Costa, A.O. dos Santos, L.P. Cardoso, M.A.
Kraehenbahl, A.J.A. Meirelles, On the solid-liquid equilibrium of binary mixtures of fatty
alcohols and fatty acids, Fluid Phase Equilibria, 366 (2014) 88-98.
[28] T. Inoue, Y. Hisatsugu, R. Ishikawa, M. Suzuki, Solid–liquid phase behavior of binary
fatty acid mixtures: 2. Mixtures of oleic acid with lauric acid, myristic acid, and palmitic acid,
Chemistry and Physics of Lipids, 127 (2004) 161-173.
[29] A. Karaipekli, A. Sari, K. Kaygusuz, Thermal Properties and Long-term Reliability of
Capric Acid/Lauric Acid and Capric Acid/Myristic Acid Mixtures for Thermal Energy
Storage, Energy Sources, Part A: Recovery, Utilization, and Environmental Effects, 30
(2008) 1248-1258.
30 U. Domańska, J. Łachwa, (Solid + liquid) phase equilibria of binary mixtures containing
N-methyl-2-pyrrolidinone and long-chain n-alkanols at atmospheric pressure, Fluid Phase
Equilibria, 198 (2002) 1-14.
Page 88
Capítulo 3 88
[31] T. Eckert, J. Müller, Zur Schmelzenthalpie und Schmelzentropie von Fettalkoholen,
Archiv der Pharmazie, 311 (1978) 31-34.
[32] R.C.F. Schaake, J.C. van Miltenburg, C.G. de Kruif, Thermodynamic properties of the
normal alkanoic acids II. Molar heat capacities of seven even-numbered normal alkanoic
acids, The Journal of Chemical Thermodynamics, 14 (1982) 771-778.
33 U. Domańska, K. Paduszyński, J. Da bska, Measurements, Correlations, and Mod.
UNIFAC (Do) Prediction of (Solid−Liquid) Phase Equilibria Diagrams in Binary Systems
(Aliphatic Ketone + an Alcohol), Journal of Chemical & Engineering Data, 56 (2010) 881-
888.
[34] C. Mosselman, J. Mourik, H. Dekker, Enthalpies of phase change and heat capacities of
some long-chain alcohols. Adiabatic semi-microcalorimeter for studies of polymorphism, The
Journal of Chemical Thermodynamics, 6 (1974) 477-487.
[35] L. Ventolà, V. Metivaud, L. Bayés, R. Benages, M.Á. Cuevas-Diarte, T. Calvet, D.
Mondieig, The Binary System Tetradecanedioic Acid–Hexadecanedioic Acid: Polymorphism
of the Components and Experimental Phase Diagram, Helvetica Chimica Acta, 89 (2006)
2027-2039.
36 I. Piska, M. árubová, T. Loužecký, H. Karami, V.r. Filip, Properties and crystallization
of fat blends, Journal of Food Engineering, 77 (2006) 433-438.
[37] G.G. Chernik, Phase equilibria in phospholipid-water systems, Advances in Colloid and
Interface Science, 61 (1995) 65-129.
Page 89
Capítulo 4 89
CAPÍTULO 4
BINARY SOLID-LIQUID EQUILIBRIUM SYSTEMS CONTAINING
FATTY ACIDS, FATTY ALCOHOLS AND TRILAURIN BY
DIFFERENTIAL SCANNING CALORIMETRY
(Published in Fluid Phase Equilibria, v. 423, p. 74 – 83, 2016)
Flávio Cardoso de Matos a, Mariana Conceição da Costa
b, Antonio José de Almeida
Meirelles a, Eduardo Augusto Caldas Batista
a*
a Department of Food Engineering, School of Food Engineering, University of Campinas,
Campinas, Brazil
b School of Applied Sciences, University of Campinas, R. Pedro Zaccaria 1300, 13484-350
Limeira, SP, Brazil
* Corresponding author. Fax: +55 19 3521 4027. E-mail address: [email protected]
(E.A.C. Batista).
Page 90
Capítulo 4 90
ABSTRACT
Solid-liquid phase diagrams of six binary mixtures composed by trilaurin plus fatty acids
(myristic acid, palmitic acid and stearic acid) and trilaurin plus fatty alcohols (1-tetradecanol,
1-hexadecanol and 1-octadecanol) were studied by differential scanning calorimetry (DSC)
and some mixtures by optical microscopy. The experimental data showed that all the studied
systems present an eutectic point. Trilaurin + 1-tetradecanol and trilaurin + 1-hexadecanol
systems exhibited a partial formation of solid solution. Experimental data were used to adjust
the parameters of the three-suffix Margules and NRTL models and the results showed that
these models can appropriately describe the liquidus lines of above mentioned systems.
Keywords: Solid-liquid equilibrium; Fatty systems; Differential scanning calorimetry;
Trilaurin; Thermodynamic modeling.
4.1 Introduction
The knowledge of the physical properties of fatty compounds is an important tool for
their implementation in a food matrix [1]. In general, oils and fats are composed of a complex
mixture of triacylglycerols (TAGs) (usually > 95% of their total composition), which tends to
determine a large part of their physicochemical properties. Beyond of the triacylglycerols, oils
and fats present minor constituents in their compositions, such as diacylglycerols,
monoacylglycerols, free fatty acids and fatty alcohols as well as phospholipids, sterol esters
(tocopherols and tocotrienols), and vitamins [2].
Solid-liquid equilibrium (SLE) studies of mixtures containing triacylglycerols
(TAGs), fatty acids and fatty alcohol have been the subject of interest of many researchers [3-
9] due to their presence in a variety of systems such as complex lipid mixtures used in food,
chemical and pharmaceutical industries as surfactant and structuring agents for emulsification
with the ability of forming gel, for example. Moreover recent studies have been considered
this kind of substances as phase change materials (PCMs) for thermal storage processes [10,
11].
Page 91
Capítulo 4 91
Experimental determination of SLE phase diagrams of fatty mixtures is often
accomplished by differential scanning calorimetry (DSC) technique which is widely used as
simple, faster and reliable technique to determine temperatures and enthalpies of phase
transitions and heat capacities of solid and liquid phases. It also provides information about
polymorphic transformations and data to estimate solid fat contents [8, 12, 13]. All of these
analyses need small samples [13-16]. Although this technique is not an absolute way to
measure equilibrium data because the measurements are not performed in a thermal
equilibrium but in a quasi-equilibrium condition, it is a usual practice to report equilibrium
phase diagrams measured by DSC [5, 8, 14, 16 - 22].
This study aims to analyze the SLE behavior of the following binary mixtures:
trilaurin (1) + myristic acid (2), + palmitic acid(3), + stearic acid (4), + 1-tetradecanol (5), +
1-hexadecanol (6) and + 1-octadecanol (7) employing DSC technique. Some thermal
transitions were evaluated with the aid of an optical microscopy coupled with a temperature
controller. The liquidus lines of the studied systems were adjusted using three-suffix
Margules and NRTL models.
4.2 Experimental
4.2.1 Materials
Highly pure components were used in this study without further purification (Table
4.1). The equipment calibration was performed using indium (≥ 0.999 M fraction, CAS
number 7440-74-6, certificated by PerkinElmer, USA), decane (≥ 0.99 M fraction, CAS
number 124-18-5), from Fluka Analytical (Germany) and cyclohexane (≥ 0.999 M fraction,
CAS number 110-82-7), from Sigma- Aldrich (USA), at heating rate of 1 K min-1
.
Page 92
Capítulo 4 92
Table 4.1
Sources and purities of standard compounds used this study.
Chemical name Source CAS number Mass fraction purity a
Trilaurin Nu-Chek 538-24-9 > 0.99
Myristic acid Sigma–Aldrich (USA) 544-63-8 > 0.99
Palmitic acid Nu-Chek 57-10-3 > 0.99
Stearic acid Nu-Chek 57-11-4 > 0.99
1-Tetradecanol Sigma–Aldrich (USA) 112-72-1 > 0.984
1-Hexadecanol Aldrich (Germany) 36653-82-4 > 0.99
1-Octadecanol Aldrich (Germany) 112-92-5 > 0.99
a As reported by the supplier.
4.2.2 Preparation of binary mixture samples
The samples were prepared by mixing known amounts of each substance to cover the
entire range of the phase diagram in steps of 0.1 of the molar fraction as described in a
previous study [23]. For this set of binary systems, the uncertainty of compositions, obtained
by error propagation from values of the weighed masses, was estimated as not higher than 4
10-4
(in molar fractions).
4.2.3 Differential scanning calorimetry
The experimental data were performed on a Differential Scanning Calorimeter (DSC
8500 PerkinElmer, USA) equipped with a cooling system and operated within the temperature
range from 248 K to 360 K. High-purity nitrogen (99.99%) was used as purge gas.
Experimental data were characterized at local room pressure p = 94.6 ± 0.1 kPa. A detailed
description of the experimental procedure in which the samples were submitted in the DSC
equipment was presented in the previous study [20].
Page 93
Capítulo 4 93
4.2.4 Optical microscopy
Optical microscopy (Leica DM 2700 M, China) coupled with a temperature controller
(Linkam LTS 420, United Kingdom) was used to evaluate the behavior of the solid-liquid
transition of some mixtures. Each sample was submitted to a heating rate of 0.1 K min-1
until
the sample melting. The images were acquired at each 0.1 K with a magnification of 20 times.
4.2.5 SLE thermodynamics
As described in detail in our previous study [23], it was adopted three-suffix Margules
and NRTL models to describe the liquidus lines. The thermodynamic models are used in Eq.
(4.1), proposed by Prausnitz et al. [24], in which was not considered solid–solid phase
transitions and the molar heat capacities of pure components. The solid phase was considered
as a pure solid component 1)( S
i
S
ix , which represents that both components in solid phase
are completely immiscible.
1
1ln
i m,
i m,
i fus,
T
T
RT
H
x L
i
L
i (4.1)
where )( L
ix is the molar fraction of component i in the liquid (L) phase, )( L
i , the activity
coefficient of component i in the liquid phase, )( , Hifus is the enthalpy of fusion at the
melting temperature of the compound i, )( ,imT is the melting temperature of the compound i,
)(T is the calculated temperature, and )(R is the universal gas constant.
Eq. (4.2) was used to verify the root mean square deviation (RMSD) between the
temperature calculated by three-suffix Margules or NRTL models and the observed ones.
N
i
cal
ii
N
TTRMSD
1
2exp )( (4.2)
Page 94
Capítulo 4 94
where (N) is the number of experimental measurements, )( expT is the experimental
temperature and )( calT is the calculated temperature.
4.3 Results and Discussion
The thermal properties of pure components obtained in this study and those reported in
literature are presented in Table 4.2. The experimental standard deviations are indicated in
parenthesis. The average relative deviation (ARD) of the melting temperatures and the molar
enthalpies of fusion of pure components measured in this work ( workthisi, ) and data found in
literature (literature i, ) were calculated according to Equation (4.3), where (N) is the number of
observations. The ARD for melting temperatures was equal to 0.14%, confirming that there is
a good agreement between these experimental data and those found in literature. The ARD for
the molar enthalpy of fusion was equal to 7.80%. Although this value is not as small as the
value found for the melting temperatures, it can be considered a good result, since only
comparing the literature data of molar enthalpies of fusion, it is possible to note a significant
difference between them (9.95%), particularly for myristic acid, 1-tetradecanol and 1-
hexadecanol. The data of myristic acid and 1-tetradecanol can be found in our previous study
[23].
1001
1 ,
,,
N
i workthisi
etliteraturi workthisi
NARD (4.3)
Differential thermal curves of pure fatty alcohols, 1-hexadecanol and 1-octadecanol,
and fatty acids, palmitic acid and stearic acid, present overlapping peaks with a light
inflection very close the melting temperature suggesting the occurrence of a solid-solid
transition (Table 4.2) [17, 22, 37]. The same behavior was also observed for the myristic acid
and 1-tetradecanol in previous work [23]. The overlapping peaks occurs due to the proximity
in the values of temperature of each thermal event and can be an indication that polymorphic
transitions occur during the melting process of these compounds [38-40].
Page 95
Capítulo 4 95
Table 4.2
Thermal properties for pure fatty components: transitions temperature (Ttrans), melting temperatures (Tm), molar enthalpy of fusion (∆fus,i H) and
data from literature.
Component Ttrans / K Tm / K ∆fus,i H / (kJ.mol
-1)
This work a Literature This work
a Literature This work
a Literature
Trilaurin 295.42 (± 0.49) - 319.67 (± 0.20) 319.50 [25] 118.03 (± 0.23) 123.51 [25]
319.55 [26] 114.22 [26]
- 319.39 [27] 116.45 [27]
Palmitic acid 335.86 (± 0.45) - 336.36 (± 0.41) 335.44 [28] 53.02 (± 1.20) 55.85 [28]
- 337.69 [29] 51.37 [29]
335.95 [18] 337.22 [18] -
- 335.15 [30] 54.39 [30]
Stearic acid 343.40 (± 0.06) 343.31 [28] 344.04 (± 0.04) 343.98 [28] 61.10 (± 0.19) 67.56 [28]
- 344.05 [10] 57.80 [10]
- 343.65 [3] 59.96 [3]
1-Hexadecanol 322.15 (± 0.10) 322.30 [6] 322.90 (± 0.031) 323.30 [6] 60.96 (± 0.47) 36.40 [6]
- 322.25 [31] 57.74 [31]
322.30 [32] 322.20 [32] 58.40 [32]
- 322.20 [33] 56.30 (± 0.7) [33]
1-Octadecanol 330.44 (± 0.22) 330.60 [34] 331.34 (± 0.08) 331.20 [34] 65.35 (± 1,48) 66.70 [34]
330.97 (± 0.10)
[35]
331.82 (±
0.17) [35]
65.40 (± 1.80) [35]
330.00 [36] 331.00 [36] 69.00 [36]
a Uncertainty of melting temperature and molar enthalpy of fusion ± 0.30K and ± 0.04 kJ.mol
-1, respectively.
Page 96
Capítulo 4 96
Once the thermal events are very close, the determination of the enthalpy of each
transition observed does not lead to an accurate and reliable value [5, 41].
Differential thermal curves of trilaurin, in turn, presents two peaks, the first one, an
exothermic peak with temperature equal to 295.42 K, and the second one, an endothermic
peak, with temperature equal to 319.67 K, represents the full sample melting.
SLE data obtained in this study for system composed of trilaurin plus fatty acid and
trilaurin plus fatty alcohol are presented in Tables 4.3 - 4.8. All the phase diagrams were
plotted in a way that trilaurin is on the right side of the phase diagrams and the peak top
temperature was considered for all thermal events.
Table 4.3
Experimental solid–liquid equilibrium data for trilaurin (1) + myristic acid (2) for molar
fraction x, solid–solid transitions Ttrans, eutectic temperature Teut, melting temperature Tm,
transitions temperature of pure component Ttrans, pure and pressure p = 94.6 kPa.a
xtrilaurin Ttrans/K Teut/K Tm /K Ttrans, pure Solid phase
0.0000 327.95 327.95 2
0.1000 316.22 325.65 2
0.2002 316.16 323.34 2
0.3002 315.96 320.17 2
0.3999 316.33 318.79 2
0.5003 316.31 2
0.6009 316.58 317.43 1
0.7019 316.13 318.05 1
0.7993 315.72 318.66 1
0.9019 315.19 319.32 1
1.0000 319.67 295.42 1
a Uncertainties for molar fraction, temperature and pressure are ±0.0004, ±0.30 K and ±0.1
kPa, respectively.
Page 97
Capítulo 4 97
Table 4.4
Experimental solid–liquid equilibrium data for trilaurin (1) + palmitic acid (3) for molar
fraction x, solid–solid transitions Ttrans, eutectic temperature Teut, melting temperature Tm,
transitions temperature of pure component Ttrans, pure and pressure p = 94.6 kPa.a
xtrilaurin Ttrans/K Teut/K Tm /K Ttrans, pure Solid phase
0.0000 336.36 335.86 3
0.1000 317.43 334.03 3
0.2002 318.37 332.48 3
0.2994 318.46 330.39 3
0.4000 318.49 328.74 3
0.4998 318.73 326.07 3
0.6014 318.80 322.74 3
0.6992 318.83 321.61 3
0.8000 319.20 3
0.8979 318.23 319.70 1
1.0000 319.67 295.42 1
a Uncertainties for molar fraction, temperature and pressure are ±0.0004, ±0.30 K and ±0.1
kPa, respectively.
Table 4.5
Experimental solid–liquid equilibrium data for trilaurin (1) + stearic acid (4) for molar
fraction x, solid–solid transitions Ttrans, eutectic temperature Tm, melting temperature Tfus,
transitions temperature of pure component Ttrans, pure and pressure p = 94.6 kPa.a
xtrilaurin Ttrans/K Teut/K Tm /K Ttrans, pure Solid phase
0.0000 344.04 343.40 4
0.0999 318.98 341.25 4
0.1990 319.39 339.80 4
0.3004 319.18 337.27 4
0.3998 319.48 335.70 4
0.4998 319.47 334.11 4
0.5993 319.71 331.17 4
0.6988 319.49 327.77 4
0.8001 319.14 326.38 4
0.8995 319.61 321.78 4
0.9470 319.78 4
1.0000 319.67 295.42 1
a Uncertainties for molar fraction, temperature and pressure are ±0.0004, ±0.30 K and ±0.1
kPa, respectively.
Page 98
Capítulo 4 98
Table 4.6
Experimental solid–liquid equilibrium data for trilaurin (1) + 1–tetradecanol (5) for molar
fraction x, solid–solid transitions Ttrans, eutectic temperature Teut, melting temperature Tm,
transitions pure temperature Ttrans, pure, temperature observed by optical microscopy Topt.mic./K
and pressure p = 94.6 kPa.a
x1-tetradecanol Ttrans1/K Ttrans2/K Teut/K Tm /K Topt.mic./K Ttrans, pure Solid phase
0.0000 311.10 310.20 1
0.0998 310.03 5
0.2002 309.87 312.11 5
0.3004 310.26 314.19 5
0.4005 307.10 309.31 314.98 5
0.5006 305.97 308.76 315.67 5
0.5802 295.20 307.12 308.74 316.74 5
0.7008 294.19 306.05 308.60 317.07 5
0.8015 295.15 308.85 318.21 313.85 5
0.9007 295.37 319.37 317.45 5
1.0000 319.67 295.42 5
a Uncertainties for molar fraction, temperature and pressure are ±0.0004, ±0.30 K and ±0.1
kPa, respectively.
Table 4.7
Experimental solid–liquid equilibrium data for trilaurin (1) + 1–hexadecanol (6) for molar
fraction x, solid–solid transitions Ttrans, eutectic temperature Teut, melting temperature Tm,
transitions pure temperature Ttrans, pure and pressure p = 94.6 kPa.a
x1-tetradecanol Ttrans/K Ttrans/K Teut/K Tm/K Ttrans, pure Solid phase
0.0000 322.90 322.52 1
0.0998 316.48 321.87 1
0.2002 316.53 320.29 1
0.3008 316.30 318.80 1
0.4002 318.43 1
0.5024 316.39 1
0.6003 315.93 317.05 6
0.7001 315.44 317.92 6
0.8008 298.73 314.55 318.56 6
0.9010 299.24 312.32 318.81 6
1.0000 319.67 295.42 6
a Uncertainties for molar fraction, temperature and pressure are ±0.0004, ±0.30 K and ±0.1
kPa, respectively.
Page 99
Capítulo 4 99
Table 4.8
Experimental solid–liquid equilibrium data for trilaurin (1) + 1–octadecanol (7) for molar
fraction x, solid–solid transitions Ttrans, eutectic temperature Teut, melting temperature Tm,
transitions pure temperature Ttrans, pure and pressure p = 94.6 kPa.a
xtrilaurin Ttrans/K Teut/K Tm/K Ttrans, pure Solid phase
0.0000 331.34 330.44 1
0.1003 317.77 330.10 1
0.1988 318.21 329.07 1
0.2999 318.32 327.66 1
0.4006 318.85 326.48 1
0.4999 318.38 324.27 1
0.6010 318.96 322.67 1
0.6985 319.05 1
0.7996 318.48 1
0.8990 318.68 319.38 7
1.0000 319.67 295.42 7
a Uncertainties for molar fraction, temperature and pressure are ±0.0004, ±0.30 K and ±0.1
kPa, respectively.
Fig. 4.1 and Fig. 4.2 present the differential thermal curves and the phase diagrams,
respectively, obtained for system composed of trilaurin (1) + myristic acid (2). For this
mixture, only the thermal curve obtained for molar fraction of trilaurin 0.5003 presents one
peak. All the other thermal curves showed at least two thermal events. The first thermal event
at higher temperature occurs due to the sample melting and the second one is attributed to the
eutectic reaction. It is possible to note with the increase of the trilaurin molar fraction that the
peak at higher temperature, the melting sample peak, becomes closer to the peak of the
smallest temperature, the eutectic one, until the eutectic composition is reached, at
approximately 0.50. For trilaurin composition equal to 0.6009, it is possible to see two
overlapping peaks, the eutectic reaction peak and the melting sample peak, indicated by a
black arrow, and they begin to distance from each other again. This behavior of the thermal
curves is exactly the expected one for a phase diagram with an eutectic point.
Page 100
Capítulo 4 100
Fig. 4.1 Trilaurin (1) + myristic acid (2) system differential thermal curves.
Fig. 4.2 SLE phase diagram of the trilaurin (1) + myristic acid (2) binary mixture: (○) melting
temperature; (■) eutectic reaction temperature; (×) transition temperature of the pure
component.
The interesting fact of this phase diagram is observed for trilaurin composition of
0.7993. The vertical black line drawn in the thermal curves of Fig. 4.1 allowed to note a small
shift of the peak attributed to the eutectic reaction to a smaller temperature, at approximately
315.72 K, indicated by an open arrow. With the increase of trilaurin composition to 0.9019
Page 101
Capítulo 4 101
this shift became more pronounced, displaced to a temperature of 315.19 K. In truth this shift
represents a decrease of approximately 0.5 K in the eutectic temperature. For better
understand the displacement of the thermal event related to the eutectic reaction, the optical
microscopy was also used to evaluate the behavior of the mixture trilaurin (1) + myristic acid
(2) in the molar fractions of trilaurin 0.7993 and 0.9019 and the results are presented in Figs.
4.3 and 4.4, respectively.
Fig. 4.3 Optical micrographs of samples of trilaurin (1) + myristic (2) at x1= 0.7993 with (A)
314.15 K; (B) 315.75 K; (C) 317.15 K; (D) 319.15 K. Magnification of 20×.
Page 102
Capítulo 4 102
Fig. 4.4 Optical micrographs of samples of trilaurin (1) + myristic (2) at x1= 0.9019 with (A)
314.15 K; (B) 315.25 K; (C) 317.15 K; (D) 319.15 K. Magnification of 20×.
It is possible to see in (Fig. 4.3 (A)), molar fraction of trilaurin 0.7993, that the
mixture is in the solid phase at temperature of 314.15 K. With the increase of temperature to
315.25 K (Fig. 4.3 (B)), it is possible to observe that the sample starts the melting process
(highlighted by a black arrow) where solid myristic acid coexists with the liquid mixture.
With the continuous increase of the temperature the amount of liquid phase in micrographs
increases (Fig. 4.3 (B) and (C)) and finally at temperature 319.20 K (Fig. 4.3 (D)), the sample
is completely liquid. The presence of liquid from a temperature higher than 315.25 K
confirms that the peak temperature obtained by DSC experiments is an eutectic reaction.
The same behavior discussed before is observed for molar fraction of trilaurin 0.9019.
Once again DSC data showed two thermal events that were investigated by optical
microscopy presented in Fig. 4.4 (micrographs A to D). At the first temperature, 314.15 (Fig.
4.4 (A)), the mixture is in the solid phase. As the temperature was raised to 315.25 K (Fig. 4.4
(B)), it was observed the start of melting process indicated by black arrow where solid
myristic acid coexists with the liquid mixture, such melting process becomes more clear at
Page 103
Capítulo 4 103
temperature 317.15 K (Fig. 4.4 (C)) and, finally, at temperature equal to 319.15 K, (Fig. 4.4
(D)), the sample is completely liquid. The presence of liquid in the temperature 315.25 K
confirms that the peak temperature observed by DSC is an eutectic reaction. In this way, even
with the shift of the peak attributed to the eutectic temperature to the left it was not observed
anything that suggests that such a transition was not an eutectic reaction, on the contrary, it
was confirmed by optical microscopy images that show up liquid.
Fig. 4.5 and Fig. 4.6 present the phase diagrams and the differential thermal curves of
trilaurin (1) + palmitic acid (3) and trilaurin (1) + stearic acid (4), respectively. These phase
diagrams showed a very similar behavior when compared with the phase diagram of trilaurin
+ myristic acid. It is interesting to notice that the eutectic point is located at different mixture
composition of each phase diagram according to the length of the fatty acid carbon chain,
(Figs. 4.2, 4.5, 4.6).
Fig. 4.5 SLE phase diagram and differential thermal curves of the trilaurin (1) + palmitic acid
(3) binary mixture: (○) melting temperature experimental data; (■) eutectic reaction
temperature; (×) temperature of transition of pure component (—) hypothetical line.
Page 104
Capítulo 4 104
Fig. 4.6 SLE phase diagram and differential thermal curves of the trilaurin (1) + stearic acid
(4) binary mixture: (○) melting temperature experimental data; (■) eutectic reaction
temperature; (×) temperature of transition of pure component.
The enthalpies of the eutectic reaction were plotted as a function of sample
composition and are presented in Fig. 4.7 with the linear regression (r2 > 0.97). This plot, also
knowledge as Tammann plot, is used as a complement to determine the eutectic point and the
occurrence of a solid solution on the phase diagram [18, 28, 42]. The eutectic point is given
by intersection of experimental data linear regressions. In this way the eutectic composition of
the trilaurin + myristic acid (2) system, (Fig. 4.7 (A)) was approximately 0.53 in trilaurin
molar fraction and for trilaurin (1) + palmitic (3) system (Fig. 4.7 (B)) and for trilaurin (1) +
stearic acid (4) system (Fig. 4.7 (C)), the eutectic compositions were approximately 0.89 and
0.94 in trilaurin molar fraction, respectively. The Tammann plots of these systems show that
no solid solution occurs in none of phase diagram sides because the eutectic enthalpies values
tends to zero at the pure component compositions.
Page 105
Capítulo 4 105
Fig. 4.7 Tammann plots of mixture trilaurin + fatty acid: (A) trilaurin (1) + myristic acid (2), (B) trilaurin (1) + palmitic acid (3), (C) trilaurin (1)
+ stearic acid (4): (■) melting eutectic enthalpy, (—) Linear regression for data on and (---) hypothetical plot with a eutectic point.
Page 106
Capítulo 4 106
In the previous work of this research group [23], the behavior of triolein + myristic
acid binary mixture has been studied and it was observed the eutectic point very close to the
melting temperature of pure triolein. Replacing triolein by trilaurin in the mixture with
myristic acid, it can be observed the displacement of the eutectic point to the left, indicating
that both fatty acid or the triacylglycerol chain lengths influence the behavior of the mixture.
Summarizing, these phase diagrams presented at least four well-defined regions as can
be seen in Fig. 4.5: region A, above of the liquidus line of the phase diagram is composed of a
liquid phase; region B is a biphasic region on the left side of the eutectic point and is formed
by a liquid mixture in equilibrium with pure solid fatty acid; region C is formed by a liquid
mixture in equilibrium with pure trilaurin and it is located on the right side of the eutectic
point; and finally region D, below of the eutectic temperature, formed by a solid mixture of
both components.
Differential thermal curves and the phase diagram of the system trilaurin (1) + 1-
tetradecanol (5) are presented in Fig. 4.8, with some details highlighted, and in Fig. 4.9,
respectively. It is visible in the highlighted of Fig. 4.8 the occurrence of small peaks, indicated
by the arrows, in a composition range of 0.4005-0.7008. All of these small peaks were
represented in the phase diagram of Fig. 4.9 and they can be attributed to polymorphic
transitions of fatty compounds [43]. Besides of this small transitions, it is interesting to notice
the appearance of an exothermal event in the trilaurin molar fraction of 0.5802 that remains in
the thermal curves until pure trilaurin, an indication that 1-tetradecanol does not interfere in
the trilaurin crystallization.
Page 107
Capítulo 4 107
Fig. 4.8 Trilaurin (1) + 1-tetradecanol (5) system differential thermal curves.
Fig. 4.9 SLE phase diagram of the trilaurin (1) + 1-tetradecanol (5) binary mixture: (○)
melting temperature; (■) eutectic reaction temperature; (▲) mixture transition temperature;
(◊) mixture transition temperature; (∆) optical microscopy temperature; () temperature of
solid–solid transition (×) transition temperature of the pure component.
Other interesting point is the shift to the left of the peak at approximately 309.87 K
indicated by the vertical line in Fig. 4.8, as observed in the system formed by trilaurin (1) +
myristic acid (2) (Fig. 4.1). Unlike the previous phase diagrams, this one seems to be more
Page 108
Capítulo 4 108
complex and for better understanding of it, some microscopy optical images were acquired
and they are presented in Fig. 4.10 for trilaurin molar fractions of 0.8015 (micrographs A to
E) and 0.9007 (micrographs F to J), respectively.
Fig. 4.10 (A), captured at 307.15 K, shows that the mixture is in the solid phase. With
the increase in temperature to 308.85 K (Fig. 4.10 (B)), the mixture remains solid. This result
suggests that this temperature may not be attributed to the eutectic reaction, so this thermal
event was represented by a diamond shape symbol (◊) in Fig. 4.9. When the temperature was
increased to 311.15 K (Fig. 4.10 (C)), the mixture remains solid. At temperature 313.85 K
(Fig. 4.10 (D)), it is possible to observe the start of the melting process due to the rounded
shape of the crystals as indicated by the white arrows. This temperature was represented by a
triangle symbol (∆) in Fig. 4.9. When temperature reaches 317.15 K (Fig. 4.10 (E)) it is easier
to see the amount of liquid that is in equilibrium with a small amount of solid and in the
temperature of 318.25 K, the sample was completely liquid.
Page 109
Capítulo 4 109
Fig. 4.10 Optical micrographs of samples of trilaurin (1) + 1-tetradecanol (5) at x1= 0.8015 with (A) 307.15 K; (B) 308.85 K; (C) 311.15 K; (D)
313.85; (E) 317.15 K and trilaurin (1) + 1-tetradecanol (5) at x1= 0.9007 with (F) 307.15 K; (G) 313.15 K; (H) 316.15 K; (I) 318.85; (J) 319.45
K. Magnification of 20×.
Page 110
Capítulo 4 110
The same analysis was performed for trilaurin molar fraction of 0.9007. The beginning
of the melting was observed by optical microscopy in the temperature of 317.45 K (Fig. 4.10
(I)), highlighted by white arrow, approximately 8.6 K above the temperature indicated by
DSC. This result suggests that occurs a solid solution formation for trilaurin compositions
higher than 0.7, once that the result of microscopy shows the beginning of melting well above
the temperature of 308.85 K.
Furthermore to corroborate the optical microscopy results, the enthalpy of the
transition observed around 309 K was evaluated in function of system composition and are
presented in a Tammann plot (Fig. 4.11 (A)). According to the phase diagram of trilaurin (1)
+ 1-tetradecanol (5) (Fig. 4.9) the eutectic point occurs at a composition approximate of 0.1.
At this composition, the enthalpy value should be the maximum one and with the increase of
the trilaurin in the sample composition, the enthalpy value should decreases until zero when
the eutectic reaction ends. According to the Tammann plot, it happens in a composition
comprised between 0.5802 and 0.7008 of trilaurin. This behavior of enthalpies confirms the
occurrence of a solid solution in the trilaurin rich side of the phase diagram as indicated by
optical images and also justify the shift of the peak around 309 K to the left.
Page 111
Capítulo 4 111
Fig. 4.11 Tammann plots of mixture trilaurin + fatty alcohol: (A) trilaurin (1) + 1-tetradecanol (5), (B) trilaurin (1) + 1-hexadecanol (6), (C)
trilaurin (1) + 1-octadecanol (7): (■) melting eutectic enthalpy, (—) Linear regression for data on and (---) hypothetical plot with a eutectic point.
Page 112
Capítulo 4 112
Once that trilaurin (1) + 1-hexadecanol (6), +1-octadecanol (7) binary systems are
already reported in the literature [27], these data were compared to those obtained in this work
using the method described by Costa et al. [44]. Quadratic equations were adjusted to the
results of melting temperature from literature (r2 > 0.97). These equations obtained were used
to calculate the melting temperature in the same molar fraction of this work, and this
calculated melting temperature was compared to that obtained in this study. The ARD
between the calculated melting temperatures and those from this study was not higher than
0.25 for both systems, confirming that there is a good agreement between these experimental
data and those found in literature. It is also important to note the appearance of an exothermic
thermal event in the molar fraction of 0.7001 and in the 0.8080 for the system trilaurin + 1-
hexadecanol around of the temperature 298.00 K. Such thermal events can be related to the
transition temperature of the pure component 1-hexadecanol (Fig. 4.12 (A)), since these
temperatures are close.
The phase diagram of the trilaurin (1) + 1-hexadecanol (6) binary mixture Fig. 4.12
(A) is very similar to the phase diagram of trilaurin (1) + 1-tetradecanol (5) system, which
also presented a displacement of the thermal event to the left side, quantified around of 3.2 K
for the trilaurin molar fraction 0.9010. This decrease in the temperature suggests that these
thermal events cannot be attributed to the eutectic reaction and, once again, the solid solution
arises in the trilaurin rich side of the phase diagram. This result is also corroborated by the
Tammann plot presented in Fig. 4.11 (B). This same behavior was also observed and
discussed in previous study [23] for binary mixture triolein (1) + 1-decanol binary mixture.
The last system of this set of data trilaurin (1) + 1- octadecanol (7) (Fig. 4. 12 (B)) is simpler
than the previous two ones, exhibiting a simple eutectic behavior.
Table 4.9 shows the adjusted parameters and the root mean square deviation RMSD
(Eq. (4.2)) for three-suffix Margules and NRTL models. Both models adequately describe the
liquidus line of the studied systems, since the RMSD values obtained are small. It is
interesting to note that the three-suffix Margules and NRTL models present very similar
results concerning the eutectic temperature and composition.
Page 113
Capítulo 4 113
Fig. 4.12 SLE phase diagram of the binary mixtures: (A) trilaurin (1) + 1-hexadecanol (6) and (B) trilaurin (1) + 1-octadecanol (7): (○) melting
temperature experimental data; (■) eutectic reaction temperature; (▲) temperature of transition of mixture; () temperature of transition
exothermic; (×) temperature of transition of pure component.
Page 114
Capítulo 4 114
Table 4. 9
Adjusted parameters obtained for Margules three-suffix and NRTL models.
Systems Three-suffix Margules NRTL (α12=0.30) RMSD*
Aij (J mol-1
) Aij (J mol-1
) ∆gij (J mol-1
) Δgji (J⋅mol-1
) Three-suffix Margules NRTL
Trilaurin (1) + myristic acid (2) 85.3948 2739.0518 7635.3095 -2988.8745 0.4542 0.5381
Trilaurin (1) + palmitic acid (3) 933.1609 2837.2099 7449.1177 -1949.4388 0.4898 0.3815
Trilaurin (1) + stearic acid (4) -107.2032 3277.9216 7926.6448 -2640.9377 0.5817 0.6116
Trilaurin (1) + 1-tetradecanol (5) 1245.2955 3278.2949 5024.2551 -1243.1377 0.3175 0.3296
Trilaurin (1) + 1-hexadecanol (6) 2582.8254 2581.0402 1404.3492 1398.0762 0.2358 0.2348
Trilaurin (1) + 1-octadecanol (7) 2179.5742 781.5221 -1572.8387 4260.0485 0.2615 0.2477
* Eq. (4.2)
Page 115
Capítulo 4 115
4.4 Conclusions
Differential scanning calorimetry was used to construct the phase diagrams of trilaurin
(1) + myristic acid (2), + palmitic acid (3), + stearic acid (4), + 1-tetradecanol (5), + 1-
hexadecanol (6) and + 1-octadecanol (7) systems. The melting temperatures of the pure
compounds determined in this work are in good agreement with literature data. The phase
diagram of myristic acid, palmitic acid, stearic acid and 1-octadecanol presented simple
eutectic behavior with the trilaurin. In case of trilaurin (1) + 1-tetradecanol (5) and trilaurin +
1-hexadecanol (6) systems, the results indicate the formation of solid solution. The solid
solutions were also corroborated by optical microscopy and by Tammann plots. The liquidus
lines of systems studied were adequately described by three-suffix Margules and NRTL
models.
Acknowledgements
The authors wish to acknowledge CAPES, FAPESP (2008/56258-8 and 2012/05027-
1) and CNPq (483340/2012-0, 479533/2013-0, 309780/2014-4, 308616/2014-6 and
305870/2014-9) for their financial support.
Page 116
Capítulo 4 116
References
[1] R. da Silva, A. Ribeiro, F. De Martini Soares, I. Capacla, M. Hazzan, A. dos Santos, L.
Cardoso, L. Gioielli, Microstructure and thermal profile of structured lipids produced by
continuous enzymatic interesterification, J. Am. Oil Chem. Soc. 90 (2013) 631-639.
[2] F.D. Gunstone, J.L. Harwood, A.J. Dijkstra, The Lipid Handbook, third ed., CRC Press,
2007.
[3] F.G. Gandolfo, A. Bot, E. Flöter, Phase diagram of mixtures of stearic acid and stearyl
alcohol, Thermochim. Acta 404 (2003) 9-17.
[4] M.C. Costa, L.A.D. Boros, J.A. Souza, M.P. Rolemberg, M.A. Krähenbühl, A.J.A.
Meirelles, Solid-liquid equilibrium of binary mixtures containing fatty acids and
triacylglycerols, J. Chem. Eng. Data 56 (2011) 3277-3284.
[5] G.J. Maximo, M.C. Costa, A.J.A. Meirelles, Solid-liquid equilibrium of triolein with fatty
alcohols, Braz. J. Chem. Eng. 30 (2013) 33-43.
[6] N.D.D. Carareto, A.O. dos Santos, M.P. Rolemberg, L.P. Cardoso, M.C. Costa, A.J.A.
Meirelles, On the solid-liquid phase diagrams of binary mixtures of even saturated fatty
alcohols: systems exhibiting peritectic reaction, Thermochim. Acta 589 (2014) 137-147.
[7] T. Inoue, Y. Hisatsugu, M. Suzuki, Z. Wang, L. Zheng, Solideliquid phase behavior of
binary fatty acid mixtures: 3. Mixtures of oleic acid with capric acid (decanoic acid) and
caprylic acid (octanoic acid), Chem. Phys. Lipids 132 (2004) 225-234.
[8] L.H. Wesdorp, Liquid-multiple solid phase equilibria in fats - theory and experiments, in:
Chemicus, Delft University of Technology, Delft, 1990.
[9] L. Th De, R.V.D. Giessen, P. Overbosch, J.A.V. Meeteren, S.D. Jong, C. Peters, I.
Gandasasmita, E. Royers, M. Struik, P.M. Grootscholten, A. Don, L.H. Wesdorp, Liquid-
multiple solid phase equilibria in fats, in: Fat Crystal Networks, CRC Press, 2004, pp. 481-
709.
Page 117
Capítulo 4 117
[10] A.C.T. Teixeira, A.M.P.S. Gonçalves da Silva, A.C. Fernandes, Phase behaviour of
stearic acid-stearonitrile mixtures: a thermodynamic study in bulk and at the air-water
interface, Chem. Phys. Lipids 144 (2006) 160-171.
[11] D. Wei, S. Han, B. Wang, Solid-liquid phase equilibrium study of binary mixtures of n-
octadecane with capric, and lauric acid as phase change materials (PCMs), Fluid Phase
Equilibria 373 (2014) 84-88.
[12] F.J.A. Solís, B.C. Duran, Characterization of eutectic mixtures in different natural fat
blends by thermal analysis, Eur. J. Lipid Sci. Technol. 105 (2003) 742-748.
[13] C.P. Tan, Y.B. Che Man, Differential scanning calorimetric analysis of edible oils:
comparison of thermal properties and chemical composition, J. Am. Oil Chem. Soc. 77
(2000) 143-155.
[14] E. Gmelin, M. Sarge St, Calibration of differential scanning calorimeters, Pure Appl.
Chem. (1995) 1789.
[15] M.C. Costa, N.D.D. Carareto, A.J.A. Meirelles, Phase diagrams of binary fatty alcohol
fatty acid mixtures, in: International Congress on Engineering and Food, 2011.
[16] G.J. Maximo, M.C. Costa, J.A.P. Coutinho, A.J.A. Meirelles, Trends and demands in the
solid-liquid equilibrium of lipidic mixtures, RSC Adv. 4 (2014) 31840-31850.
[17] L. Ventolà, V. Metivaud, L. Bayés, R. Benages, M.Á. Cuevas-Diarte, T. Calvet, D.
Mondieig, The binary system tetradecanedioic acidehexadecanedioic acid: polymorphism of
the components and experimental phase diagram, Helvetica Chim. Acta 89 (2006) 2027-
2039.
[18] M.C. Costa, M.P. Rolemberg, A.J.A. Meirelles, J.A.P. Coutinho, M.A. Krähenbühl. The
solid-liquid phase diagrams of binary mixtures of even saturated fatty acids differing by six
carbon atoms, Thermochim. Acta 496 (2009) 30-37.
[19] M.C. Costa, Determinação Experimental do Equilíbrio Sólido-Líquido de Sistemas
Binários de Ácidos Graxos Saturados: Estudo Detalhado da Fase Sólida, (Doutorado) in:
Departamento de Processos Químicos - DPQ, Universidade Estadual de Campinas,
Campinas, Laboratório de Propriedades Termodinâmicas - LPT, 2008.
Page 118
Capítulo 4 118
[20] M.C. Costa, M.P. Rolemberg, L.A.D. Boros, M.A. Krähenbühl, M.G. de Oliveira, A.J.A.
Meirelles, Solid-liquid equilibrium of binary fatty acid mixtures, J. Chem. Eng. Data 52
(2007) 30-36.
[21] M.C. Costa, L.A.D. Boros, M.L.S. Batista, J.A.P. Coutinho, M.A. Krähenbüehl, A.J.A.
Meirelles, Phase diagrams of mixtures of ethyl palmitate with fatty acid ethyl esters, Fuel 91
(2012) 177-181.
[22] N.D.D. Carareto, M.C. Costa, M.P. Rolemberg, M.A. Krähenbühl, A.J.A. Meirelles, The
solid-liquid phase diagrams of binary mixtures of even saturated fatty alcohols, Fluid Phase
Equilibria 303 (2011) 191-198.
[23] F.C. Matos, M.C. Costa, A.J. Almeida Meirelles, E.A.C. Batista, Binary solid-liquid
equilibrium systems containing fatty acids, fatty alcohols and triolein by differential scanning
calorimetry, Fluid Phase Equilibria 404 (2015) 1-8.
[24] J.M. Prausnitz, R.N. Lichtenthaler, E.G. de Azevedo, Molecular Thermodynamics of
Fluid-phase Equilibria, third ed., Prentice Hall, 1998.
[25] G. Charbonnet, W.S. Singleton, Thermal properties of fats and oils, J. Am. Oil Chem.
Soc. 24 (1947) 140-142.
[26] M. Ollivon, R. Perron, Measurements of enthalpies and entropies of unstable crystalline
forms of saturated even monoacid triglycerides, Thermochim. Acta 53 (1982) 183-194.
[27] G.J. Maximo, M.C. Costa, A.J.A. Meirelles, The Crystal-T algorithm: a new approach to
calculate the SLE of lipidic mixtures presenting solid solutions, Phys. Chem. Chem. Phys.
16 (2014) 16740-16754.
[28] M.C. Costa, M. Sardo, M.P. Rolemberg, J.A.P. Coutinho, A.J.A. Meirelles, P. Ribeiro-
Claro, M.A. Krähenbühl, The solid-liquid phase diagrams of binary mixtures of consecutive,
even saturated fatty acids, Chem. Phys. Lipids 160 (2009) 85-97.
[29] J.L. Zeng, Z. Cao, D.W. Yang, F. Xu, L.X. Sun, L. Zhang, X.F. Zhang, Phase diagram of
palmitic acid-tetradecanol mixtures obtained by DSC experiments, J. Therm. Anal. Calorim.
95 (2009) 501-505.
Page 119
Capítulo 4 119
[30] P. Zhao, Q. Yue, H. He, B. Gao, Y. Wang, Q. Li, Study on phase diagram of fatty acids
mixtures to determine eutectic temperatures and the corresponding mixing proportions, Appl.
Energy 115 (2014) 483-490.
[31] J. Xing, Z.C. Tan, Q. Shi, B. Tong, S.X. Wang, Y.S. Li, Heat capacity and
thermodynamic properties of 1-hexadecanol, J. Therm. Anal. Calorim. 92 (2008) 375-380.
[32] C. Mosselman, J. Mourik, H. Dekker, Enthalpies of phase change and heat capacities of
some long-chain alcohols. Adiabatic semi-microcalorimeter for studies of polymorphism, J.
Chem. Thermodyn. 6 (1974) 477-487.
[33] G. Nichols, S. Kweskin, M. Frericks, S. Reiter, G. Wang, J. Orf, B. Carvallo, D.
Hillesheim, J. Chickos, Evaluation of the vaporization, fusion, and sublimation enthalpies of
the 1-alkanols: the vaporization enthalpy of 1-, 6-, 7-, and 9-heptadecanol, 1-octadecanol, 1-
eicosanol, 1-docosanol, 1-hexacosanol, and cholesterol at T = 298.15 K by correlation gas
chromatography, J. Chem. Eng. Data 51 (2006) 475-482.
[34] J.C. van Miltenburg, H.A.J. Oonk, L. Ventola, Heat capacities and derived
thermodynamic functions of 1-octadecanol, 1-nonadecanol, 1-eicosanol, and 1-docosanol
between 10 K and 370 K, J. Chem. Eng. Data 46 (2001) 90-97.
[35] G.J. Maximo, N.D.D. Carareto, M.C. Costa, A.O. dos Santos, L.P. Cardoso, M.A.
Krähenbühl, A.J.A. Meirelles, On the solid-liquid equilibrium of binary mixtures of fatty
alcohols and fatty acids, Fluid Phase Equilibria 366 (2014) 88-98.
[36] J. Reuter, A. Wurflinger, Differential thermal-analysis of long-chain n-alcohols under
high-pressure, Berichte Der Bunsen-Gesellschaft-Physical Phys. Chem. Chem. Phys. 99
(1995) 1247-1251.
[37] L. Ventola, T. Calvet, M.A. Cuevas-Diarte, M. Ramirez, H.A.J. Oonk, D. Mondieig, P.
Negrier, Melting behaviour in the n-alkanol family. Enthalpy-entropy compensation, Phys.
Chem. Chem. Phys. 6 (2004) 1786-1791.
[38] N. Garti, K. Sato, Crystallization and Polymorphism of Fats and Fatty Acids, first ed.,
Marcel Dekker, New York, 1989.
Page 120
Capítulo 4 120
[39] L. Ventolà, L. Bayés, R. Benages, F.J. Novegil-Anleo, M.Á. Cuevas-Diarte, T. Calvet,
D. Mondieig, Decanedioic acid (C10H18O4)/dodecanedioic acid (C12H22O4) system:
polymorphism of the components and experimental phase diagram, Helvetica Chim. Acta 91
(2008) 1286-1298.
[40] K. Sato, Crystallization behaviour of fats and lipids - a review, Chem. Eng. Sci. 56
(2001) 2255-2265.
[41] M. Elsabee, R.J. Prankerd, Solid-state properties of drugs .2. Peak shapeanalysis and
deconvolution of overlapping endotherms in differential scanning calorimetry of chiral
mixtures, Int. J. Pharm. 86 (1992) 211-219.
[42] G.G. Chernik, Phase equilibria in phospholipid-water systems, Adv. Colloid Interface.
Sci. 61 (1995) 65-129.
[43] M. Kellens, W. Meeussen, H. Reynaers, Crystallization and phase transition studies of
tripalmitin, Chem. Phys. Lipids 55 (1990) 163-178.
[44] M.C. Costa, M.A. Krähenbühl, A.J.A. Meirelles, J.L. Daridon, J. Pauly, J.A.P. Coutinho,
High pressure solideliquid equilibria of fatty acids, Fluid Phase Equilibria 253 (2007) 118-
123.
Page 121
Capítulo 5 121
CAPÍTULO 5
BINARY SOLID–LIQUID EQUILIBRIUM SYSTEMS CONTAINING
FATTY ACIDS, FATTY ALCOHOLS AND TRIMYRISTIN BY
DIFFERENTIAL SCANNING CALORIMETRY
Trabalho a ser submetido na revista Fluid Phase Equilibria
Flávio Cardoso de Matos a, Mariana Conceição da Costa
b, Antonio José de Almeida
Meirelles a, Eduardo Augusto Caldas Batista
a*
a Department of Food Engineering, School of Food Engineering, University of Campinas,
Campinas, Brazil
b Department of Processes and Products Design (DDPP ) - School of Chemical Engineering
(FEQ), University of Campinas (UNICAMP), 13083-852, Campinas, São Paulo, Brazil
* Corresponding author. Fax: +55 19 3521 4027. E-mail address: [email protected]
(E.A.C. Batista).
Page 122
Capítulo 5 122
ABSTRACT
The solid–liquid equilibrium (SLE) of five binary systems composed by trimyristin + fatty
acids (capric acid, lauric acid and stearic acid) and trimyristin + fatty alcohol (1-dodecanol
and 1-tetradecanol) were studied by differential scanning calorimetry (DSC) and some
mixtures by optical microscopy. The experimental data showed that the studied systems
present a monotectic behavior or an eutectic point very close to the pure fatty acid or fatty
alcohol. Trimyristin + capric acid or lauric acid systems and trimyristin + 1-dodecanol or 1-
tetradecanol systems exhibited a partial formation of solid solution. Experimental data were
used to adjust the parameters of the three-suffix Margules and NRTL models and the results
showed that these models can appropriately describe the liquidus lines of the above mentioned
systems.
Keywords: solid-liquid equilibrium (SLE), fatty systems, trimyristin, differential scanning
calorimetry (DSC), phase diagram, thermodynamic modeling.
5.1 Introduction
Vegetable oils and fats are mixtures of lipids constituted by triacylglycerols (usually >
95% of their total composition) and minor constituents, such as diacylglycerols,
monoacylglycerols, free fatty acids and fatty alcohols among others. Lipid mixtures are
known to exhibit a very complex melting behavior, due to the existence of a large variety of
crystalline forms, which depend on the crystallization conditions [1, 2]. The interest involving
this class of compounds is related to their physical properties such as texture, plasticity and
polymorphic forms, for example, which are relevant for food, chemical and pharmaceutical
industries [3-6]. The mixtures of lipids can also be used as surfactant and structuring agents
for emulsification with the ability of forming gel, and they are considered as phase change
materials (PCMs) for thermal storage processes [7-12]. The study of the physical properties of
lipid mixtures through thermal behavior is essential to understand the changes that occur
when the system is submitted to a temperature change during its processing. [2, 13-19].
Page 123
Capítulo 5 123
Solid–liquid equilibrium (SLE) studies of lipids and their mixtures can be used to
understand their physical properties, since these studies can provide basic information
regarding to the interaction among different carbon chains, which is the factor that influences
the thermodynamic properties. These properties can also contribute to a better understanding
of the process of crystallization, fractionation, phase development and stabilization of lipid
mixtures [13, 20-24]. In other words, the knowledge of SLE and physical properties can
particularly benefit the food industry since most foods contain fatty mixtures [25-27].
Differential Scanning Calorimetry (DSC) is often used for experimental measurements
of SLE. Although this technique is not an absolute way to measure equilibrium data because
the experiments are performed in a quasi-equilibrium condition, it is a usual to find
equilibrium phase diagrams measured by DSC in literature [13, 15, 28-35] with significant
accuracy in the results and advantages such as small amount of sample and relatively fast
analysis.
In the present study, the DSC technique was used to analyze the SLE behavior of the
following binary mixtures: trimyristin (1) + capric acid (2), trimyristin (1) + lauric acid (3),
trimyristin (1) + stearic acid (4), trimyristin (1) + 1-dodecanol (5) and trimyristin (1) + 1-
tetradecanol. Some thermal transitions were evaluated with the aid of optical microscopy
coupled with temperature controller. The parameters of the three-suffix Margules and the
NRTL models were adjusted to the experimental data to describe the liquidus lines of the
studied systems.
5.2 Experimental
5.2.1 Materials
Highly pure components were used in this study without further purification (Table 5.1). The
equipment calibration was performed using indium (≥ 0.99 molar fraction, CAS number
7440-74-6, certificated by PerkinElmer, USA), decane (≥ 0.99 molar fraction, CAS number
124-18-5), from Fluka Analytical (Germany) and cyclohexane (≥ 0.99 molar fraction, CAS
number 110-82-7), from Sigma-Aldrich (USA) standards, at heating rate of 1 K min-1
.
Page 124
Capítulo 5 124
Table 5.1
Sources and purities of standard compounds used this study.
Chemical name Source CAS number Mass fraction puritya
Trimyristin Nu-Chek (USA) 555-45-3 >0.990
Capric acid Sigma–Aldrich (USA) 334-48-5 >0.990
Lauric acid Sigma–Aldrich (USA) 143-07-7 >0.990
Stearic acid Nu-Chek (USA) 57-11-4 >0.99
1-dodecanol Fluka Analytical (Germany) 112-53-8 >0.985
a As reported by the supplier.
5.2.2 Preparation of the Binary Mixture Samples
The samples were prepared by mixing and melting under nitrogen atmosphere known
amounts of each substance to cover the entire range of the phase diagram in steps of 0.1 of the
molar fraction as described in a previous study [36]. For this set of binary systems, the
uncertainty of compositions, obtained by error propagation from values of the weighed
masses, was estimated as not higher than 4 × 10⁻⁴
(in molar fractions).
5.2.3 Differential Scanning Calorimetry
The experimental data were performed on a Differential Scanning Calorimeter (DSC
8500 PerkinElmer, USA) equipped with a cooling system and operated within the temperature
range from 248 K to 360 K. High-purity nitrogen (99.99%) was used as purge gas.
Experimental data were characterized at local room pressure p = 94.6 ± 0.1 kPa. A detailed
description of the experimental procedure in which the samples were submitted in the DSC
equipment was presented in a previous study [36].
Page 125
Capítulo 5 125
5.2.4 Optical Microscopy
An optical microscopy (Leica DM 2700 M, China) coupled with a temperature
controller (Linkam LTS 420, United Kingdom) was employed as described in a previous
study [36].
5.2.5 SLE Thermodynamic
Prausnitz et al. [24] presented a general equation to represent the SLE, disregarding
the solid-solid phase transitions and the molar heat capacities of pure components. This
equation can be rewritten as Eq. (5.1), as described in detail in our previous study [36].
1
1 i m,
i m,
i fus,
T
T
RT
H
xln
L
i
L
i (5.1)
where L
ix is the molar fraction of component i in the liquid (L) phase, L
i , the activity
coefficient of component i in the liquid phase, Hi,fus is the enthalpy of fusion at the
melting temperature of the compound i, i,mT is the melting temperature of the compound i,
)(T is the calculated temperature, and )(R is the universal gas constant. As described in
detail in our previous study [36], the activity coefficient was calculated by the three-suffix
Margules and the NRTL models.
5.3 Results and Discussion
Table 5.2 presents the thermal properties of the pure compounds obtained in this study
with experimental standard deviation in parenthesis and those reported in the literature. The
average relative deviations (ARD) of the melting temperatures and of the molar enthalpies of
fusion of pure components measured in this study (Γi, this study) and data found in literature
Page 126
Capítulo 5 126
(Γi,literature) were calculated according to Eq. (5.2), where (N) is the number of observations.
The ARD for the melting temperatures was equal to 0.15 %, confirming that there is a good
agreement between experimental data and those found in literature. Concerning to the molar
enthalpy of fusion, the ARD was equal to 4.35 %. Although this value is not as small as the
value found for the melting temperatures, it can be considered a good result, since only
comparing the literature data it is possible to note a significant difference ARD among them
(5.70%), particularly for trimyristin and lauric acid.
Thermal curves of fatty acids (lauric acid and stearic acid) and fatty alcohol (1-
dodecanol and 1-tetradecanol) present overlapping peaks with a light inflection very close to
the melting temperature. As previously reported in literature [28] the presence of overlapped
peaks possibly indicates the presence of a solid-solid transition overlapped to the melting
phenomena. Trimyristin presents two peaks, as can be seen in Fig. 5.1. The first peak, an
exothermic one with temperature equal to 313.06 K. can be ascribed to the crystallization of α
form [37, 38] and the second one, an endothermic peak with temperature equal to 330.93 K,
represents the full sample melting. Capric acid presents a unique well-defined peak, which is
attributed to its melting temperature.
1001
1
,
N
i studythis i,
literature i studythisi,
NARD (5.2)
Page 127
Capítulo 5 127
Table 5.2
Thermal properties for pure fatty components: transitions temperature (Ttrans), melting temperatures (Tm,i), molar enthalpy of fusion (∆Hfus,i) and
data from literature.
Ttrans / K Ttrans / K Tm,i / K ∆Hfus,i / (kJ.mol-1
)
Component This worka Literature This work
a Literature This
worka
Literature This
worka
Literature
Trimyristin 313.06
(± 0.11) b
- 331.38
(± 0.26)
330.90 [43] 144.02
(± 0.30)
141.97 [43]
- 330.25 [15] 146.80 [15]
- 330.20 [39] 152.49 [39]
Capric acid 305.11
(± 0.16)
305.28 [31] 27.33
(± 0.21)
28.20 [44]
304.25 [12] 27.22 [12]
304.95 [26] 28.60 [26]
Lauric 317.85
(± 0.10)
- 318.26
(± 0.49)
318.29 [22] 35.65
(± 0.85)
38.70 [22]
- 317.45 [40] 36.30 [40]
317.56 [29] 318.07 [29] -
- 316.15 [12] 35.46 [12]
Stearic acid
343.34
(± 0.07) 343.31 [44]
344.03
(± 0.12) 343.98 [44]
60.97
(± 0.30) 67.56 [44]
- 344.05 [45] 57.80 [45]
- 343.65 [41] 59.96 [41]
1-Dodecanol 291.01
(± 0.28) 291.10 [34]
296.55
(± 0.10) 296.57 [34]
297.48
(± 0.10) 297.84 [34]
41.74 (± 0.81)
-
- 296.95 [46] 38.42 [46]
Page 128
Capítulo 5 128
cont. Table 5.2
- 297.30 [47] 40.31 [47]
296.40 [42] 297.80 [42] 38.40 [42]
1-Tetradecanol
310.05
(± 0.38)
310.45
(± 0.10) [22]
311.20
(± 0.15)
311.39
(± 0.08) [22]
46.52
(± 0.32)
47.6
(± 1.0) [22]
310.79 [48] 311.21 [48] 49.51 [48]
- 311.15 [46] 45.66 [46] a Uncertainty of melting temperature and molar enthalpy of fusion ± 0.30 K and ± 0.04 kJ.mol
-1, respectively.
b Exothermic temperature.
Page 129
Capítulo 5 129
Phase diagrams of the binary mixtures formed by trimyristin (1) + capric acid (2),
trimyristin (1) + lauric acid (3), trimyristin (1) + stearic acid (4), trimyristin (1) + 1-dodecanol
(5) and trimyristin (1) + 1-tetradecanol (6) were determined by DSC and are presented in
Tables 5.3–5.7. All phase diagrams were plotted in a way that trimyristin is on the right side
of the phase diagrams and the peak top temperature was considered for all thermal events.
Fig. 5.1 shows the differential thermal curves obtained for the system trimyristin (1) +
capric acid (2). Two thermal events were observed in this mixture. The first thermal event,
occurring at a higher temperature, represents the full sample melting. The second one is
related to beginning of the melting process of the mixture, which is attributed to an eutectic
reaction or also known as solidus line. This event occurred at a lower temperature
approximately constant of 304.01 K (± 0.56 K).
Table 5.3
Experimental solid–liquid equilibrium data for trimyristin (1) + capric acid (2) for molar
fraction x, solid–solid transitions Ttrans, eutectic temperature Teut, melting temperature Tm,
transitions temperature of pure component Ttrans, pure and pressure p = 94.6 kPa.a
xtrimyristin Ttrans/K Teut/K Tm /K Ttrans, pure Solid phase
0.0000 305.11 2
0.0998 304.78 317.39 2
0.1991 304.18 321.81 2
0.2988 304.39 324.78 2
0.3975 304.26 326.31 2
0.4996 303.60 328.13 2
0.5984 304.21 328.32 2
0.6982 303.89 329.79 2
0.7956 302.79 330.20 2
0.8979 330.49 2
1.0000 331.38 313.06 1
a Uncertainties for molar fraction, temperature and pressure are ±0.0004, ±0.30 K and ±0.1
kPa, respectively.
Page 130
Capítulo 5 130
Fig. 5.1 Differential thermal curves of the trimyristin (1) + capric acid (2) system.
Fig. 5.2 shows the phase diagram of trimyristin (1) + capric acid (2) system.
According to the literature [49], this phase diagram presents a monotectic behavior or an
eutectic point very close to the pure capric acid, with the possible occurrence of a partial solid
solution on the extreme of the phase diagram rich in trimyristin. When the eutectic point
composition is located very close to the pure compound, the determination of eutectic point is
a very difficult task, due to the proximity of the thermal events which mostly results in
overlapped peaks. So, in order to confirm the solid solution formation the enthalpy values of
the eutectic reaction were plotted as a function of the sample composition. This plot, also
known as Tammann plot, is used as a complement to determine the eutectic point and the
occurrence of a solid solution on the phase diagram [36, 50]. The Tammann plot (Fig. 5.3)
showed that the enthalpy in the molar fraction of trimyristin of 0.0998 obtained the highest
value. With the increase of the molar fraction of trimyristin in the sample composition, the
enthalpy value decreases to a value very close to zero in a molar fraction of 0.7956, when the
eutectic reaction ends, indicating that above this molar fraction (0.7956) there is a solid
solution region. Similar behavior was also reported in previous studies [5, 36, 51].
Page 131
Capítulo 5 131
Fig. 5.2 SLE phase diagram of the trimyristin (1) + capric acid (2) binary mixture: (•) melting
temperature; (■) eutectic reaction temperature; (×) transition temperature of the pure
component, (—) three-suffix Margules; (−∙−) NRTL model.
Fig. 5.3 Tammann plot trimyristin (1) + capric acid (2) binary mixture.
Page 132
Capítulo 5 132
Phase diagram and the differential thermal curves of the trimyristin (1) + lauric acid
(3) system are presented in Fig. 5.4 (A) and (B), respectively. This phase diagram shows a
very similar behavior when compared with trimyristin + capric acid system. It is possible to
notice the occurrence of an invariant transition in a temperature around 314.16 K (± 0.83K)
attributed to an eutectic reaction, represented by symbol (■) in Fig. 5.4 (A). Other interesting
point to notice is the appearance of an exothermal event in the molar fraction of trimyristin of
0.2980 that remains in the thermal curves until pure trimyristin. So in order to confirm the
solid solution formation in the trimyristin (1) + lauric acid (3) system, the optical microscopy
images (Fig. 5.5) were captured for the molar fractions of trimyristin of 0.8010 (micrographs
A to D) and 0.9050 (micrographs E to H).
Page 133
Capítulo 5 133
Fig. 5.4 SLE phase diagram (A) and differential thermal curves (B) of the trimyristin (1) + lauric acid (3) binary mixture: (•) melting temperature
experimental data; (■) eutectic reaction temperature; (▲) temperature of transition of the mixture, (×) transition temperature of the pure
component, (◊) optical microscopy temperature, (—) three-suffix Margules model.
.
Page 134
Capítulo 5 134
The first micrograph (Fig. 5.5 (A)) was taken at a temperature 320.15 K, which is
above the eutectic temperature. It is possible to observe that the sample is completely solid
due to the dark color and irregular shape of the crystals. With the increase of temperature to
323.15 K (Fig. 5.5 (B)), it is possible to observe the beginning of the melting process due to
the rounded shape of the crystals as indicated by the white arrows. It is interesting to note the
change on the crystal shape as indicated by the black arrow. This temperature, 323.15 K, is
approximately 8.99 K higher than the eutectic temperature confirming the formation of a solid
solution in a region rich in trimyristin. The existence of only solid phase above of eutectic
temperature confirms the occurrence of a solid solution in the mixture. The beginning of the
melting process observed by optical microscopy was represented by a diamond shape symbol
(◊) in the phase diagram (Fig. 5.4 (A)). With the continuous increase of the temperature to
327.67 K the amount of liquid phase in micrograph increases (Fig. 5.5 (C)) and finally, at
temperature of 330.15 K (Fig. 5.5 (D)), the sample is completely melted.
The same analysis was performed for molar fraction of trimyristin of 0.9050. At first
temperature, 322.15 K (Fig. 5.5 (E)), the mixture is in the solid phase. This temperature is
approximately 7.99 K higher than the eutectic temperature of the system. The beginning of
the sample melting is observed just at 324.15 K (Fig. 5.5 (F)), as indicated by the white arrow.
With the increase of the temperature to 327.15 K the amount of the liquid phase in the image
also increases (Fig. 5.5 (G)), confirming the formation of a solid solution in the system and
finally the sample is completely melted at temperature of 330.15 K (Fig. 5.5 (H)).
Page 135
Capítulo 5 135
Fig. 5.5 Optical micrographs of samples of trimyristin (1) + lauric acid (3) at x1 = 0.8010 with (A) 320.15 K; (B) 323.15 K; (C) 327.67 K; (D)
330.15 K and trimyristin (1) + lauric acid (3) at x1 = 0.9050 with (E) 322.15 K; (F) 324.15 K; (G) 327.17 K; (H) 330.15 K. Magnification of
20×.
Page 136
Capítulo 5 136
The results are also corroborated by the Tammann plot presented in Fig. 5.7 (A),
which shows the highest value of enthalpy in the molar fraction of trimyristin equal to 0.0996.
With the increase of the molar fraction of trimyristin in the sample composition, the enthalpy
value decreases close to zero in a molar fraction of 0.8010, when the eutectic reaction ends,
indicating that above this molar fraction there is solid solution. This same behavior was also
observed in the literature for other binary fatty mixtures [11, 36, 52].
Table 5.4
Experimental solid–liquid equilibrium data for trimyristin (1) + lauric acid (3) for molar
fraction x, solid–solid transitions Ttrans, eutectic temperature Teut, melting temperature Tm,
transitions temperature of pure component Ttrans, pure and pressure p = 94.6 kPa.a
xtrimyristin Ttrans/K Teut/K Tm /K Ttrans, pure Solid phase
0.0000 318.26 317.85 3
0.0996 316.11 318.48 3
0.1996 315.06 321.63 3
0.2980 299.33 314.96 323.65 3
0.4000 299.92 314.88 325.78 3
0.4704 301.74 314.49 326.80 3
0.6001 301.19 313.66 328.01 3
0.7190 303.47 313.49 329.06 3
0.8010 300.65 329.73 3
0.9050 307.04 330.03 3
1.0000 331.38 313.06 1
a Uncertainties for molar fraction, temperature and pressure are ±0.0004, ±0.30 K and ±0.1
kPa, respectively.
The differential thermal curves and the phase diagram of the trimyristin (1) + stearic
acid (4) system are presented in (Fig. 5.6). The increase of trimyristin concentration causes a
gradual decrease of the melting temperature up to reaching the eutectic composition in the
molar fraction of 0.7, approximately, where a unique peak is observed.
All the other thermal curves showed at least two thermal events. In this case, eutectic
reaction occurred in the average temperature of 329.06 K (± 0.73 K). It is interesting to notice
the appearance of an exothermal event in the molar fraction of 0.7984 around the temperature
of 308.78 K that remains in the molar fraction of 0.8991. Such thermal event can be attributed
to an exothermic transition observed in the pure trimyristin, since these temperatures are
close. In this way the phase diagrams of trimyristin + fatty acids can be divided into four
different regions, the first region (A): above the liquidus line in which both compounds
Page 137
Capítulo 5 137
coexist in the liquid phase, two regions of solid-liquid equilibrium, being the first one (region
B), on the left side of the eutectic point, formed by a liquid mixture in equilibrium with a pure
solid (in this case, stearic acid) and the second one (region C) formed by a liquid mixture in
equilibrium with pure trimyristin located on the right side of the eutectic point and finally the
last region (region D) below the eutectic temperature, formed by a solid mixture of both
components.
Fig. 5.6 SLE phase diagram and differential thermal curves of the trimyristin (1) + stearic acid
(3) binary mixture: (•) melting temperature experimental data; (■) eutectic reaction
temperature; (▲) temperature of transition of pure component, (×) transition temperature of
the pure component, (—) three-suffix Margules model.
As previously discussed, the enthalpies of the eutectic reaction were plotted as a
function of sample composition (Tammann plot) and are presented in Fig. 5.7 with the linear
regression (r2 > 0.97). A triangular shape in the Tammann plot can occur when the phase
diagram has the behavior of a simple eutectic system (Fig. 5.7 (B)), in this case the enthalpies
of eutectic reaction linearly increasing up to reaching the eutectic point (point of the highest
value) and after that the enthalpies decrease also linearly. In this situation, the eutectic point is
given by interception of the linear regressions of the experimental data. For the trimyristin (1)
+ stearic acid (4) system (Fig. 5.7 (B)) the eutectic composition is approximately 0.70 in
molar fraction of trimyristin and no occurrence of solid solution, since both linear regressions
tend to zero in both sides of the Tammann plot.
Page 138
Capítulo 5 138
Table 5.5
Experimental solid–liquid equilibrium data for trimyristin (1) + stearic acid (4) for molar
fraction x, solid–solid transitions Ttrans, eutectic temperature Teut, melting temperature Tm,
transitions temperature of pure component Ttrans, pure and pressure p = 94.6 kPa.a
xtrimyristin Ttrans/K Teut/K Tm /K Ttrans, pure Solid phase
0.0000 344.03 343.34 4
0.0978 329.07 341.29 4
0.1985 330.24 340.25 4
0.2909 329.78 337.6 4
0.4001 329.13 334.55 4
0.4991 329.36 332.92 4
0.6003 327.62 330.17 4
0.6970 329.56 4
0.7984 308.01 328.95 329.61 1
0.8991 309.55 328.60 330.52 1
1.0000 331.38 313.06 1
a Uncertainties for molar fraction, temperature and pressure are ±0.0004, ±0.30 K and ±0.1
kPa, respectively.
Page 139
Capítulo 5 139
Fig. 5.7 Tammann plots: (A) trimyristin (1) + lauric acid (3), and (B) trimyristin (1) + stearic acid (4): (■) melting eutectic enthalpy, (—) Linear
regression for data.
Page 140
Capítulo 5 140
The differential thermal curves and the phase diagram of the trimyristin (1) + 1-
dodecanol (5) system are presented in Figs. 5.8 and 5.9, respectively. The vertical black line
drawn in the differential thermal curves of Fig. 5.8 allowed to note an invariant transition in a
temperature around 297.16 K (± 0.61K), attributed to an eutectic reaction in a composition
range of 0.1007 to 0.7594 represented by square symbol (■) in the phase diagram (Fig. 5.9).
As can be seen, the intensity of the peak attributed to the eutectic reaction tends to decrease
with trimyristin concentration increase, disappearing in 0.7594 of trimyristin mole fraction. It
is interesting to note that the intensity of the eutectic reaction showed similar behavior in the
molar fractions of trimyristin 0.48 to 0.76.
According to the phase diagram of trimyristin (1) + 1-dodecanol (5) system (Fig. 5.9)
a monotectic behavior or an eutectic point very close to the pure 1-dodecanol.
This behavior is an indication that this system presents solid solution transition, which
was confirmed by optical microscopy images (Fig. 5.10) in the same way of the previous
systems. It is possible to observe the sample in a solid state at 323.15 K (Fig. 5.10 (A)), a
temperature 26 K above the eutectic temperature. Liquid phase becomes perceptible at 325.15
K (Fig. 5. 10 (B)) and it is indicated in the phase diagram by diamond shaped symbol (◊). The
complete sample melting occurred at 331.15 K (Fig. 5.10 (D)), according to DSC results. So,
the optical microscopy images confirm the solid solution formation. Furthermore to
corroborate the optical microscopy results, the enthalpy values of the eutectic reaction were
evaluated in function of system composition and are presented in a Tammann plot (Fig. 5.13
(A)). It is interest to note in this figure that the enthalpy values were close in the molar
fractions of trimyristin from 0.48 to 0.76, where the intensities of the eutectic reaction were
similar. Above the molar fraction of trimyristin of 0.7594, there is a solid solution region.
Besides of eutectic transitions, it is interesting to notice the appearance of an
exothermal transition indicated by a dashed line drawn on the right side of the eutectic
reaction in Fig (5.8), in a composition range of 0.1007 to 0.5636. It is also possible to observe
the appearance of an exothermal event in 0.9350 of trimyristin molar fraction as indicated by
the black arrow, which can be related to the transition temperature of the pure trimyristin
since these temperatures are close.
Page 141
Capítulo 5 141
Fig. 5.8 Differential thermal curves of the trimyristin (1) + 1-dodecanol (5) system.
Page 142
Capítulo 5 142
Fig. 5.9 SLE phase diagram of the trimyristin (1) + 1-dodecanol (5) binary mixture: (•)
melting temperature experimental data; (○) exothermic temperature of transition; (■) eutectic
reaction temperature; (×) transition temperature of the pure component; (◊) optical
microscopy temperature, (—) three-suffix Margules model.
Fig. 5.10 Optical micrographs of samples of trimyristin (1) + 1-dodecanol (5) at x1 = 0.8795
with (A) 323.15 K; (B) 325.15 K; (C) 328.15 K; (D) 331.15 K. Magnification of 20×.
Page 143
Capítulo 5 143
Figs. 5.11 and 5.12 present the differential thermal curves and the phase diagram of
the trimyristin (1) + 1-tetradecanol (6) system, respectively. Since the thermal curves showed
many transitions below the melting temperature, a vertical black line was drawn to facilitate
the viewing of the invariant transition that occurred in the average temperature of 311.45 K
(±0,43 K) in a composition range of 0.1000 to 0.5011 represented by square symbol (■) in the
phase diagram (Fig. 5.12). This system showed a very similar behavior when compared with
the trimyristin + 1-dodecanol system. It is possible to observe the appearance of an
exothermal event in the molar fraction of trimyristin of 0.2 that remains in the thermal curves
until pure trimyristin. It is possible to observe the occurrence of small peaks too, indicated by
the black arrows, which were attributed to the polymorphic transitions [28, 53]. All of these
small peaks were represented in the phase diagram in Fig. 5.12. The presence of solid solution
transition is corroborated by the Tammann plot presented in Fig. 5.13 (B).
Fig. 5.11 Differential thermal curves of the trimyristin (1) + 1-tetradecanol (6) system.
Page 144
Capítulo 5 144
Fig. 5.12 SLE phase diagram and differential thermal curves of the trimyristin (1) + 1-
tetradecanol (6) binary mixture: (•) melting temperature experimental data; (■) eutectic
reaction temperature; (○) exothermic temperature of transition; (▲, ♦, +) endothermic
temperature of transition; (×) transition temperature of the pure component, (—) three-suffix
Margules model.
Table 5.6
Experimental solid–liquid equilibrium data for trimyristin (1) + 1-dodecanol (5) for molar
fraction x, solid–solid transitions Ttrans, eutectic temperature Teut, melting temperature Tm,
transitions temperature of pure component Ttrans, pure and pressure p = 94.6 kPa.a
xtrimyristin Teut/K Ttrans,exo / K Tm /K Ttrans, pure Ttrans, pure Solid phase
0.0000 297.48 291.01 296.55 5
0.1000 297.65 301.56 321.06 5
0.2000 297.95 303.37 323.73 5
0.2900 297.69 303.53 325.75 5
0.4000 297.43 301.24 327.33 5
0.4800 296.35 300.46 328.42 5
0.5600 297.31 300.36 328.74 5
0.6800 296.54 329.02 5
0.7600 296.36 329.50 5
0.8800 330.53 5
0.9400 330.98 5
1.0000 331.38 313.06 1
a Uncertainties for molar fraction. temperature and pressure are ±0.0004. ±0.30 K and ±0.1
kPa. respectively.
Page 145
Capítulo 5 145
Table 5.7
Experimental solid–liquid equilibrium data for trimyristin (1) + 1-tetradecanol (6) for molar fraction x. solid–solid transitions Ttrans, eutectic
temperature Teut., melting temperature Tm., transitions temperature of pure component Ttrans. pure and pressure p = 94.6 kPa.a
xtrimyristin Ttrans/K Ttrans/K Ttrans,exo / K Ttrans,exo / K Ttrans/K Ttrans/K Teut/K Tm Ttrans. pure Solid
phase
0.0000 311.27 309.93 6
0.1000 300.10 304.55 308.64 310.52 311.98 320.57 6
0.2000 304.11 304.53 307.05 309.88 311.19 324.75 6
0.3000 304.82 305.29 307.89 310.76 312.03 325.43 6
0.4004 303.10 310.13 311.33 326.62 6
0.5011 302.41 311.32 327.85 6
0.5999 302.34 310.84 328.05 6
0.7013 309.73 329.14 6
0.7970 309.54 329.75 6
0.9006 309.49 331.16 6
1.0000 331.38 313.06 1
a Uncertainties for molar fraction, temperature and pressure are ±0.0004. ±0.30 K and ±0.1 kPa, respectively.
Page 146
Capítulo 5 146
Fig. 5.13 Tammann plots of mixture trimyristin + fatty alcohol: (A) trimyristin (1) + 1-dodecanol (5), (B) trimyristin (1) + 1-tetradecanol (6), (■)
melting eutectic enthalpy, (—) Linear regression for data.
Page 147
Capítulo 5 147
Table 5.8 shows the adjusted parameters and the root mean square deviation RMSD
(Eq. (5.3)) for three-suffix Margules and NRTL models. Both models adequately describe the
liquidus line of the studied systems since the RMSD values obtained are small. It is
interesting to note that the three-suffix Margules and NRTL models present very similar
results concerning the eutectic temperature and composition.
N
i
cal
ii
N
TTRMSD
1
2exp
(5.3)
Page 148
Capítulo 5 148
Table 5.8
Adjusted parameters obtained for three-suffix Margules and NRTL models.
Systems
three-suffix Margules NRTL (α12=0.30) RMSD*
Aij (J mol-1
) Aji (J mol-1
) ∆gij (J mol-1
) Δgji (J⋅mol-1
) three-suffix
Margules NRTL
Trimyristin (1) + capric acid (2) -353.6972 2186.6826 7950.6091 -3184.0410 0.2507 0.2124
Trimyristin (1) + lauric acid (3) 727.0068 462.9964 -1585.9436 2722.1086 0.2340 0.2294
Trimyristin (1) + stearic acid (4) -514.89 2986.8247 -1173.1270 1064.1960 0.3606 0.6807
Trimyristin (1) + 1-dodecanol (5) 1925.3608 2691.4269 2999.0057 -190.0197 0.2506 0.2460
Trimyristin (1) + 1-tetradecanol (6) 1877.0974 2852.3193 3299.6171 -333.1315 0.3456 0.3468
* Eq. (5.3)
Page 149
Capítulo 5 149
5.4 Conclusions
Differential scanning calorimetry (DSC) was used to measure the differential thermal curves
of the trimyristin (1) + capric acid (2), the trimyristin (1) + lauric acid (3), the trimyristin (1) + stearic
acid (4), the trimyristin (1) + 1-dodecanol (5) and the trimyristin (1) +1-tetradecanol (6) systems for
the analyses of their solid-phase equilibrium behavior. This technique was able to measure the melting
temperatures of the pure compounds with a good agreement with the literature data.
All SLE phase diagram presented eutectic behavior. In case of the trimyristin (1) + capric (2),
the trimyristin (1) + lauric (3), the trimyristin + 1-dodecanol (5) and the trimyristin + 1-tetradecanol
(6) systems, the results indicated the formation of solid solution. The solid solutions were also
corroborated by optical microscopy and Tammann plots.
The increase in the carbon chain of the fatty acids, in the systems with trimyristin, resulted in
the displacement of the eutectic point in the phase diagrams. Such behavior was not observed in the
mixture of trimyristin with fatty alcohol.
The liquidus lines of the studied systems were described by the three-suffix Margules and
the NRTL models with a good agreement with the experimental data.
Acknowledgments
The authors wish to acknowledge CAPES. FAPESP (2014/21252-0 and 2012/05027-
1) and CNPq (305870/2014-9, 406856/2013-3 and 309780/2014-4) for their financial support.
Page 150
Capítulo 5 150
References
[1] M. Kellens, H. Reynaers, Study of the Polymorphism of Saturated Monoacid
Triglycerides I: Melting and Crystallization Behaviour of Tristearin, in: Lipid / Fett,
WILEY-VCH Verlag, 1992, pp. 94-100.
[2] F.D. Gunstone, J.L. Harwood, A.J. Dijkstra, The Lipid Handbook, Third Edition ed., CRC
Press, 2007.
[3] K. Sato, Crystallization behaviour of fats and lipids — a review, Chemical Engineering
Science, 56 (2001) 2255-2265.
[4] K. Sato, S. Ueno, Crystallization, transformation and microstructures of polymorphic fats
in colloidal dispersion states, Current Opinion in Colloid & Interface Science, 16 (2011)
384-390.
[5] M.C. Costa, L.A.D. Boros, M.P. Rolemberg, M.A. Kr henb hl, A.J.A. Meirelles,
Solid−Liquid Equilibrium of Saturated Fatty Acids + Triacylglycerols, Journal of Chemical
& Engineering Data, 55 (2010) 974-977.
6 M.C. Costa, L.A.D. Boros, J.A. Souza, M.P. Rolemberg, M.A. Kr henb hl, A.J.A.
Meirelles, Solid–Liquid Equilibrium of Binary Mixtures Containing Fatty Acids and
Triacylglycerols, Journal of Chemical & Engineering Data, 56 (2011) 3277-3284.
[7] D.F. Barbosa, P.A.P. Filho, Thermodynamic Modeling of Solid-Liquid Equilibrium of
Mixtures of Fatty Alcohols, Proceedings of the VI Brazilian Congress of Applied
Thermodynamics. Salvador - Bahia – Brazil, (2011).
[8] N.D.D. Carareto, T. Castagnaro, M.C. Costa, A.J.A. Meirelles, The binary (solid + liquid)
phase diagrams of (caprylic or capric acid) + (1-octanol or 1-decanol), The Journal of
Chemical Thermodynamics, 78 (2014) 99-108.
[9] M.C. Costa, N.D.D. Carareto, A.J.A. Meirelles, Phase diagrams of binary fatty alcohol +
fatty acid mixtures, in: International Congress on Engineering and Food, 2011.
[10] U. Domańska, J.A. González, Solid-liquid equilibria for systems containing long-chain
1-alkanols. II. Experimental data for 1-dodecanol, 1-tetradecanol, 1-hexadecanol, 1-
Page 151
Capítulo 5 151
octadecanol or 1-eicosanol + CCl4 or + cyclohexane mixtures. Characterization in terms of
DISQUAC, Fluid Phase Equilibria, 123 (1996) 167-187.
11 U. Domańska, J.A. González, Solid-liquid equilibria for systems containing long-chain
1-alkanols I. Experimental data for 1-dodecanol, 1-tetradecanol, 1-hexadecanol, 1-
octadecanol or 1-icosanol benzene or toluene mixtures. Characterization in terms of
DISQUAC, Fluid Phase Equilibria, 119 (1996) 131-151.
[12] D. Wei, S. Han, B. Wang, Solid–liquid phase equilibrium study of binary mixtures of n-
octadecane with capric, and lauric acid as phase change materials (PCMs), Fluid Phase
Equilibria, 373 (2014) 84-88.
[13] G.J. Maximo, M.C. Costa, J.A.P. Coutinho, A.J.A. Meirelles, Trends and demands in the
solid-liquid equilibrium of lipidic mixtures, RSC Advances, 4 (2014) 31840-31850.
[14] S. Bruin, T.R.G. Jongen, Food Process Engineering: The Last 25 Years and Challenges
Ahead, Comprehensive Reviews in Food Science and Food Safety, 2 (2003) 42-81.
[15] L.H. Wesdorp, Liquid-multiple solid phase equilibria in fats - theory and experiments.
Chemicus, Delft University of Technology., Delft, 1990.
[16] K.W. Won, Thermodynamic model of liquid-solid equilibria for natural fats and oils,
Fluid Phase Equilibria, 82 (1993) 261-273.
[17] I. Nor Hayati, Y.B. Che Man, C.P. Tan, I. Nor Aini, Thermal behavior of concentrated
oil-in-water emulsions based on soybean oil and palm kernel olein blends, Food Research
International, 42 (2009) 1223-1232.
[18] R.D. O'Brien, Fats and Oils Formulation, in: Fats and Oils, CRC Press, 2003.
[19] M. Takeuchi, S. Ueno, K. Sato, Synchrotron Radiation SAXS/WAXS Study of
Polymorph-Dependent Phase Behavior of Binary Mixtures of Saturated Monoacid
Triacylglycerols, Crystal Growth & Design, 3 (2003) 369-374.
[20] M. Benziane, K. Khimeche, A. Dahmani, S. Nezar, D. Trache, Experimental
determination and prediction of (solid plus liquid) phase equilibria for binary mixtures of
heavy alkanes and fatty acids, Mol. Phys., 110 (2012) 1383-1389.
Page 152
Capítulo 5 152
[21] A. Jakob, R. Joh, C. Rose, J. Gmehling, Solid-liquid equilibria in binary mixtures of
organic compounds, Fluid Phase Equilibria, 113 (1995) 117-126.
[22] G.J. Maximo, N.D.D. Carareto, M.C. Costa, A.O. dos Santos, L.P. Cardoso, M.A.
Kraehenbahl, A.J.A. Meirelles, On the solid-liquid equilibrium of binary mixtures of fatty
alcohols and fatty acids, Fluid Phase Equilibria, 366 (2014) 88-98.
[23] S.A. Rocha, R. Guirardello, Optimization Technique Applied for the Solid-Liquid
Equilibrium of Binary Fatty Mixtures, in: C.A.O.d.N. Rita Maria de Brito Alves, B. Evaristo
Chalbaud (Eds.) Computer Aided Chemical Engineering, Elsevier, 2009, pp. 711-716.
[24] D.W. Slaughter, M.F. Doherty, Calculation of solid-liquid equilibrium and crystallization
paths for melt crystallization processes, Chemical Engineering Science, 50 (1995) 1679-
1694.
[25] F. Tumakaka, I.V. Prikhodko, G. Sadowski, Modeling of solid–liquid equilibria for
systems with solid-complex phase formation, Fluid Phase Equilibria, 260 (2007) 98-104.
[26] T. Inoue, Y. Hisatsugu, M. Suzuki, Z. Wang, L. Zheng, Solid–liquid phase behavior of
binary fatty acid mixtures: 3. Mixtures of oleic acid with capric acid (decanoic acid) and
caprylic acid (octanoic acid), Chemistry and Physics of Lipids, 132 (2004) 225-234.
[27] S. Bruin, Phase equilibria for food product and process design, Fluid Phase Equilibria,
158–160 (1999) 657-671.
[28] L. Ventolà, V. Metivaud, L. Bayés, R. Benages, M.Á. Cuevas-Diarte, T. Calvet, D.
Mondieig, The Binary System Tetradecanedioic Acid–Hexadecanedioic Acid: Polymorphism
of the Components and Experimental Phase Diagram, Helvetica Chimica Acta, 89 (2006)
2027-2039.
[29] M.C. Costa, M.P. Rolemberg, A.J.A. Meirelles, J.A.P. Coutinho, M.A. Krähenbühl, The
solid–liquid phase diagrams of binary mixtures of even saturated fatty acids differing by six
carbon atoms, Thermochimica Acta, 496 (2009) 30-37.
[30] M.C. Costa, Determinação Experimental do Equilíbrio Sólido-Líquido de Sistemas
Binários de Ácidos Graxos Saturados: Estudo Detalhado da Fase Sólida, (Doutorado)
Page 153
Capítulo 5 153
Departamento de Processos Químicos - DPQ, Universidade Estadual de Campinas,
Campinas, Laboratório de Propriedades Termodinâmicas - LPT, 2008.
[31] M.C. Costa, M.P. Rolemberg, L.A.D. Boros, M.A. Krähenbühl, M.G. de Oliveira, A.J.A.
Meirelles, Solid−Liquid Equilibrium of Binary Fatty Acid Mixtures, Journal of Chemical &
Engineering Data, 52 (2007) 30-36.
[32] G.J. Maximo, M.C. Costa, A.J.A. Meirelles, Solid-liquid equilibrium of triolein with
fatty alcohols, Brazilian Journal of Chemical Engineering, 30 (2013) 33-43.
[33] M.C. Costa, L.A.D. Boros, M.L.S. Batista, J.A.P. Coutinho, M.A. Kraehenbuehl, A.J.A.
Meirelles, Phase diagrams of mixtures of ethyl palmitate with fatty acid ethyl esters, Fuel, 91
(2012) 177-181.
[34] N.D.D. Carareto, M.C. Costa, M.P. Rolemberg, M.A. Krähenbühl, A.J.A. Meirelles, The
solid–liquid phase diagrams of binary mixtures of even saturated fatty alcohols, Fluid Phase
Equilibria, 303 (2011) 191.e191-191.e198.
[35] E. Gmelin, M. Sarge St, Calibration of differential scanning calorimeters, in: Pure and
Applied Chemistry, 1995, pp. 1789.
[36] F.C. Matos, M.C. Costa, A.J. Almeida Meirelles, E.A.C. Batista, Binary solid–liquid
equilibrium systems containing fatty acids, fatty alcohols and triolein by differential scanning
calorimetry, Fluid Phase Equilibria, 404 (2015) 1-8.
[37] W. Fang, H. Mayama, K. Tsujii, Spontaneous Formation of Fractal Structures on
Triglyceride Surfaces with Reference to Their Super Water-Repellent Properties, The
Journal of Physical Chemistry B, 111 (2007) 564-571.
[38] B. Hong, D. Li, Q. Lei, L. Xu, W. Fang, H. Mayama, Kinetics on formation of super
water repellent surfaces from phase transformation in binary mixtures of trimyristin and
tripalmitin, Colloids and Surfaces A: Physicochemical and Engineering Aspects, 396 (2012)
130-136.
[39] G. Charbonnet, W.S. Singleton, Thermal properties of fats and oils, Journal of the
American Oil Chemists Society, 24 (1947) 140-142.
Page 154
Capítulo 5 154
[40] T. Inoue, Y. Hisatsugu, R. Ishikawa, M. Suzuki, Solid–liquid phase behavior of binary
fatty acid mixtures: 2. Mixtures of oleic acid with lauric acid, myristic acid, and palmitic acid,
Chemistry and Physics of Lipids, 127 (2004) 161-173.
[41] F.G. Gandolfo, A. Bot, E. Flöter, Phase diagram of mixtures of stearic acid and stearyl
alcohol, Thermochimica Acta, 404 (2003) 9-17.
[42] N.D.D. Carareto, A.O. dos Santos, M.P. Rolemberg, L.P. Cardoso, M.C. Costa, A.J.A.
Meirelles, On the solid–liquid phase diagrams of binary mixtures of even saturated fatty
alcohols: Systems exhibiting peritectic reaction, Thermochimica Acta, 589 (2014) 137-147.
[43] G.J. Maximo, M.C. Costa, A.J.A. Meirelles, The Crystal-T algorithm: a new approach to
calculate the SLE of lipidic mixtures presenting solid solutions, Physical Chemistry
Chemical Physics, 16 (2014) 16740-16754.
[44] M.C. Costa, M. Sardo, M.P. Rolemberg, J.A.P. Coutinho, A.J.A. Meirelles, P. Ribeiro-
Claro, M.A. Krähenbühl, The solid–liquid phase diagrams of binary mixtures of consecutive,
even saturated fatty acids, Chemistry and Physics of Lipids, 160 (2009) 85-97.
[45] A.C.T. Teixeira, A.M.P.S. Gonçalves da Silva, A.C. Fernandes, Phase behaviour of
stearic acid–stearonitrile mixtures: A thermodynamic study in bulk and at the air–water
interface, Chemistry and Physics of Lipids, 144 (2006) 160-171.
[46] T. Eckert, J. Müller, Zur Schmelzenthalpie und Schmelzentropie von Fettalkoholen,
Archiv der Pharmazie, 311 (1978) 31-34.
[47] R.C.F. Schaake, J.C. van Miltenburg, C.G. de Kruif, Thermodynamic properties of the
normal alkanoic acids II. Molar heat capacities of seven even-numbered normal alkanoic
acids, The Journal of Chemical Thermodynamics, 14 (1982) 771-778.
[48] C. Mosselman, J. Mourik, H. Dekker, Enthalpies of phase change and heat capacities of
some long-chain alcohols. Adiabatic semi-microcalorimeter for studies of polymorphism, The
Journal of Chemical Thermodynamics, 6 (1974) 477-487.
[49] R.E. Timms, Phase behaviour of fats and their mixtures, Progress in Lipid Research, 23
(1984) 1-38.
Page 155
Capítulo 5 155
[50] G.G. Chernik, Phase equilibria in phospholipid-water systems, Advances in Colloid
and Interface Science, 61 (1995) 65-129.
[51] F.C. de Matos, M.C. da Costa, A.J.D.A. Meirelles, E.A.C. Batista, Binary solid-liquid
equilibrium systems containing fatty acids, fatty alcohols and trilaurin by differential scanning
calorimetry, Fluid Phase Equilibria, 423 (2016) 74-83.
[52] R.-H. Kwon, J.-I. Kim, S.-J. Park, Y.-Y. Choi, Solid–liquid equilibrium, excess molar
volume, and deviations in the molar refractivity for the binary and ternary mixtures of
Alamine 304-1 with 1-octanol, 2-octanol, and 1-decanol, Fluid Phase Equilibria, 324 (2012)
44-49.
[53] L. Ventola, T. Calvet, M.A. Cuevas-Diarte, M. Ramirez, H.A.J. Oonk, D. Mondieig, P.
Negrier, Melting behaviour in the n-alkanol family. Enthalpy-entropy compensation, Physical
Chemistry Chemical Physics, 6 (2004) 1786-1791.
Page 156
Capítulo 6 156
CAPÍTULO 6
SOLID-LIQUID EQUILIBRIUM OF BINARY AND TERNARY
SYSTEMS COMPOSED BY TRIPALMITIN, TRISTEARIN AND
TRIBEHENIN
Trabalho a ser submetido na revista Fluid Phase Equilibria
Flávio Cardoso de Matosa, Mariana Conceição da Costa
b, Ana Paula Badan Ribeiro
c,
Guilherme Jose Maximoa, Antonio Jose de Almeida Meirelles
a, Eduardo Augusto Caldas
Batistaa,*
a Department of Food Engineering, School of Food Engineering, University of Campinas,
Campinas, Brazil
b Department of Processes and Products Design (DDPP ) - School of Chemical Engineering
(FEQ), University of Campinas (UNICAMP), 13083-852, Campinas, São Paulo, Brazil
*Corresponding author. Fax: +55 19 3521 4027. E-mail address: [email protected]
(E.A.C. Batista).
Page 157
Capítulo 6 157
ABSTRACT
Solid-liquid equilibrium of ternary mixture composed of tripalmitin, tristearin and tribehenin
and three binary mixtures composed of tripalmitin + tristearin, tripalmitin + tribehenin and
tristearin + tribehenin were studied by differential scanning calorimetry (DSC) and some
mixtures by optical microscopy. Experimental results for binary and ternary mixture showed a
partial formation of solid solution and eutectic transition. The activity coefficients of both
phases (solid and liquid) were calculated by two- and three-suffix Margules models and the
results showed that these models can appropriately describe the systems mentioned above.
Keywords: solid-liquid equilibrium (SLE), fatty systems, differential scanning calorimetry
(DSC), phase diagram, thermodynamic modeling.
6.1 Introduction
It is well known the importance of triacylglycerols in our daily food as the major
constituents of oils and fats representing approximately 95% of their total composition [1].
According to Smith et al. [2] the processing characteristics and final properties of fat
based products depend greatly on the composition, crystallization, and melting properties of
the fat or fats involved. Two approaches may be taken to gain an understanding of the
relationship between the triacylglycerol (TAG) composition of a fat and its intrinsic
properties. In the first approach, triacylglycerols can be added or removed from a natural fat
with the observation in the change of its properties. In this case, the disadvantage is that it is
virtually impossible to remove one single component leaving the others unchanged. Even
after the removal of one component, the fat will still consist of many TAG, forming a
complex system of interactions. Of course, it is possible to add pure components to a fat in
order to explore their effects but, again, other minor components in the original fat may
modify the influence. The second approach, pure components (e.g., TAG) can be combined
into blends to yield simple model systems. It is immediately clear that compositions identical
to that of natural fat cannot be achieved by simple blending. However, as shown by the
Unilever patents [3, 4], blends with similar physical behaviors can be found.
Page 158
Capítulo 6 158
It has been noticed in literature that, depending on crystallization conditions,
triacylglycerols can exhibit a very complex melting behavior, due to the existence of a variety
of crystalline forms attributed to a particularly complex polymorphic behavior [5-7]. It brings
as a consequence a complex thermal behavior for the solid-solid or the solid-liquid transitions
[8, 9] as well as changes in physical properties (e.g., melting, morphology, texture, and
rheology) of fats and vegetable oils. These properties of fats and oils t are also influenced by
the intersolubility of their main triacylglycerols [10-12]. By example, in food processing, the
sensory properties, such as rheological properties and texture, are closely related to the
structures of their fat crystal networks in foods [13].
Due to the importance of triacylglycerols and their mixtures in industrial applications and
also in our daily life, the study of their physical properties contributes in the knowledge of the
phase transitions and crystallizations of these substances or, in other words, their thermal
behavior when the system is submitted to a temperature cycle during their processing [1, 9,
14-17]. The most common techniques used to study crystal structure, phase transitions and
microstructure of lipid mixtures are Differential Scanning Calorimetry (DSC), X-ray
diffraction (XRD) and polarized light microscopy (PLM) which are also important for
developing purification, fractionation and crystallization steps in various industrial processes
[8, 18-22].
The aim of this study was the analyses of the solid-liquid equilibrium (SLE) of the binary
systems composed by triacylglycerols: tripalmitin (1) + tristearin (2), tripalmitin (1) +
tribehenin (3) and tristearin (2) + tribehenin (3) and also the ternary mixture with the same
compounds employing DSC technique. Some thermal transitions were evaluated with the aid
of an optical microscopy coupled with a temperature controller.
6.2 Experimental section
6.2.1 Materials
The DSC equipment was calibrated using the standards: indium (≥ 0.99 molar fraction,
CAS number 7440-74-6, certificated by PerkinElmer, USA), decane (≥ 0.99 molar fraction,
CAS number 124-18-5), from Fluka Analytical (Germany) and cyclohexane (≥ 0.99 molar
Page 159
Capítulo 6 159
fraction, CAS number 110-82-7), from Sigma-Aldrich (USA), at heating rate of 1 K min-1
.
Triacylglycerols used in this study without further purification are presented in Table 6.1.
Table 6.1
Sources and purities of standard compounds used this study.
Chemical name Source Mass fraction puritya CAS number
Molecular
weight
(kg.kmol-1
)
Tripalmitin Nu-Chek > 0.99 555-44-2 807.3290
Tristearin Nu-Chek > 0.99 555-43-1 885.4321
Tribehenin Nu-Chek > 0.99 18641-57-1 1059.799 a As reported by the supplier.
6.2.2 Preparation of binary and ternary mixture samples
Three binary mixtures composed of tripalmitin (1) + tristearin (2), tripalmitin (1) +
tribehenin (3) and tristearin (2) + tribehenin (3), as well as the ternary mixture formed by
tripalmitin (1) + tristearin (2) + tribehenin (3) were prepared by mixing and melting, under
nitrogen atmosphere, known amounts of each substance to cover the entire range of the phase
diagram in steps of 0.1 in the molar fraction, as described in a previous study [18]. In order to
evaluate the ternary system, it was decided keeping the content of tripalmitin constant while
the contents of tristearin and tribehenin were changed. For this set of binary and ternary
systems, the uncertainty of compositions, obtained by error propagation from values of the
weighed masses, was estimated as not higher than 4 × 10⁻⁴
and 6 × 10⁻⁴
(in molar fractions),
respectively.
6.2.3 Differential scanning calorimetry
The experimental data were performed on a Differential Scanning Calorimeter (DSC
8500 PerkinElmer, USA) equipped with a cooling system and operated within the temperature
range from 273.15 K to 373.15 K. Approximately 3.0 – 6.0 (±0.2) mg of sample was placed in
Page 160
Capítulo 6 160
an aluminum DSC pan and hermetically sealed. The samples were cooled and heating at a rate
of 1 K min-1
. The experiments were performed under nitrogen atmosphere (99.99 %) that was
used as purge gas in a flux of 20 mL.min-1
. Experimental data were characterized at local
room pressure p = 94.6 ± 0.1 kPa. A detailed description of the experimental procedure in
which the samples were submitted in the DSC cell was presented in a previous study [18].
6.2.4 Optical microscopy
Optical microscopy (Leica DM 2700 M, China) coupled with a temperature controller
(Linkam LTS 420, United Kingdom) was used to evaluate the behavior of the solid-liquid
transition of some mixtures, as described in a previous study [19]. The images were acquired
at each 0.1 K.
The polarized light microscopy was used to evaluate the crystalline arrangements
present in some compositions in the phase diagram. After melting, the samples were
submitted to a cooling rate of 5 K.min-1
. All the micrographs were obtained with
magnification of 20 times.
6.2.5 SLE thermodynamic modeling
Prausnitz et al. [23] presented and explained the thermodynamic model, Equation
(6.1), to describe the solid-liquid equilibrium.
T
T
R
cp
T
T
R
cp
T
T
RT
H
T
T
RT
H
x
x iiitrans
itrans
itransifus
L
i
L
i
S
i
S
i i m,i m,,
,
,i m,
i m,
,ln111ln
(6.1)
where L
ix and S
ix are the molar fraction of component i in the liquid (L) phase and solid
(S), respectively, S
i and L
i , are the activity coefficient of component i in the liquid and
solid phase, respectively, Hi,fus is the melting enthalpy of the pure compound i,
i m,T is the
melting temperature of such a compound, Hi,trans is the solid-solid transition enthalpy and
Page 161
Capítulo 6 161
itransT , is the temperature of such a solid-solid transition temperature. Also, the last two terms
of opposite signs on the right side of the equation tend to cancel each other, especially if the
temperatures i m,T and T are close [23].
For both, binary and ternary phase diagram, the liquidus line that represents the
melting temperature of the system, and the solidus lines that represents the temperature in
which the first crystal of the mixture melts, were calculated by using the Crystal-T algorithm,
as described by Maximo et al. [24]. For the description of the SLE of the binary systems, the
nonidealities of both phases were calculated using two-suffix Margules or three-suffix
Margules equations. The nonideality descriptions of the solid and the liquid phases of the
ternary mixture were performed using two-suffix Margules model expanded for a ternary
system [25] according to Equations (6.2)-(6.4).
32231312
3
313
2
2121 )(ln xxAAAxAxART (6.2)
31232312
3
323
2
1122 )(ln xxAAAxAxART (6.3)
21122313
3
223
2
1133 )(ln xxAAAxAxART (6.4)
where R is the universal gas constant, Aij is the adjustable parameters of the binary i and j, T is
the temperature and xi is the molar fraction of component i.
6.3 Results and Discussion
Table 6.2 presents the thermal properties of pure tripalmitin, tristearin and tribehenin
obtained in this study the experimental standard deviation in parenthesis together with the
data reported in the literature and. The average relative deviation (ARD) was calculated for
melting temperatures of the pure components determined in this study (Tstudy,i) and the data
found in literature (Tliterature,i) by Equation (6.5). The ARD was equal to 0.35%, confirming
that there is a good agreement between the experimental data and those found in literature.
Page 162
Capítulo 6 162
100T
TT
N
1ARD
N
1I istudy,
i,literatureistudy,
(6.5)
where N is the number of observations.
It is already known that depending on the crystallization conditions, fatty compounds
can exhibit a complex melting behavior that can occur in different crystalline states, each
form being characterized by one polymorphic form [26]. Among all polymorphic forms
reported in the literature by Sato [6] and Ventola et al. [27, 28], three forms are widely
discussed to triacylglycerols: alpha (α), beta prime (β') and beta (β) forms. The α-form is an
unstable one and has the lowest melting temperature, β'-form is a metastable one with an
intermediate melting temperature and the β-form, the most stable one, is the last to melt in a
heating procedure [6, 29, 30].
Fig. 6.1 shows differential thermal curves obtained during cooling and heating runs of
the pure triacylglycerols. The cooling curves of pure compounds showed one single
exothermic thermal event to which is attributed the crystallization of tripalmitin, tristearin and
tribehenin that are 315.75 K, 328.88 K and 338.50 K, respectively. The crystallization
temperatures of pure compounds determined in this study are in a good agreement with the
values cited by literature [5, 26, 31, 32].
During the heating run, tripalmitin and tristearin showed a similar melting behavior as
can be observed in Fig. 6.1 (a) and (b). Both compounds present an endothermic event that,
according to the literature [5, 31] is related to the melting of the α-form followed by two
exothermic events that are related to the recrystallization of the β-form [11, 33, 34]. With the
increase in temperature a last endothermic event, related to the complete melting of the β-
form [11, 33] can be observed. According to the literature this behavior occurs due to the
quickly α-form transformation to the β-form without crystallizing in β'-form [5, 31, 35-37].
The heating run of tribehenin (Fig. 6.1(c)) showed two endothermic events. According to
Pivette et al. [32], the first thermal event is related to the melting of the α-form and the second
one is related to the melting of the β-form. The same behavior was observed by Wesdorp [38].
Page 163
Capítulo 6 163
Table 6.2
Thermal properties of pure triacylglycerols determined in this study and from literature data: transition temperature (Ttrans), melting temperature
(Tm).
Ttrans (K) Ttrans (K) Ttrans (K) Tm (K)
This study a Literature This
study a
Literature This study a Literature This study
a Literature
Tripalmitin 318.71
(± 0.27)
318.42 [39] 319.11b
(± 0.25)
319.10 [39] 320.24b
(± 0.23)
320.62 [39] 339.47
(± 0.47)
338.82 [39]
318.15-
318.65 [31]
320.15 [31] 325.15 [31] 339.15 [31]
318.15 [5] 322.15 [5] 324.15 [5] 340.15 [5]
317.15 [40] 320.15b [40] 326.15
b [40] 338.15 [40]
Tristearin 328.73
(± 0.10)
328.26 [39] 329.33b
(± 0.11)
329.53b [39] 332.42
b
(± 0.11)
332.33[39] 345.81
(± 0.10)
345.76 [39]
328.45c [26] - -- 344.35c [26]
328.27 [20] 329.51 [20] 332.33 [20] 345.27 [20]
Tribehenin 341.77b
(± 0.21)
342.25 [38] 354.20
(± 0.15)
354,85 [38]
342.85c[32] 357.75c[32]
340.55 [8] 355.45 [8] a Uncertainty of melting temperature and molar enthalpy of fusion ± 0.30K and ± 0.04 kJ.mol
-1, respectively.
b Temperature of transition exothermic peak.
c onset temperature.
Page 164
Capítulo 6 164
Fig. 6.1 Differential thermal curves of the pure components studied: (a) tripalmitin, (b) tristearin, (c) tribehenin.
Page 165
Capítulo 6 165
6.3.1 Binary Mixtures
SLE of the binary mixtures formed by tripalmitin (1) + tristearin (2), tripalmitin (1) +
tribehenin (3) and tristearin (2) + tribehenin (3) were determined and the experimental data
obtained are presented in Tables 6.3–6.5.
It is important to mention that the liquidus lines of tripalmitin (1) + tristearin (2) [7]
and tripalmitin (1) + tribehenin (3) and tristearin (2) + tribehenin (3) binary mixtures [26]
were already presented in the literature but all of them were studied again to check the
melting temperatures and also to determine the solid transitions temperatures not presented
for tripalmitin (1) + tribehenin (3) and tristearin (2) + tribehenin (3) binary mixtures.
The triacylglycerol will be identified as follows: PPP for tripalmitin, SSS for tristearin
and BBB for tribehenin.
Following the considerations assumed in our previous works [18, 39, 41] , the thermal
events of higher temperature are related to the complete sample melting and the thermal
events below the melting temperature are linked to transition temperatures of the systems that
can be eutectic or peritectic reactions, for example. Upon heating, several endothermic and
exothermic thermal events were observed in all differential thermal curves, as can be seen in
the supplementary material.
Fig. 6.2 presents the SLE phase diagram of the binary mixtures determined in this
study along with the melting temperatures of the same systems found in the literature which
are represented by an open square (□). Also in the same figure, the micrographs of three
compositions for each binary system at room temperature, obtained after crystallization in a
cooling rate of 5 K.min-1
from sample melting temperature.
Moreover, the modeling results obtained using three-suffix Margules for the
calculation of the liquidus and solidus lines are presented. Through experimental data it is
possible to observe the occurrence of a partial miscibility close to the pure tristearin and
tribehenin. This figure makes possible to visualize how close the data from this study and
from literature are, showing that there is a good agreement between the melting temperatures
obtained in this study and those from literature. Moreover, to quantify the deviation a
comparison between results from this study and from the literature [30, 39] was performed
according to the method used by Costa et al. [42].
Page 166
Capítulo 6 166
Initially, an equation was adjusted to correlate the melting temperatures from literature
to their compositions. From this equation it was possible to compare the experimental melting
temperature from this study with the calculated one using the experimental molar fraction. In
this way, the average relative deviation (ARD) between our melting temperatures and the
calculated ones were calculated. The ARD value was 0.2 % for tripalmitin (1) + tristearin (2)
and 0.51 % and 0.81 % for tripalmitin (1) + tribehenin (3) and tristearin (2) + tribehenin (3),
respectively. These results confirm that there is a good agreement between these experimental
data and those found in literature.
Fig. 6.2 (a) for tripalmitin (1) + tristearin (2) system shows that the increase of
tripalmitin concentration causes a gradual decrease of the melting temperature up to reaching
the eutectic composition in the tripalmitin molar fraction (xPPP) close to 0.7. After the eutectic
composition the melting temperature of the binary mixture increases again, as expected for a
system that exhibits a phase diagram with a simple eutectic point, although, according to
Costa et al. [39] and also confirmed in this study through optical microscopy images (see
Supplementary Materials), the tripalmitin (1) + tristearin (2) system presents a solid solution
in the extremity rich in tristearin of the phase diagram.
Fig. 6.2 (b), in turn, presents the phase diagram of the tristearin (2) + tribehenin (3)
system. This phase diagram showed a very similar behavior when compared with that of
tripalmitin (1) + tristearin (2) system (Fig. 6.2 (a)). It is possible to observe the occurrence of
an invariant transition in an average temperature around 343.06 K (± 0.71 K) attributed to an
eutectic reaction represented by (▲) in Fig. 6.2 (b) wherein the eutectic point composition of
tristearin is xSSS ≈ 0.9. This eutectic reaction takes place just for molar fraction of tristearin
xSSS ≥ 0.4, so in order to confirm the solid solution formation in this system the optical
microscopy images were captured for the tristearin molar fractions of 0.0992 and 0.7000 and
they are presented in Figs. 6.3 and 6.4, respectively.
Page 167
Capítulo 6 167
Fig. 6.2 SLE phase diagram of the binary mixtures: (a) tripalmitin (1) + tristearin (2), (b)
tristearin (2) + tribehenin (3) and (c) tripalmitin (1) + tribehenin (3), (xPPP) molar fraction of
tripalmitin, (xSSS) molar fraction of tristearin, (xBBB) molar fraction of tribehenin. This study:
(●) experimental melting temperature data; (▲) eutectic reaction temperature; (×)
temperature of exothermic transition of mixture; (■, ♦,,+,▼) temperature of endothermic
transition; (○) temperature of endothermic transition of pure component, (Δ) temperature of
exothermic transition of pure component, (◊) temperature observed by optical microscopy.
Literature results: (a) Costa et al. [26] (□) melting temperature; (b) and (c) Wesdorp [7] (□)
melting temperature. Three-suffix Margules for solidus and liquidus lines.
It is possible to observe that in Fig. 6.3 (a) at 352.15 K that the sample is completely
solid due to the dark color and irregular shape of the crystals. With the increase of
temperature to 353.35 K (Fig. 6.3 (b)), it is possible to note that the melting process started
due to some small changes in the color and crystals shape that are indicated by black arrows.
This temperature, in which the beginning of the melting process was observed, is
Page 168
Capítulo 6 168
approximately 7 degrees higher than the eutectic temperature (343.06 K (± 0.71 K)) which
confirms the formation of a solid solution in this phase diagram in a region rich in tribehenin.
The beginning of the melting process was represented by (◊) in the phase diagram (Fig. 6.2
(b)). With the continuous increase of the temperature to 354.15 K, the amount of liquid phase
in micrograph increases (Fig. 6.3 (c)) and finally, at temperature of 355.55 K (Fig. 6.3 (d)),
the sample exists as a liquid phase. The same analysis was performed for molar fraction of
tristearin xSSS = 0.7000 and the optical microscopy images are presented in Fig. 6.4. In these
images, it is possible to note the presence of liquid at 343.35 K (Fig. 6.4 (b)), a temperature
very close to that attributed to the eutectic temperature, corroborating that the invariant
transition observed at 343.06 K (± 0.71 K) is due to an eutectic reaction.
Fig. 6.3 Optical micrographs of samples of tristearin (2) + tribehenin (3) with xSSS= 0.0992 at
(a) 352.15 K; (b) 353.35 K; (c) 354.15 K; (d) 355.55 K. Magnification of 20×.
Page 169
Capítulo 6 169
Fig. 6.4 Optical micrographs of samples of tristearin (2) + tribehenin (3) with xSSS= 0.7000 at
(a) 342.15 K; (b) 343.15 K; (c) 344.15 K. Magnification of 20×.
The phase diagram of tripalmitin (1) + tribehenin (3) system is presented in Fig. 6.2
(c) and it seems to have an eutectic point close to pure tripalmitin, as previously observed by
us in other studies formed by fatty compounds [18, 20, 39]. Once again, the transition
attributed to eutectic reaction at the 338.93 K (± 0.89 K), represented by triangle symbol (▲),
is observed just for compositions in molar fraction of tripalmitin (xPPP) higher than 0.4,
suggesting the existence of solid solution formation in a region rich in tribehenin. The optical
microscopy images were acquired for xPPP = 0.1000 and xPPP = 0.7008 and confirm this
hypothesis, as can be checked in Fig. 6.5.
It is possible to observe in Fig. 6.5 (a), acquired at 352.15 K, that the sample is in a
solid state even 14 K above the temperature attributed to eutectic one (338.93 K (± 0.89 K)).
The beginning of the sample melting is observed just at 353.15 K in Fig. 6.5 (b) and the
amount of liquid in the image increase with the increase of the temperature (Fig. 6. 5 (c)),
obeying the lever rule and confirming the formation of solid solution also in this system. On
the other hand, for xPPP = 0.7008, the presence of liquid can be noted at 336.95 K (Fig. 6. 5
(f)), confirming that this transition is really an eutectic reaction.
Page 170
Capítulo 6 170
Fig. 6.5 Optical micrographs of samples of tripalmitin (1) + tribehenin (3) with xPPP = 0.1000 at (a) 352.15 K; (b) 353.15 K; (c) 354.65 K; (d)
355.65; and tripalmitin (1) + tribehenin (3) with xPPP = 0.7008 at (e) 336.65 K; (f) 336.95 K; (g) 338.65 K; (h) 347.15. Magnification of 20×.
Page 171
Capítulo 6 171
It is possible to observe in the micrographs obtained in the polarized light microscopy
of Fig. 6.2 the difference between crystals network in each molar fraction. All cases presented
an increase in the number of crystals in the molar fractions, close to eutectic composition.
According to Narine and Marangoni [43], the shapes, sizes of the crystals and crystal
aggregates found in the network are affected by the polymorphic form of the crystals.
Summarizing, all phase diagrams of the binary mixtures presented high complexity in
solid phase with several endothermic and exothermic transitions. The liquidus lines presented
eutectic behavior with solid solutions close to pure tristearin and tribehenin.
Page 172
Capítulo 6 172
Table 6.3
Solid–liquid equilibrium data for tripalmitin (1) + tristearin (2) system, molar fraction x, endothermic transitions temperature Tendo, exothermic
transitions temperature Texo, melting temperature Tm, endothermic transitions temperature of pure component Tendo,p, exothermic transitions
temperature of pure component, optical microscopy temperature Tmicros and pressure p = 94.6 kPa.a
xtripalmitin Tendo
/ K
Texo
/ K
Texo
/ K
Tendo
/ K
Texo
/ K
Tendo
/ K
Texo
/ K
Tendo
/ K
Tm
/ K
Tendo,p
/ K
Texo,p
/ K
Texo,p
/ K
Tmicros
/ K
Solid
phase
0.0000
345.68 328.68 329.26 332.24 2
0.1023
327.80
332.30
345.20
342.45 2
0.3988
321.49
331.58 333.14
341.74
2
0.5025
322.94
330.37 332.38 336.24 341.43
2
0.6003
319.91
328.88 331.78 335.15 339.23
2
0.7024
320.15
328.53 329.86
336.30
335.65 2
0.8011 319.11
320.09 326.84
328.80 329.95
336.86
1
0.9014
318.30 322.04
337.46
1
1.0000
338.53 318.17 318.60 319.78 1
a Uncertainties for molar fraction, temperature and pressure are ±0.0004, ±0.30 K and ±0.1 kPa, respectively.
Page 173
Capítulo 6 173
Table 6.4
Solid–liquid equilibrium data for tripalmitin (1) + tribehenin (3) system, molar fraction x, endothermic transitions temperature Tendo, exothermic
transitions temperature Texo, melting temperature Tm, endothermic transitions temperature of pure component Tendo p, exothermic transitions
temperature of pure component Texo, p, optical microscopy temperature Tmicros and pressure p = 94.6 kPa.a
xtripalmitin Texo
/ K
Texo
/ K
Tendo
/ K
Tendo
/ K
Texo
/ K
Tendo
/ K
Texo
/ K
Texo
/ K
Tm
/ K
Tendo, p
/ K
Texo, p
/ K
Texo, p
/ K
Tmicros
/ K Solid
phase
0.0000
354.61 342.35
3
0.1000
328.91 335.38
340.3 341.88 344.96 354.57
353.15 3
0.1993
326.3
334.62 338.13
340.75 343.57 353.35
3
0.4082
335.77 337.05 338.6
352.35
3
0.4972 321.48
334.24 337.89 339.84
351.99
3
0.5962 321.29
334.23 335.77 337.63
350.66
3
0.7008
334.79 335.92 338.56
349.73
336.95 3
0.9017
327.96
334.17 338.64
344.16
3
1.0000
338.53 318.17 318.6 319.78 2
a Uncertainties for molar fraction, temperature and pressure are ±0.0004, ±0.30 K and ±0.1 kPa, respectively.
Page 174
Capítulo 6 174
Table 6.5
Solid–liquid equilibrium data for tribehenin (3) + tristearin (2) system, molar fraction x, endothermic transitions temperature Tendo, exothermic
transitions temperature Texo, melting temperature Tm, endothermic transitions temperature of pure component Tendo, p, exothermic transitions
temperature of pure component Texo, p, optical microscopy temperature Tmicros and pressure p = 94.6 kPa.a
xtristearin Tendo / K Texo / K Tendo / K Texo / K Tendo / K Tm / K Tendo, p /
K Texo, p / K Texo, p / K
Tmicros / K Solid
phase
0.0000 354.62 342.35 2
0.0992 345.27 347.8 340.30 353.94 353.35 2
0.1972 345.44 338.90 323.5 353.67 2
0.2966 341.84 338.00 325.26 352.81 2
0.3983 343.59 341.85 338.42 328.19 325.89 352.48 2
0.4995 343.09 339.73 336.03 329.00 326.2 351.1 2
0.5985 343.06 339.54 335.25 328.16 325.66 350.04 2
0.7000 343.32 336.43 333.61 328.09 325.89 348.8 343.35 2
0.9001 331.98 330.79 327.48 326.83 343.87 3
1.0000 345.68 328.67 329.25 332.29 3
a Uncertainties for molar fraction, temperature and pressure are ±0.0004, ±0.30 K and ±0.1 kPa, respectively.
Page 175
Capítulo 6 175
6.3.2 Ternary Mixtures
Table 6.6 presents the experimental data of the ternary system formed by tripalmitin
(1) + tristearin (2) + tribehenin (3) and Fig. 6.6 presents the differential thermal curves. Each
thermal curve with its respective molar fraction was renamed by a number in a range of 1 to
36, as presented in Table 6.6.
Upon heating several thermal events were observed, endothermic and exothermic
ones, in all differential thermal curves, making the analysis of the ternary mixture a very
difficult task. Thus to simplify the study of the system only the liquidus line and the eutectic
transition were considered, but all thermal events observed in the thermal curves are presented
in Table 6.6. Before proceeding our discussion it is important to mention that the observed
transitions can be attributed to polymorphic changes of the pure compounds as well as of the
mixtures. In case of a ternary mixture the interaction possibilities during crystallization is
major than in a binary and it is also important to consider the size and shape of each
compound that influences on packing of the systems. A clear example of the influence of
molecular size and shape on crystallization behavior is get from the study of Maximo et al.
[44] that analyzed the SLE of a ternary mixture formed by myristic acid, palmitic acid and
oleic acid. The size and shape of the fatty acid molecules are simpler than our molecules and
the simplicity can also be verified in the results of the thermal curves. In that study just two
thermal events were observed while in ours, several thermal events were observed.
It is possible to observe the occurrence of an endothermic transition highlighted by a
black line drawn in Fig. 6.6 (a) in an average temperature of 342.63 K (± 1.32 K), just below
the melting temperature of the ternary mixture, the last endothermic peak of the thermal
curves. The behavior of thermal curves suggests that this endothermic transition was
influenced by the melting of the pure tristearin and also by the melting of the α-form of the
pure tribehenin. The endothermic transition observed in Fig. 6.6 (a) was attributed to a
eutectic surface in the ternary mixture. The average temperature attributed to the eutectic
reaction of the ternary mixture is very close to the eutectic temperature of the tristearin (2) +
tribehenin (3) binary system, where an average eutectic transition was close to 343.06 K (±
0.71 K).
Page 176
Capítulo 6 176
Table 6.6
Experimental solid−liquid equilibrium data for the ternary system (PPP) tripalmitin (1) + (SSS) tristearin + (2) + (BBB) tribehenin (3), for molar
fraction x, exothermic temperature Texo, endothermic temperature Tendo and melting temperature Tm and pressure p = 94.6 kPa.a
xPPP xSSS xBBB
Tendo
/ K
Texo
/ K
Tendo
/ K
Tendo
/ K
Texo
/ K
Tendo
/ K
Tendo
/ K
Tendo
/ K
Texo
/ K
Tendo
/ K
Texo
/ K
Tendo
/ K
Tendo
/ K
Tm
/ K 1 0.1000 0.1001 0.7999 318.24 327.72 339.28 341.94 354.43
2 0.1003 0.2023 0.6974 325.74 334.64 337.47 340.70 353.55
3 0.1001 0.2989 0.6010 326.92 335.03 337.52 340.74 343.07 353.03
4 0.0993 0.4001 0.5006 325.49 327.24 331.86 335.42 338.69 340.53 341.81 343.70 352.66
5 0.1017 0.4985 0.3999 325.41 327.37 331.58 334.55 337.05 340.52 341.27 343.78 351.17
6 0.0984 0.6007 0.3009 326.26 328.26 332.26 335.00 336.78 341.24 344.15 350.04
7 0.0994 0.7019 0.1987 326.98 328.13 332.83 335.45 336.83 340.33 345.04 348.15
8 0.0997 0.8009 0.0994 327.40 328.01 332.54 334.58 344.86
9 0.1995 0.0987 0.7017 316.52 327.49 337.06 353.95
10 0.1994 0.1993 0.6013 317.81 327.75 337.85 352.88
11 0.1991 0.2998 0.5011 325.54 328.85 331.99 338.67 341.77 352.43
12 0.1994 0.3997 0.4009 320.64 325.77 330.30 331.65 336.12 339.98 342.74 351.37
13 0.1978 0.5012 0.3010 320.57 326.11 330.43 331.48 333.69 335.33 339.58 343.10 349.99
14 0.1991 0.6010 0.1999 316.76 320.49 325.92 331.11 333.85 334.98 339.40 343.30 347.91
15 0.1992 0.7007 0.1001 318.29 320.67 327.10 331.30 332.37 333.17 343.80
16 0.3002 0.0989 0.6009 317.50 327.14 329.23 335.39 337.21 353.35
17 0.3046 0.1980 0.4974 317.73 327.81 329.61 336.24 340.04 352.45
18 0.2985 0.3012 0.4003 320.11 323.66 330.43 336.47 340.90 351.14
19 0.3004 0.3994 0.3002 318.98 324.17 331.17 334.80 339.18 341.92 350.24
20 0.2994 0.5001 0.2005 318.06 321.42 324.13 330.94 332.91 339.24 342.09 347.61
21 0.3000 0.5996 0.1005 318.19 322.51 327.08 331.48 331.48 332.65 342.82
22 0.3996 0.0992 0.5012 317.30 320.32 327.06 329.17 334.45 337.15 352.55
23 0.3996 0.1990 0.4014 318.40 327.30 329.75 334.94 338.44 351.72
24 0.3994 0.3001 0.3005 319.60 323.06 327.53 330.17 335.96 340.03 350.43
25 0.3998 0.4000 0.2002 318.80 323.14 330.73 335.76 338.32 341.08 348.17
26 0.4026 0.4968 0.1005 318.12 322.55 330.60 331.83 335.17 341.24
27 0.5005 0.0983 0.4012 318.13 326.27 329.08 333.48 334.93 337.66 351.65
28 0.5078 0.1955 0.2967 318.16 320.80 326.65 329.45 334.63 336.70 349.85
29 0.4996 0.2998 0.2006 319.10 321.63 327.19 329.44 336.00 338.85 348.08
30 0.5000 0.4002 0.0998 318.78 321.46 328.43 330.16 335.67 339.67 340.07 343.81
31 0.6003 0.0988 0.3008 317.67 325.95 328.91 333.95 338.20 350.32
Page 177
Capítulo 6 177
cont. Table 6.6
32 0.6004 0.1995 0.2001 318.48 320.35 326.45 329.15 333.98 336.76 348.09
33 0.6004 0.2991 0.1004 318.89 320.54 327.45 329.32 335.98 338.55 344.21
34 0.6998 0.0991 0.2011 318.69 326.19 328.27 333.54 338.22 348.35
35 0.7002 0.1996 0.1002 318.70 319.67 326.17 328.45 336.45 344.86
36 0.8036 0.0976 0.0988 317.64 318.38 326.89 337.40 343.79
a Uncertainties for molar fraction, temperature and pressure are ±0.0004, ±0.30 K and ±0.1 kPa, respectively.
Page 178
Capítulo 6 178
Fig. 6.6 Differential thermal curves of ternary mixture.
It is interesting to note the shift of the endothermic peak to the left just before the
melting peak temperature in Fig. 6.6 (b), highlighted by a black dashed line in molar fractions
above of 0.5 of tripalmitin in an average temperature of 337.89 K (± 1.07 K). Although this
event is just before the melting one, its temperature is approximately 5 K lower than that
observed in Fig 6.6 (a) due to this shift of 5 K it cannot be considered an eutectic reaction,
inasmuch as the eutectic reaction occurs in a constant temperature [45].
Page 179
Capítulo 6 179
The eutectic point in a phase diagram is the local where the solidus line and the
liquidus line intersect. In a region close to this eutectic point, it is usually observed the
overlapping of the thermal events related to the eutectic temperature and the melting
temperature, due to the proximity of the both temperature values. In truth, in the eutectic point
composition just one peak is observed. Such overlapping can be observed in the thermal
curves 8, 15 and 26 (Fig. 6.6 (a)). In the same way as for a binary system in which a liquid
and two solid phases co-exist in equilibrium in the eutectic composition, in a ternary system, a
liquid and three solid phases co-exist in the eutectic composition that is the lower melting
temperature of the mixture.
The relationship between temperature distribution of liquidus surface of the binary and
ternary systems is shown on the triangular phase diagram of Fig. 6.7. This figure also presents
the phase diagrams of the binary mixtures that were plotted at each edge of the triangular
diagram. The lower temperature of the ternary system was observed in a region close of
eutectic composition of the tripalmitin (1) + tristearin (2) binary mixture at approximately 0.7
of tripalmitin molar fraction. This result is expected once that the eutectic composition of the
ternary system is the projection of each curve of the eutectic composition of the binary
systems.
Page 180
Capítulo 6 180
Fig. 6.7 SLE phase diagrams of the binary and ternary systems: (a) tripalmitin (1) + tristearin (2), (b) tristearin (2) + tribehenin (3) and (c)
tripalmitin (1) + tribehenin (3), (xPPP) molar fraction of tripalmitin, (xSSS) molar fraction of tristearin, (xBBB) molar fraction of tribehenin.
tripalmitin (1) + tristearin (2) + tribehenin (3). Phase diagram of binary mixture: (●) melting temperature experimental data; (▲) eutectic reaction
temperature; (×) temperature of transition of mixture; (■) temperature of transition exothermic; () temperature of transition of pure component,
(◊) temperature observed by optical microscopy.
Page 181
Capítulo 6 181
The phase diagram of ternary mixture is also presented in Fig. 6.8 in the form of a
three-dimensional prism, where it is possible to see the experimental (Fig. 6.8 (a)) and
calculated (Fig. 6.8 (b)) results. Also again in this figure, four micrographs were obtained in
the methodology aforementioned.
The ternary mixture data were modeled by a predictive method since the parameters of
the two-suffix Margules equation were adjusted using only the experimental binary system
data, as the methodology well described by Maximo et al. [44].
Table 6.7 shows the adjusted parameters and the average of absolute deviations
between experimental and calculated data. In this study these deviations were calculated by
Equation 6.6, i.e., using the calculated temperature ( iT ) and experimental temperature ( iexpT )
values obtained for the liquidus and solidus lines. The Crystal-T model was very effective in
predicting this ternary mixture behavior since the average of absolute deviation ( ) was
equal to 1.14 K.
n
TTn
i
ii
exp
(6.6)
where n is the number of experimental measurements.
In order to check the solid solution formation in the ternary system, the optical
microscopy images (Fig. 6.9) were captured for the molar fractions of xPPP,SSS,BBB= [0.1000,
0.1001, 0.7999] (micrographs A to D), xPPP,SSS,BBB = [0.0997, 0.8009, 0.0994], (micrographs E
to H), xPPP,SSS,BBB = [0.1017, 0.4985, 0.3999] (micrographs I to L) and xPPP,SSS,BBB = [0.1992,
0.7007, 0.1001] (micrographs M to P).
Fig. 6.9 (a), captured at 352.15 K, shows that the mixture is in the solid phase. This
temperature is approximately 10 K higher than the average eutectic temperature (342.63 K ±
1.32K), confirming the formation of solid solution very close of the pure tribehenin in the
ternary mixture. With the increase of the temperature to 353.15 K (Fig. 6.12 (b)), it is possible
to observe the start of melting process due to the rounded shape of the crystals as indicated by
the black arrows. When temperature reaches 354.15 K (Fig. 6.12 (c)), it is easier to see the
Page 182
Capítulo 6 182
amount of liquid that is in equilibrium with solid phase and at a temperature of 355.65 K (Fig.
6.12 (d)), the sample is completely melted.
The same analyses were performed for molar fractions x123= [0.0997, 0.8009, 0.0994],
x123= [0.1017, 0.4985, 0.3999] and x123= [0.1992, 0.7007, 0.1001], that presented the start of
the melting process at temperatures of 343.15 K (Fig. 6.9 (f)), 344.15 K (Fig. 6.9 (j)) and
340.65 K (Fig. 6.9 (n), respectively, as indicated by the black arrows. In these cases, it was
observed that the melting processes begin very close of the eutectic temperature observed in
the respective thermal curve through DSC experimental data (Table 6.6). This fact
corroborates that the endothermic transition observed in the thermal curves is an eutectic
transition.
Each molar fraction aforementioned was studied in a crystallization run employing a
polarized light microscopy and the results are the images presented in the Fig. 6.9 (yellow
points). It is possible to note different crystals arrangements in each molar fraction. According
to Costa et al. [46] this behavior can be an indication of the existence of multiple regions in
the phase diagram. Different crystals arrangements can influence rheological properties and
many of the sensory attributes such as spreadability, texture, etc., which are fat crystal
network dependent [30, 47].
.
Page 183
Capítulo 6 183
Fig. 6.8 SLE phase diagrams of the ternary system experimental (a) and modeled (b):
tripalmitin (1) + tristearin (2) + tribehenin (3). Points legend in figure (a) of the ternary phase
diagram: (black) melting temperature, (dark gray), eutectic transition, (yellow) melting
temperature and polarized light microscopy at room temperature, (blue) melting temperature
of the binary mixture, (red) eutectic temperature of the binary mixture, (green) temperature
observed by optical microscopy. Figure (b): gray surface stands for liquid phase and green
surface stands for solid solution.
Page 184
Capítulo 6 184
Fig. 6.9 Optical micrographs of samples of tripalmitin (1) + tristearin (2) +tribehenin (3) with
x123= [0.1000, 0.1001, 0.7999] at (A) 352.15 K; (B) 353.15.15 K; (C) 354.15 K; (D) 355.65
K; x123= [0.0997, 0.8009, 0.0994] at (E) 341.65 K; (F) 343.15 K; (G) 343.95 K; (H) 345.65 K;
x123= [0.1017, 0.4985, 0.3999] at (I) 342.15 K; (J) 344.15.15 K; (K) 345.15 K; (L) 322.65 K
and x123= [0.1992, 0.7007, 0.1001] at (M) 340.15 K; (N) 340.65.15 K; (O) 343.15 K; (P)
344.15 K. Magnification of 20×.
Page 185
Capítulo 6 185
Table 6.7
Adjusted parameters and mean absolute deviation obtained for binary and ternary mixtures.
Model Phase Tripalmitin (1) +
tristearin (2)
Tripalmitin (1) +
tribehenin (3)
Tristearin (2) +
tribehenin (3)
Ternary
Two-suffix Margules
(solid solution transitions)
Aji (kJ mol-1
) Liquid -7.50 -0.5 -4.5 -
Aij (kJ mol-1
) Solid 5.80 7.0 7.0 -
σ 0.46 0.28 0.92 1.14
Three-suffix Margules
(solid solution transitions)
Aij (kJ mol-1
) Liquid -5.00 -0.50 -5.50 -
Aji (kJ mol-1
) Liquid 1.00 -2.00 -5.00 -
Aij (kJ mol-1
) Solid 12.00 5.00 6.0 -
Aji (kJ mol-1
) Solid 10.00 4.00 5.0 -
σ 0.44 0.31 0.57 -
Ideal σ 1.77 0.27 0.47 -
Page 186
Capítulo 6 186
6.4 Conclusions
This study presents for the first time, the phase diagram of the ternary mixture composed
by tripalmitin + tristearin + tribehenin. It was also determined the binary phase diagrams as well
as the melting temperatures of such pure compounds. The melting temperatures of binary mixture
and pure compounds were previously presented in the literature and our data are in a good
agreement with those.
The results of SLE phase diagrams of the tripalmitin (1) + tribehenin (3) and tristearin (2)
+ tribehenin (3) systems, indicate the formation of solid solution that was corroborated by optical
microscopy.
The liquidus and solid lines of the binary systems studied were adequately described by
two and three-suffix Margules models.
The experimental data of the ternary mixture presented solid solutions. The liquidus and
solidus lines of the ternary mixture were predicted by two-suffix Margules model using the
parameters adjusted to the binary system experimental data. The solid solutions of the binary and
the ternary mixture were also corroborated by optical microscopy analyses.
Acknowledgements
The authors wish to acknowledge CAPES. FAPESP (0125/16, 2014/21252-0 and
2012/05027-1) and CNPq (305870/2014-9, 406856/2013-3 and 309780/2014-4) for their
financial support.
Page 187
Capítulo 6 187
Supplementary Materials
Fig.1 Differential thermal curves: (a) tripalmitin (1) + tristearin (2), (b) tripalmitin (1) + tribehenin (3) and (c) tristearin (2) +
tribehenin (3).
Page 188
Capítulo 6 188
Optical microscopy images (Fig. 2 and 3) were captured to evaluate the solid solution
formation in the tripalmitin + tristearin system at molar fractions of xPPP = 0.1023 and xPPP =
0.7024, respectively.
It is possible to see in (Fig. 2 (a)) that the mixture is in the solid phase at temperature
of 338.15 K. With the increase of temperature to 342.45 K (Fig. 2 (b)), 6.75 K above
temperature that was attributed to the eutectic temperature (335.70 K), the sample starts
melting process (highlighted by a white arrow). At this temperature, solid tristearin coexists
with a liquid mixture. In the phase diagram presented in the article, this temperature was
represented by a diamond shape (◊). When the temperature reaches 344.75 K (Fig. 2 (c)) the
amount of liquid in the images increases until complete melting of the sample at 345.65 K
(Fig. 2 (d)). The beginning of melting process above of the eutectic temperature, confirm that
presence of solid solutions in the extremity of phase diagram rich at tristearin.
The same analysis was performed for the molar fraction of tripalmitin 0.7024 (Fig.3).
In this case, the melting process starts at a temperature of 335.65 K (Fig.3 (b)) and it is
indicated by a white arrow. This temperature is very close to that attributed to the eutectic
temperature (335.70 K). Therefore the beginning of melting process observed in the optical
microscopy was attributed the eutectic reaction of the mixture.
Fig.2 Optical micrographs of samples of tripalmitin (1) + tristearin (2) at x1= 0.1023 with
338.15 K; (b) 342.45 K; (c) 344.75 K; (d) 345.65 K. Magnification of 20×.
Page 189
Capítulo 6 189
Fig.3 Optical micrographs of samples of tripalmitin (1) + tristearin (2) at x1= 0.7024 with (a)
334.15 K; (b) 335.65 K; (c) 336.65 K; (d) 337.15 K. Magnification of 20×.
Page 190
Capítulo 6 190
References
[1] F.D. Gunstone, J.L. Harwood, A.J. Dijkstra, The Lipid Handbook, Third Edition ed., CRC
Press, 2007.
[2] K.W. Smith, K. Bhaggan, G. Talbot, Phase behavior of symmetrical monounsaturated
triacylglycerols, European Journal of Lipid Science and Technology, 115 (2013) 838-846.
[3] C. Antony, P. Hermann, S.C. Johannes, B.R. Lobley, P. Stanley, Cocoa butter substitutes
and products containing them, in, Google Patents, 1961.
[4] F.B. Padley, C.N. Paulussen, C. Soeters, D. Tresser, Chocolate having defined hard fat, in,
Google Patents, 1981.
[5] M. Kellens, W. Meeussen, H. Reynaers, Crystallization and phase transition studies of
tripalmitin, Chemistry and Physics of Lipids, 55 (1990) 163-178.
[6] K. Sato, Crystallization behaviour of fats and lipids — a review, Chemical Engineering
Science, 56 (2001) 2255-2265.
[7] C. Akita, T. Kawaguchi, F. Kaneko, O. Yamamuro, H. Akita, M. Ono, M. Suzuki, Quasi-
elastic neutron scattering study on polymorphism of tristearin: relationship between
dynamical properties and subcell structures, Journal of Crystal Growth, 275 (2005) e2187-
e2193.
[8] M. Ollivon, R. Perron, Measurements of enthalpies and entropies of unstable crystalline
forms of saturated even monoacid triglycerides, Thermochimica Acta, 53 (1982) 183-194.
[9] A.G. Marangoni, L.H. Wesdorp, Crystallography and Polymorphism, in: Structure and
Properties of Fat Crystal Networks, Second Edition, CRC Press, 2012, pp. 19-44.
[10] R.E. Timms, Phase behaviour of fats and their mixtures, Progress in Lipid Research, 23
(1984) 1-38.
[11] M. Kellens, W. Meeussen, A. Hammersley, H. Reynaers, Synchrotron radiation
investigations of the polymorphic transitions in saturated monoacid triglycerides. Part 2:
Polymorphism study of a 50:50 mixture of tripalmitin and tristearin during crystallization and
melting, Chemistry and Physics of Lipids, 58 (1991) 145-158.
[12] L. Bayés-García, T. Calvet, M.À. Cuevas-Diarte, S. Ueno, K. Sato, Phase Behavior of
Binary Mixture Systems of Saturated-Unsaturated Mixed-Acid Triacylglycerols: Effects of
Page 191
Capítulo 6 191
Glycerol Structures and Chain–Chain Interactions, The Journal of Physical Chemistry B,
119 (2015) 4417-4427.
[13] A.G. Marangoni, A.J. Wright, Physical Properties of Fats and Oils, in: Handbook of
Functional Lipids, CRC Press, 2005, pp. 135-162.
[14] K.W. Won, Thermodynamic model of liquid-solid equilibria for natural fats and oils,
Fluid Phase Equilibria, 82 (1993) 261-273.
[15] S. Bruin, T.R.G. Jongen, Food Process Engineering: The Last 25 Years and Challenges
Ahead, Comprehensive Reviews in Food Science and Food Safety, 2 (2003) 42-81.
[16] R.D. O'Brien, Fats and Oils Formulation, in: Fats and Oils, CRC Press, 2003.
[17] M. Takeuchi, S. Ueno, K. Sato, Synchrotron Radiation SAXS/WAXS Study of
Polymorph-Dependent Phase Behavior of Binary Mixtures of Saturated Monoacid
Triacylglycerols, Crystal Growth & Design, 3 (2003) 369-374.
[18] F.C. Matos, M.C. Costa, A.J. Almeida Meirelles, E.A.C. Batista, Binary solid–liquid
equilibrium systems containing fatty acids, fatty alcohols and triolein by differential scanning
calorimetry, Fluid Phase Equilibria, 404 (2015) 1-8.
[19] F.C. de Matos, M.C. da Costa, A.J.D.A. Meirelles, E.A.C. Batista, Binary solid-liquid
equilibrium systems containing fatty acids, fatty alcohols and trilaurin by differential scanning
calorimetry, Fluid Phase Equilibria, 423 (2016) 74-83.
[20] M.C. Costa, M.P. Rolemberg, A.O. dos Santos, L.P. Cardoso, M.A. Kr henb hl, A.J.A.
Meirelles, Solid−Liquid Equilibrium of Tristearin with Refined Rice Bran and Palm Oils,
Journal of Chemical & Engineering Data, 55 (2010) 5078-5082.
[21] N.D.D. Carareto, T. Castagnaro, M.C. Costa, A.J.A. Meirelles, The binary (solid +
liquid) phase diagrams of (caprylic or capric acid) + (1-octanol or 1-decanol), The Journal of
Chemical Thermodynamics, 78 (2014) 99-108.
[22] L. Bouzidi, S.S. Narine, Relationships between molecular structure and kinetic and
thermodynamic controls in lipid systems: Part III. Crystallization and phase behavior of 1-
palmitoyl-2,3-stearoyl-sn-glycerol (PSS) and tristearoylglycerol (SSS) binary system,
Chemistry and Physics of Lipids, 165 (2012) 105-119.
[23] J.M. Prausnitz, R.N. Lichtenthaler, E.G. Azevedo, Molecular Thermodynamics of Fluid-
Phase Equilibria, Third Edition ed., Prentice Hall, 1998.
Page 192
Capítulo 6 192
[24] G.J. Maximo, M.C. Costa, A.J.A. Meirelles, The Crystal-T algorithm: a new approach to
calculate the SLE of lipidic mixtures presenting solid solutions, Physical Chemistry
Chemical Physics, 16 (2014) 16740-16754.
[25] R.C. Reid, J.M. Prausnitz, B.E. Pouling, The Properties of Gases and Liquids, McGraw-
Hill, New York, 1987.
[26] M. Kellens, H. Reynaers, Study of the Polymorphism of Saturated Monoacid
Triglycerides I: Melting and Crystallization Behaviour of Tristearin, in: Lipid / Fett,
WILEY-VCH Verlag, 1992, pp. 94-100.
[27] L. Ventolà, V. Metivaud, L. Bayés, R. Benages, M.Á. Cuevas-Diarte, T. Calvet, D.
Mondieig, The Binary System Tetradecanedioic Acid–Hexadecanedioic Acid: Polymorphism
of the Components and Experimental Phase Diagram, Helvetica Chimica Acta, 89 (2006)
2027-2039.
[28] L. Ventolà, L. Bayés, R. Benages, F.J. Novegil-Anleo, M.Á. Cuevas-Diarte, T. Calvet,
D. Mondieig, Decanedioic Acid (C10H18O4)/Dodecanedioic Acid (C12H22O4) System:
Polymorphism of the Components and Experimental Phase Diagram, Helvetica Chimica
Acta, 91 (2008) 1286-1298.
[29] E.S. Lutton, A.J. Fehl, The polymorphism of odd and even saturated single acid
triglycerides, C8–C22, Lipids, 5 (1970) 90-99.
[30] A.G. Marangoni, L.H. WESDORP, Structure and Properties of fat crystal networks,
CRC Press, London New York, 2013.
[31] M. Kellens, W. Meeussen, C. Riekel, H. Reynaers, Time resolved x-ray diffraction
studies of the polymorphic behaviour of tripalmitin using synchrotron radiation, Chemistry
and Physics of Lipids, 52 (1990) 79-98.
[32] P. Pivette, V. Faivre, J.-B. Brubach, G. Daste, M. Ollivon, S. Lesieur, Polymorphism of
glyceryl behenates: From the individual compounds to the pharmaceutical excipient,
Chemistry and Physics of Lipids, 183 (2014) 191-203.
[33] M. Kellens, W. Meeussen, R. Gehrke, H. Reynaers, Synchrotron radiation investigations
of the polymorphic transitions of saturated monoacid triglycerides. Part 1: Tripalmitin and
tristearin, Chemistry and Physics of Lipids, 58 (1991) 131-144.
Page 193
Capítulo 6 193
[34] M. Kellens, W. Meeussen, H. Reynaers, Study of the polymorphism and the
crystallization kinetics of tripalmitin: A microscopic approach, Journal of the American Oil
Chemists Society, 69 906-911.
[35] C. Himawan, W. MacNaughtan, I.A. Farhat, A.G.F. Stapley, Polymorphic occurrence
and crystallization rates of tristearin/tripalmitin mixtures under non-isothermal conditions,
European Journal of Lipid Science and Technology, 109 (2007) 49-60.
[36] B. Hong, D. Li, Q. Lei, L. Xu, W. Fang, H. Mayama, Kinetics on formation of super
water repellent surfaces from phase transformation in binary mixtures of trimyristin and
tripalmitin, Colloids and Surfaces A: Physicochemical and Engineering Aspects, 396
(2012) 130-136.
[37] W. MacNaughtan, I.A. Farhat, C. Himawan, V.M. Starov, A.G.F. Stapley, A differential
scanning calorimetry study of the crystallization kinetics of tristearin-tripalmitin mixtures,
Journal of the American Oil Chemists Society, 83 (2006) 1-9.
[38] L.H. Wesdorp, Liquid-multiple solid phase equilibria in fats - theory and experiments.,
in, Chemicus, Delft University of Technology., Delft, 1990.
39 M.C. Costa, L.A.D. Boros, J.A. Souza, M.P. Rolemberg, M.A. Kr henb hl, A.J.A.
Meirelles, Solid–Liquid Equilibrium of Binary Mixtures Containing Fatty Acids and
Triacylglycerols, Journal of Chemical & Engineering Data, 56 (2011) 3277-3284.
[40] C. Qian, E. Decker, H. Xiao, D. McClements, Solid Lipid Nanoparticles: Effect of
Carrier Oil and Emulsifier Type on Phase Behavior and Physical Stability, J Amer Oil Chem
Soc, 89 (2012) 17-28.
[41] N.D.D. Carareto, A.O. dos Santos, M.P. Rolemberg, L.P. Cardoso, M.C. Costa, A.J.A.
Meirelles, On the solid–liquid phase diagrams of binary mixtures of even saturated fatty
alcohols: Systems exhibiting peritectic reaction, Thermochimica Acta, 589 (2014) 137-147.
[42] M.C. Costa, M.A. Krähenbühl, A.J.A. Meirelles, J.L. Daridon, J. Pauly, J.A.P. Coutinho,
High pressure solid–liquid equilibria of fatty acids, Fluid Phase Equilibria, 253 (2007) 118-
123.
[43] A.G. Marangoni, S.S. Narine, Structure and Mechanical Properties of Fat Crystal
Networks, in: Physical Properties of Lipids, CRC Press, 2002.
Page 194
Capítulo 6 194
[44] G.J. Maximo, R.T. Aquino, A.J.A. Meirelles, M.A. Krähenbühl, M.C. Costa, Enhancing
the description of SSLE data for binary and ternary fatty mixtures, Fluid Phase Equilibria,
(2016).
[45] M.C. Costa, L.A.D. Boros, M.L.S. Batista, J.A.P. Coutinho, M.A. Kraehenbuehl, A.J.A.
Meirelles, Phase diagrams of mixtures of ethyl palmitate with fatty acid ethyl esters, Fuel, 91
(2012) 177-181.
[46] M.C. Costa, M.P. Rolemberg, A.J.A. Meirelles, J.A.P. Coutinho, M.A. Krähenbühl, The
solid–liquid phase diagrams of binary mixtures of even saturated fatty acids differing by six
carbon atoms, Thermochimica Acta, 496 (2009) 30-37.
47 I. Piska, M. árubová, T. Loužecký, H. Karami, V. Filip, Properties and crystallization of
fat blends, Journal of Food Engineering, 77 (2006) 433-438.
Page 195
Capítulo 7 195
CAPÍTULO 7
DISCUSSÃO GERAL
Page 196
Capítulo 7 196
O estudo do equilíbrio sólido-líquido de misturas graxas para entender as transições de
fases ocasionadas pelo efeito da temperatura é de fundamental importância no melhoramento
de produtos e processos. Em especial na indústria de alimentos, o conhecimento do
comportamento de fusão e solidificação de misturas lipídicas é essencial para a fabricação e
melhoramento de produtos, tais como margarina, sorvete, chocolate, entre outros (Bruin e
Jongen, 2003), bem como para o desenvolvimento de novos produtos, no que hoje é
conhecido como ―product design‖. Nesse sentindo, esse estudo foi desenvolvido com a
intenção de compreender as transições de fases que ocorrem nesses sistemas devido ao
aumento da temperatura em diferentes composições.
Na Tabela 7.1 são apresentadas as temperaturas experimentais de fusão dos
componentes puros usados nesse estudo e o respectivo desvio padrão das análises em
triplicada encontra-se entre parênteses. Nessa tabela também são apresentadas as respectivas
fórmulas químicas. As medidas experimentais foram obtidas pela análise de Calorimetria
Exploratória Diferencial (DSC – Differential Scanning Calorimetry).
Tabela 7.1 Temperatura de fusão dos componentes puros.
Componentes Fórmula química Temperatura de fusão (K)
Ácido cáprico C10H20O2 305,48 (± 0,10)
Ácido láurico C12H24O2 318,48 (± 0,49)
Ácido mirístico C14H28O2 328,93 (± 0,18)
Ácido palmítico C16H32O2 336,36 (± 0,41)
Ácido esteárico C18H36O2 344,04 (± 0,04)
1-Decanol C10H22O 280,11 (± 0,22)
1-Dodecanol C12H26O 297,53 (± 0,05)
1-Tetradecanol C14H30O 311,10 (± 0,20)
1-Hexadecanol C16H34O 322,90 (± 0,03)
1-Octadecanol C18H38O 331,34 (± 0,08)
Trioleina C57H104O6 278,57 (± 0,04)
Trilaurina C39H74O6 319,67 (± 0,20)
Trimiristina C45H86O6 331,38 (± 0,26)
Tripalmitina C51H98O6 339,47 (± 0,47)
Triestearina C57H110O6 345,81 (± 0,10)
Tribehenina C69H134O6 354,20 (± 0,15)
Page 197
Capítulo 7 197
Pode-se observar na Tabela 7.1 que o ponto de fusão de todos os ácidos graxos,
álcoois graxos e triacilgliceróis saturados aumentam com o aumento da cadeia carbônica para
a mesma classe química. No caso especial da trioleina, que é um triacilglicerol insaturado
com o mesmo número de carbonos da triestearina, o que se observar é que sua temperatura de
fusão diminuiu. Isso ocorre porque as duplas ligações dificultam a agregação das moléculas.
O desvio padrão experimental calculado em triplicada para temperatura e entalpia de
fusão de todos os componentes puros variou de ( 0,10 a 0,49) e ( 0,12 a 1,20),
respectivamente. A incerteza do tipo A e o desvio padrão foram calculados utilizando a
entalpia molar de fusão do índio (usado como padrão), e apresentou valor de 0,037 kJ.mol-1
e
0,063, respectivamente. Esses resultados confirmam a boa precisão da técnica de DSC.
Ao se comparar o desvio médio relativo de todas as temperaturas de fusão dos
componentes puros obtidos nesse estudo com os respectivos resultados encontrados na
literatura, observa-se que o valor variou entre 0,14 % e 0,35 %.
Também foi calculado o desvio médio relativo para a entalpia molar de fusão dos
compostos puros com os respectivos resultados encontrados na literatura, sendo que os
valores ficaram entre 4,35 % e 7,80 %. Embora tais valores não sejam tão pequenos, é
importante considerar que ao se observar somente os valores da literatura, os desvios médios
relativos apresentaram valores maiores e variaram entre 5,70 % e 9,95 %.
Todos os sistemas graxos binários constituídos por triacilgliceróis com ácidos graxos,
triacilgliceróis com álcoois graxos e binários e ternário de triacilgliceróis estudados estão
apresentados na Tabela 7.2. Os dados experimentais do equilíbrio sólido-líquido foram
obtidos também pela análise de DSC.
Page 198
Capítulo 7 198
Tabela 7.2 Sistemas estudados nesse trabalho.
Sistemas
Capítulo 3
Trioleina + ácido cáprico
Trioleina + ácido láurico
Trioleina + ácido mirístico
Trioleina + 1-decanol
Trioleina +1-dodecanol
Trioleina + 1-tetradecanol
Capítulo 4
Trilaurina + ácido mirístico
Trilaurina + ácido palmítico
Trilaurina + ácido esteárico
Trilaurina + 1-tetradecanol
Trilaurina + 1-hexadecanol
Trilaurina + 1-octadecanol
Capítulo 5
Trimiristina + ácido cáprico
Trimiristina + ácido láurico
Trimiristina + ácido esteárico
Trimiristina +1-dodecanol
Trimiristina +1-tetradecanol
Capítulo 6
Tripalmitina + triestearina
Tripalmitina + tribehenina
Triestearina + tribehenina
Tripalmitina + triestearina + tribehenina
Para facilitar a comparação dos comportamentos observados na linha liquidus para os
diferentes sistemas, serão utilizadas somente as temperaturas de fusão experimentais e as
calculadas, utilizando no cálculo do coeficiente de atividade o modelo de Margules de 3-
sufixos, uma vez que esse modelo descreveu os pontos experimentais com precisão.
Na Figura 7.1 são apresentados os valores experimentais e calculados de temperatura
de fusão dos sistemas trioleina + ácidos graxos (Figura 7.1 (a)) e dos sistemas trioleina +
álcoois graxos (Figura 7.1 (b)) referentes ao Capítulo 3. Pode se observar que com o aumento
da cadeia de carbonos dos ácidos graxos (Figura 7.1 (a)) houve deslocamento do ponto
eutético na direção do aumento da composição em trioleina na mistura. O mesmo
comportamento foi observado para o aumento da cadeia de carbonos dos álcoois graxos
(Figura 7.1 (b)). Ainda é possível observar que as linhas liquidus coincidem na região mais
rica em trioleina para os sistemas binários contendo ou ácidos graxos ou álcoois graxos como
segundo componente
Page 199
Capítulo 7 199
É interessante notar que a temperatura da reação eutética de todos os sistemas do
Capítulo 3 foram muito próxima, e seus valores ficaram em torno de 278 K, apesar das
frações molares serem diferentes.
Figura 7.1 Diagrama de equilíbrio sólido-líquido. Experimental: (a) () trioleina + ácido
cáprico, (▲) trioleina + ácido láurico, (★) trioleina + ácido mirístico, (b) () trioleina + 1-
decanol, (▲) trioleina + 1-dodecanol, (★) trioleina + 1-tetradecanol. Modelo: (a) sistemas
composto de trioleina + ácidos graxos: (····) trioleina + ácido mirístico, () trioleina + ácido
láurico e ( ) trioleina + ácido cáprico e (b) sistemas composto de trioleina + álcoois graxos:
(····) trioleina + 1-tetradecanol, () trioleina + 1-dodecanol e ( ) trioleina + 1-decanol.
Ao se manter fixo o triacilglicerol (Figura 7.2) na mistura binária e substituir o ácido
graxo (grupo carboxila – COOH) por um álcool graxos ( grupo hidroxila – OH) com o mesmo
número de carbonos, foi observado que o ponto eutético se deslocou no diagrama de fases
para uma composição menor de triacilglicerol, por exemplo, os resultados experimentais do
sistema trioleina + ácido cáprico (Capítulo 3), que apresentou o ponto eutético no diagrama de
fases em torno da fração molar 0,7 de trioleina com temperatura aproximada em torno de
277,75 K, e a mistura trioleina + 1-decanol (Capítulo 3), que apresentou o ponto eutético em
torno da fração molar de 0,3 de trioleina com temperatura em torno de 275,48 K. A mesma
análise foi realizada para os sistemas trioleina + ácido láurico com trioleina + 1-dodecanol,
trioleina + ácido mirístico com trioleina + 1-tetradecanol e o mesmo resultado foi observado
em todos os casos. Os diagramas de fases desses sistemas estão apresentados na Figura 7.3.
Page 200
Capítulo 7 200
Figura 7.2 Diagrama de equilíbrio sólido-líquido. Experimental: () trioleina + ácido cáprico,
(★) trioleina + 1-decanol. Modelo: () trioleina + 1-decanol e ( ) trioleina + ácido cáprico.
Figura 7.3 Diagrama de equilíbrio sólido-líquido. Experimental: (•) trioleina + 1-dodecanol,
(★) trioleina + ácido láurico; (b) (•) trioleina + 1-tetradecanol, (★) trioleina + ácido mirístico.
Modelo: (a) () trioleina + 1-dodecanol e ( ) trioleina + ácido láurico; (b) () trioleina +
1-tetradecanol e ( ) trioleina + ácido mirístico.
O comportamento observado na Figura 7.1, quando se comparam misturas binárias
contendo o mesmo triacilglicerol com ácidos graxos ou álcoois graxos com variação de
número de carbonos, também foi observado para todas as misturas dos Capítulos 4 e 5. Com o
aumento do número de carbonos ocorre o deslocamento do ponto eutético nesses diagramas
Page 201
Capítulo 7 201
de fases na direção do triacilglicerol. Os diagramas de fases para esses sistemas são
apresentados nas Figuras 7.4 e 7.5.
Figura 7.4 Diagrama de equilíbrio sólido-líquido. Experimental: (a) () trilaurina + ácido
mirístico, (▲) trilaurina + ácido palmítico, (★) trilaurina + ácido esteárico, (b) () trilaurina +
1-tetradecanol, (▲) trilaurina + 1-hexadecanol, (★) trilaurina + 1-octadecanol. Modelo: (a)
sistemas compostos de trilaurina + ácidos graxos: (····) trilaurina + ácido esteárico, ()
trilaurina + ácido palmítico e ( ) trilaurina + ácido mirístico e (b) sistemas compostos de
trilaurina + álcoois graxos: (····) trilaurina + 1-octadecanol, () trilaurina + 1-hexadecanol e
( ) trilaurina + 1-tetradecanol.
Figura 7.5 Diagrama de equilíbrio sólido-líquido. Experimental: (a) () trimiristina + ácido
cáprico, (▲) trimiristina + ácido láurico, (★) trimiristina + ácido esteárico, (b) () trimiristina
+ 1-dodecanol, (▲) trimiristina + 1-tetradecanol. Modelo: (a) sistemas compostos de
trimiristina + ácidos graxos: (····) trimiristina + ácido esteárico (·) trimiristina + ácido láurico
e ( ) trimiristina + ácido cáprico e (b) sistemas compostos de trimiristina + álcoois graxos:
( ) trimiristina + 1-tetradecanol e () trimiristina + 1-dodecanol.
Page 202
Capítulo 7 202
Ao se manter o mesmo ácido graxo e substituir o triacilglicerol, foi observado que o
ponto eutético é deslocado em direção ao triacilglicerol de menor ponto de fusão como, por
exemplo, nos sistemas constituídos de trilaurina + ácido esteárico (Capítulo 4), que
apresentou um comportamento eutético em torno da fração molar de 0,1 de ácido esteárico
com temperatura média no ponto eutético em torno de 319,38 K, e o sistema trimiristina +
ácido esteárico (Capítulo 5), que também apresentou um comportamento eutético em torno da
fração molar de 0,35 de ácido esteárico com temperatura média no ponto eutético em torno de
329,09 K (Figura 7.6). O mesmo comportamento também foi observado quando se comparou
a temperatura de fusão calculada para as misturas, trioleina + ácido cáprico (Capítulo 3) com
a mistura trimiristina + ácido cáprico (Capítulo 5), para as misturas trioleina + ácido láurico
(Capítulo 3) com a mistura trimiristina + ácido láurico (Capítulo 5) e, finalmente, para as
misturas trioleina + ácido mirístico (Capítulo 3) com a mistura trilaurina + ácido mirístico
(Capítulo 4). Os diagramas de fases desses sistemas são apresentados na Figura 7.7. O
deslocamento do ponto eutético também foi observado no diagrama de fases ao se manter fixo
o álcool graxo e substituir o triacilglicerol. Novamente foi observado que o ponto eutético é
deslocado em direção ao triacilglicerol de menor ponto de fusão como pode ser observado na
Figura 7.8.
Figura 7.6 Diagrama de equilíbrio sólido-líquido. Experimental: (a) ()trilaurina + ácido
esteárico, (▲) trimiristina + ácido esteárico. Modelo: () trilaurina + ácido esteárico e ( )
trimiristina + ácido esteárico.
Page 203
Capítulo 7 203
Figura 7.7 Diagrama de equilíbrio sólido-líquido. Experimental: () trioleina + ácido cáprico, (▲) trimiristina + ácido cáprico, (b) () trioleina +
ácido láurico, (▲) trioleina + ácido láurico, (c) () trioleina + ácido mirístico, (▲) trilaurina + ácido mirístico. Modelo: (a) () trioleina + ácido
cáprico e ( ) trimiristina + ácido cáprico; (b) () trioleina + ácido láurico, ( ) trimiristina + ácido láurico e (c) sistema () trioleina + ácido
mirístico, ( ) trilaurina + ácido mirístico.
Page 204
Capítulo 7 204
Figura 7.8 Diagrama de equilíbrio sólido-líquido. Experimental: () trioleina + 1-dodecanol e (▲) trimiristina + 1-dodecanol; (b) () trimiristina
+1-tetradecanol, (▲) trilaurina + 1- tetradecanol e (★) trioleina + 1-tetradecanol. Modelo: (a) () trioleina + 1-dodecanol e ( ) trimiristina +
1-dodecanol; (b) (····) trimiristina +1-tetradecanol, () trilaurina + 1- tetradecanol e ( ) trioleina + 1-tetradecanol.
Page 205
Capítulo 7 205
Todas essas observações indicam que o comportamento do diagrama de fases se deve
a interações que ocorrem entre as móleculas que podem estar relacionadas com o número de
insaturações, tamanho de cadeia, diferença de temperatura de fusão dos componentes puros,
entre outros fatores.
Nos sistemas estudados, nos quais a diferença de temperatura dos componentes puros
foi maior que 25 K, como, por exemplo, sistemas trioleina + ácido mirístico (Capítulo 3) e
trimiristina + ácido cáprico (Capítulo 5), não foi possível determinar experimentalmente a
temperatura do ponto eutético através do DSC. De acordo com Timms (1984), nesses casos, o
diagrama de fases possui um comportamento monotético ou ainda segundo Costa et al. (
2000) pode-se considerar que o diagrama de fases possui um comportamento eutético com à
temperatura do ponto eutético muito próxima a do componente puro. É importante salientar
que quando a composição do ponto eutético está localizada muito próxima do composto puro,
a determinação desse ponto eutético é uma tarefa muito difícil, devido à proximidade dos
eventos térmicos que, na sua maioria, resulta em picos sobrepostos.
ESL das misturas binárias formadas por tripalmitina (1) + triestearina (2), tripalmitina
(1) + tribehenina (3) e triestearina (2) + tribehenina (3) foram determinados e os resultados
experimentais obtidos foram apresentados no Capítulo 6. É importante mencionar que as
temperaturas de fusão desses sistemas já foram medidas e relatadas na literatura e também
para o sistema tripalmitina (1) + triestearina (2), a solução sólida já foi apresentada, como já
descrito no Capítulo 6. Uma vez que as temperaturas de fusão das misturas binárias já haviam
sido publicadas na literatura, foi cálculado o desvio médio relativo entre as temperaturas de
fusão experimentais desse estudo e as calculadas por uma equação que foi ajustada para
correlacionar os resultados da temperatura de fusão da literatura com as frações molares
experimentais obtidas no Capítulo 6. O desvio médio relativo entre os resultados
experimentais e os resultados calculados pela equação, como já descrito no Capítulo 6,
ficaram entre 0,2 % a 0,81 %. Tais resultados confirmam uma boa concordância entre os
valores experimentais e os calculados. Os valores da temperatura de fusão dos sistemas
binários encontrados na literatura juntamente com os valores experimentais desse estudo
foram inseridos no mesmo diagrama de fases (Figura 6.2, do Capítulo 6). Como pode-se
observar nessa figura, os resultados apresentaram boa concordância.
Um comportamento complexo na fase sólida devido à presença de várias transições
exotérmicas e endotérmicas foi observado nos diagramas de fases do Capítulo 6. Como
Page 206
Capítulo 7 206
resultado inédito, além do sistema ternário pode-se citar a solução sólida nos sistemas binários
tripalmitina + tribehenina e triestearian + tribehenina que foi confirmada através da
microscopia óptica.
Através da microscopia óptica observou-se que o sistema ternário apresentou solução
sólida próxima a fase rica de tribehenina. Também foi observado através da microscópia de
luz polarizada a existência de diferentes cristais em diferentes composições dos diagramas de
fases binário e ternário. De acordo com Costa et al. (2009), a existência de diferentes cristais
no diagrama de fases pode ser um indicativo da existência de multiplas regiões.
Os coeficientes de atividade foram calculados pelos modelos de Margules de 2 ou de 3
sufixos e NRTL Os desvios quadráticos médios referentes à modelagem termodinâmica de
todos os sistemas estudados variaram entre 0,23 K e 1,52 K, representando que os modelos
conseguiram descrever adequadamente os dados experimentais de ESL.
Page 207
Capítulo 7 207
7.2 Referências bibliográficas
BRUIN, S.; JONGEN, T. R. G. Food Process Engineering: The Last 25 Years and Challenges
Ahead. Comprehensive Reviews in Food Science and Food Safety, v. 2, n. 2, p. 42-81,
2003.
COSTA, M. C. et al. Solid−Liquid Equilibrium of Tristearin with Refined Rice Bran and
Palm Oils. Journal of Chemical & Engineering Data, v. 55, n. 11, p. 5078-5082, 2010.
COSTA, M. C. et al. The solid–liquid phase diagrams of binary mixtures of consecutive, even
saturated fatty acids: differing by four carbon atoms. Chemistry and Physics of Lipids, v.
160, n. 2, p. 85-97, 2009.
TIMMS, R. E. Phase behaviour of fats and their mixtures. Progress in Lipid Research, v. 23,
n. 1, p. 1-38, 1984.
Page 208
Capítulo 8 208
CAPÍTULO 8
CONCLUSÕES GERAIS
Page 209
Capítulo 8 209
Essa tese contribui com dados inéditos de equilíbrio sólido-líquido de vinte sistemas
binários e um sistema ternário, contendo triacilgliceróis, ácidos graxos e álcool graxos que
foram obtidos a partir da técnica de Calorimetria Exploratória Diferencial (DSC). Os
resultados obtidos nesse trabalho permitiram estabelecer as seguintes conclusões:
As temperaturas e entalpias de fusão determinadas nesse trabalho para os componentes
puros apresentaram desvios médios relativos menores que 0,35 % e 7,80 %, respectivamente
em relação às respectivas temperaturas de fusão reportadas na literatura, confirmando a
precisão da técnica de DSC.
Os resultados experimentais mostraram que todas as misturas binárias de
triacilgliceróis + ácidos graxos e triacilgliceróis + álcoois graxos apresentaram
comportamento eutético simples, algumas com formação de solução sólida próxima ao
triacilglicerol puro. Os resultados experimentais das misturas binárias e ternária compostas
por triacilgliceróis apresentaram comportamento eutético com formação parcial de solução
sólida próxima ao triacilglicerol de maior cadeia carbônica.
Com o aumento do número de carbonos do ácido graxo ou álcool graxo em misturas
binárias com o mesmo triacilglicerol, o ponto eutéico no diagrama de fases se desloca para a
região com maior fração molar em triacilglicerol.
Ao se manter fixo o triacilglicerol na mistura binária e substituir o ácido graxo (grupo
carboxila – COOH) por um álcool graxos ( grupo hidroxila – OH) com o mesmo número de
carbonos, foi observado que o ponto eutético se deslocou no diagrama de fases para uma
composição menor de triacilglicerol.
Os eventos térmicos sobrepostos nas curvas térmicas diferenciais ocorrem devido à
proximidade dos valores de temperatura de cada evento térmico e pode ser um indicativo de
transições polimórficas que ocorrem durante o processo de fusão ou cristalização desses
compostos. Uma vez que os eventos térmicos são muito próximos, a determinação da entalpia
de cada evento térmico não conduz a um valor confiável.
Em sistemas graxos, onde a temperatura da reação eutética se encontra muito próximo
da temperatura de fusão do componente puro, não é possível observar experimentalmente a
reação eutética na curva térmica diferencial, uma vez que, pela proximidade dos valores de
temperatura, os eventos térmicos se sobrepõem.
Page 210
Capítulo 8 210
No Capítulo 3 foram apresentados seis diagramas de fases de misturas binárias de
trioleina mais ácidos graxos (ácido cáprico, ácido láurico e ácido mirístico), trioleina mais
álcoois graxos (1-decanol, 1-dodecanol e 1-tetradecanol). Os resultados obtidos através da
técnica de calorimetria exploratória diferencial mostraram que os sistemas apresentam reações
eutéticas simples. A mistura binária trioleina + 1-decanol apresentou dois eventos térmicos,
que foi relacionado com transições na fase sólida. Os parâmetros dos modelos de Margules de
3-sufixos e NRTL foram ajustados aos dados experimentais como boa descrição da linha
liquidus para os sistemas investigados. O desvio quadrático médio (RMSD) variou de 0,3 a
1,5 K, sendo que o melhor ajuste dos dados foi obtido quando utilizado o modelo de Margules
de 3 sufixos. Embora ambos os modelos indiquem a ocorrência de ponto eutético nas misturas
trioleina + ácido láurico, trioleina + ácido mirístico e trioleina + 1-tetradecanol, esse ponto
não pode ser determinado exatamente devido à dificuldade de medir dados experimentais na
região próxima à trioleina pura.
No Capítulo 4 foram apresentados os diagramas de fases de seis misturas binárias de
trilaurina com ácidos graxos (ácido mirístico, ácido palmítico e ácido esteárico), trilaurina
com álcoois graxos (1-tetradecanol, 1-hexadecanol e 1-octadecanol). Os diagramas de fases
das misturas binárias trilaurina + 1-tetradecanol e trilaurina + 1-hexadecanol apresentaram
formação de solução sólida, confirmada pela técnica de microscopia óptica e pelo gráfico de
Tammann. Os parâmetros dos modelos de Margules de 3 sufixos e NRTL foram ajustados aos
dados experimentais e permitiram uma boa descrição da linha liquidus com valores de RMSD
entre 0,3 e 0,59 K.
No Capítulo 5 foram apresentados os diagramas de fases de cinco sistemas binários
composto por trimiristina mais ácidos graxos (ácido cáprico, ácido láurico e ácido esteárico) e
trimiristina mais álcoois graxos (1-dodecanol e 1-tetradecanol). As misturas binárias
trimiristina + ácido cáprico, trimiristina + ácido láurico, trimiristina + 1-dodecanol e
trimiristina + 1-tetradecanol exibiram formação de solução sólida confirmada pela
microscopia óptica. Os dados experimentais foram utilizados para ajustar os parâmetros dos
modelos de Margules de 3sufixos e NTRL e os resultados mostraram que esses modelos
conseguem descrever adequadamente as linhas liquidus dos sistemas acima mencionados,
uma vez que os valores de RMSD ficaram entre 0,21 e 0,69 K.
No Capítulo 6 foram apresentados os diagramas de fases do sistema ternário composto
por tripalmitina + triestearina + tribehenina e dos sistemas binários compostos por tripalmitina
Page 211
Capítulo 8 211
+ triestearina, tripalmitina + tribehenina e triestearina + tribehenina. Os resultados
experimentais exibiram formação de solução sólida que foram confirmadas através da técnica
de microscopia óptica. As temperaturas de fusão dos sistemas binários e o valor calculado
pela equação ajustada com base nos dados da literatura, apresentaram boa concordância, uma
vez que os valores dos desvios relativos médios ficaram entre 0,2 e 0,81 K. Os dados
experimentais dos sistemas binários foram utilizados para ajustar os parâmetros dos modelos
termodinâmicos de Margules de 2 e de 3 sufixos com desvios absolutos médios menores que
0,92 K. Os parâmetros do modelo de Margules de 2 sufixos foram usados para a predição do
equilíbrio sólido-líquido do sistema ternário com desvio absoluto médio igual a 1,14 K. Esses
valores devem ser considerados como uma boa aproximação dos resultados, uma vez que a
abordagem foi totalmente preditiva com base nos parâmetros ajustados aos dados
experimentais dos sistemas binários.
8.1 Sugestões para trabalhos futuros
Com base no que foi discutido, pode-se concluir que ainda há diversos sistemas
binários, ternários ou multicomponentes que podem ser estudados através do equilíbrio
sólido-líquido. Em especial, podem-se sugerir misturas de compostos minoritários e de
acilgliceróis parciais com triacilglicerol, ácidos graxos e álcoois graxos a fim de descrever a
influência dos compostos minoritários no diagrama de fases verificando a solubilidade e
cristalização dos mesmos.
Realização da caracterização de misturas lipídicas, por meio de técnicas como difração
de raio-X e espectroscopia, com o objetivo de compreender melhor o comportamento
apresentado pela fase sólida.
Aprimorar a metodologia para permitir que se obtenham valores confiáveis de entalpia
em especial para curvas térmicas com sobreposição de eventos térmicos.
Page 212
Referências bibliográficas 212
Referências bibliográficas
AFAF, K. E.; JAN, P. Lipid Oxidation Products and Methods Used for Their Analysis. In:
(Ed.). Analysis of Lipid Oxidation: AOCS Publishing, 2005.
AKITA, C. et al. Quasi-elastic neutron scattering study on polymorphism of tristearin:
relationship between dynamical properties and subcell structures. Journal of Crystal
Growth, v. 275, n. 1–2, p. e2187-e2193. 2005.
ALEJANDRO, G. M.; AMANDA, J. W. Physical Properties of Fats and Oils. In: (Ed.).
Handbook of Functional Lipids: CRC Press, 2005. p.135-162. (Functional Foods and
Nutraceuticals).
ALEJANDRO, G. M.; SURESH, S. N. Structure and Mechanical Properties of Fat Crystal
Networks. In: (Ed.). Physical Properties of Lipids: CRC Press, 2002.
ARONS, J. D. S.; LOOS, T. W. D. Phase Behavior: Phenomena, Significance, and Models.
In: SANDLER, S. I. (Ed.). Models for thermodynamic and phase equilibria calculations. .
New York: Marcel Dekker, 1994. p.363-505.
BARBOSA, D. F.; FILHO, P. A. P. Thermodynamic Modeling of Solid-Liquid Equilibrium
of Mixtures of Fatty Alcohols. Proceedings of the VI Brazilian Congress of Applied
Thermodynamics. Salvador - Bahia – Brazil. 2011.
BAYÉS-GARCÍA, L.; CALVET, T.; CUEVAS-DIARTE, M. À.; UENO, S.; SATO, K.
Phase Behavior of Binary Mixture Systems of Saturated-Unsaturated Mixed-Acid
Triacylglycerols: Effects of Glycerol Structures and Chain–Chain Interactions. The Journal
of Physical Chemistry B, v. 119, n. 12, p. 4417-4427. 2015.
BENZIANE, M.; KHIMECHE, K.; DAHMANI, A.; NEZAR, S.; TRACHE, D. Experimental
determination and prediction of (solid plus liquid) phase equilibria for binary mixtures of
heavy alkanes and fatty acids. Molecular Physics, v. 110, n. 11-12, p. 1383-1389. 2012.
BOEKEL, M. A. J. S. V. Some Thermodynamic Activity Coefficient Models. In: (Ed.).
Kinetic Modeling of Reactions In Foods: CRC Press, 2008. (Food Science and
Technology).
BOROS, L. et al. Crystallization Behavior of Mixtures of Fatty Acid Ethyl Esters with Ethyl
Stearate. Energy & Fuels, v. 23, p. 4625-4629. 2009.
BOROS, L. A. D. Modelagem matemática e termodinâmica do equilíbrio sólidolíquido
de sistemas graxos. 2005. (Dissertação). Faculdade de Engenharia Química, Universidade
Estadual de Campinas, Campinas.
BOUZIDI, L.; NARINE, S. S. Relationships between molecular structure and kinetic and
thermodynamic controls in lipid systems: Part III. Crystallization and phase behavior of 1-
palmitoyl-2,3-stearoyl-sn-glycerol (PSS) and tristearoylglycerol (SSS) binary system.
Chemistry and Physics of Lipids, v. 165, n. 1, p. 105-119. 2012.
Page 213
Referências bibliográficas 213
BROWN, M. E.; GALLAGHER, P. K. Chapter 1 Introduction to recent advances, techniques
and applications of thermal analysis and calorimetry. In: MICHAEL, E. B. e PATRICK, K.
G. (Ed.). Handbook of Thermal Analysis and Calorimetry: Elsevier Science B.V.,
v.Volume 5, 2008. p.1-12.
BRUIN, S. Phase equilibria for food product and process design. Fluid Phase Equilibria, v.
158–160, p. 657-671. 1999.
BRUIN, S.; JONGEN, T. R. G. Food Process Engineering: The Last 25 Years and Challenges
Ahead. Comprehensive Reviews in Food Science and Food Safety, v. 2, n. 2, p. 42-81.
2003.
CARARETO, N. D. D.; CASTAGNARO, T.; COSTA, M. C.; MEIRELLES, A. J. A. The
binary (solid + liquid) phase diagrams of (caprylic or capric acid) + (1-octanol or 1-decanol).
The Journal of Chemical Thermodynamics, v. 78, n. 0, p. 99-108. 2014a.
CARARETO, N. D. D.; COSTA, M. C.; MEIRELLES, A. J. A.; PAULY, J. High pressure
solid-liquid equilibrium of fatty acid ethyl esters binary systems. Fluid Phase Equilibria, v.
382, p. 158-163. 2014.
CARARETO, N. D. D.; COSTA, M. C.; ROLEMBERG, M. P.; KRÄHENBÜHL, M. A.;
MEIRELLES, A. J. A. The solid–liquid phase diagrams of binary mixtures of even saturated
fatty alcohols. Fluid Phase Equilibria, v. 303, n. 2, p. 191.e1-191.e8. 2011.
CARARETO, N. D. D.; DOS SANTOS, A. O.; ROLEMBERG, M. P.; CARDOSO, L. P.;
COSTA, M. C.; MEIRELLES, A. J. A. On the solid–liquid phase diagrams of binary mixtures
of even saturated fatty alcohols: Systems exhibiting peritectic reaction. Thermochimica
Acta, v. 589, n. 0, p. 137-147. 2014b.
CEDEÑO, F. O.; PRIETO, M. A. M.; ESPINA, A.; GARCÍA, J. R. Measurements of
temperature and melting heat of some pure fatty acids and their binary and ternary mixtures
by differential scanning calorimetry. Thermochimica Acta, v. 369, n. 1–2, p. 39-50. 2001.
CHARBONNET, G.; SINGLETON, W. S. Thermal properties of fats and oils. Journal of the
American Oil Chemists Society, v. 24, n. 5, p. 140-142. 1947.
CHERNIK, G. G. Phase equilibria in phospholipid-water systems. Advances in Colloid and
Interface Science, v. 61, n. 0, p. 65-129. 1995.
CHOI, P. B.; MCLAUGHLIN, E. Effect of a phase transition on the solubility of a solid.
AIChE Journal, v. 29, n. 1, p. 150-153. 1983.
COSTA, M. C. Determinação Experimental e Modelagem Termodinâmica do Equilíbrio
Sólido-Líquido de Misturas Binárias de Ácidos Graxos Saturados usando a Calorimetria
Exploratória Diferencial. 2004. (Mestrado). Departamento de Processos Químicos,
Universidade Estadual de Campinas. Unicamp, Campinas., Faculdade de Engenharia
Química.
COSTA, M. C. Determinação Experimental do Equilíbrio Sólido-Líquido de Sistemas
Binários de Ácidos Graxos Saturados: Estudo Detalhado da Fase Sólida. 2008.
(Doutorado). Departamento de Processos Químicos - DPQ, Universidade Estadual de
Campinas, Campinas, Laboratório de Propriedades Termodinâmicas - LPT.
Page 214
Referências bibliográficas 214
COSTA, M. C.; BOROS, L. A. D.; BATISTA, M. L. S.; COUTINHO, J. A. P.;
KRAEHENBUEHL, M. A.; MEIRELLES, A. J. A. Phase diagrams of mixtures of ethyl
palmitate with fatty acid ethyl esters. Fuel, v. 91, n. 1, p. 177-181. 2012.
COSTA, M. C.; BOROS, L. A. D.; ROLEMBERG, M. P.; KR HENB HL, M. A.;
MEIRELLES, A. J. A. Solid−Liquid Equilibrium of Saturated Fatty Acids + Triacylglycerols.
Journal of Chemical & Engineering Data, v. 55, n. 2, p. 974-977. 2010a.
COSTA, M. C.; BOROS, L. A. D.; SOU A, J. A.; ROLEMBERG, M. P.; KR HENB HL,
M. A.; MEIRELLES, A. J. A. Solid–Liquid Equilibrium of Binary Mixtures Containing Fatty
Acids and Triacylglycerols. Journal of Chemical & Engineering Data, v. 56, n. 8, p. 3277-
3284. 2011.
COSTA, M. C.; CARARETO, N. D. D.; MEIRELLES, A. J. A. Phase diagrams of binary
fatty alcohol + fatty acid mixtures. International Congress on Engineering and Food, 2011.
COSTA, M. C.; KRÄHENBÜHL, M. A.; MEIRELLES, A. J. A.; DARIDON, J. L.; PAULY,
J.; COUTINHO, J. A. P. High pressure solid–liquid equilibria of fatty acids. Fluid Phase
Equilibria, v. 253, n. 2, p. 118-123. 2007a.
COSTA, M. C.; ROLEMBERG, M. P.; BOROS, L. A. D.; KRÄHENBÜHL, M. A.; DE
OLIVEIRA, M. G.; MEIRELLES, A. J. A. Solid−Liquid Equilibrium of Binary Fatty Acid
Mixtures. Journal of Chemical & Engineering Data, v. 52, n. 1, p. 30-36. 2007b.
COSTA, M. C.; ROLEMBERG, M. P.; DOS SANTOS, A. O.; CARDOSO, L. P.;
KR HENB HL, M. A.; MEIRELLES, A. J. A. Solid−Liquid Equilibrium of Tristearin with
Refined Rice Bran and Palm Oils. Journal of Chemical & Engineering Data, v. 55, n. 11, p.
5078-5082. 2010b.
COSTA, M. C.; ROLEMBERG, M. P.; MEIRELLES, A. J. A.; COUTINHO, J. A. P.;
KRÄHENBÜHL, M. A. The solid–liquid phase diagrams of binary mixtures of even saturated
fatty acids differing by six carbon atoms. Thermochimica Acta, v. 496, n. 1–2, p. 30-37.
2009a.
COSTA, M. C. et al. The solid–liquid phase diagrams of binary mixtures of consecutive, even
saturated fatty acids: differing by four carbon atoms. Chemistry and Physics of Lipids, v.
160, n. 2, p. 85-97. 2009b.
DA SILVA, R. et al. Microstructure and Thermal Profile of Structured Lipids Produced by
Continuous Enzymatic Interesterification. Journal of the American Oil Chemists' Society,
v. 90, n. 5, p. 631-639. 2013.
DANIEL, J.; RAJASEKHARAN, R. Organogelation of plant oils and hydrocarbons by long-
chain saturated FA, fatty alcohols, wax esters, and dicarboxylic acids. Journal of the
American Oil Chemists' Society, v. 80, n. 5, p. 417-421. 2003.
DOMAŃSKA, U.; GON ÁLE , J. A. Solid-liquid equilibria for systems containing long-
chain 1-alkanols I. Experimental data for 1-dodecanol, 1-tetradecanol, 1-hexadecanol, 1-
octadecanol or 1-icosanol benzene or toluene mixtures. Characterization in terms of
DISQUAC. Fluid Phase Equilibria, v. 119, n. 1–2, p. 131-151. 1996a.
Page 215
Referências bibliográficas 215
DOMAŃSKA, U.; GON ÁLE , J. A. Solid-liquid equilibria for systems containing long-
chain 1-alkanols. II. Experimental data for 1-dodecanol, 1-tetradecanol, 1-hexadecanol, 1-
octadecanol or 1-eicosanol + CCl4 or + cyclohexane mixtures. Characterization in terms of
DISQUAC. Fluid Phase Equilibria, v. 123, n. 1–2, p. 167-187. 1996b.
DOMAŃSKA, U.; ŁACHWA, J. (Solid + liquid) phase equilibria of binary mixtures
containing N-methyl-2-pyrrolidinone and long-chain n-alkanols at atmospheric pressure.
Fluid Phase Equilibria, v. 198, n. 1, p. 1-14. 2002.
DOMAŃSKA, U.; MORAWSKI, P.; PIEKARSKA, M. Solid−Liquid Phase Equilibria of 1-
Decanol and 1-Dodecanol with Fragrance Raw Materials Based on Cyclohexane. Journal of
Chemical & Engineering Data, v. 54, n. 4, p. 1271-1276. 2009.
DOMAŃSKA, U.; PADUS ŃSKI, K.; DA BSKA, J. Measurements, Correlations, and
Mod. UNIFAC (Do) Prediction of (Solid−Liquid) Phase Equilibria Diagrams in Binary
Systems (Aliphatic Ketone + an Alcohol). Journal of Chemical & Engineering Data, v. 56,
n. 4, p. 881-888. 2010.
ECKERT, K.-A.; DASGUPTA, S.; SELGE, B.; AY, P. Solid liquid phase diagrams of binary
fatty acid mixtures—Palmitic/stearic with oleic/linoleic/linolenic acid mixture.
Thermochimica Acta, v. 630, p. 50-63. 2016.
ECKERT, T.; MÜLLER, J. Zur Schmelzenthalpie und Schmelzentropie von Fettalkoholen.
Archiv der Pharmazie, v. 311, n. 1, p. 31-34. 1978.
ELSABEE, M.; PRANKERD, R. J. SOLID-STATE PROPERTIES OF DRUGS .2. PEAK
SHAPE-ANALYSIS AND DECONVOLUTION OF OVERLAPPING ENDOTHERMS IN
DIFFERENTIAL SCANNING CALORIMETRY OF CHIRAL MIXTURES. International
Journal of Pharmaceutics, v. 86, n. 2-3, p. 211-219. 1992.
F.A.O. OECD-FAO Agricultural Outlook Available in www.fao.org. Acessed in
16/08/2016.
FANG, W.; MAYAMA, H.; TSUJII, K. Spontaneous Formation of Fractal Structures on
Triglyceride Surfaces with Reference to Their Super Water-Repellent Properties. The
Journal of Physical Chemistry B, v. 111, n. 3, p. 564-571. 2007.
FERGUSON, R. H.; LUTTON, E. S. The Polymorphism of Triolein. Journal of the
American Chemical Society, v. 69, n. 6, p. 1445-1448. 1947.
GAMSJAGER, H.; LORIMER, J. W.; SCHARLIN, P.; SHAW, D. G. Glossary of terms
related to solubility. Pure and Applied Chemistry., v. v.80, n.2, p. p.233-276. 2008.
GANDOLFO, F. G.; BOT, A.; FLÖTER, E. Phase diagram of mixtures of stearic acid and
stearyl alcohol. Thermochimica Acta, v. 404, n. 1–2, p. 9-17. 2003.
GANGULY, J. Thermodynamics in Earth and Planetary Sciences. Berlin: Springer, 2007.
GARTI, N.; SATO, K. Crystallization and polymorphism of fats and fatty acids. First
Edition. New York: Marcel Dekker, 1989.
Page 216
Referências bibliográficas 216
GMELIN, E.; SARGE, S. M. CALIBRATION OF DIFFERENTIAL SCANNING
CALORIMETERS. Pure and Applied Chemistry, v. 67, n. 11, p. 1789-1800. 1995.
GMELIN, E.; SARGE ST, M. Calibration of differential scanning calorimeters. Pure and
Applied Chemistry. 67:1789 p.1995.
GUIMARÃES, L. M.; ZANOTTO, E. D. Cristalização e taxa crítica de resfriamento para
vitrificação do poli(sebacato de decametileno). Química Nova, v. 26, p. 202-207. 2003.
GUNSTONE, F. D.; HARWOOD, J. L.; DIJKSTRA, A. J. The Lipid Handbook. Third
Edition. CRC Press, 2007.
HATAKEYAMA, T.; ZHENHAI, L. Handbook of Thermal Analysis. Wiley, 1998.
HEMMINGER, W.; SARGE, S. M. Chapter 1 - Definitions, Nomenclature, Terms and
Literature. In: MICHAEL, E. B. (Ed.). Handbook of Thermal Analysis and Calorimetry:
Elsevier Science B.V., v.Volume 1, 1998. p.1-73.
HIMAWAN, C.; MACNAUGHTAN, W.; FARHAT, I. A.; STAPLEY, A. G. F. Polymorphic
occurrence and crystallization rates of tristearin/tripalmitin mixtures under non-isothermal
conditions. European Journal of Lipid Science and Technology, v. 109, n. 1, p. 49-60.
2007.
HÖHNE, G.; HEMMINGER, W.; FLAMMERSHEIM, H. J. Differential Scanning
Calorimetry. Springer, 2003.
HONG, B.; LI, D.; LEI, Q.; XU, L.; FANG, W.; MAYAMA, H. Kinetics on formation of
super water repellent surfaces from phase transformation in binary mixtures of trimyristin and
tripalmitin. Colloids and Surfaces A: Physicochemical and Engineering Aspects, v. 396, p.
130-136. 2012.
HUANG, C.-C.; CHEN, Y.-P. Measurements and model prediction of the solid–liquid
equilibria of organic binary mixtures. Chemical Engineering Science, v. 55, n. 16, p. 3175-
3185. 2000.
HUMPHREY, K. L.; SURESH, S. N. Lipid Phase Behavior. In: (Ed.). Fat Crystal
Networks: CRC Press, 2004. p.83-114. (Food Science and Technology).
INOUE, T.; HISATSUGU, Y.; ISHIKAWA, R.; SUZUKI, M. Solid–liquid phase behavior of
binary fatty acid mixtures: 2. Mixtures of oleic acid with lauric acid, myristic acid, and
palmitic acid. Chemistry and Physics of Lipids, v. 127, n. 2, p. 161-173. 2004a.
INOUE, T.; HISATSUGU, Y.; SUZUKI, M.; WANG, Z.; ZHENG, L. Solid–liquid phase
behavior of binary fatty acid mixtures: 3. Mixtures of oleic acid with capric acid (decanoic
acid) and caprylic acid (octanoic acid). Chemistry and Physics of Lipids, v. 132, n. 2, p.
225-234. 2004b.
JAKOB, A.; JOH, R.; ROSE, C.; GMEHLING, J. Solid-liquid equilibria in binary mixtures of
organic compounds. Fluid Phase Equilibria, v. 113, n. 1–2, p. 117-126. 1995.
Page 217
Referências bibliográficas 217
KANEKO, F.; KUBOTA, H. Vibrational spectroscopic study on the polytypism of n-alkanes
and fatty acids. Current Opinion in Colloid & Interface Science, v. 16, n. 5, p. 367-373.
2011.
KARAIPEKLI, A.; SARI, A.; KAYGUSUZ, K. Thermal Properties and Long-term
Reliability of Capric Acid/Lauric Acid and Capric Acid/Myristic Acid Mixtures for Thermal
Energy Storage. Energy Sources, Part A: Recovery, Utilization, and Environmental
Effects, v. 30, n. 13, p. 1248-1258. 2008.
KELLENS, M.; MEEUSSEN, W.; GEHRKE, R.; REYNAERS, H. Synchrotron radiation
investigations of the polymorphic transitions of saturated monoacid triglycerides. Part 1:
Tripalmitin and tristearin. Chemistry and Physics of Lipids, v. 58, n. 1–2, p. 131-144.
1991a.
KELLENS, M.; MEEUSSEN, W.; HAMMERSLEY, A.; REYNAERS, H. Synchrotron
radiation investigations of the polymorphic transitions in saturated monoacid triglycerides.
Part 2: Polymorphism study of a 50:50 mixture of tripalmitin and tristearin during
crystallization and melting. Chemistry and Physics of Lipids, v. 58, n. 1–2, p. 145-158.
1991b.
KELLENS, M.; MEEUSSEN, W.; REYNAERS, H. Study of the polymorphism and the
crystallization kinetics of tripalmitin: A microscopic approach. Journal of the American Oil
Chemists Society, v. 69, n. 9, p. 906-911.
KELLENS, M.; MEEUSSEN, W.; REYNAERS, H. Crystallization and phase transition
studies of tripalmitin. Chemistry and Physics of Lipids, v. 55, n. 2, p. 163-178. 1990.
KELLENS, M.; MEEUSSEN, W.; RIEKEL, C.; REYNAERS, H. Time resolved x-ray
diffraction studies of the polymorphic behaviour of tripalmitin using synchrotron radiation.
Chemistry and Physics of Lipids, v. 52, n. 2, p. 79-98. 1990.
KELLENS, M.; REYNAERS, H. Study of the Polymorphism of Saturated Monoacid
Triglycerides I: Melting and Crystallization Behaviour of Tristearin. Lipid / Fett:
WILEY-VCH Verlag. 94:94-100 p.1992.
KWON, R.-H.; KIM, J.-I.; PARK, S.-J.; CHOI, Y.-Y. Solid–liquid equilibrium, excess molar
volume, and deviations in the molar refractivity for the binary and ternary mixtures of
Alamine 304-1 with 1-octanol, 2-octanol, and 1-decanol. Fluid Phase Equilibria, v. 324, n.
0, p. 44-49. 2012.
LAWLER, P. J.; DIMICK, P. S. Crystallization and Polymorphism of Fats. In: (Ed.). Food
Lipids: CRC Press, 2008. (Food Science and Technology).
MACNAUGHTAN, W.; FARHAT, I. A.; HIMAWAN, C.; STAROV, V. M.; STAPLEY, A.
G. F. A differential scanning calorimetry study of the crystallization kinetics of tristearin-
tripalmitin mixtures. Journal of the American Oil Chemists Society, v. 83, n. 1, p. 1-9.
2006.
MARANGONI, A., G; WESDORP, L. H. Crystallography and Polymorphism. In: (Ed.).
Structure and Properties of Fat Crystal Networks, Second Edition: CRC Press, 2012.
p.19-44.
Page 218
Referências bibliográficas 218
MARANGONI, A. G.; WESDORP, L. H. Structure and Properties of fat crystal
networks. London New York: CRC Press, 2013.
MATOS, F. C.; COSTA, M. C.; ALMEIDA MEIRELLES, A. J.; BATISTA, E. A. C. Binary
solid–liquid equilibrium systems containing fatty acids, fatty alcohols and triolein by
differential scanning calorimetry. Fluid Phase Equilibria, v. 404, n. 0, p. 1-8. 2015.
MATOS, F. C.; COSTA, M. C.; MEIRELLES, A. J. D. A.; BATISTA, E. A. C. Binary solid-
liquid equilibrium systems containing fatty acids, fatty alcohols and trilaurin by differential
scanning calorimetry. Fluid Phase Equilibria, v. 423, p. 74-83. 2016.
MAXIMO, G. J.; AQUINO, R. T.; MEIRELLES, A. J. A.; KRÄHENBÜHL, M. A.; COSTA,
M. C. Enhancing the description of SSLE data for binary and ternary fatty mixtures. Fluid
Phase Equilibria.
MAXIMO, G. J. et al. On the solid-liquid equilibrium of binary mixtures of fatty alcohols and
fatty acids. Fluid Phase Equilibria, v. 366, p. 88-98. 2014a.
MAXIMO, G. J.; COSTA, M. C.; COUTINHO, J. A. P.; MEIRELLES, A. J. A. Trends and
demands in the solid-liquid equilibrium of lipidic mixtures. RSC Advances, v. 4, n. 60, p.
31840-31850. 2014b.
MAXIMO, G. J.; COSTA, M. C.; MEIRELLES, A. J. A. Solid-liquid equilibrium of triolein
with fatty alcohols. Brazilian Journal of Chemical Engineering, v. 30, p. 33-43. 2013.
MAXIMO, G. J.; COSTA, M. C.; MEIRELLES, A. J. A. The Crystal-T algorithm: a new
approach to calculate the SLE of lipidic mixtures presenting solid solutions. Physical
Chemistry Chemical Physics, v. 16, n. 31, p. 16740-16754. 2014.
MAXIMO, G. J.; COUTINHO, J. A. P.; COSTA, M. C.; MEIRELLES, A. J. A. On the solid-
liquid equilibrium behavior of fatty acids with ethanolamines. In: DAVID, N.;JAUBERT, J.
N. e PRIVAT, R. (Ed.). Xxxix Jeep - 39th Edition of the Joint European Days on
Equilibrium between Phases, v.3, 2013. (MATEC Web of Conferences).
MISRA, A. K.; MISRA, M.; PANPALIA, G. M.; DORLE, A. K. Thermoanalytical and
Microscopic Investigation of Interaction between Paracetamol and Fatty Acid Crystals.
Journal of Macromolecular Science, Part A, v. 44, n. 7, p. 685-690. 2007.
MORENO, E. et al. Polymorphism of even saturated carboxylic acids from n-decanoic to n-
eicosanoic acid. New Journal of Chemistry, v. 31, n. 6, p. 947-957. 2007.
MOSSELMAN, C.; MOURIK, J.; DEKKER, H. Enthalpies of phase change and heat
capacities of some long-chain alcohols. Adiabatic semi-microcalorimeter for studies of
polymorphism. The Journal of Chemical Thermodynamics, v. 6, n. 5, p. 477-487. 1974.
MUDGE, S. M.; BELANGER, S. E.; NIELSEN, A. M. Fatty Alcohols - Anthropogenic and
Natural Occurrence in the Environment. In: (Ed.): RSC Publishing, 2008.
NELSON, S. A. Ternary Phase Diagrams. Crystallization in Ternary Systems.Available
in Tulane University. Acessed in
Page 219
Referências bibliográficas 219
NICHOLS, G. et al. Evaluation of the Vaporization, Fusion, and Sublimation Enthalpies of
the 1-Alkanols: The Vaporization Enthalpy of 1-, 6-, 7-, and 9-Heptadecanol, 1-Octadecanol,
1-Eicosanol, 1-Docosanol, 1-Hexacosanol, and Cholesterol at T = 298.15 K by Correlation
Gas Chromatography. Journal of Chemical & Engineering Data, v. 51, n. 2, p. 475-482.
2006.
NILS, H.; HANS, S. Techniques and Applications in Lipid Analysis. In: (Ed.). Lipid
Analysis and Lipidomics: AOCS Publishing, 2006. p.3-26.
NISHIMURA, K. et al. Solid−Liquid Equilibria in Fatty Acid/Triglycerol Systems. Journal
of Chemical & Engineering Data, v. 56, n. 4, p. 1613-1616. 2011.
NIST. National Institute of Standards and Technology. Uncertainty of Measurement
Results2000.
NOR HAYATI, I.; CHE MAN, Y. B.; TAN, C. P.; NOR AINI, I. Thermal behavior of
concentrated oil-in-water emulsions based on soybean oil and palm kernel olein blends. Food
Research International, v. 42, n. 8, p. 1223-1232. 2009.
NYVLT, J. Solid-liquid phase equilibria. Amsterdam: Elsevier, 1977.
O'BRIEN, R. D. Fats and Oils Formulation. In: (Ed.). Fats and Oils: CRC Press, 2003.
OLLIVON, M.; PERRON, R. Measurements of enthalpies and entropies of unstable
crystalline forms of saturated even monoacid triglycerides. Thermochimica Acta, v. 53, n. 2,
p. 183-194. 1982.
PATRICK, J. L.; PAUL, S. D. Crystallization and Polymorphism of Fats. In: (Ed.). Food
Lipids: CRC Press, 2002. (Food Science and Technology).
PISKA, I.; ÁRUBOVÁ, M.; LOUŽECKÝ, T.; KARAMI, H.; FILIP, V. R. Properties and
crystallization of fat blends. Journal of Food Engineering, v. 77, n. 3, p. 433-438. 2006.
PIVETTE, P.; FAIVRE, V.; BRUBACH, J.-B.; DASTE, G.; OLLIVON, M.; LESIEUR, S.
Polymorphism of glyceryl behenates: From the individual compounds to the pharmaceutical
excipient. Chemistry and Physics of Lipids, v. 183, p. 191-203. 2014.
PRAUSNITZ, J. M.; LICHTENTHALER, R. N.; AZEVEDO, E. G. Molecular
Thermodynamics of Fluid-Phase Equilibria. Third Edition. Prentice Hall, 1998.
PRAUSNITZ, J. M.; PRESTON, G. T.; FUNK, E. W. Solubilities of hydrocarbons and
carbon dioxide in liquid methane and in liquid argon. The Journal of Physical Chemistry, v.
75, n. 15, p. 2345-2352. 1971.
QIAN, C.; DECKER, E.; XIAO, H.; MCCLEMENTS, D. Solid Lipid Nanoparticles: Effect of
Carrier Oil and Emulsifier Type on Phase Behavior and Physical Stability. Journal of the
American Oil Chemists' Society, v. 89, n. 1, p. 17-28. 2012.
RANGAIAH, G. P. Evaluation of genetic algorithms and simulated annealing for phase
equilibrium and stability problems. Fluid Phase Equilibria, v. 187–188, p. 83-109. 2001.
Page 220
Referências bibliográficas 220
REID, R. C.; PRAUSNITZ, J. M.; POULING, B. E. The Properties of Gases and Liquids.
New York: McGraw-Hill, 1987.
RENON, H.; PRAUSNITZ, J. M. Local compositions in thermodynamic excess functions for
liquid mixtures. AIChE Journal, v. 14, n. 1, p. 135-144. 1968.
REUTER, J.; WURFLINGER, A. DIFFERENTIAL THERMAL-ANALYSIS OF LONG-
CHAIN N-ALCOHOLS UNDER HIGH-PRESSURE. Berichte Der Bunsen-Gesellschaft-
Physical Chemistry Chemical Physics, v. 99, n. 10, p. 1247-1251. 1995.
ROCHA, S. A.; GUIRARDELLO, R. Optimization Technique Applied for the Solid-Liquid
Equilibrium of Binary Fatty Mixtures. In: RITA MARIA DE BRITO ALVES, C. A. O. D. N.
e EVARISTO CHALBAUD, B. (Ed.). Computer Aided Chemical Engineering: Elsevier,
v.Volume 27, 2009. p.711-716.
SATHIVEL, S.; PRINYAWIWATKUL, W.; NEGULESCU, I.; KING, J. Determination of
Melting Points, Specific Heat Capacity and Enthalpy of Catfish Visceral Oil During the
Purification Process. Journal of the American Oil Chemists' Society, v. 85, n. 3, p. 291-
296. 2008.
SATO, K. Crystallization behaviour of fats and lipids — a review. Chemical Engineering
Science, v. 56, n. 7, p. 2255-2265. 2001.
SATO, K.; KOBAYASHI, M.; MORISHITA, H. Stability, occurrence and step morphology
of polymorphs and polytypes of stearic acid. Journal of Crystal Growth, v. 87, n. 2, p. 236-
242. 1988.
SATO, K.; UENO, S. Crystallization, transformation and microstructures of polymorphic fats
in colloidal dispersion states. Current Opinion in Colloid & Interface Science, v. 16,
n. 5, p. 384-390. 2011.
SATO, K.; UENO, S. Crystallization, transformation and microstructures of polymorphic fats
in colloidal dispersion states. Current Opinion in Colloid & Interface Science, v. 16, n. 5,
p. 384-390. 2011.
SATO, K.; UENO, S.. Physical properties of fats in food. 2. John Wiley & Sons, Ltd, 2014.
1-38.
SCHAAKE, R. C. F.; VAN MILTENBURG, J. C.; DE KRUIF, C. G. Thermodynamic
properties of the normal alkanoic acids II. Molar heat capacities of seven even-numbered
normal alkanoic acids. The Journal of Chemical Thermodynamics, v. 14, n. 8, p. 771-778.
1982.
SCHAINK, H. M.; VAN MALSSEN, K. F.; MORGADO-ALVES, S.; KALNIN, D.; VAN
DER LINDEN, E. Crystal network for edible oil organogels: Possibilities and limitations of
the fatty acid and fatty alcohol systems. Food Research International, v. 40, n. 9, p. 1185-
1193. 2007.
SCRIMGEOUR, C. Chemistry of Fatty Acids. In: (Ed.). Bailey's Industrial Oil and Fat
Products: John Wiley & Sons, Inc., 2005.
Page 221
Referências bibliográficas 221
SINGH, S. K.; JALALI, A. F.; ALDEN, M. Modulated temperature differential scanning
calorimetry for examination of tristearin polymorphism: I. Effect of operational parameters.
Journal of the American Oil Chemists Society, v. 76, n. 4, p. 499-505. 1999.
SLAUGHTER, D. W.; DOHERTY, M. F. Calculation of solid-liquid equilibrium and
crystallization paths for melt crystallization processes. Chemical Engineering Science, v. 50,
n. 11, p. 1679-1694. 1995.
SMITH, J. M.; VAN NESS, H. C.; ABBOTT, M. M. Introducao a termodinamica da
engenharia quimica. LTC, 2000.
SOLÍS, F. J. A.; DURÁN, B. C. Characterization of eutectic mixtures in different natural fat
blends by thermal analysis. European Journal of Lipid Science and Technology, v. 105, n.
12, p. 742-748. 2003.
SONG, S.; DONG, L.; CHEN, S.; XIE, H.; XIONG, C. Stearic–capric acid eutectic/activated-
attapulgiate composite as form-stable phase change material for thermal energy storage.
Energy Conversion and Management, v. 81, n. 0, p. 306-311. 2014.
SU UKI, M.; OGAKI, T.; SATO, K. Crystallization and transformation mechanisms of α, β-
and γ-polymorphs of ultra-pure oleic acid. Journal of the American Oil Chemists’ Society,
v. 62, n. 11, p. 1600-1604. 1985.
TADIE, M. et al. Solid–liquid equilibria measurements for binary systems comprising
(butyric acid + propionic or pentanoic acid) and (heptanoic acid + propionic or butyric or
pentanoic or hexanoic acid). The Journal of Chemical Thermodynamics, v. 57, n. 0, p.
485-492. 2013.
TAKEUCHI, M.; UENO, S.; SATO, K. Synchrotron Radiation SAXS/WAXS Study of
Polymorph-Dependent Phase Behavior of Binary Mixtures of Saturated Monoacid
Triacylglycerols. Crystal Growth & Design, v. 3, n. 3, p. 369-374. 2003.
TAN, C. P.; CHE MAN, Y. B. Differential scanning calorimetric analysis of edible oils:
Comparison of thermal properties and chemical composition. Journal of the American Oil
Chemists' Society, v. 77, n. 2, p. 143-155. 2000.
TEIXEIRA, A. C. T.; GONÇALVES DA SILVA, A. M. P. S.; FERNANDES, A. C. Phase
behaviour of stearic acid–stearonitrile mixtures: A thermodynamic study in bulk and at the
air–water interface. Chemistry and Physics of Lipids, v. 144, n. 2, p. 160-171. 2006.
TH DE, L. et al. Liquid-Multiple Solid Phase Equilibria in Fats. In: (Ed.). Fat Crystal
Networks: CRC Press, 2004. p.481-709. (Food Science and Technology).
TIMMS, R. E. Phase behaviour of fats and their mixtures. Progress in Lipid Research, v. 23,
n. 1, p. 1-38. 1984.
TUMAKAKA, F.; PRIKHODKO, I. V.; SADOWSKI, G. Modeling of solid–liquid equilibria
for systems with solid-complex phase formation. Fluid Phase Equilibria, v. 260, n. 1, p. 98-
104. 2007.
VAN MILTENBURG, J. C.; OONK, H. A. J.; VENTOLA, L. Heat Capacities and Derived
Thermodynamic Functions of 1-Octadecanol, 1-Nonadecanol, 1-Eicosanol, and 1-Docosanol
Page 222
Referências bibliográficas 222
between 10 K and 370 K. Journal of Chemical & Engineering Data, v. 46, n. 1, p. 90-97.
2001.
VENTOLÀ, L. et al. Decanedioic Acid (C10H18O4)/Dodecanedioic Acid (C12H22O4)
System: Polymorphism of the Components and Experimental Phase Diagram. Helvetica
Chimica Acta, v. 91, n. 7, p. 1286-1298. 2008.
VENTOLA, L. et al. Melting behaviour in the n-alkanol family. Enthalpy-entropy
compensation. Physical Chemistry Chemical Physics, v. 6, n. 8, p. 1786-1791. 2004.
VENTOLÀ, L. et al. The Binary System Tetradecanedioic Acid–Hexadecanedioic Acid:
Polymorphism of the Components and Experimental Phase Diagram. Helvetica Chimica
Acta, v. 89, n. 9, p. 2027-2039. 2006.
WEI, D.; HAN, S.; WANG, B. Solid–liquid phase equilibrium study of binary mixtures of n-
octadecane with capric, and lauric acid as phase change materials (PCMs). Fluid Phase
Equilibria, v. 373, n. 0, p. 84-88. 2014.
WEI, D.; ZHANG, X.; LI, H. Solid–liquid phase equilibrium study of n-octadecane + lauryl
alcohol binary mixtures. The Journal of Chemical Thermodynamics, v. 60, n. 0, p. 94-97.
2013.
WESDORP, L. H. Liquid-multiple solid phase equilibria in fats - theory and
experiments. 1990. (Doctoral thesis). Chemicus, Delft University of Technology, Delft.
WON, K. W. Thermodynamic model of liquid-solid equilibria for natural fats and oils. Fluid
Phase Equilibria, v. 82, n. 0, p. 261-273. 1993.
XING, J.; TAN, Z. C.; SHI, Q.; TONG, B.; WANG, S. X.; LI, Y. S. Heat capacity and
thermodynamic properties of 1-hexadecanol. Journal of Thermal Analysis and
Calorimetry, v. 92, n. 2, p. 375-380. 2008.
YAMAKI, S. B.; PEDROSO, A. G.; ATVARS, T. D. Z. O estado vítreo dentro da perspectiva
do curso de graduação em química (físico-química). Química Nova, v. 25, p. 330-334. 2002.
ZENG, J. L. et al. Phase diagram of palmitic acid-tetradecanol mixtures obtained by DSC
experiments. Journal of Thermal Analysis and Calorimetry, v. 95, n. 2, p. 501-505. 2009.
ZHANG, J.-J.; ZHANG, J.-L.; HE, S.-M.; WU, K.-Z.; LIU, X.-D. Thermal studies on the
solid–liquid phase transition in binary systems of fatty acids. Thermochimica Acta, v. 369,
n. 1–2, p. 157-160. 2001.
ZHAO, P.; YUE, Q.; HE, H.; GAO, B.; WANG, Y.; LI, Q. Study on phase diagram of fatty
acids mixtures to determine eutectic temperatures and the corresponding mixing proportions.
Applied Energy, v. 115, n. 0, p. 483-490. 2014.
ZUO, J. G.; LI, W. Z.; WENG, L. D. Thermal performance of caprylic acid/1-dodecanol
eutectic mixture as phase change material (PCM). Energy and Buildings, v. 43, n. 1, p. 207-
210. 2011.
Page 223
Anexo A 223
ANEXO A – Neste anexo serão apresentadas algumas tabelas de sistemas de compostos graxos que possuem dados na literatura.
Tabela A.1 Triacilglicerol + álcool graxo.
Triacilglicerol Álcool
octanol Decanol dodecanol tetradecanol hexadecanol octadecanol álcool oléico
Tricaprilina
Tricaprina
Trilaurina
Trimiristina [18] [18]
Tripalmitina [18] [18]
Triestearina
Trioleina [17] [17]
Trilinoleína
Trilinolenina
[17] (Maximo et al., 2012)
[18] (Artigo em preparação - grupo de pesquisa)
Page 224
Anexo A 224
Tabela A.2 Triacilglicerol + ácido graxo.
Triacilglicerol Ácido
caprílico cáprico láurico mirístico palmítico esteárico oléico Linoleico linolênico
Tricaprilina [19]
Tricaprina
Trilaurina
Trimiristina
Tripalmitina [6] [16] [6]
Triestearina [16] [16]
Trioleina [6] [19]
Trilinoleína [6]
Trilinolenina [19]
[6] (Nishimura et al., 2011)
[16] (Costa, Boros, et al., 2011)
[19] (Costa et al., 2010)
Page 225
Anexo A 225
Tabela A.3 Sistemas graxos compostos por ácido graxo + ácido graxo.
Sistemas Referências Sistemas Referências
Ácido caprílico + ácido cáprico (Costa, Sardo, Rolemberg,
Coutinho, et al., 2009) Ácido mirístico + ácido palmítico
(Costa, Sardo, Rolemberg,
Coutinho, et al., 2009)
Ácido caprílico + ácido láurico (Costa, Sardo, Rolemberg,
Ribeiro-Claro, et al., 2009) Ácido mirístico + ácido esteárico
(Costa, Sardo, Rolemberg,
Ribeiro-Claro, et al., 2009)
Ácido caprílico + ácido mirístico (Costa, Rolemberg, et al., 2009) Ácido mirístico + ácido oleico (Inoue, T. et al., 2004)
Ácido caprílico + ácido oleico (Inoue, Tohru et al., 2004) Ácido palmítico + ácido esteárico (Costa, Sardo, Rolemberg,
Coutinho, et al., 2009)
Ácido cáprico + ácido láurico (Costa, Sardo, Rolemberg,
Coutinho, et al., 2009) Ácido palmítico + ácido oleico (Nishimura et al., 2011)
Ácido cáprico + ácido mirístico (Costa, Sardo, Rolemberg,
Ribeiro-Claro, et al., 2009) Ácido palmítico + ácido linoleico (Nishimura et al., 2011)
Ácido cáprico + ácido palmítico (Costa, Rolemberg, et al., 2009) Ácido oleico + ácido palmítico (Cedeño et al., 2001)
Ácido cáprico + ácido esteárico (Costa, M. C. et al., 2007) Ácido oleico + ácido esteárico (Cedeño et al., 2001)
Ácido cáprico + ácido oleico (Inoue, Tohru et al., 2004) Ácido oleico + ácido elaídico (Mod et al., 1968)
Ácido láurico + ácido mirístico (Costa, Sardo, Rolemberg,
Coutinho, et al., 2009) Ácido oleico + ácido linoléico (Rolemberg, 2002)
Ácido láurico + ácido palmítico (Costa, Sardo, Rolemberg,
Ribeiro-Claro, et al., 2009)
Ácido decanedioico + ácido
dodecanedioico (Ventolà et al., 2008)
Ácido láurico + ácido esteárico (Costa, Rolemberg, et al., 2009) Ácido tetradecanedioico + ácido
hexadecanedioico (Ventola et al., 2006)
Ácido láurico + ácido oleico (Inoue, T. et al., 2004)
Page 226
Anexo A 226
Tabela A.4 Sistemas graxos compostos por álcool graxo + álcool graxo.
Sistemas Referências Sistemas Referências
1-octanol + 1-decanol (Carareto, Dos Santos, et al.,
2014)
1-tetradecanol + 1-octadecanol (Carareto, Dos Santos, et al., 2014)
1-octanol + 1-dodecanol (Carareto et al., 2011) 1-dodecanol + 1-tetradecanol (Carareto, 2010)
1-octanol + 1-tetradecanol (Carareto et al., 2011) 1-tetradecanol + 1-hexadecanol (Carareto, 2010)
1-decanol + 1-dodecanol (Carareto, Dos Santos, et al.,
2014)
1-hexadecanol + 1-octadecanol (Carareto, 2010)
1-decanol + 1-tetradecanol (Carareto et al., 2011) Ciclohexanol + 1-dodecane (Lohmann et al., 1997)
1-decanol + 1-hexadecanol (Carareto et al., 2011) Ciclohexanol + ciclohexano (Lohmann et al., 1997)
1-dodecanol + 1-hexadecanol (Carareto, Dos Santos, et al.,
2014)
Ciclohexano + 1- petanol (Lohmann et al., 1997)
1-dodecanol + 1-octadecanol (Carareto et al., 2011) Ciclohexano + 1- petanol (Lohmann et al., 1997)
n-heptadecanol + n-octadecanol (Yamamoto et al., 1990)
Page 227
Anexo A 227
Tabela A.5 Sistemas graxos compostos por ácido graxo + álcool graxo.
Sistemas Referências Sistemas Referências
Ácido caprílico + 1-octanol (Carareto, Castagnaro, et
al., 2014)
Ácido palmítico + 1-dodecanol (Costa, 2011)
Ácido caprílico + 1-decanol (Carareto, Castagnaro, et
al., 2014)
Ácido palmítico + 1-tetradecanol
(Zeng et al., 2009)
Ácido caprílico + 1-dodecanol (Zuo et al., 2011) Ácido palmítico + 1-hexadecanol
(Costa, Carareto, et al.,
2011)
Ácido cáprico + 1-octanol (Carareto, Castagnaro, et
al., 2014)
Ácido palmítico + 1-octadecanol (Costa, 2011)
Ácido cáprico + 1-decanol (Carareto, Castagnaro, et
al., 2014)
Ácido esteárico + 1-dodecanol (Costa, 2011)
Ácido cáprico + 1-dodecanol (Costa, 2011) Ácido esteárico + 1-tetradecanol (Costa, 2011)
Ácido láurico + 1-dodecanol (Costa, Carareto, et al.,
2011)
Ácido esteárico + 1-hexadecanol (Costa, 2011)
Ácido láurico + 1-tetradecanol (Maximo et al., 2014) Ácido esteárico + 1-octadecanol (Maximo et al., 2014)
Ácido mirístico + 1-dodecanol (Costa, Carareto, et al.,
2011)
Ácido mirístico + 1-tetradecanol (Costa, 2011)
Ácido mirístico + 1-hexadecanol (Maximo et al., 2014)
Page 228
Anexo A 228
Tabela A.6 Éster etílico + éster etílico.
Éster etílico Éster etílico
Caprílico Cáprico Láurico Mirístico Palmítico Esteárico Oléico Linoléico Linolênico
Caprílico
Cáprico [22]
Láurico [22] [22]
Mirístico [22] [22] [22],
Palmítico [21] [21] [21] [21]
Esteárico [20] [20] [20] [20] [20]
Oléico [22] [22] [22] [22] [21] [20]
Linoleico [22] [22] [22] [21] [20] [22]
Linolênico
[20] (Costa, Mariana C. et al., 2007)
[21] (Costa et al., 2012)
[22] (COSTA, 2008)
Page 229
Anexo A 229
Tabela A.7 Éster etílico mais éster etílico.
Sistemas Referências
Caprilato de etila + caprato de etila (BOROS, et al., 2016)
Caprilato de etila + laurato de etila (BOROS, et al., 2016)
Caprilato de etila + miristato de etila (BOROS, et al., 2016)
Caprato de etila + laurato de etila (BOROS, et al., 2016)
Caprato de etila + miristato de etila (BOROS, et al., 2016)
Caprato de etila + oleato de etila (BOROS, et al., 2016)
Caprato de etila + linoleato de etila (BOROS, et al., 2016)
Laurato de etila + linoleato de etila (BOROS, et al., 2016)
Miristato de etila + linoleato de etila (BOROS, et al., 2016)
[23] (BOROS, et al., 2016).
Page 230
Anexo A 230
As misturas binárias de triacilgliceróis serão identificadas por um código de três letras
nesta parte do anexo assim como já discutido por Wesdorp (1990). Cada um dos três
caracteres no código representa um dos ácidos graxos que são esterificados com glicerol. Os
caracteres usados para representar a ácidos graxos são apresentados na Tabela A.8. Por
exemplo, o triacilglicerol: glicerol, 1-palmítato, 2- 3-diestearato será representado pelo código
PSS.
Tabela A.8 Caracteres utilizados para representar os ácidos graxos.
Ácido graxo Código Ácido graxo Código
Caprílico Ca Esteárico E
Cáprico C Oléico O
Láurico L Linoléico L
Mirístico M Linolênico Li
Palmítico P
Tabela A.9 Sistemas graxos compostos por triacilglicerol+ triacilglicerol.
Sistemas Referências Sistemas Referências
LLL + PPP (Wesdorp, L. H., 1990) PPO + POO (Wesdorp, L. H., 1990)
LLL + SSS (Wesdorp, L. H., 1990) POP + PEP (Wesdorp, L. H., 1990)
PPP + OOO (Wesdorp, L. H., 1990) SSS +SPS (Wesdorp, L. H., 1990)
PPP + MMM (Wesdorp, L. H., 1990) SSS + OOO (Wesdorp, L. H., 1990)
PPP + LLL (Wesdorp, L. H., 1990) SSS + PSS (Wesdorp, L. H., 1990)
PPP + EEE (Wesdorp, L. H., 1990) SSS + PSP (Wesdorp, L. H., 1990)
LLL + EEE (Wesdorp, L. H., 1990) SSS + SPS (Wesdorp, L. H., 1990)
POO + OPO (Wesdorp, L. H., 1990) SSS + PPS (Wesdorp, L. H., 1990)
PPP + SOS (Wesdorp, L. H., 1990) SSS + PPP (Wesdorp, L. H., 1990)
PPP + POP (Wesdorp, L. H., 1990) SSS + SES (Wesdorp, L. H., 1990)
PPP + SSE (Wesdorp, L. H., 1990) SSS + SSE (Wesdorp, L. H., 1990)
PSS + PSP (Wesdorp, L. H., 1990) SSS + SEE (Wesdorp, L. H., 1990)
PSS + SPS (Wesdorp, L. H., 1990) SSS + SOS (Wesdorp, L. H., 1990)
PSS + PPP (Wesdorp, L. H., 1990) SES + SSE (Wesdorp, L. H., 1990)
PSP + SPS (Wesdorp, L. H., 1990) SOS + POS (Wesdorp, L. H., 1990)
Page 231
Anexo A 231
cont. Table A 9
PSP + PPP (Wesdorp, L. H., 1990) SOS + POP (Wesdorp, L. H., 1990)
PPS + SPS (Wesdorp, L. H., 1990) SSS + OOO (Wesdorp, L. H., 1990)
PPP + SPS (Wesdorp, L. H., 1990) SOS + OOO (Wesdorp, L. H., 1990)
PPP + POO (Wesdorp, L. H., 1990)
POS + POP (Wesdorp, L. H., 1990)
PPS + PPP (Wesdorp, L. H., 1990)
PPP-OOO (Wesdorp, L. H., 1990)
Page 232
Anexo B 232
ANEXO B – Neste anexo serão apresentadas as autorizações para reutilização dos artigos
apresentados nos capítulos 3 e 4 que foram publicados na revista Fluid Phase Equibrilia.
ELSEVIER LICENSE
TERMS AND CONDITIONS
Feb 02, 2017
This Agreement between Flávio Cardoso de Matos ("You") and Elsevier ("Elsevier")
consists of your license details and the terms and conditions provided by Elsevier and
Copyright Clearance Center.
License Number 4040920566011
License date Feb 02, 2017
Licensed Content Publisher Elsevier
Licensed Content Publication Fluid Phase Equilibria
Licensed Content Title Binary solid–liquid equilibrium systems containing fatty acids, fatty alcohols and triolein by differential scanning calorimetry
Licensed Content Author Flávio Cardoso de Matos,Mariana Conceição da Costa,Antonio José de Almeida Meirelles,Eduardo Augusto Caldas Batista
Licensed Content Date 25 October 2015
Licensed Content Volume Number
404
Licensed Content Issue Number
n/a
Licensed Content Pages 8
Start Page 1
End Page 8
Type of Use reuse in a thesis/dissertation
Portion full article
Format both print and electronic
Are you the author of this Elsevier article?
Yes
Will you be translating? No
Order reference number
Title of your thesis/dissertation
BEHAVIOR ANALYSIS OF THE SOLID-LIQUID EQUILIBRIUM OF FATTY SYSTEMS THROUGH OF THE USE DIFFERENTIAL SCANNING CALORIMETRY
Expected completion date Feb 2017
Estimated size (number of
pages)
232
Elsevier VAT number GB 494 6272 12
Total 0.00 USD
Page 233
Anexo B 233
ELSEVIER LICENSE
TERMS AND CONDITIONS
Feb 02, 2017
This Agreement between Flávio Cardoso de Matos ("You") and Elsevier ("Elsevier") consists
of your license details and the terms and conditions provided by Elsevier and Copyright
Clearance Center.
License Number 4040920906995
License date Feb 02, 2017
Licensed Content Publisher Elsevier
Licensed Content Publication Fluid Phase Equilibria
Licensed Content Title Binary solid–liquid equilibrium systems containing fatty acids, fatty alcohols and trilaurin by differential scanning calorimetry
Licensed Content Author Flávio Cardoso de Matos,Mariana Conceição da Costa,Antonio José de Almeida Meirelles,Eduardo Augusto Caldas Batista
Licensed Content Date 15 September 2016
Licensed Content Volume Number
423
Licensed Content Issue Number
n/a
Licensed Content Pages 10
Start Page 74
End Page 83
Type of Use reuse in a thesis/dissertation
Intended publisher of new work
other
Portion full article
Format both print and electronic
Are you the author of this Elsevier article?
Yes
Will you be translating? No
Order reference number
Title of your thesis/dissertation
BEHAVIOR ANALYSIS OF THE SOLID-LIQUID EQUILIBRIUM OF FATTY SYSTEMS THROUGH OF THE USE DIFFERENTIAL SCANNING CALORIMETRY
Expected completion date Feb 2017
Estimated size (number of pages)
232
Elsevier VAT number GB 494 6272 12
Total 0.00 USD


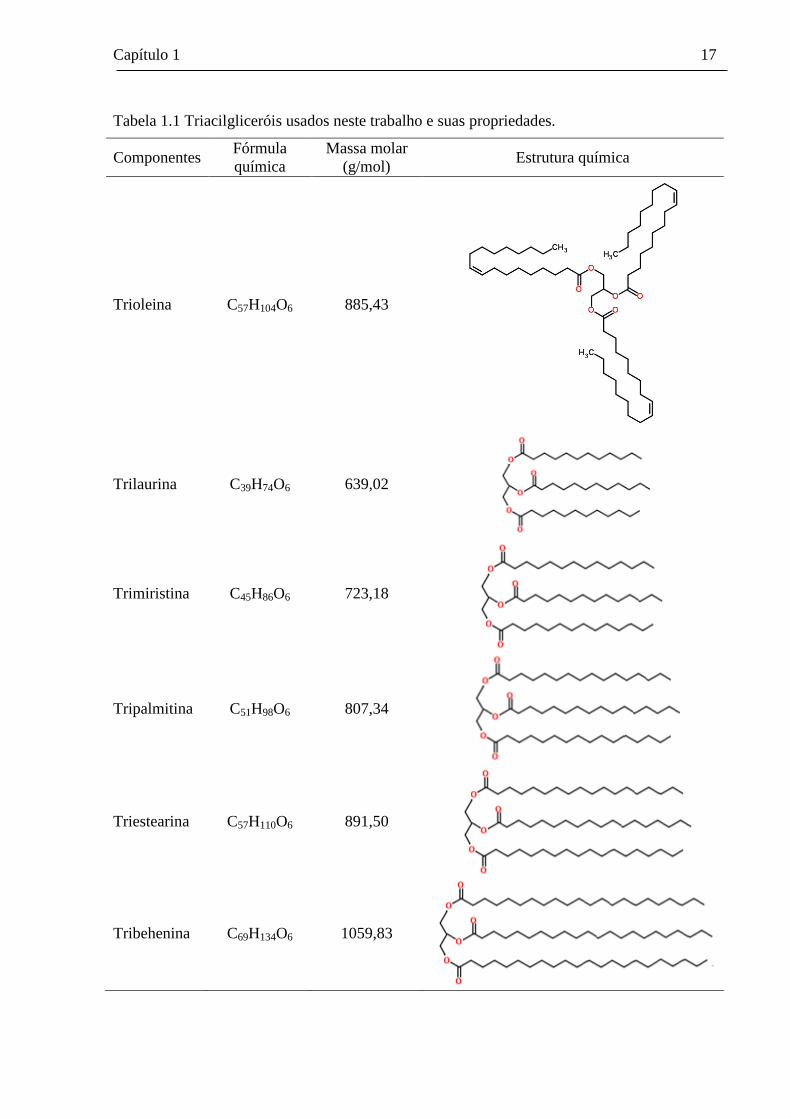


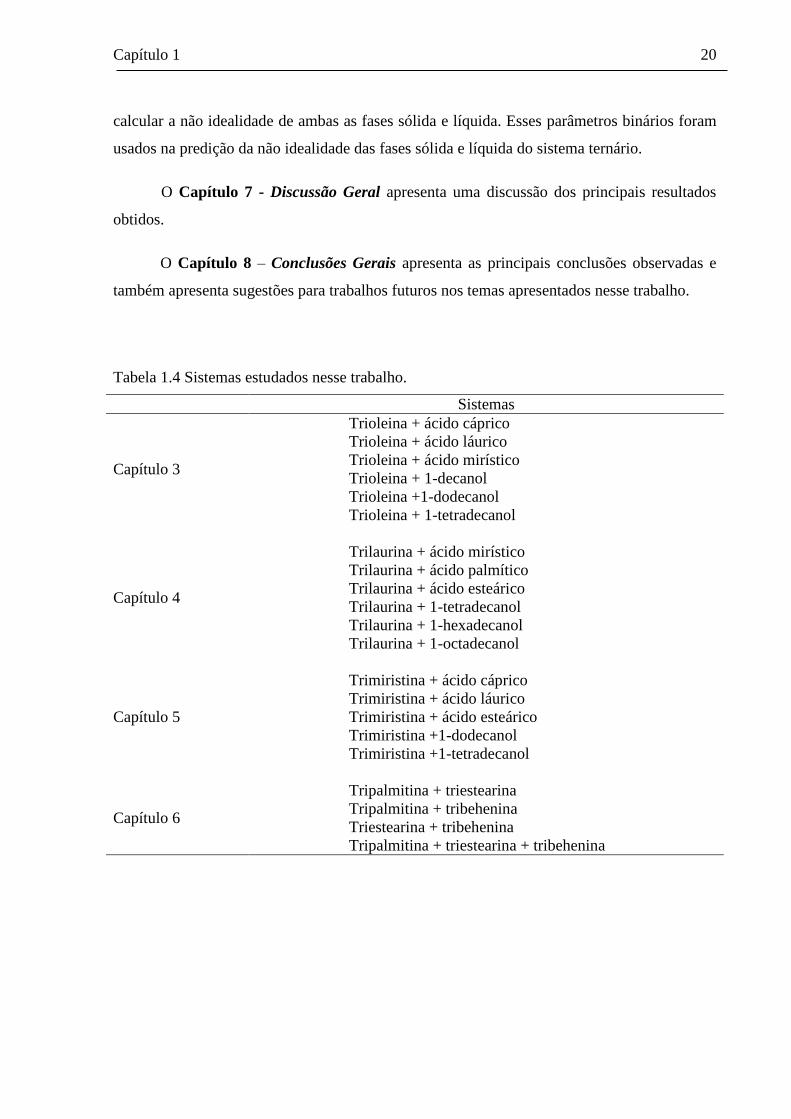


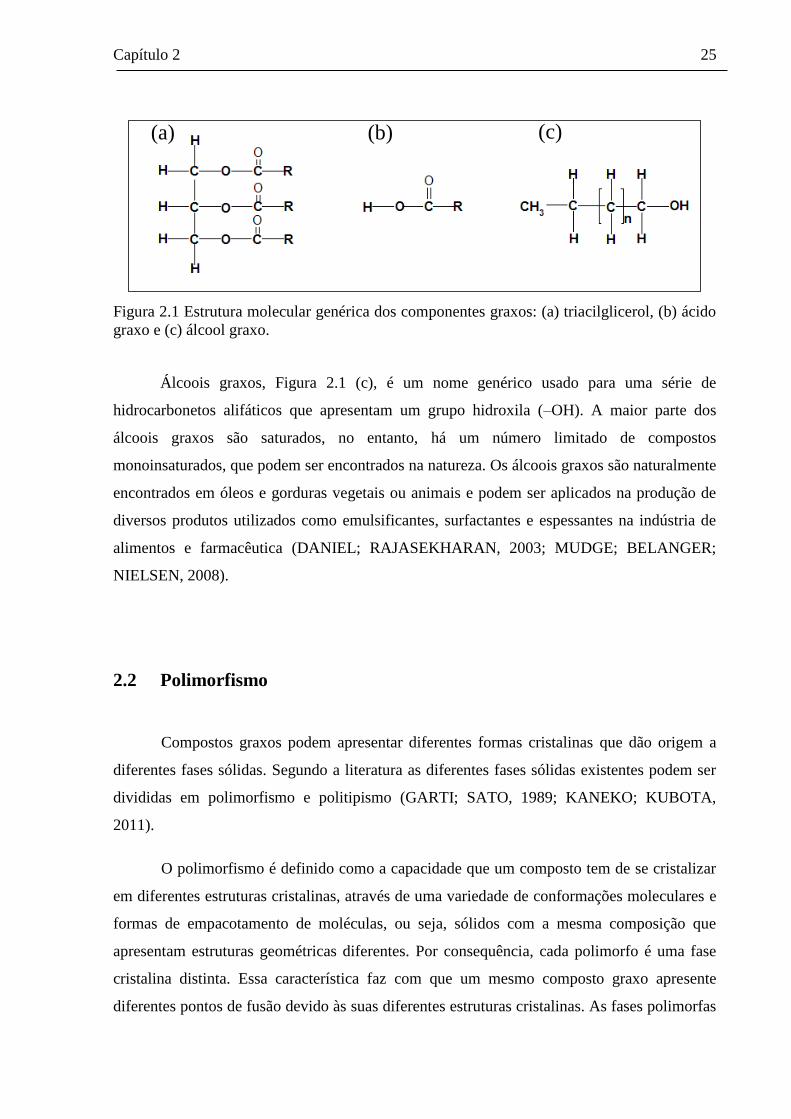


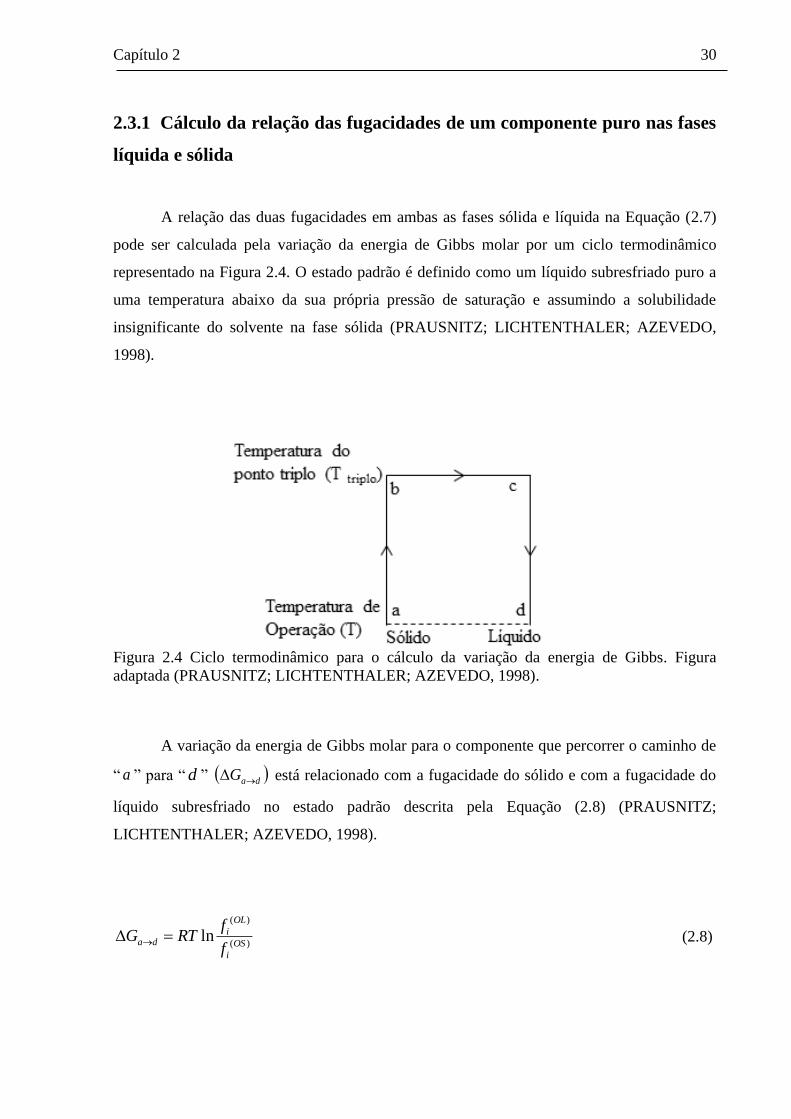


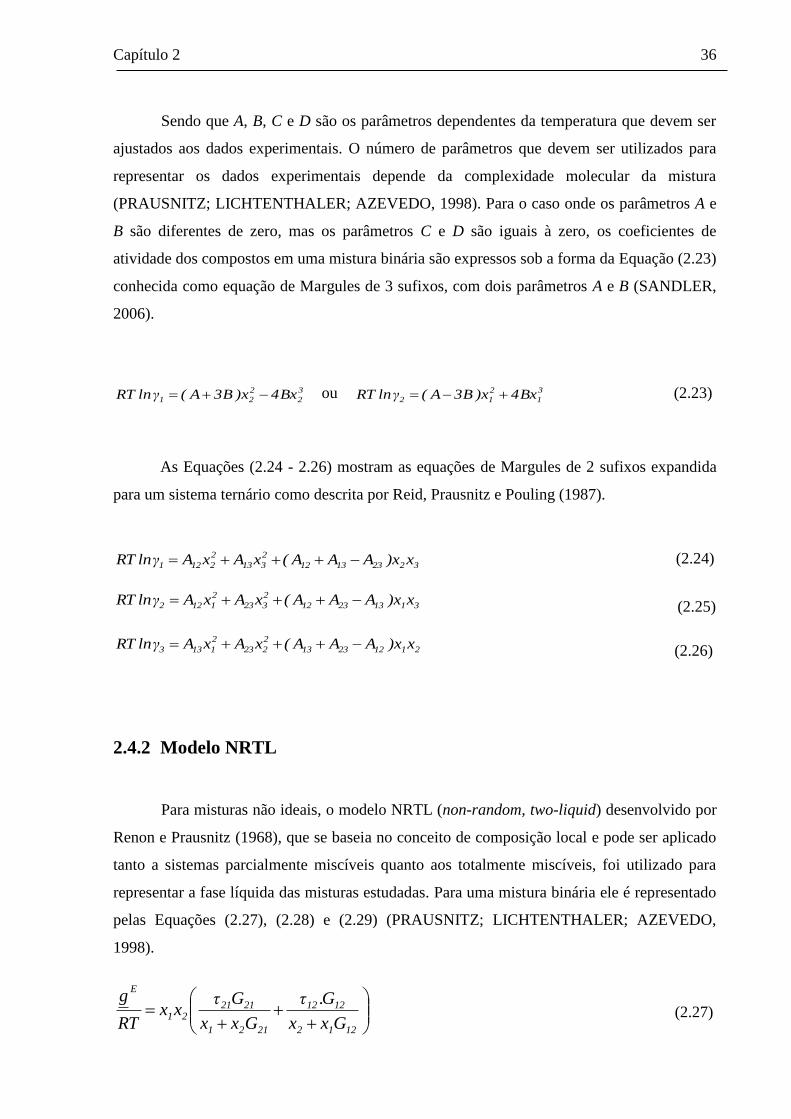


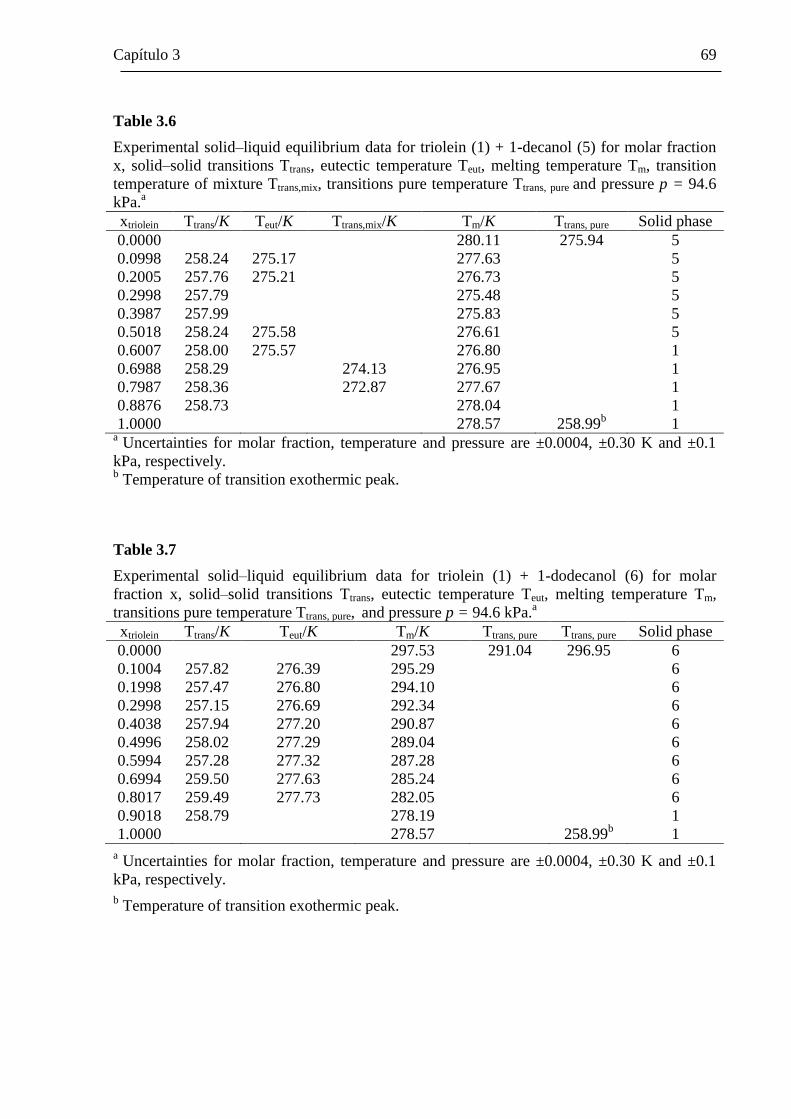


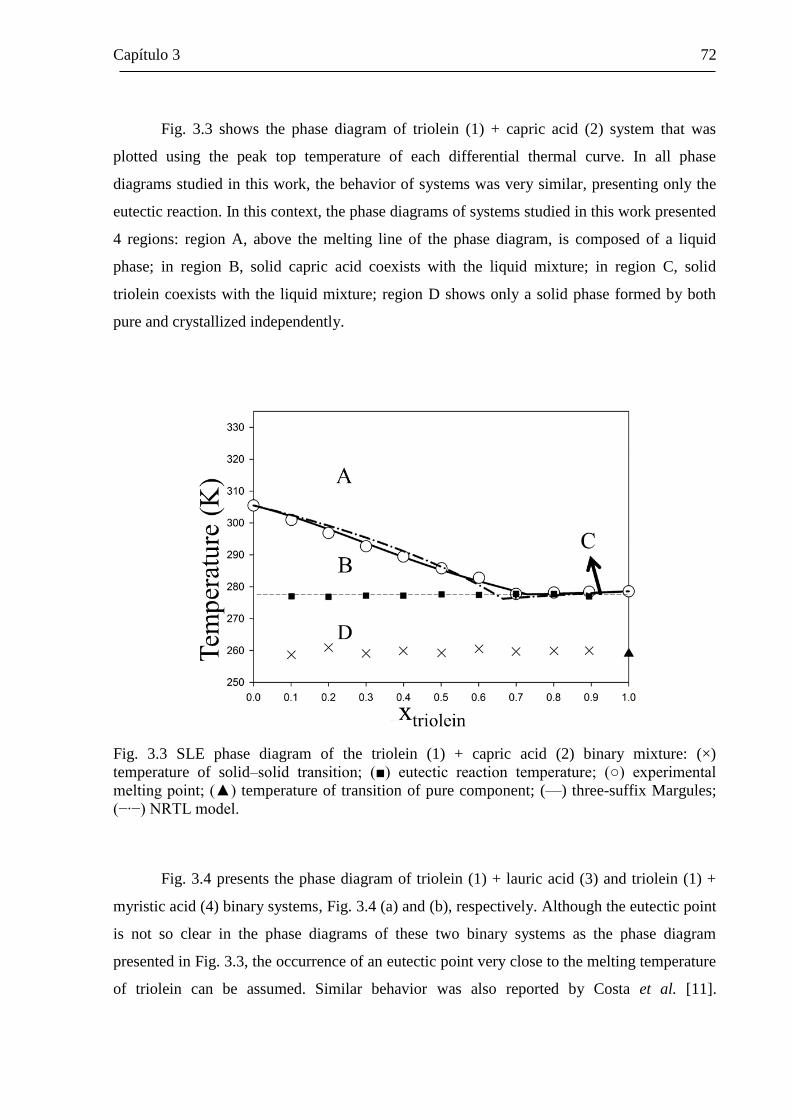


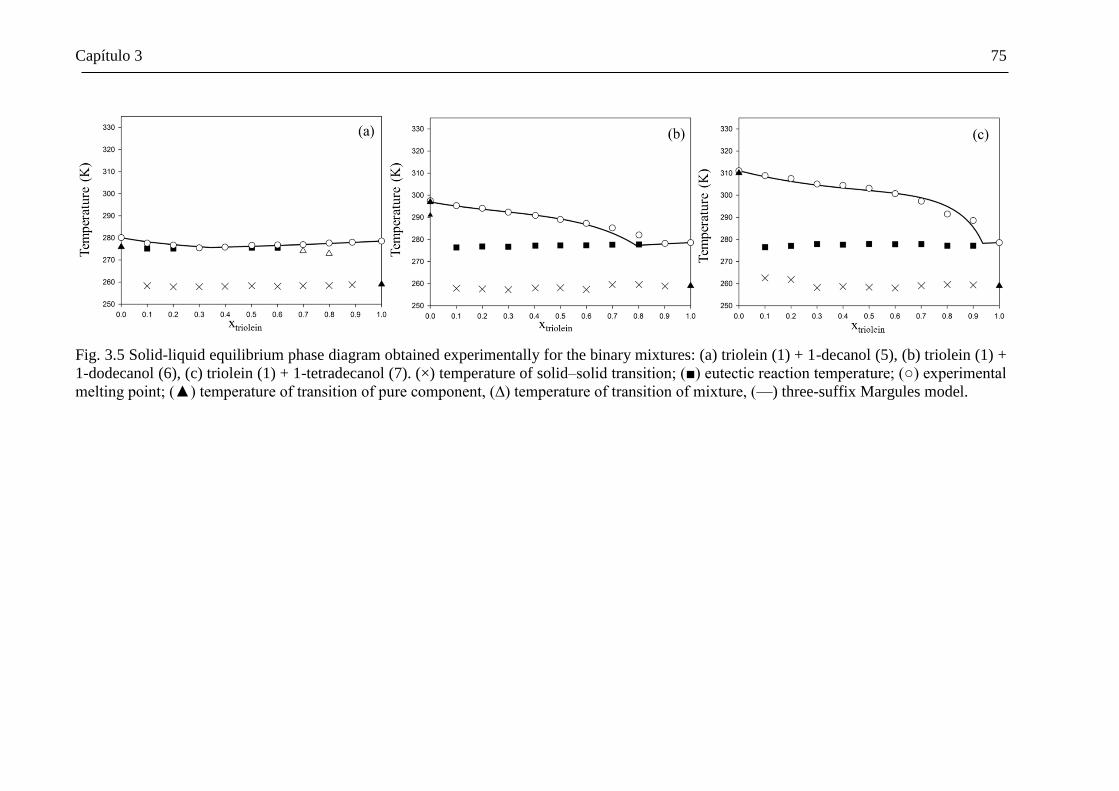


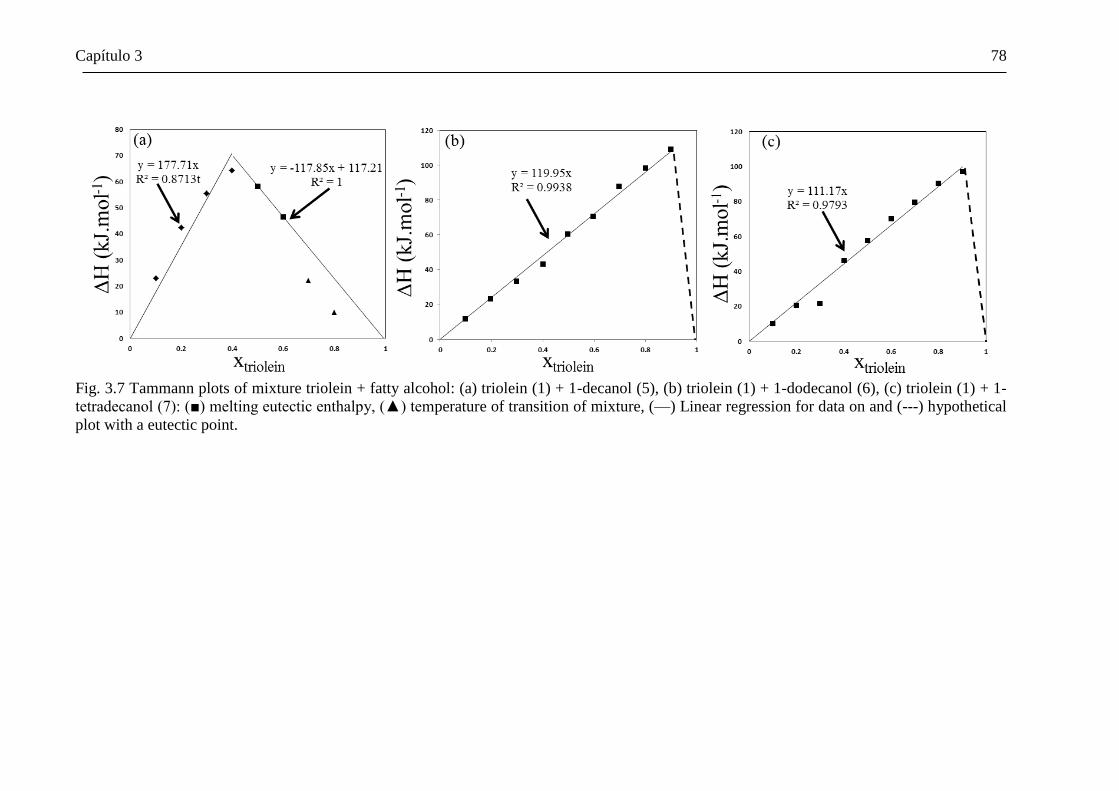


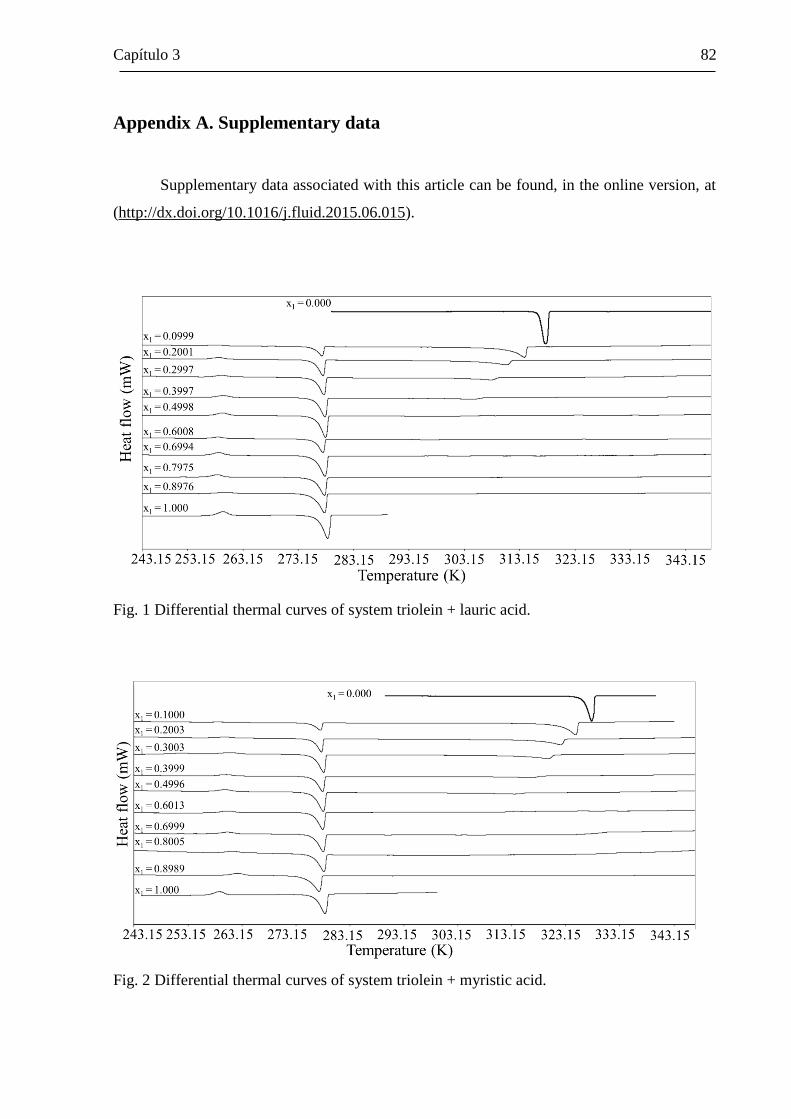


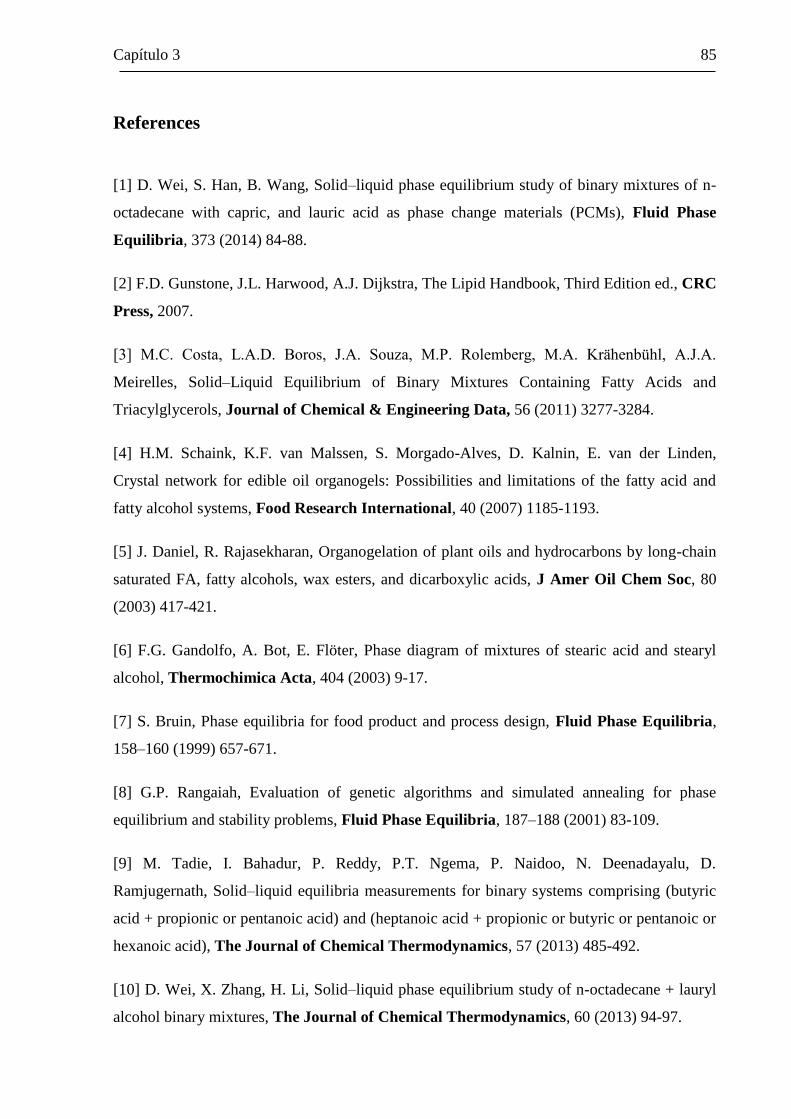


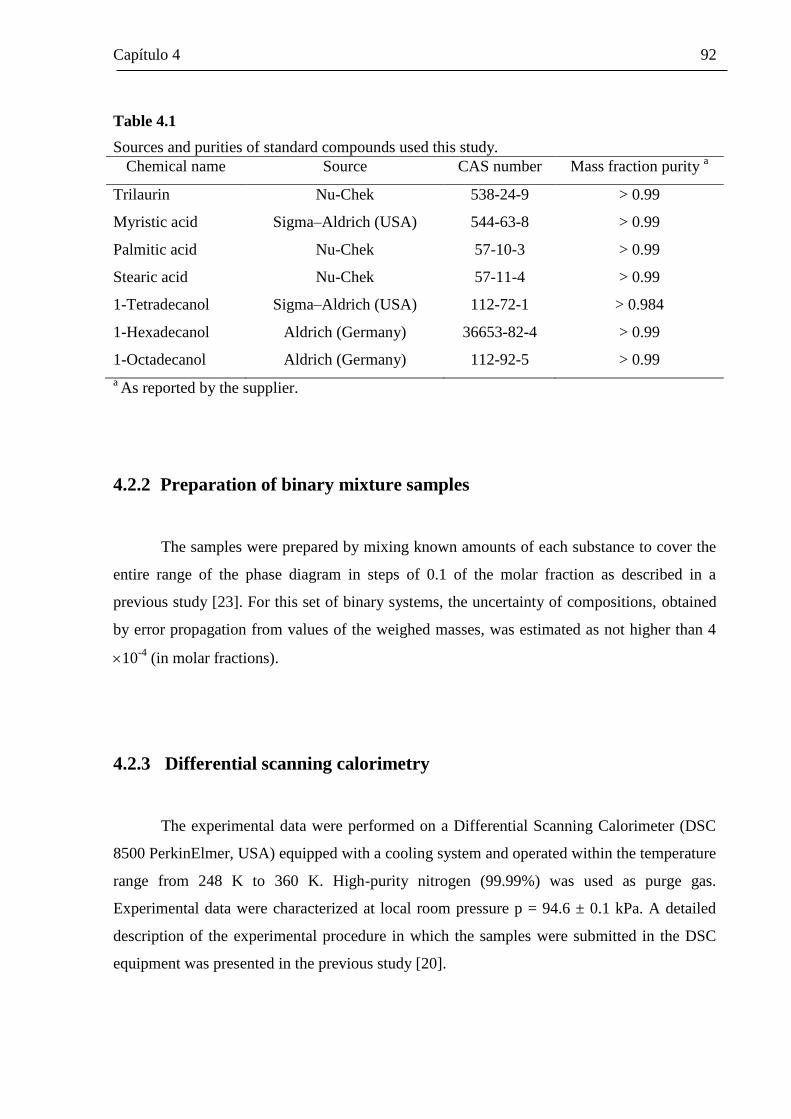

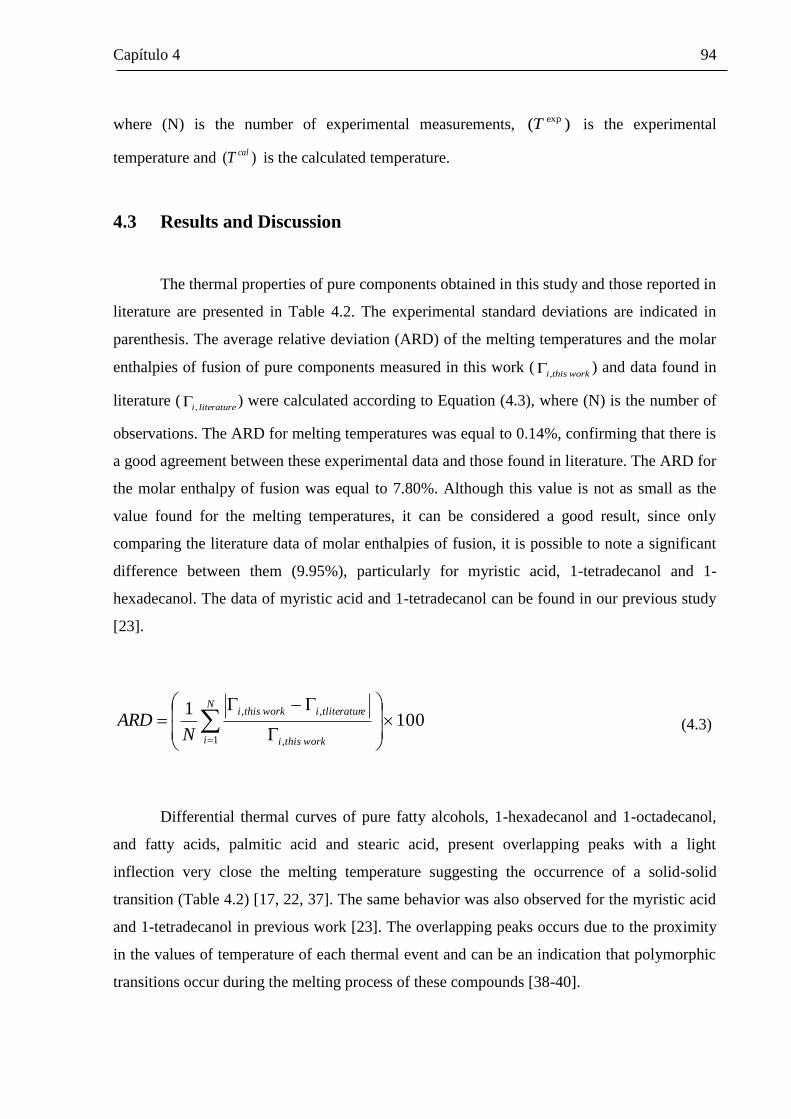


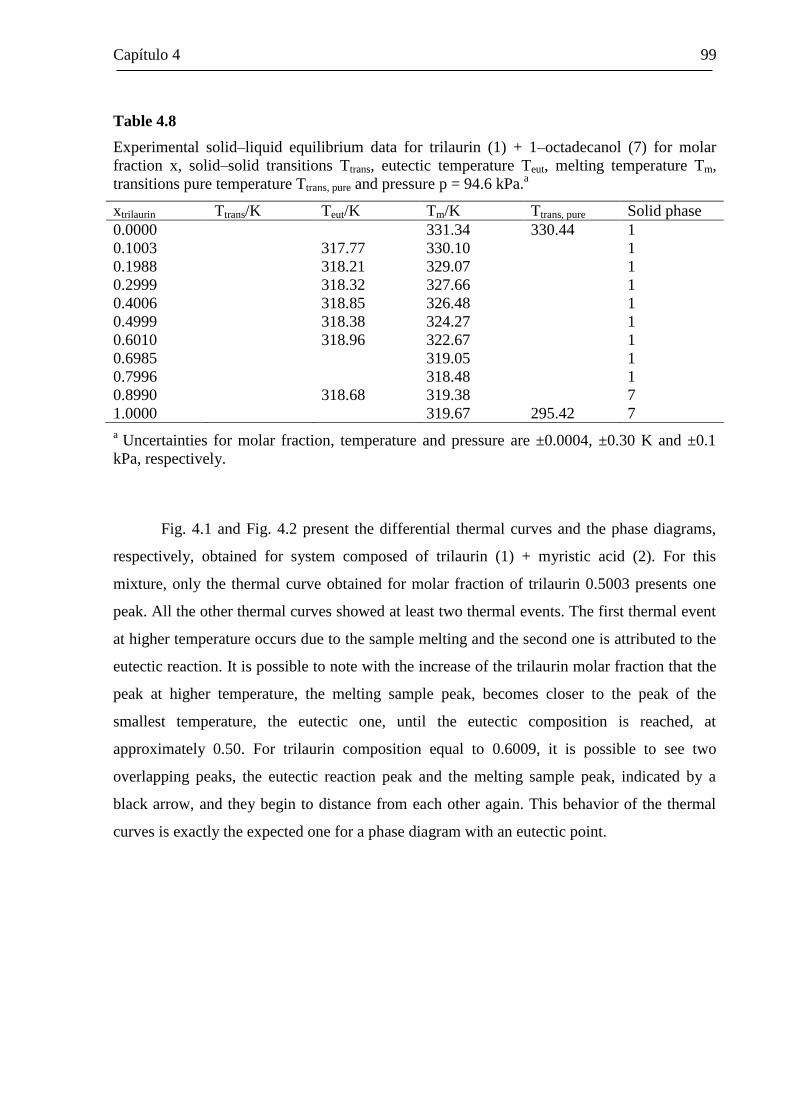
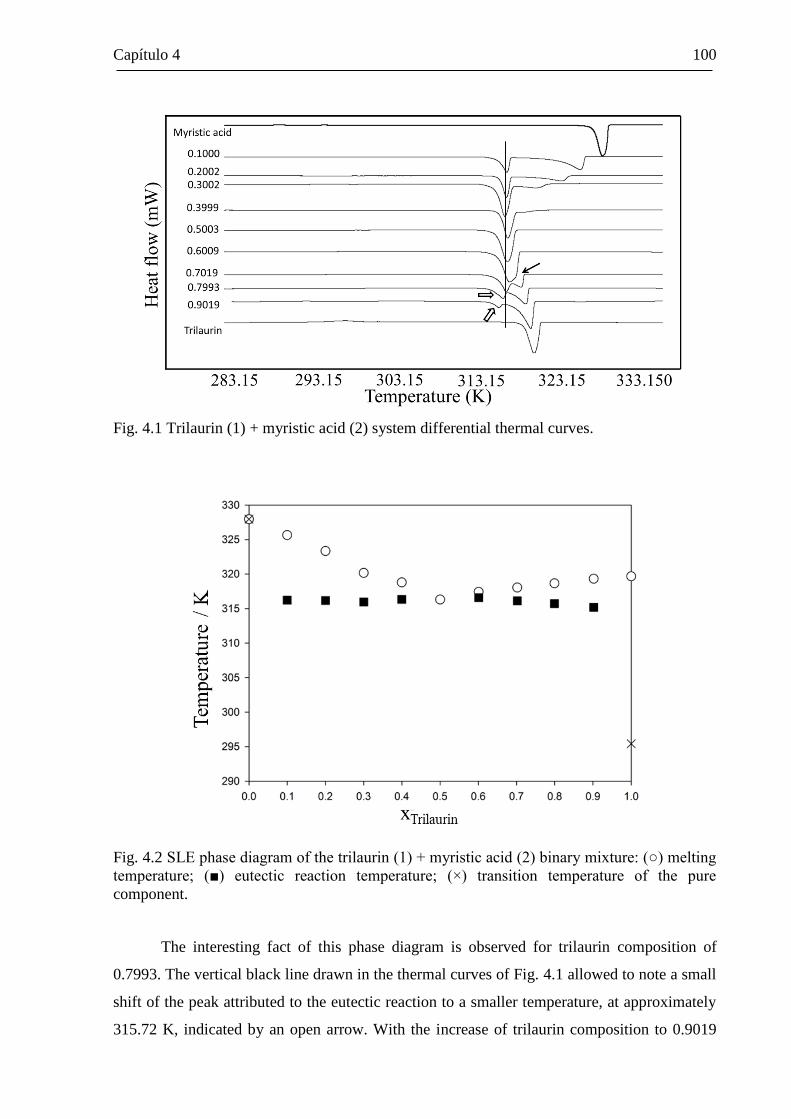

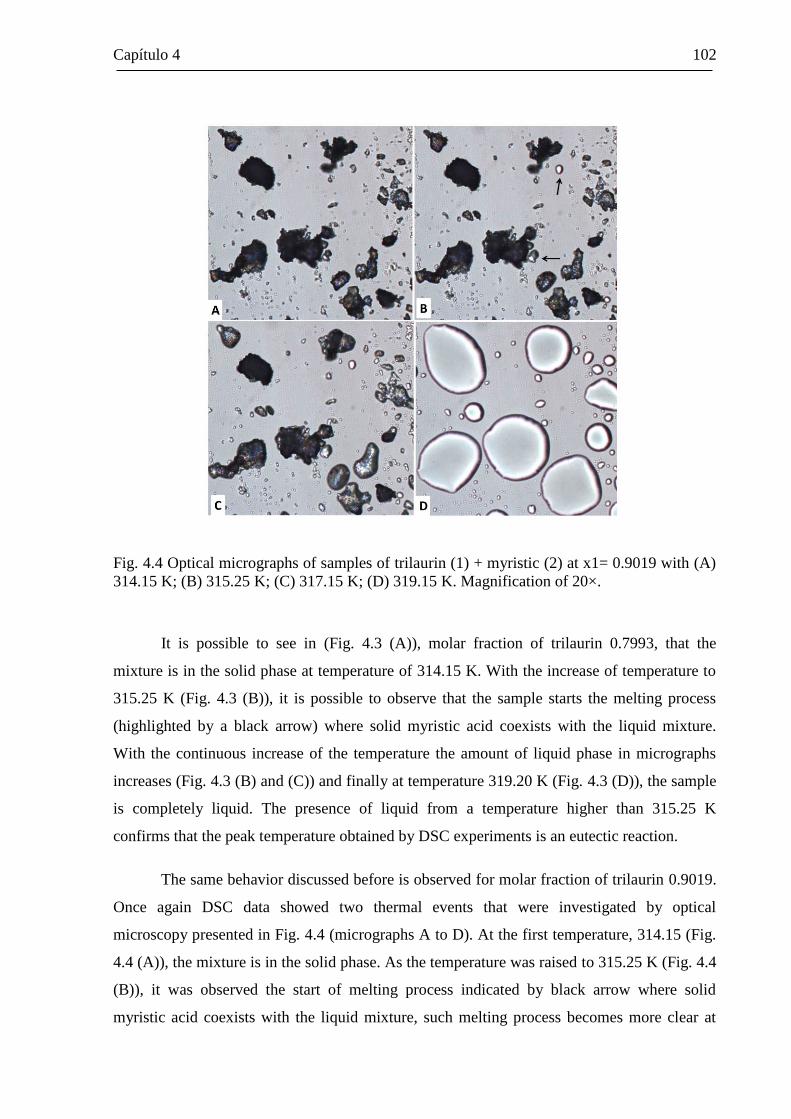


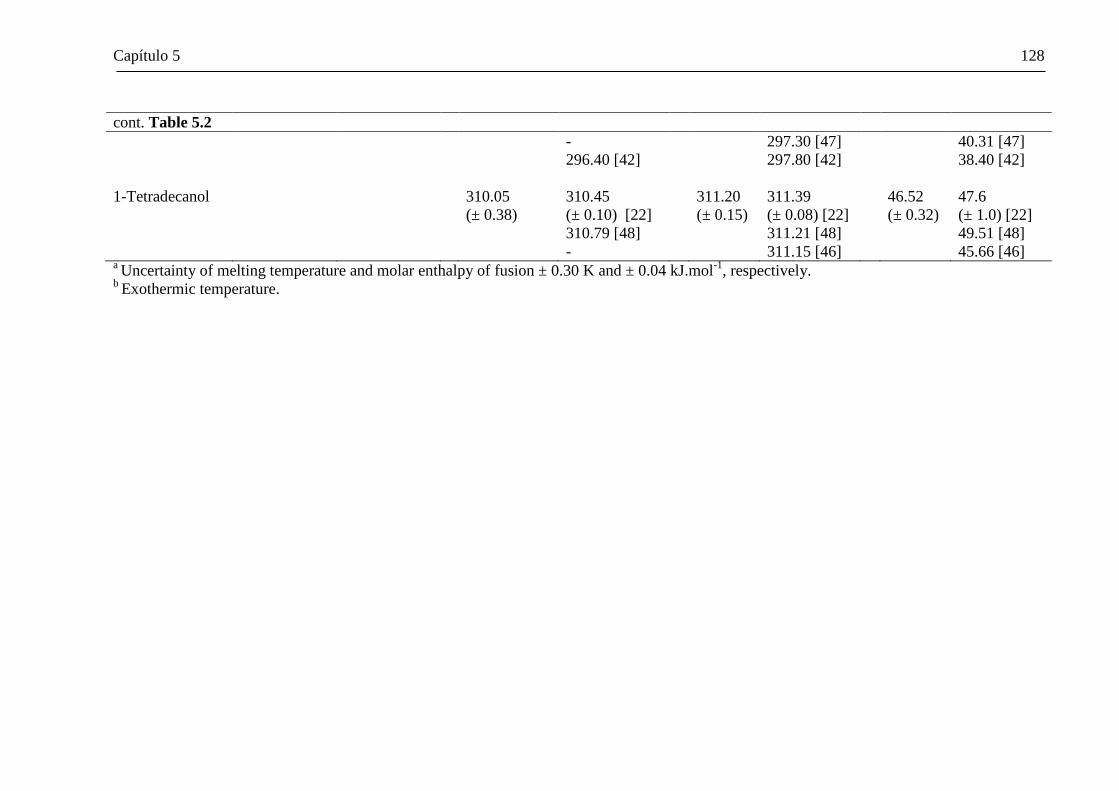


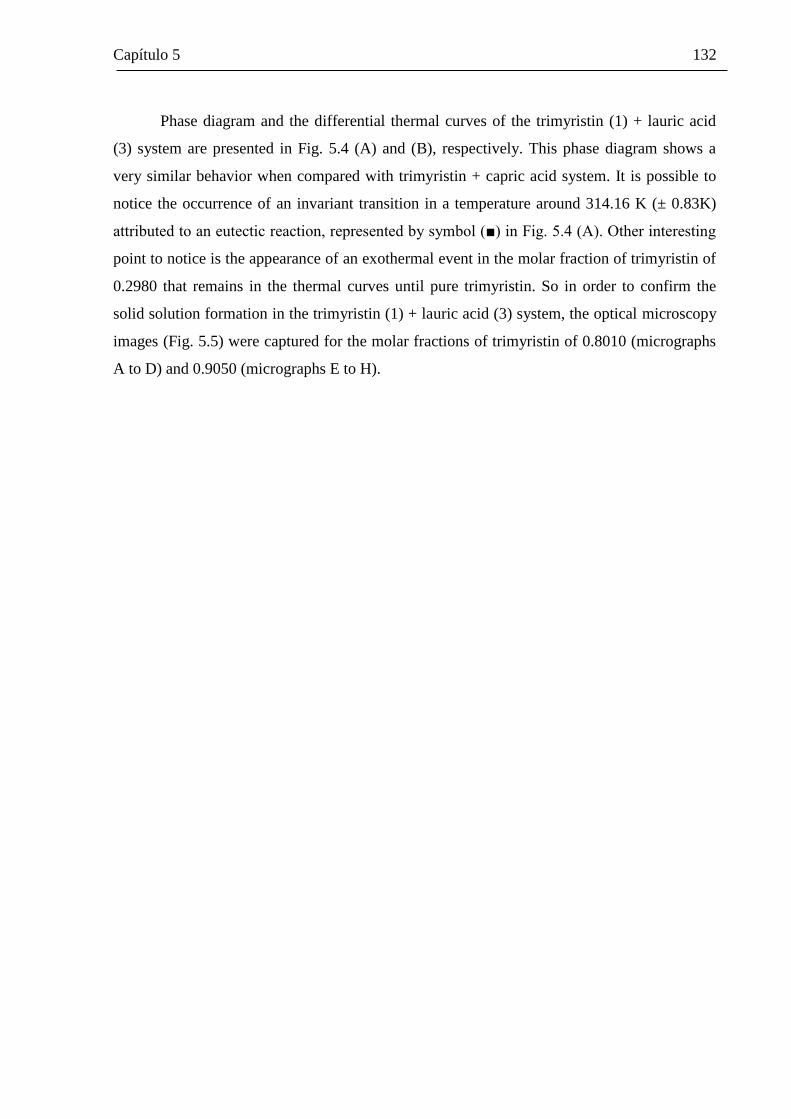


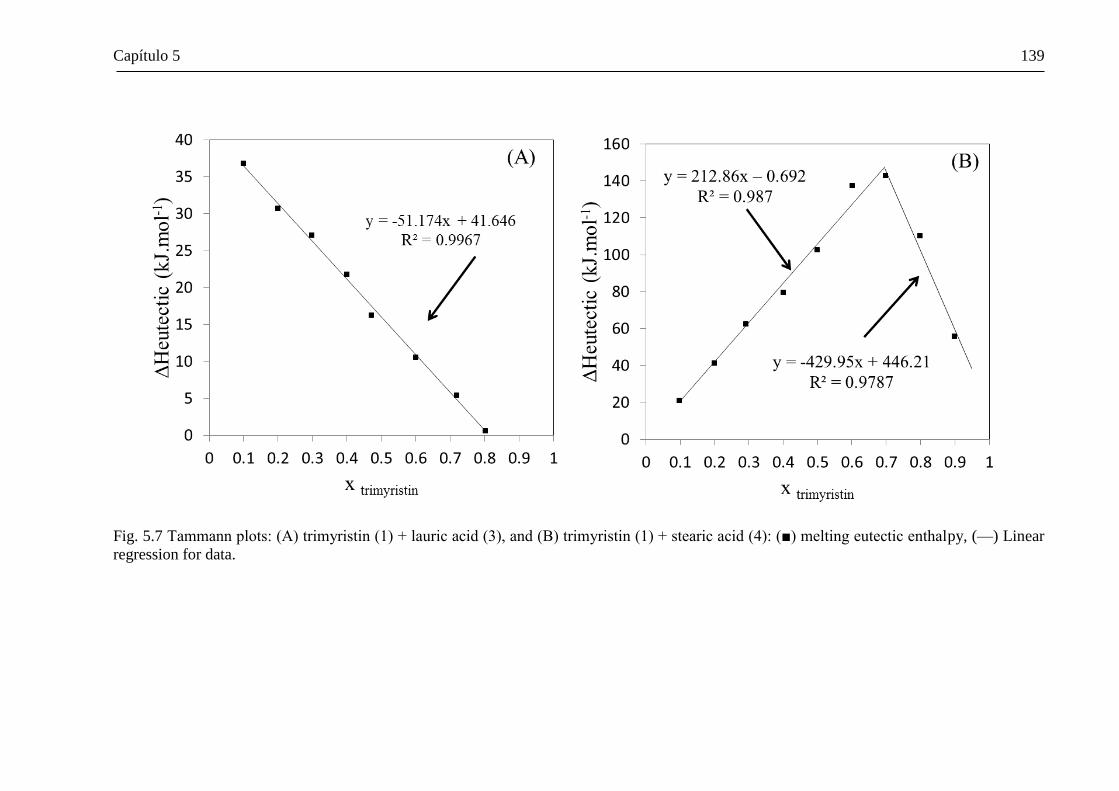

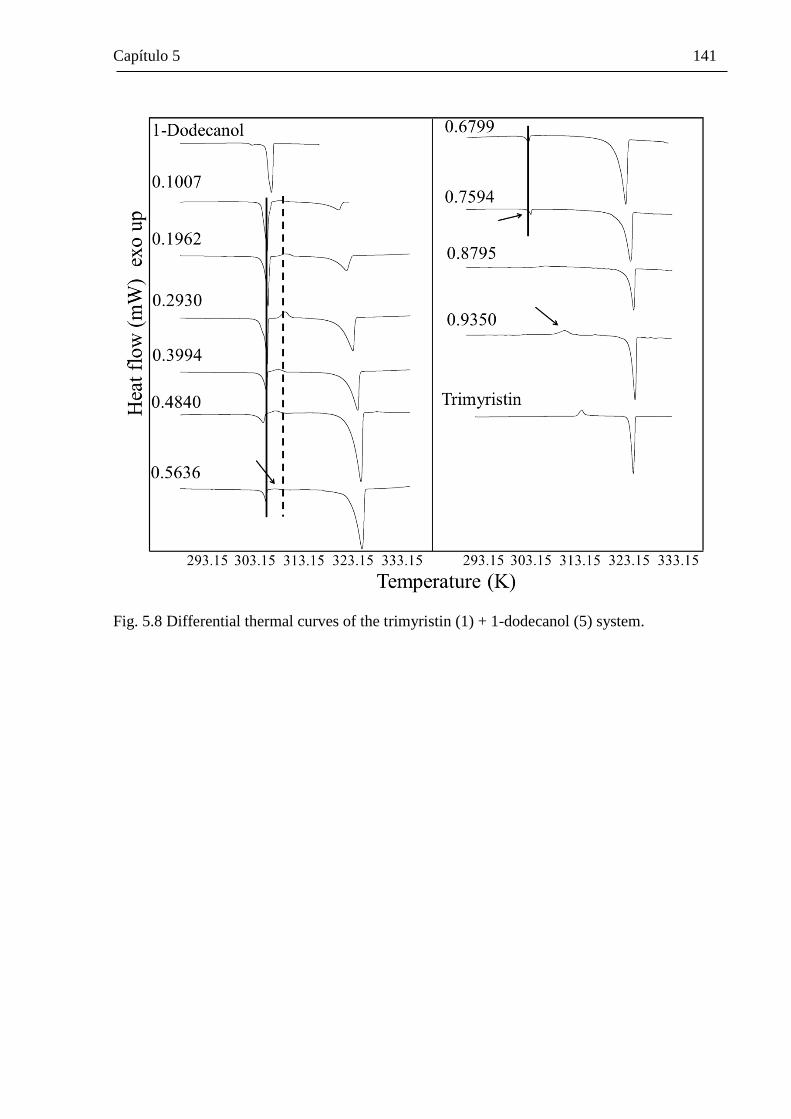


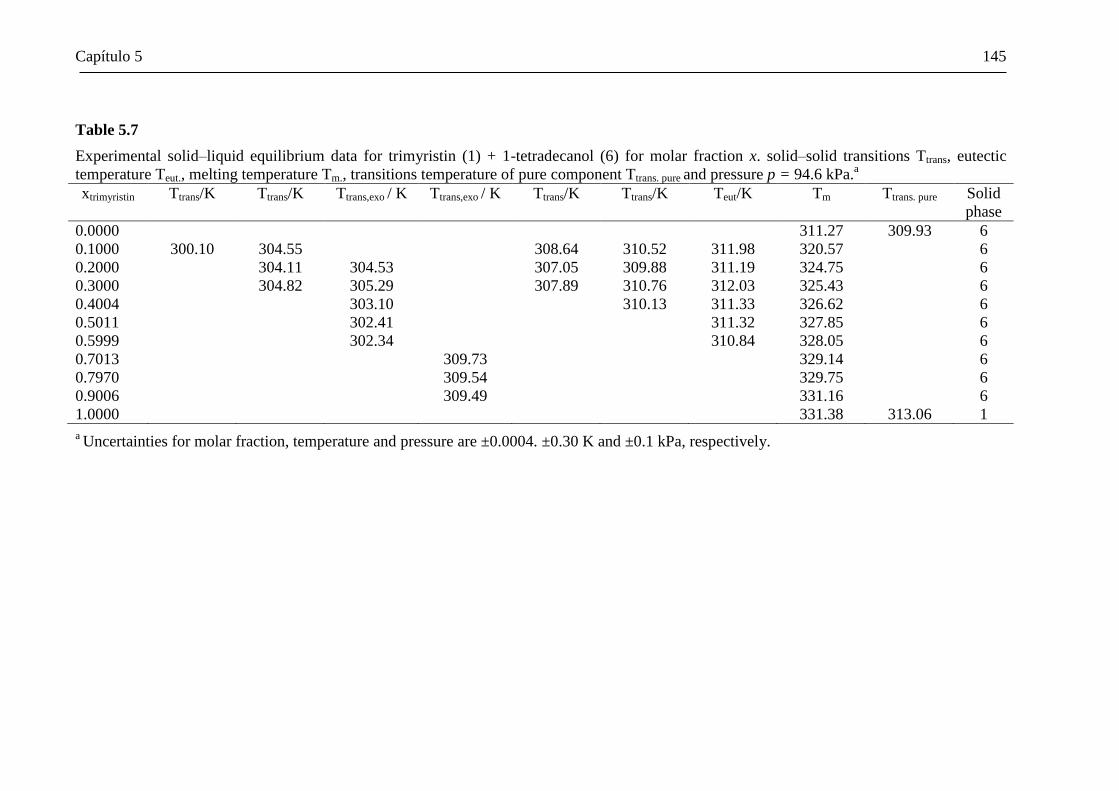

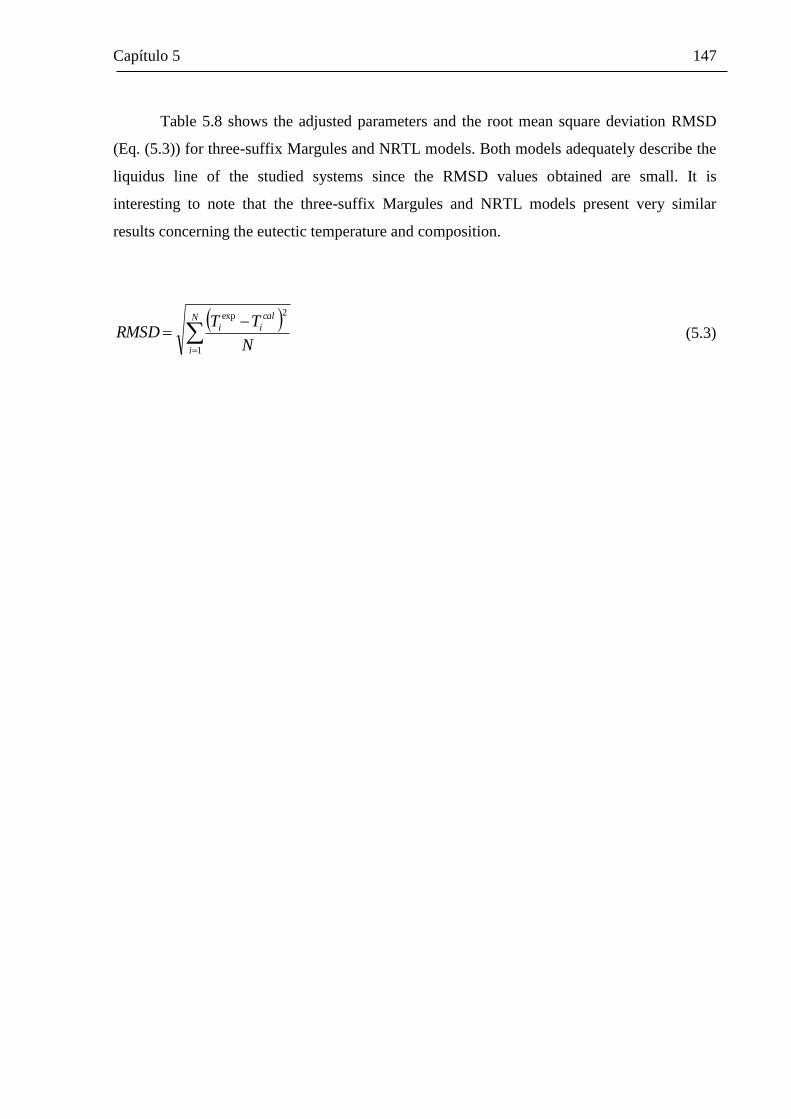


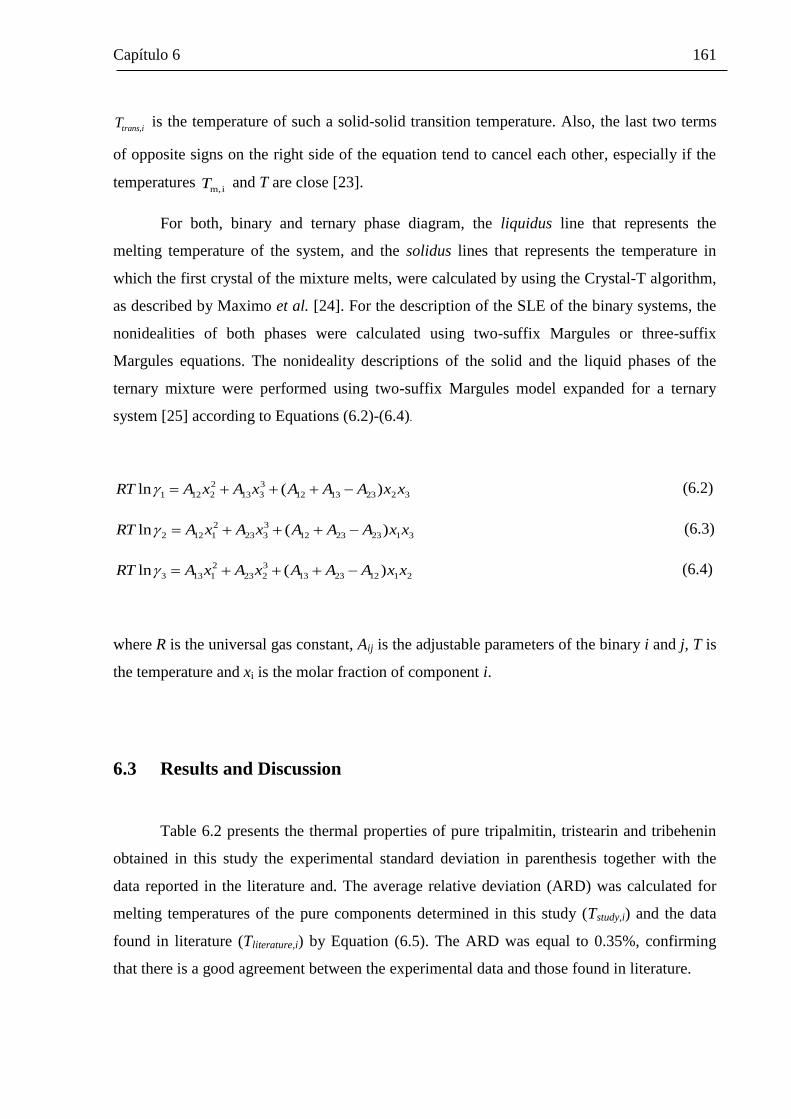


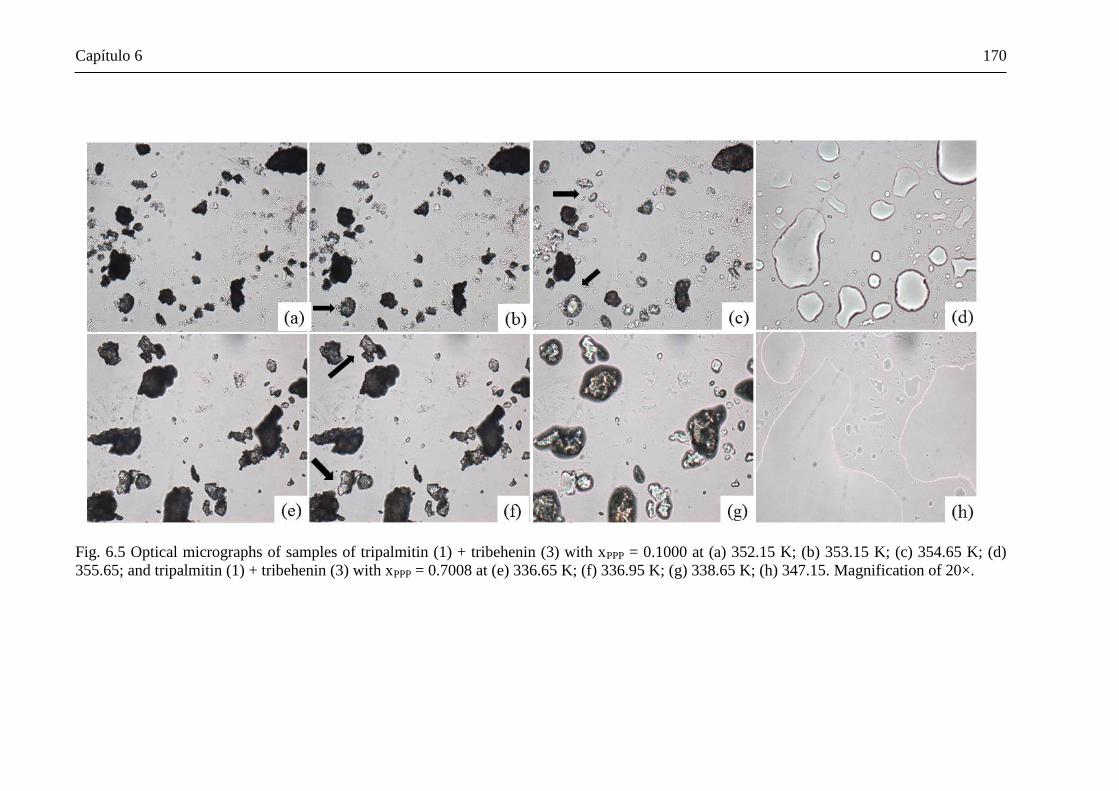
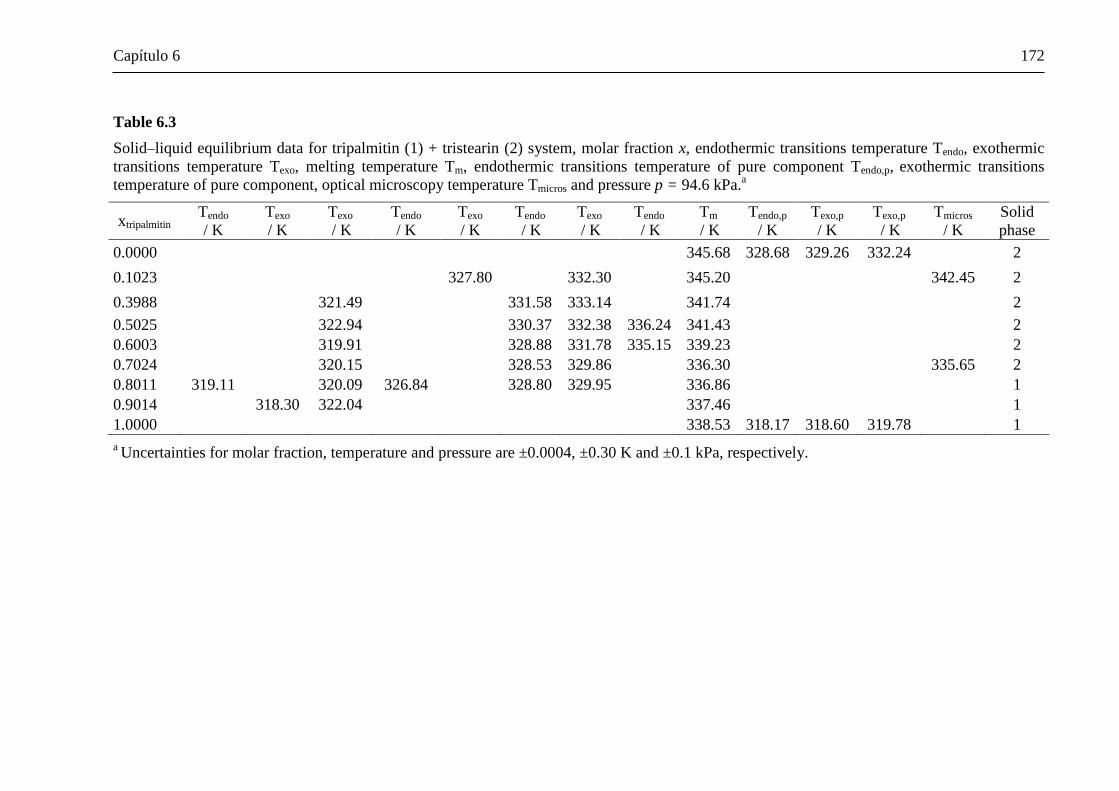


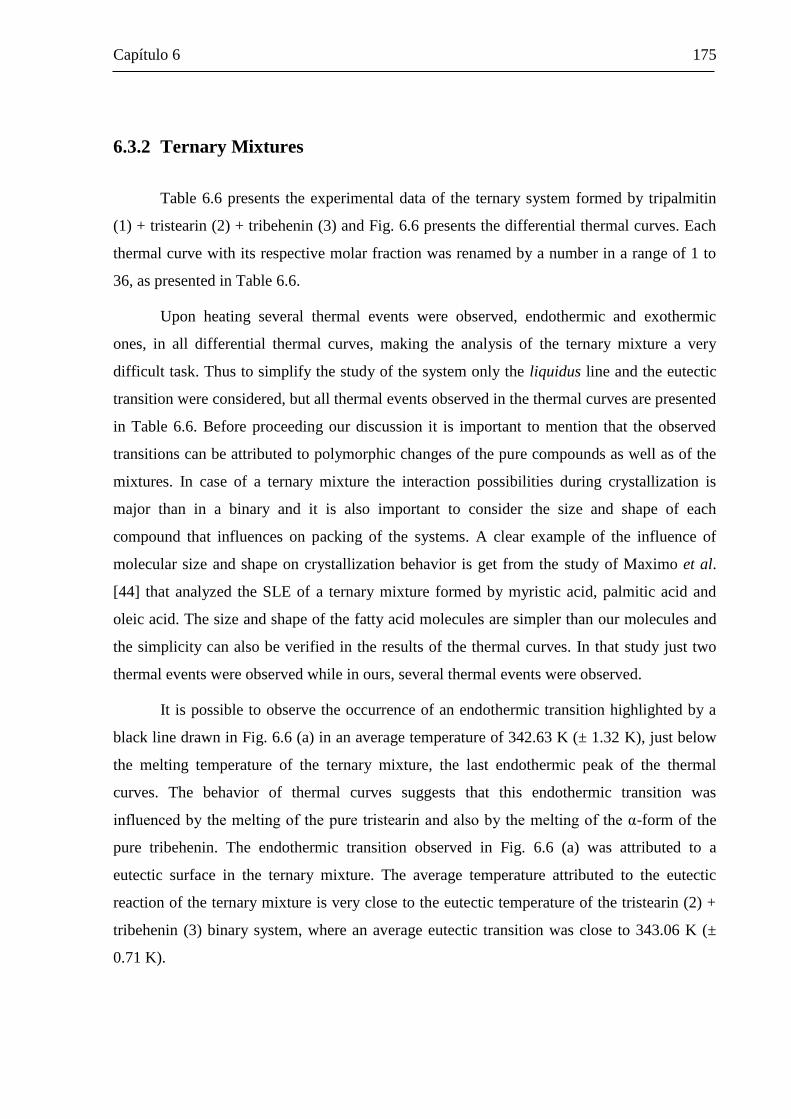


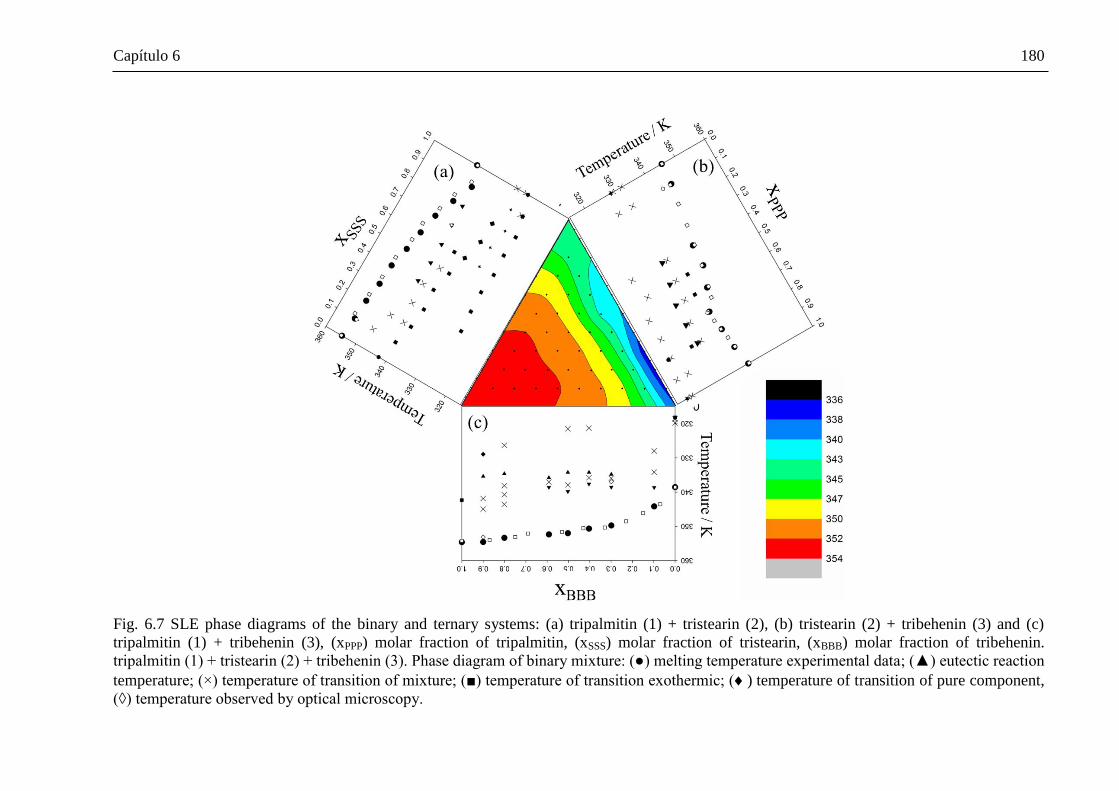
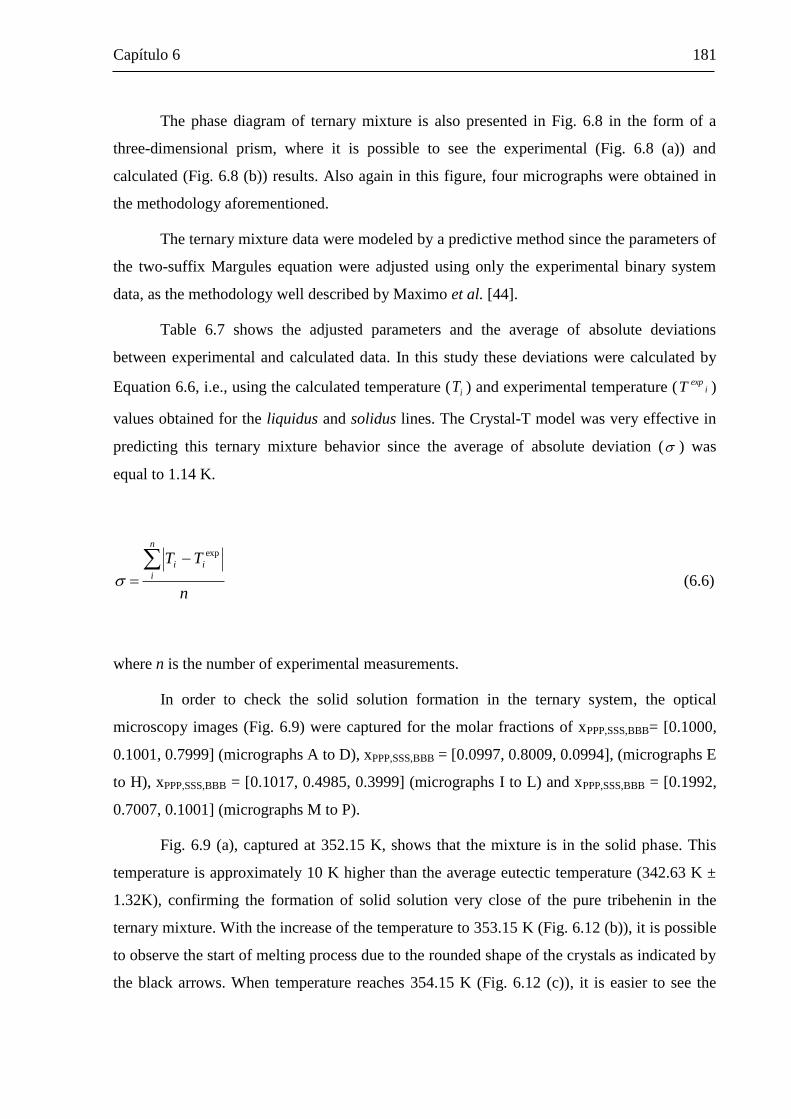
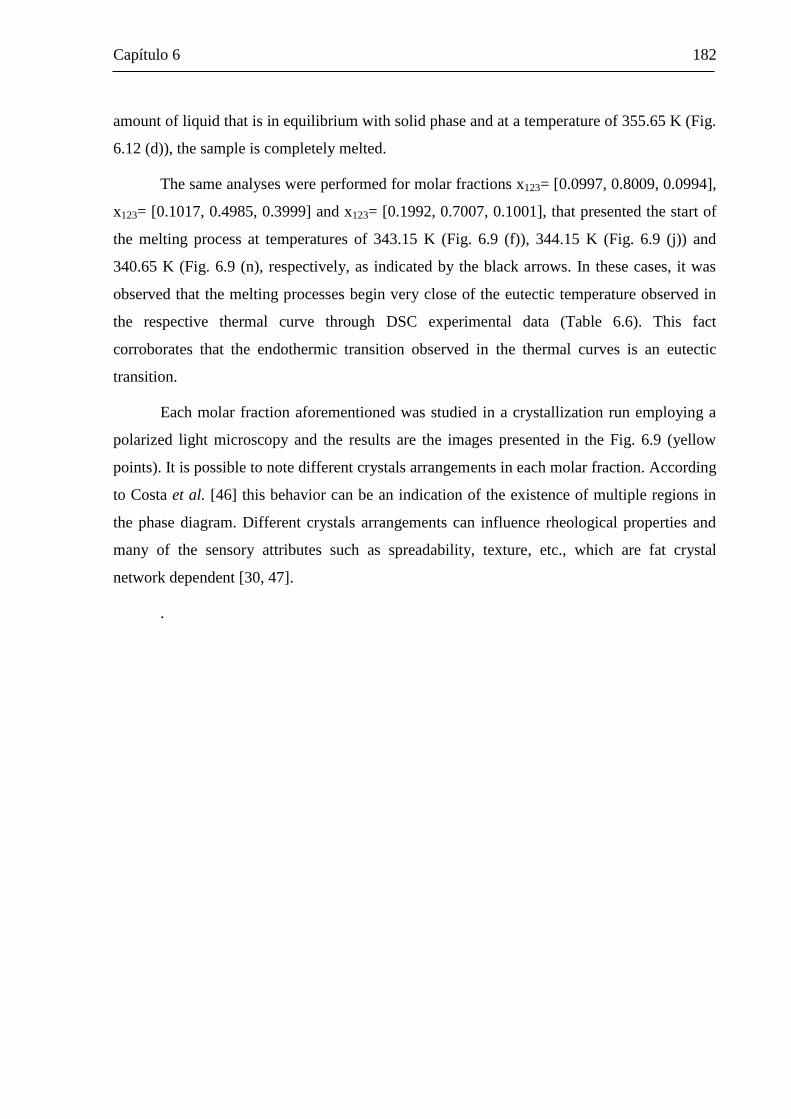


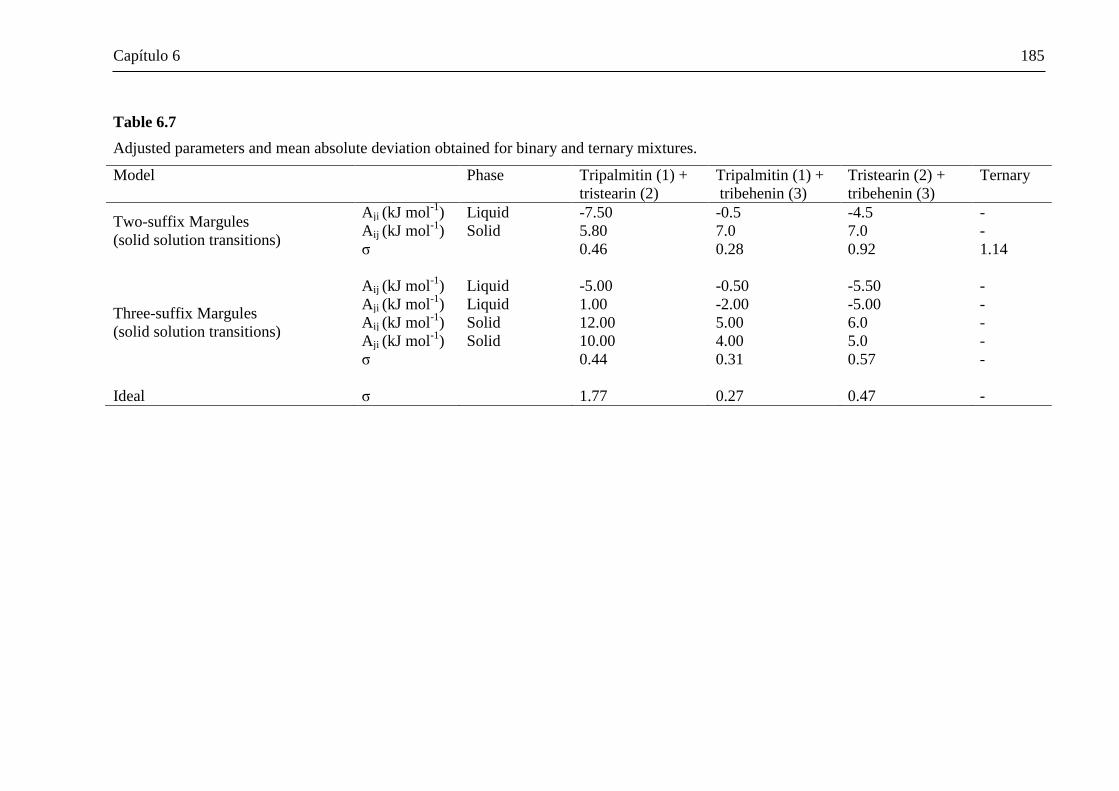

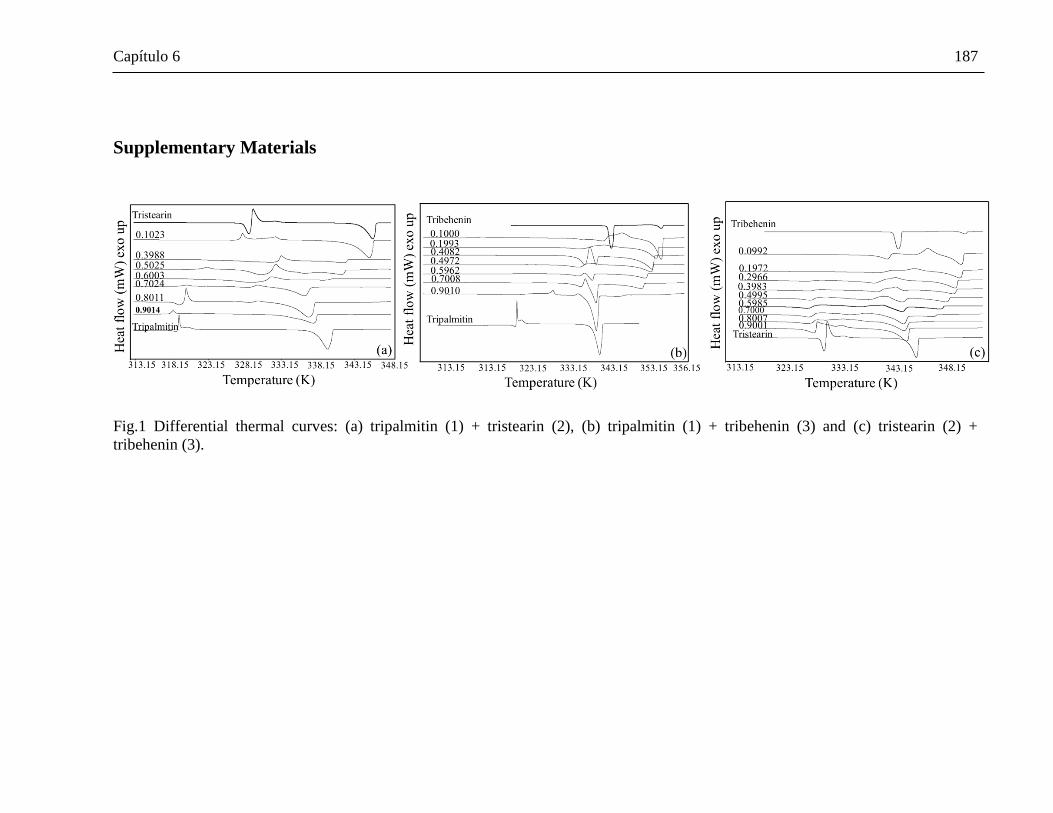


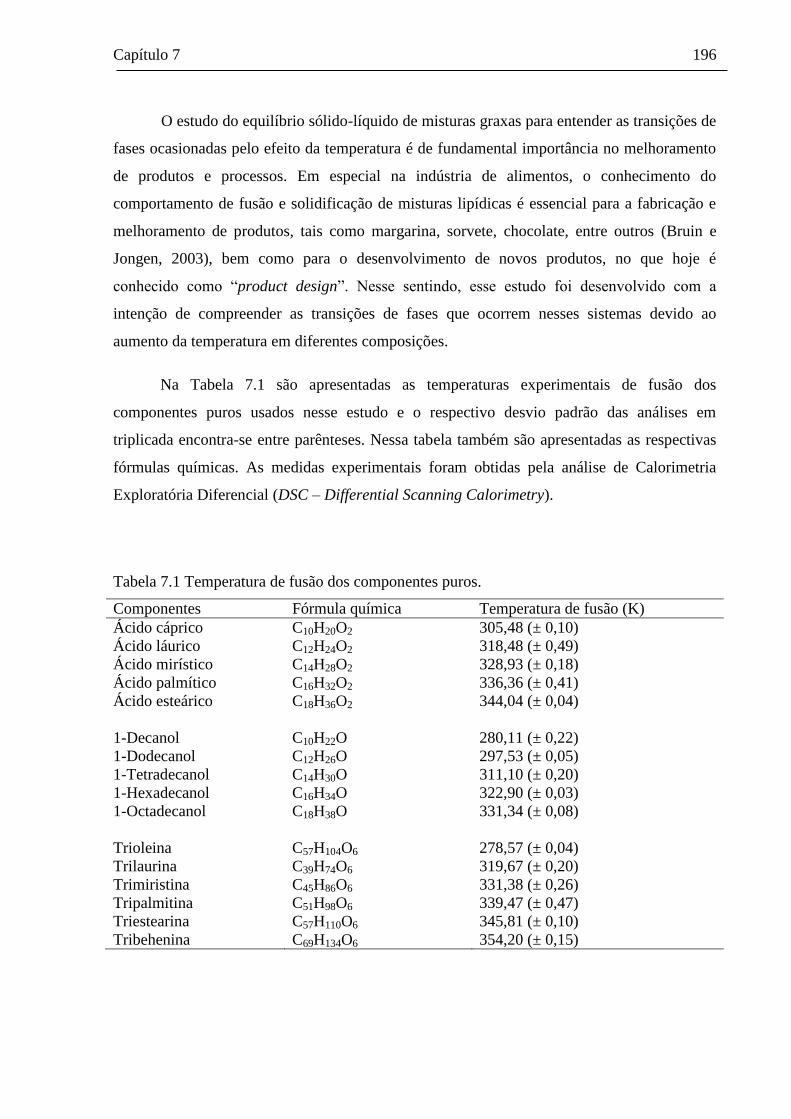


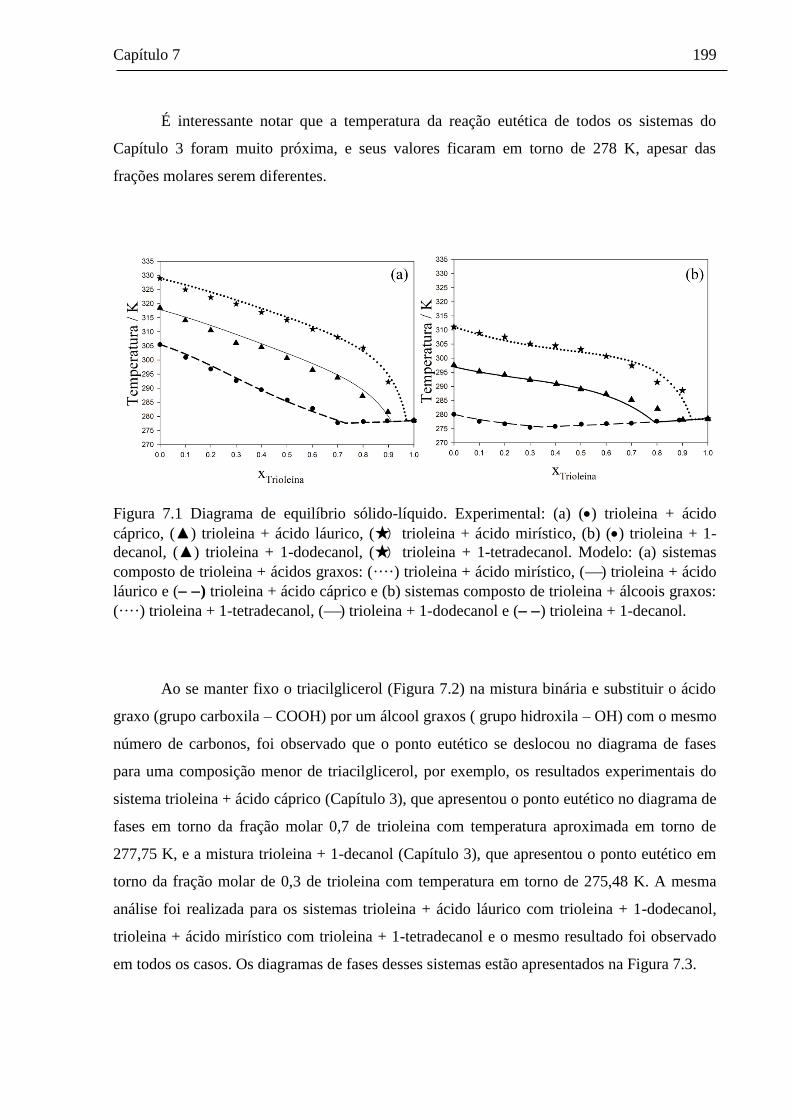

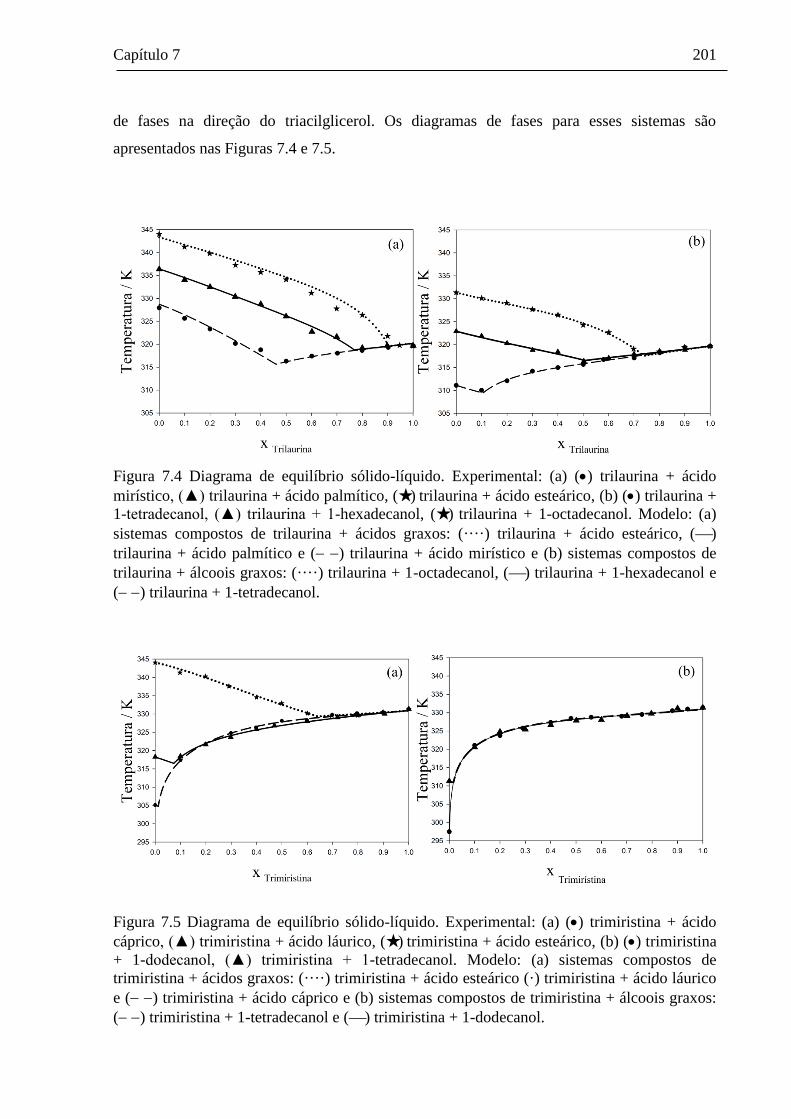
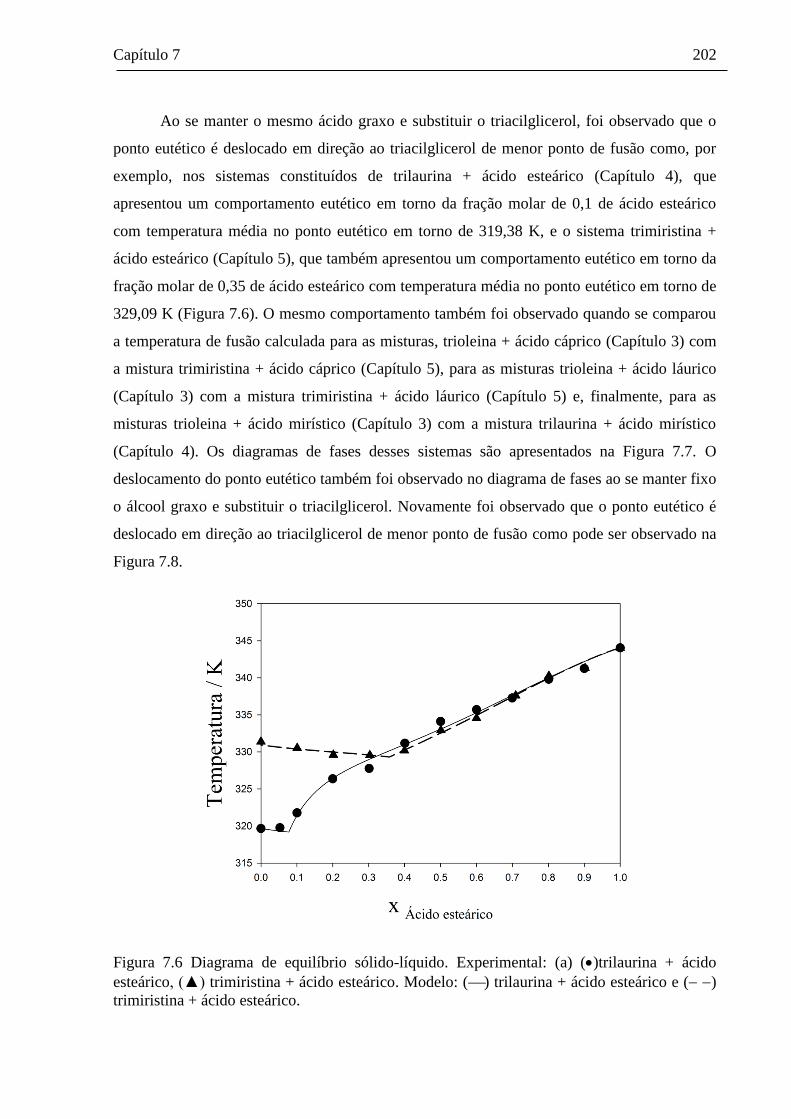

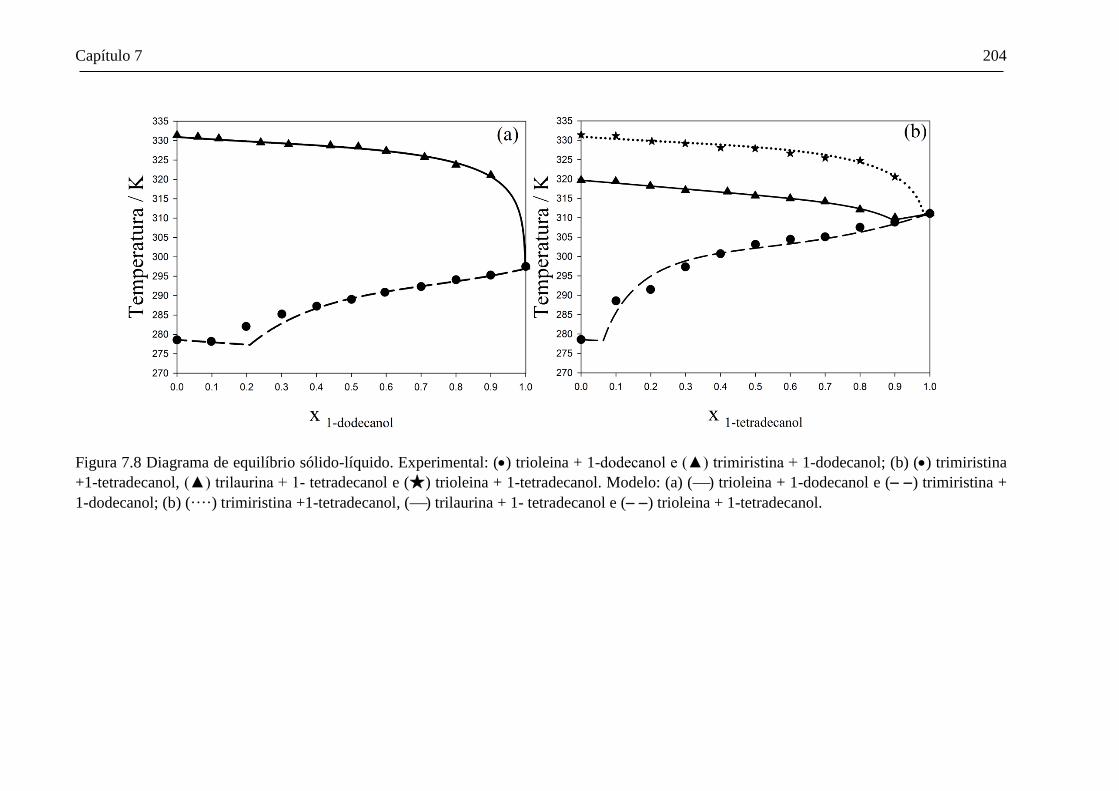


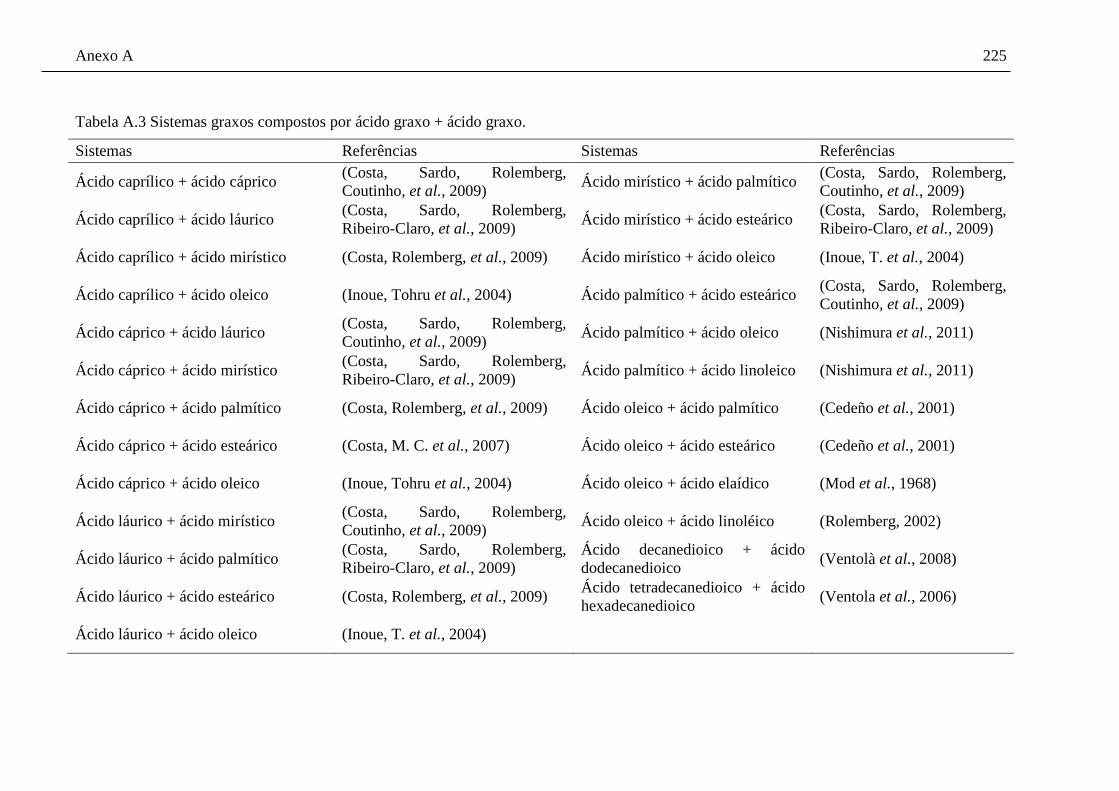


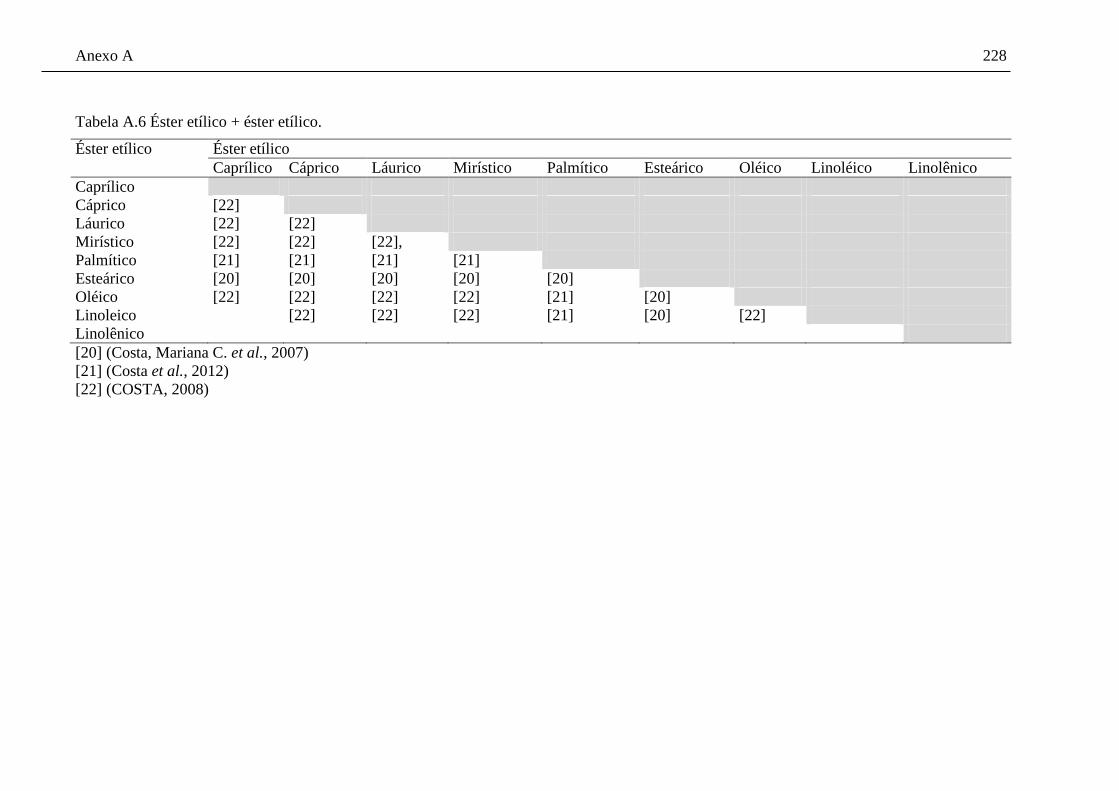


![METILPIRIMIDINA-4,6-DIIL]BISHIDRAZONA ESTUDUIOS ... · feitos através de voltametria de onda quadrada indicando que os compostos preparados possuem potenciais redox dentro da faixa](https://static.documents.pub/doc/80x56/5c12413b09d3f23b288d5bb5/metilpirimidina-46-diilbishidrazona-estuduios-feitos-atraves-de-voltametria.jpg)


