Page 1
UNIVERSIDADE ESTADUAL DE CAMPINAS
INSTITUTO DE QUÍMICA
RAISA SIQUEIRA ALVES
HIGHLY-BRANCHED SILVER MAGNETIC MICROCOMPOSITE AS SERS
SUBSTRATE FOR CARDIAC TROPONIN I DETECTION
MICROCOMPÓSITO MAGNÉTICO DE PRATA ALTAMENTE RAMIFICADO
COMO SUBSTRATO SERS PARA DETECÇÃO DE TROPONINA I CARDÍACA
CAMPINAS
2019
Page 2
RAISA SIQUEIRA ALVES
HIGHLY-BRANCHED SILVER MAGNETIC MICROCOMPOSITE AS SERS
SUBSTRATE FOR CARDIAC TROPONIN I DETECTION
MICROCOMPÓSITO MAGNÉTICO DE PRATA ALTAMENTE RAMIFICADO
COMO SUBSTRATO SERS PARA DETECÇÃO DE TROPONINA I CARDÍACA
Dissertação de Mestrado apresentada ao Instituto de Química da
Universidade Estadual de Campinas como parte dos requisitos exigidos
para a obtenção do título de Mestra em Química na área de Química
Inorgânica
Master's dissertation presented to the Institute of Chemistry of the
University of Campinas as part of the requirements to obtain the title
Master's in Chemistry in the area of Inorganic Chemistry.
Supervisor: Prof. Dr. Italo Odone Mazali
O arquivo digital corresponde à versão final da Dissertação defendida pela aluna Raisa
Siqueira Alves e orientada pelo Prof. Dr. Italo Odone Mazali.
CAMPINAS
2019
Page 4
BANCA EXAMINADORA
Prof. Dr. Italo Odone Mazali (Orientador)
Prof. Dr. Rômulo Augusto Ando (IQ-USP)
Prof. Dr. Diego Pereira dos Santos (IQ-UNICAMP)
A Ata da defesa assinada pelos membros da Comissão Examinadora, consta no SIGA/Sistema
de Fluxo de Dissertação/Tese e na Secretaria do Programa da Unidade.
Este exemplar corresponde à redação
final da Dissertação de Mestrado
defendida pela aluna RAISA
SIQUEIRA ALVES, aprovada pela
Comissão Julgadora em 20 de fevereiro
de 2019.
Page 5
DEDICATION
I dedicate this work to my love Marcos, my
family, my soul sister Mayara and all the people
who helped me get through this very challenging
chapter of my life
Page 6
ACKNOWLEDGMENTS
To God, for giving me faith, hope, blessings, and protection in this journey and for all the good
angels He put in my life;
To my kind advisor Prof. Italo Mazali for the opportunity and for trusting in my work, and also
for always having a good story to share. Also a special thanks to Prof. Fernando Sigoli for all
the kindness, the discussions and the warm reception in the lab;
To Prof. Diego Pereira dos Santos and Prof. Daniela Zanchet for all the fruitful contributions
in my qualifying exam.
To my love Marcos for the patience, the love and for deciding to build a future together with
me despite all the difficulties of the distance;
To Mayara, my best friend, for trying to make me a better person and for giving me support in
the difficult times;
To my parents who gave me life, Claudinea and Manoel; and to my parents/in-laws Sérgio and
Rosana for teaching me the value of a strong, loving and supporting family;
To my dear friends Prof. Dr. Ladário da Silva e Prof. Dr. Michelle Lemos (Federal Fluminense
University, UFF – campus Volta Redonda) for all the encouragement, advice, and for the good
talks during my undergraduate years and now as a graduate student;
To all my dear friends from LMF for all the good moments: Adriana, Cristine, Déborah, Diogo,
Edison, Emille, Filipe, Geovana, Gesiane, Isabela, Isaías, Jaciara, Lanousse, Laura, Rafael,
Rafael (Charlão), Raul, and William. A special thanks to Amanda, Flávia, Josi, and Naiara for
making my days at work lighter. I am going to miss all of you!
To Msc. Lory Cantelly and Prof. Lauro Kubota (IQ/Unicamp) for all the availability and the
contributions on the final step of aptamer assembly; Also a special thanks to Prof. Juliano
Bonacin for allowing me to use his laboratory facilities for the work, and to Prof. Hudson Zanin
and the PhD student Lenon Henrique da Costa (FEEC/Unicamp) for sharing the facilities to use
the Raman microscope;
To Cristine, Douglas, Flávia, and Hugo for the microscopy images;
To all the teachers, technicians and collaborators of the Institute of Chemistry for the hard work
and for contributing to our academic formation. A special thanks to Claudinha, Milene, and
Sônia for the training and for the kindness with all the students;
Page 7
To the National Council for Scientific and Technological Development (CNPq) for the
scholarship granted;
To FAPESP for the scholarship grant #2017/08105-7, São Paulo Research Foundation
(FAPESP). It is stressed that the opinions, hypotheses and conclusions or recommendations
expressed in this material are the responsibility of the author and do not necessarily reflect the
views of FAPESP;
This study was financed in part by the Coordenação de Aperfeiçoamento de Pessoal de Nível
Superior - Brasil (CAPES) - Finance Code 001.
Page 8
“Science can only flower out when there is an
internal urge. It cannot thrive under external
pressure.”
Chandrasekara Venkata Raman
Page 9
RESUMO
A espectroscopia Raman intensificada por superfície (SERS, em inglês surface-enhanced
Raman spectroscopy) é uma técnica espectroscópica poderosa com amplas aplicações em
Química, Ciência dos Materiais, Bioquímica e áreas relacionadas. Em SERS, o espalhamento
Raman de moléculas adsorvidas em substratos metálicos rugosos ou em nanopartículas
metálicas é elevado em várias ordens de magnitude. SERS tem mostrado uma série de
vantagens comparado a outras técnicas espectroscópicas bem estabelecidas, como
espectroscopias no infravermelho, de fluorescência e no UV-visível. Ademais, interstícios
nanométricos e regiões ricas em pontas em nanopartículas de metais nobres podem induzir os
chamados “hot spots”, regiões de alta intensificação do campo eletromagnético onde o sinal
Raman é maximizado. A alta sensitividade do SERS é particularmente interessante para a
detecção de amostras biológicas, e, portanto, a técnica tem sido investigada para o
desenvolvimento de futuros biosensores plasmônicos e outros poderosos dispositivos
analíticos. SERS tem mostrado resultados promissores no diagnóstico de doenças, tais como
diabetes, câncer e doenças cardiovasculares. Nesse contexto, a busca por substratos SERS de
alta eficiência, reprodutíveis e com bom custo-benefício tem sido um dos principais focos na
pesquisa em Raman. Dado isso, este trabalho tem por objetivo sintetizar um microcompósito
de prata altamente ramificado de composição Fe3O4@SiO2@Ag como um versátil e eficiente
substrato SERS para aplicação posterior como um biosensor baseado no efeito. O caroço de
Fe3O4, sintetizado pelo método solvotérmico, confere ao material propriedades magnéticas, que
permitem uma fácil separação de fluidos. A camada de sílica foi sintetizada pelo método de
Stöber com algumas modificações, e não apenas preserva a integridade do caroço contra agentes
externos, mas também previne a agregação magnética irreversível. As microflores de
Fe3O4@SiO2@Ag foram sintetizadas por uma rota sonoquímica mediada por semente,
produzindo inúmeras pontas de prata, que geram as propriedades plasmônicas para o efeito
SERS. Todos os sistemas foram caracterizados por diferentes técnicas, sobretudo microscopia
eletrônica de transmissão, difração de raios-X e espectroscopia no UV-visível. A eficiência do
microcompósito foi testada frente ao 4-aminobenzenotiol como referência, e o limite de
detecção de 1x10⁻⁷ mol L-1 foi alcançado. Posteriormente, um aptasensor foi montado a partir
do substrato das microflores e testado para análise de troponina I (cTnI). A troponina I é um
biomarcador chave no infarto agudo do miocárdio (IAM), uma das principais causas de morte
mundialmente. A biomolécula tem sido explorada para o diagnóstico precoce e preciso de IAM.
Para produzir o aptasensor, as microflores foram funcionalizadas com um aptâmero com alta
afinidade e especificidade por cTnI. As medidas de SERS com o aptasensor alcançaram a
detecção de cTnI em uma concentração de 1x10⁻⁸ mol L-1. Assim sendo, o aptasensor se
mostrou bastante promissor, abrindo o caminho para pesquisas futuras em aptasensores
baseados no efeito SERS.
Page 10
ABSTRACT
Surface-enhanced Raman spectroscopy (SERS) is a powerful spectroscopic technique with
wide applications in Chemistry, Material Sciences, Biochemistry, and related areas. In SERS
Raman scattering of molecules adsorbed on rough metal surfaces or metal nanoparticles is
increased by several orders of magnitude. SERS has shown many advantages over other well-
established spectroscopic techniques such as infrared -, fluorescence – and UV-Vis
spectroscopy. Moreover, interstitial nanogaps and the presence of sharp regions in noble metal
nanoparticles can induce the so-called plasmonic hot spots, regions of strong electromagnetic
field enhancement where the Raman signal is maximized. The high sensitivity of SERS is
particularly interesting for the detection of biological samples, and therefore the technique has
been investigated for the development of future plasmonic biosensors and other powerful
analytical devices. SERS has shown promising results in the diagnosis of diseases, such as
diabetes, cancer, and cardiovascular diseases. In this context, the search for highly efficient,
reproducible and cost-effective SERS substrates is currently one of the central focuses of
Raman research. Given so, this work aims to synthesize a highly branched flower-like
Fe3O4@SiO2@Ag microcomposite as an efficient and versatile SERS substrate for application
as a SERS-based biosensor. The Fe3O4 core, synthesized by a modified solvothermal approach,
endows magnetic properties to the material, which enables an effortless separation from fluids.
The silica coating was synthesized by the Stöber method with slight modifications. The silica
layer not only preserves the integrity of the core from external agents but also prevents
irreversible magnetic aggregation. The Fe3O4@SiO2@Ag microflowers were synthesized by a
seed-mediated sonochemical approach, producing numerous Ag tips, which generated the
plasmonic properties for the SERS effect. All the systems were characterized by different
techniques, especially transmission electron microscopy, X-ray diffraction, and UV-Vis
spectroscopy. The efficiency of the microcomposite substrate was tested against 4-amino
benzenethiol (4-ABT) as a reference probe, and a detection limit of 1x10⁻⁷ mol L-1 was
achieved. Subsequently, an aptasensor was assembled from the microflower substrate and
tested for the analysis of troponin I (cTnI). Troponin I is a key biomarker for acute myocardial
infarction (AMI), one of the lead death causes worldwide. The biomolecule has been explored
for an early and precise diagnosis of AMI. To produce the aptasensor, the microflowers were
functionalized with an aptamer with high affinity and specificity for cTnI. The SERS
measurements with the aptasensor achieved the detection of cTnI in a concentration of 1x 10⁻⁸
mol L-1. Hence, aptasensor showed to be very promising, opening the field for further research
on SERS-based aptasensors.
Page 11
LIST OF FIGURES
Figure 1: Representation of Raman and Krishnan’s experiment to investigate the light scattering
of liquid samples. ...................................................................................................................... 27
Figure 2: Representation of the energy transitions in Rayleigh and Raman scattering processes.
.................................................................................................................................................. 29
Figure 3: Representation of the chemical enhancement mechanisms of SERS. ...................... 35
Figure 4: Plasmon oscillation on a metallic sphere with respect to the electric field of the
incident light. Consequently, the conduction electron density (purple) is displaced relative to
the nuclei. ................................................................................................................................. 37
Figure 5: Representation of hot spot formation upon the light excitation of two interacting metal
nanoparticles (gold spheres), and the different responses of the adsorbed analyte (purple) under
normal Raman, SERS and hot spot conditions. ........................................................................ 38
Figure 6: Real (a) and imaginary (b) parts of the dielectric function ε(ω) as a function of
wavelength λ for several metals in bulk form. Data extracted from ref. 47,48. ....................... 40
Figure 7: Experimental (A) and calculated (B) scattering spectra of silver nanobars with
different aspect ratios. The longitudinal plasmon resonance mode redshifts with increasing
aspect ration. Reproduced from ref. 51. ................................................................................... 42
Figure 8: Calculated extinction (black), absorption (red) and scattering (blue) spectra of silver
nanostructures of different geometries. Multipole resonance peaks are visible for more complex
particle geometries. Reproduced from ref. 49. ......................................................................... 43
Figure 9: The main classes of core-shell nanoparticles. Reproduced from ref. 64. ................. 45
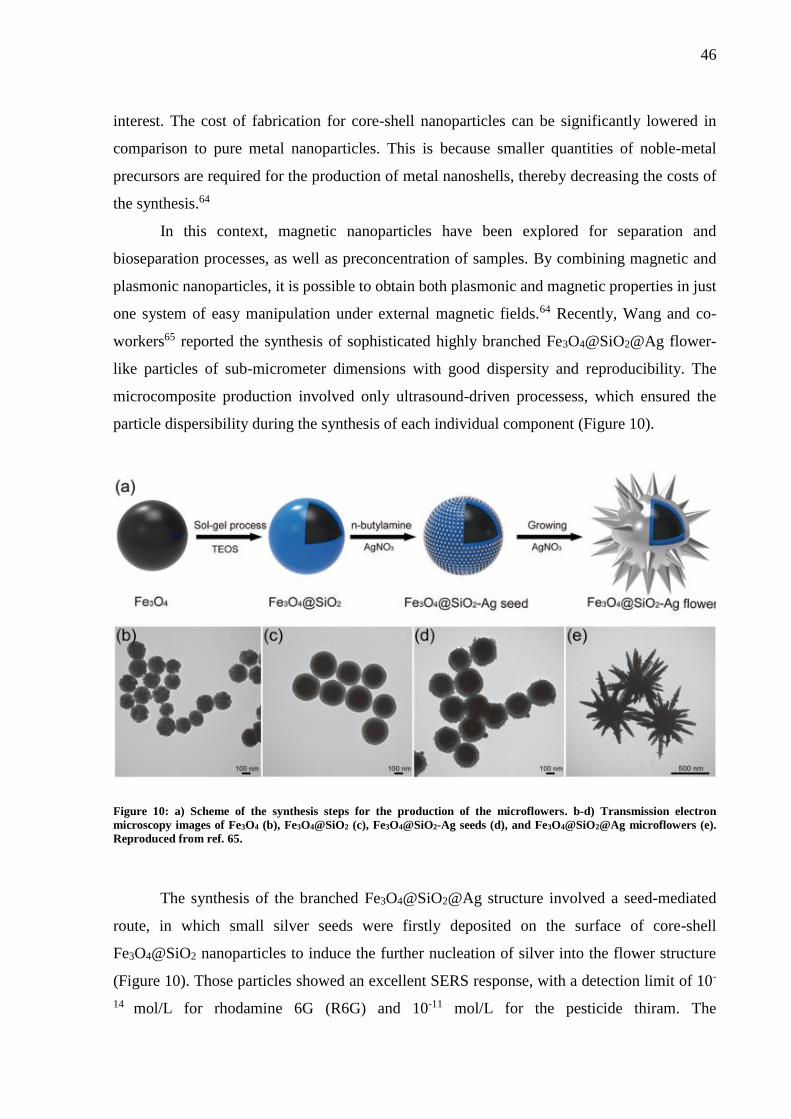
Figure 10: a) Scheme of the synthesis steps for the production of the microflowers. b-d)
Transmission electron microscopy images of Fe3O4 (b), Fe3O4@SiO2 (c), Fe3O4@SiO2-Ag
seeds (d), and Fe3O4@SiO2@Ag microflowers (e). Reproduced from ref. 65. ....................... 46
Figure 11: Outline of the synthetic process of the Fe3O4@SiO2@Ag microflowers. .............. 52
Page 12
Figure 12: Outline of the Fe3O4 synthesis route. ...................................................................... 53
Figure 13: Scheme of the Fe3O4@SiO2 nanoparticle synthesis. .............................................. 53
Figure 14: X-Ray powder diffraction pattern of the synthesized magnetite and the magnetite
reference (JCPDS card no. 19-629). ......................................................................................... 62
Figure 15: SEM micrograph of the synthesized Fe3O4 and the respective histogram of particle
counting (inset in the lower right corner). ................................................................................ 63
Figure 16: TEM micrographs of synthesized Fe3O4 nanoparticles. ......................................... 63
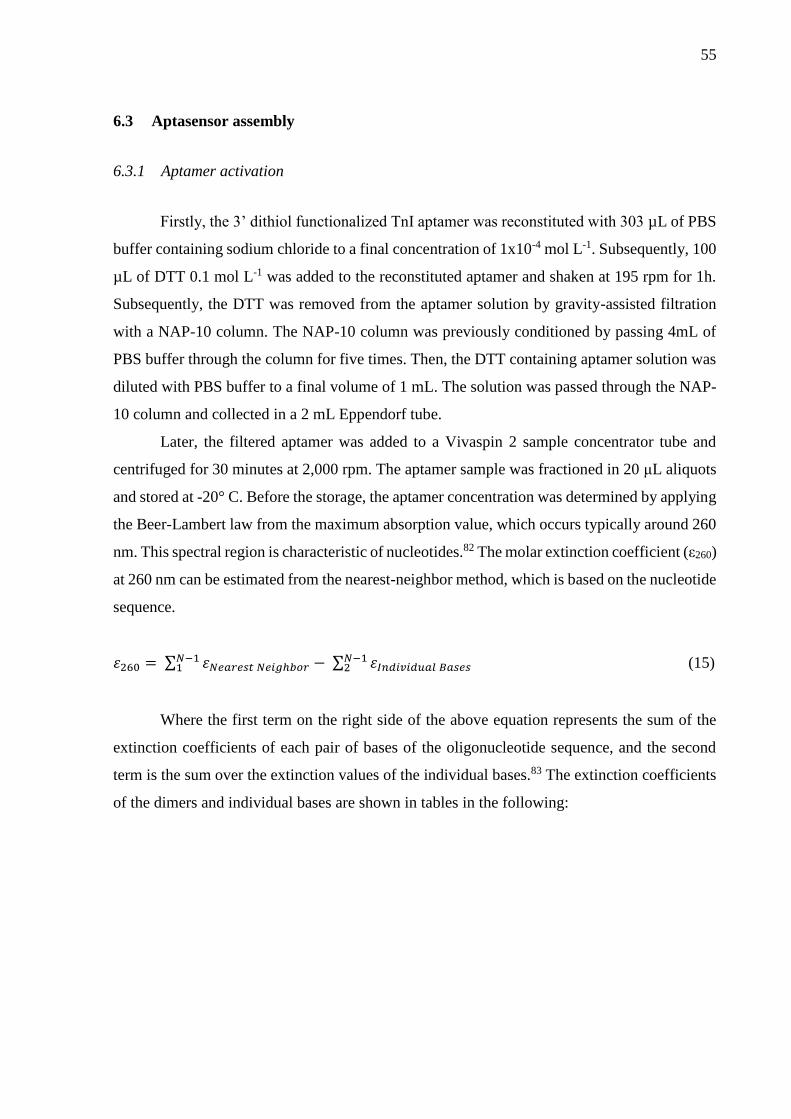
Figure 17: Magnetite sample synthesized by the solvothermal method in powder form after
vacuum drying (left) and suspended in ethanol (center, right). ................................................ 64
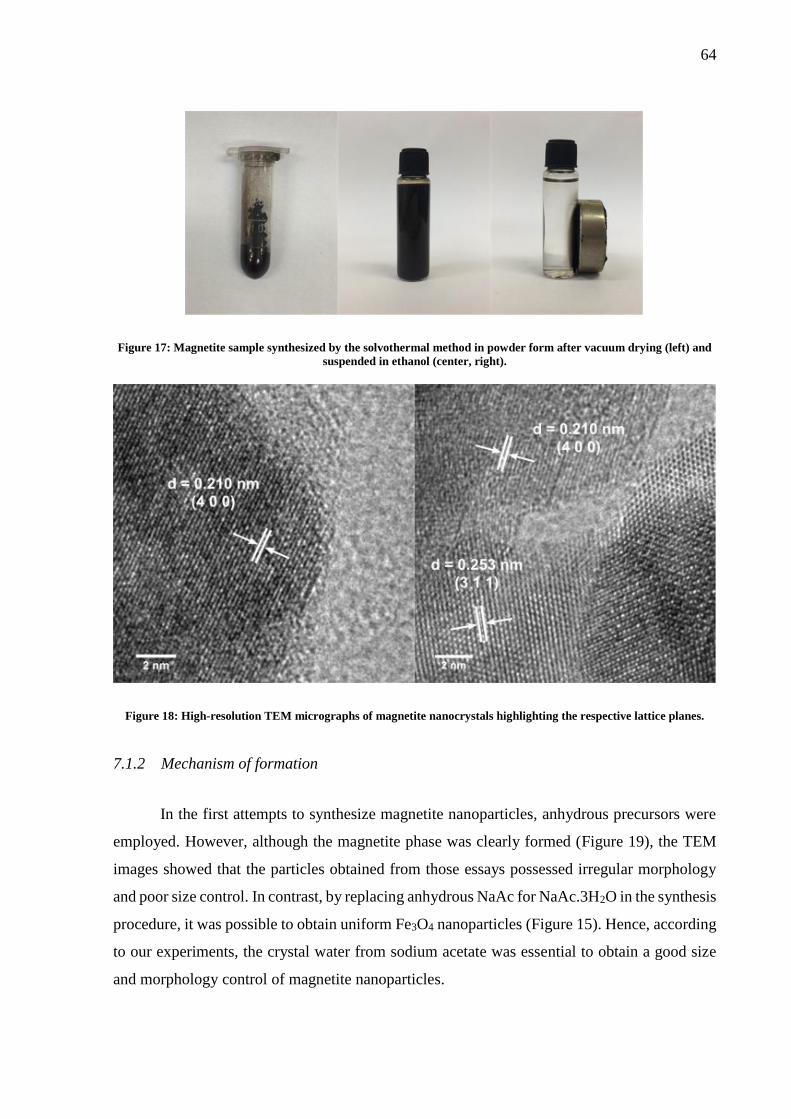
Figure 18: High-resolution TEM micrographs of magnetite nanocrystals highlighting the
respective lattice planes. ........................................................................................................... 64
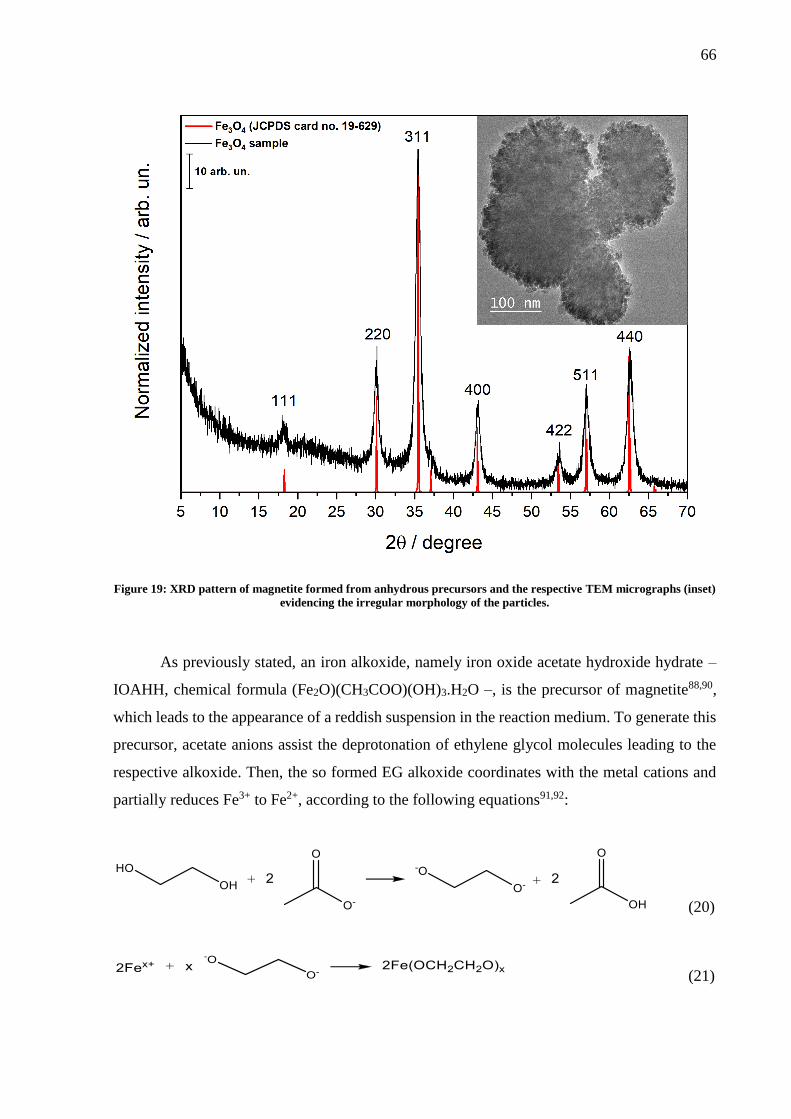
Figure 19: XRD pattern of magnetite formed from anhydrous precursors and the respective
TEM micrographs (inset) evidencing the irregular morphology of the particles. .................... 66
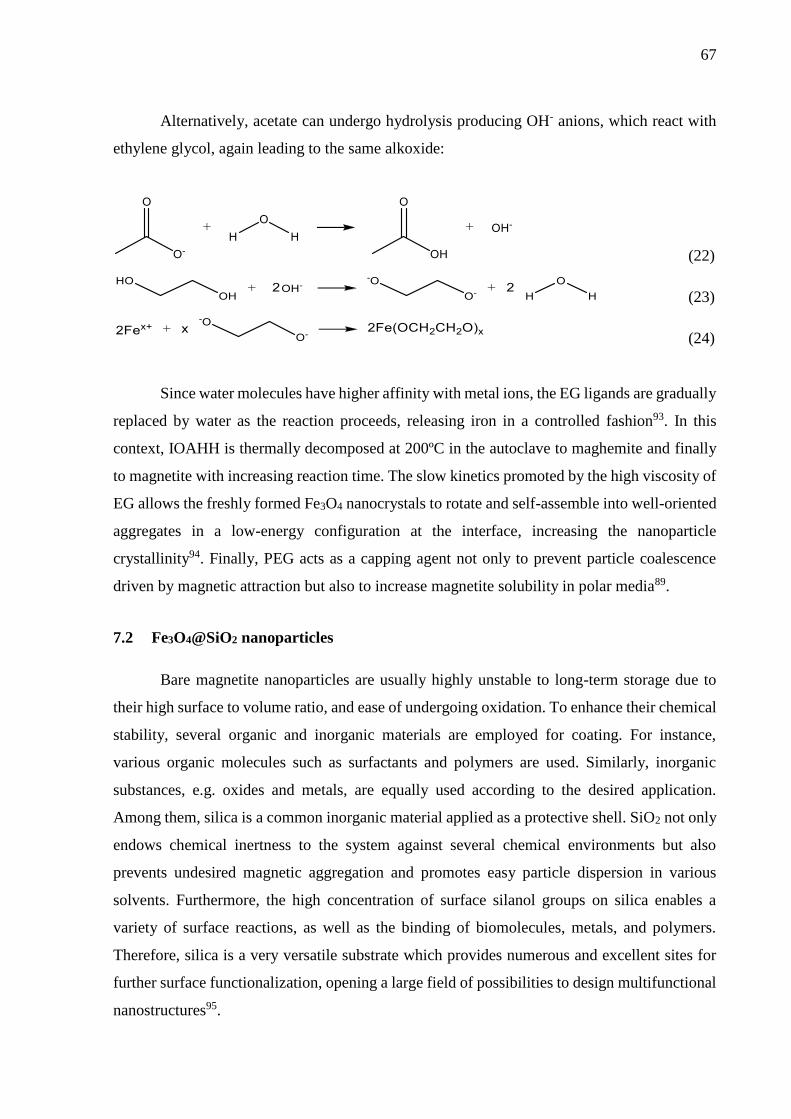
Figure 20: Comparison between the XRD patterns of the synthesized Fe3O4 and the core-shell
Fe3O4@SiO2 nanoparticles. ...................................................................................................... 68
Figure 21: TEM micrographs and EDS elemental mapping (inset, lower right corner) of
Fe3O4@SiO2 core-shell nanoparticles. ..................................................................................... 69
Figure 22: EDS line scan of synthesized core-shell Fe3O4@SiO2 nanoparticles. .................... 69
Figure 23: Fe3O4@SiO2 powder sample synthesized by the modified Stöber method after drying
(left). Comparison between ethanolic suspensions of Fe3O4 and Fe3O4@SiO2 (center) under the
influence of a magnet (right). ................................................................................................... 70
Figure 24: Normalized extinction spectra of the synthesized Fe3O4@SiO2 and Fe3O4@SiO2–
Ag seed nanoparticles. .............................................................................................................. 72
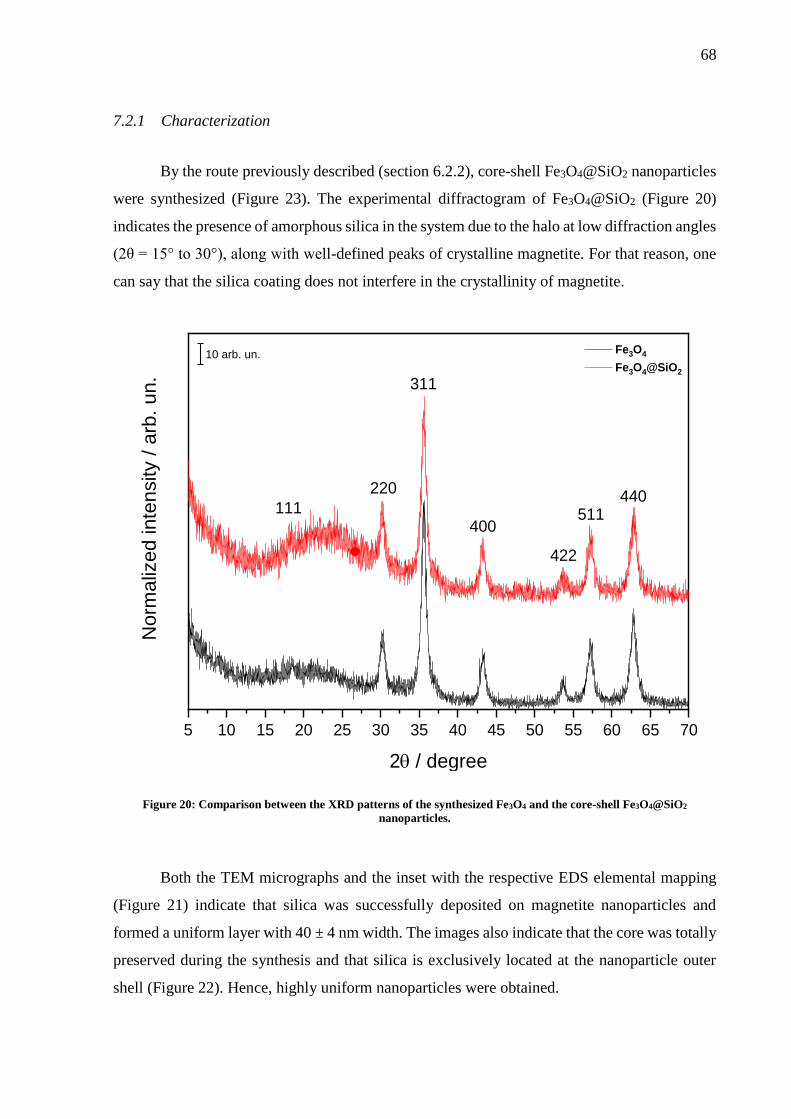
Figure 25: TEM images of Fe3O4@SiO2–Ag seed nanoparticles in different magnifications.
Inset (b) shows the respective EFTEM image (25 eV energy loss). The scale bar is 500 nm (left)
and 200 nm (center, right), respectively. .................................................................................. 73
Page 13
Figure 26: SEM images of Fe3O4@SiO2–Ag nanoparticles in 8,000x (a), 60,000x (b) and
120,000x (inset) magnifications. The scale bars represent 5 μm (a), 1 μm (b), and 500 nm (inset)
size. ........................................................................................................................................... 74
Figure 27: EDS spectrum (a) and EDS mapping (b) of Fe3O4@SiO2–Ag seed nanoparticles. 75
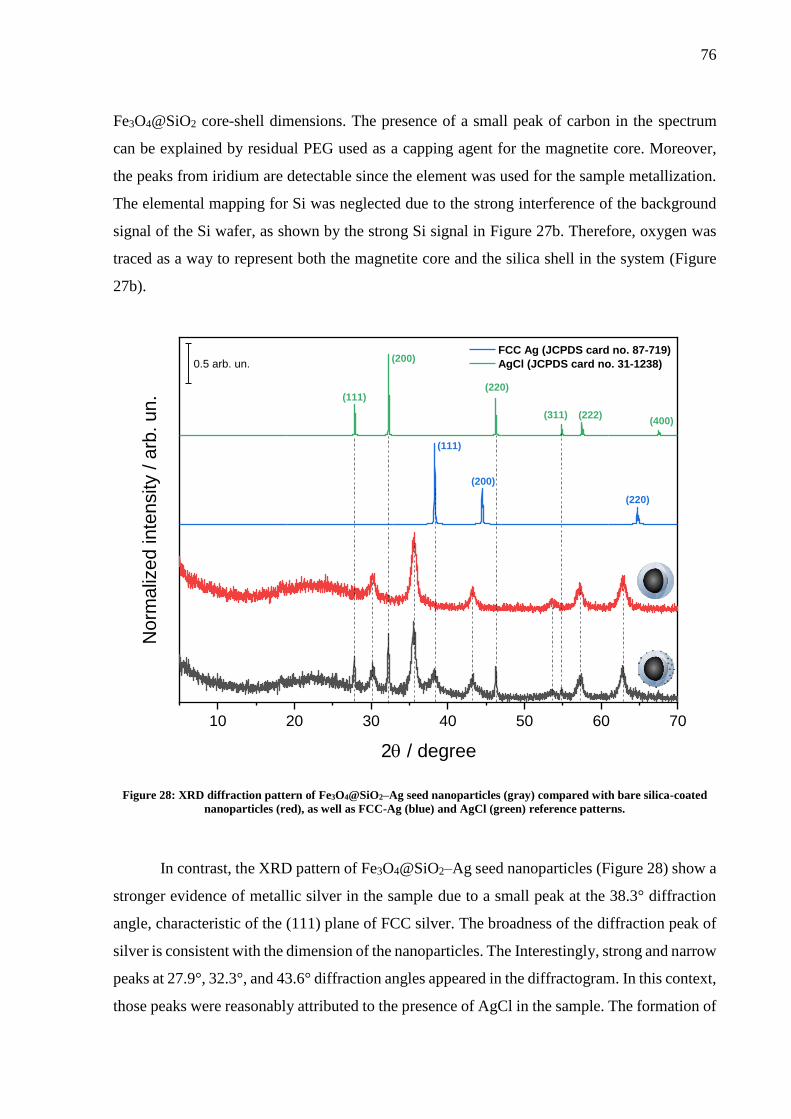
Figure 28: XRD diffraction pattern of Fe3O4@SiO2–Ag seed nanoparticles (gray) compared
with bare silica-coated nanoparticles (red), as well as FCC-Ag (blue) and AgCl (green)
reference patterns. ..................................................................................................................... 76
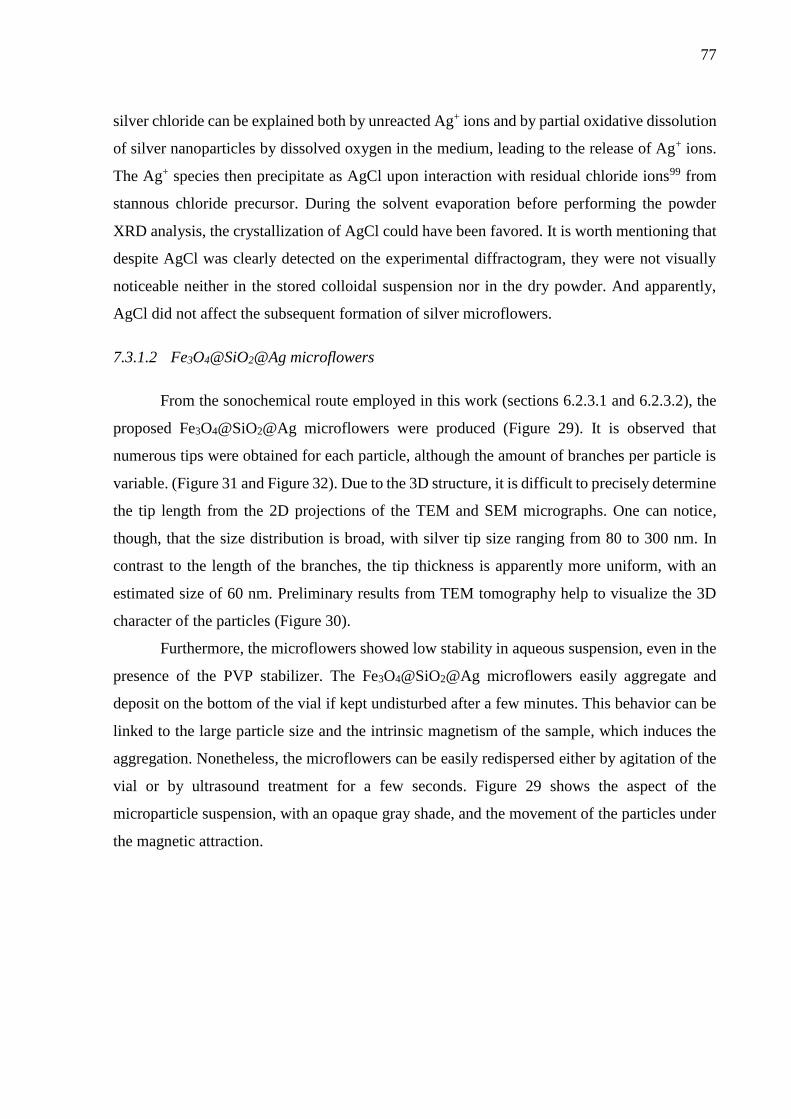
Figure 29: Synthesized Fe3O4@SiO2@Ag microflowers in aqueous suspension. The magnetic
activity of the sample can be observed by placing a magnet on the side wall of the vial. ....... 78
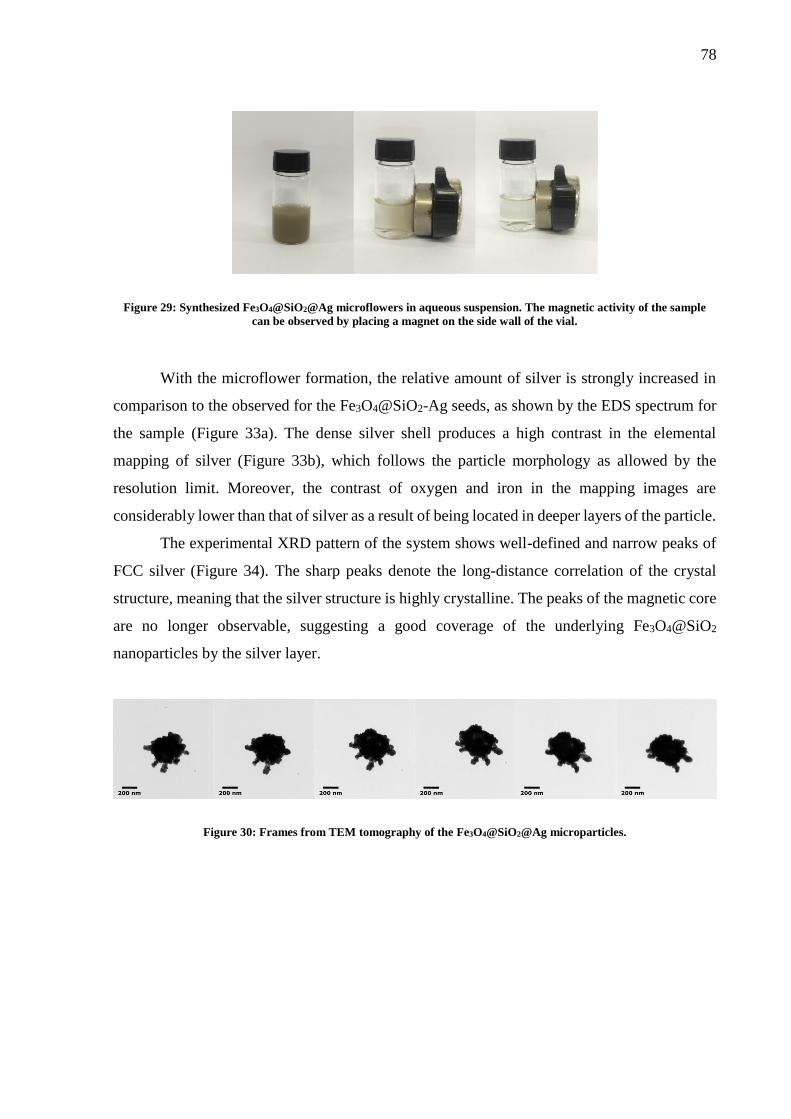
Figure 30: Frames from TEM tomography of the Fe3O4@SiO2@Ag microparticles. ............. 78
Figure 31: TEM images of microflowers. a,b) TEM images in higher magnification evidencing
the high crystallinity of the tips. ............................................................................................... 79
Figure 32: SEM images of Fe3O4@SiO2@Ag microflowers in 8,000x (a), 60,000x (b) and
120,000x (inset) magnifications. The scale bars represent 5 μm (a), 1 μm (b), and 500 nm (inset)
size. ........................................................................................................................................... 80
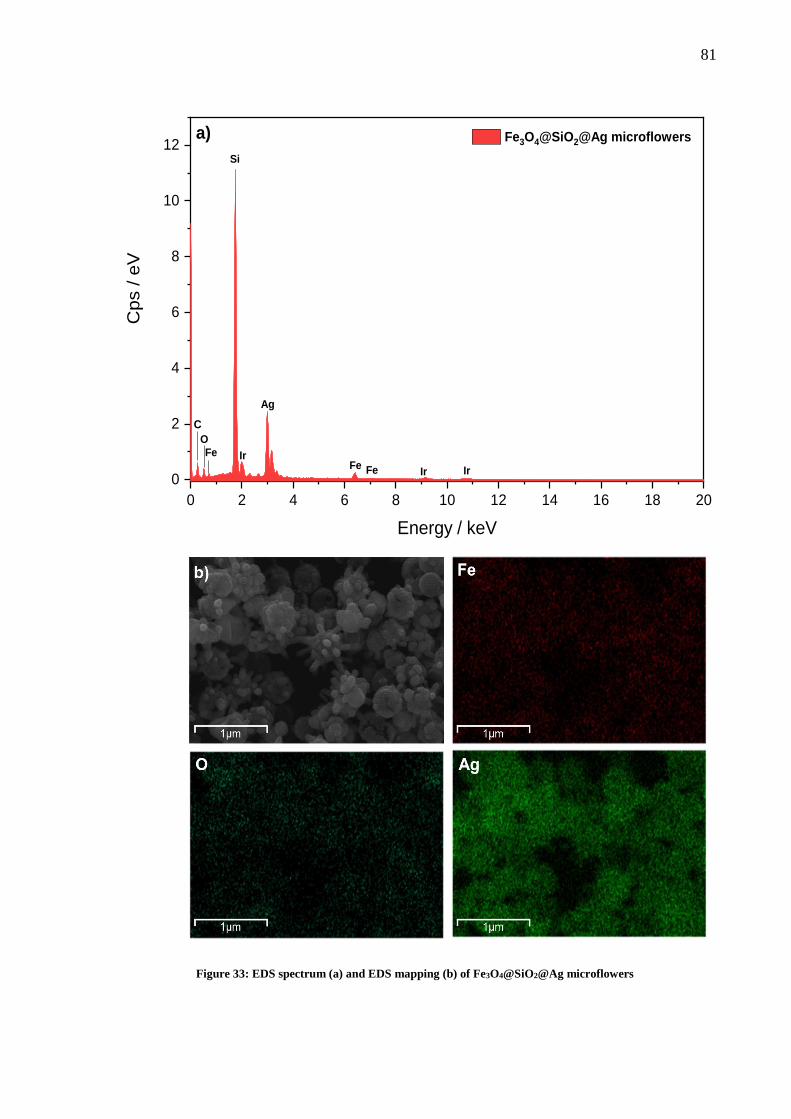
Figure 33: EDS spectrum (a) and EDS mapping (b) of Fe3O4@SiO2@Ag microflowers ....... 81
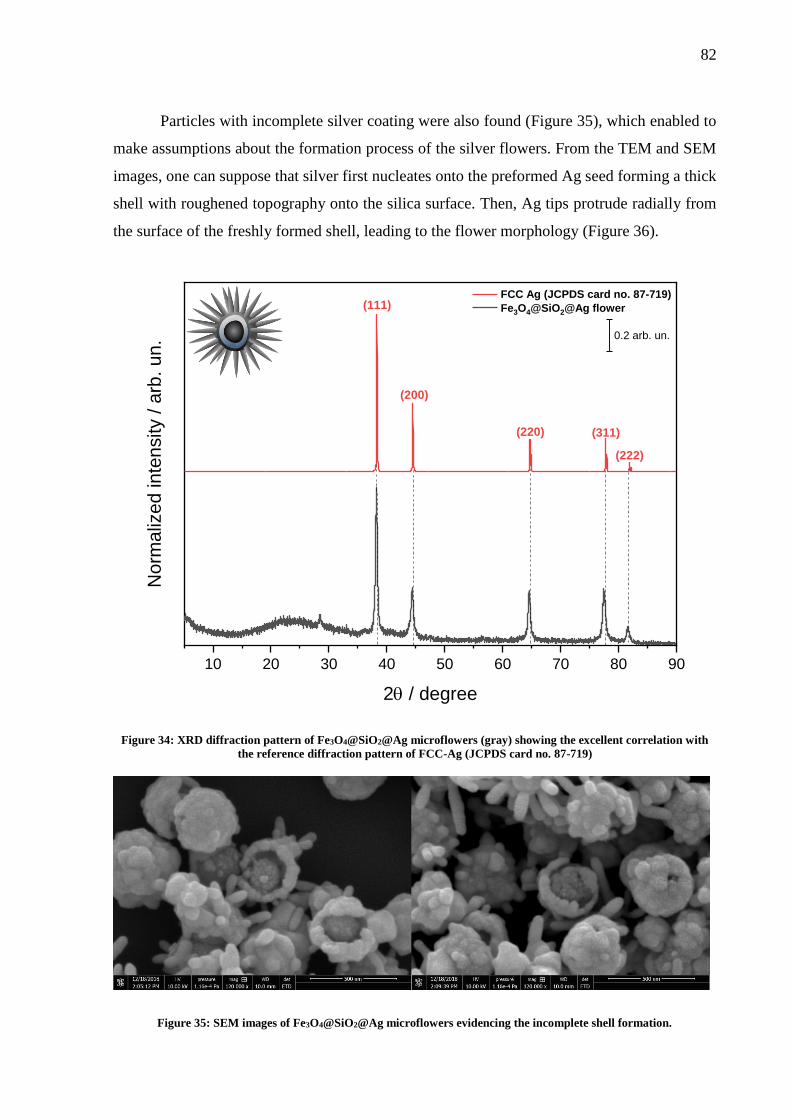
Figure 34: XRD diffraction pattern of Fe3O4@SiO2@Ag microflowers (gray) showing the
excellent correlation with the reference diffraction pattern of FCC-Ag (JCPDS card no. 87-719)
.................................................................................................................................................. 82
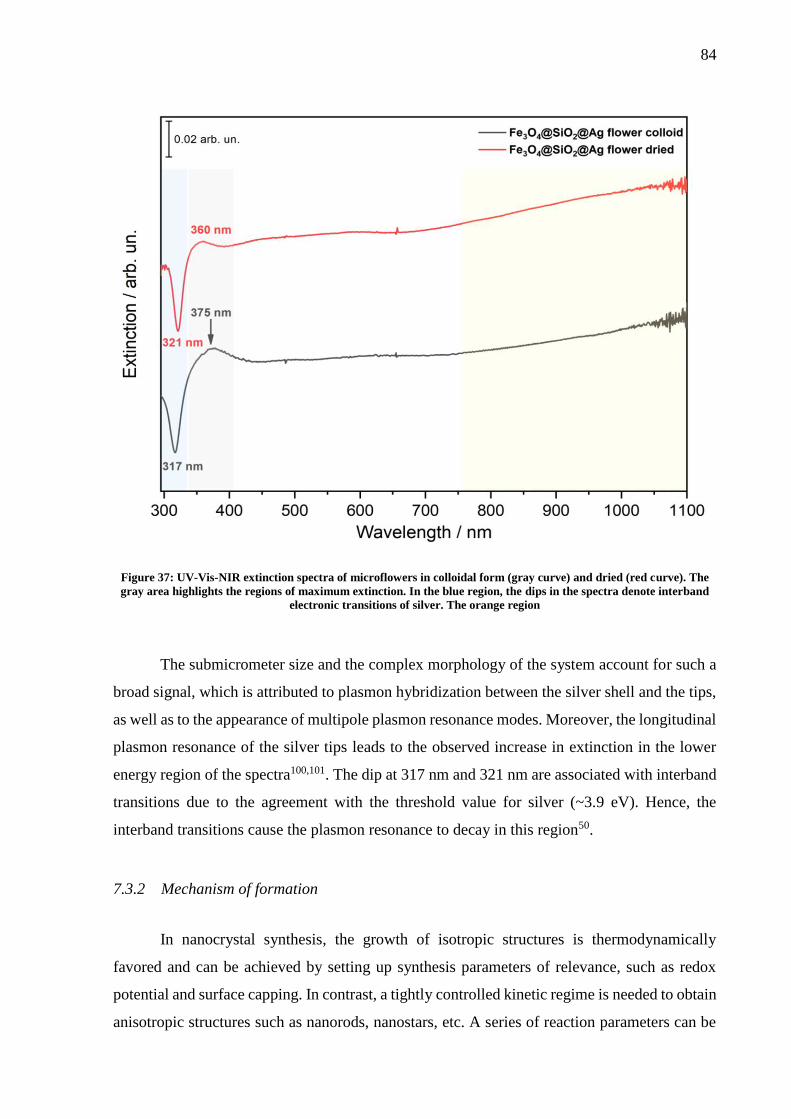
Figure 35: SEM images of Fe3O4@SiO2@Ag microflowers evidencing the incomplete shell
formation. ................................................................................................................................. 82
Figure 36: Suggested formation process of Fe3O4@SiO2@Ag microflowers from seed-
decorated Fe3O4@SiO2 nanoparticles. ..................................................................................... 83
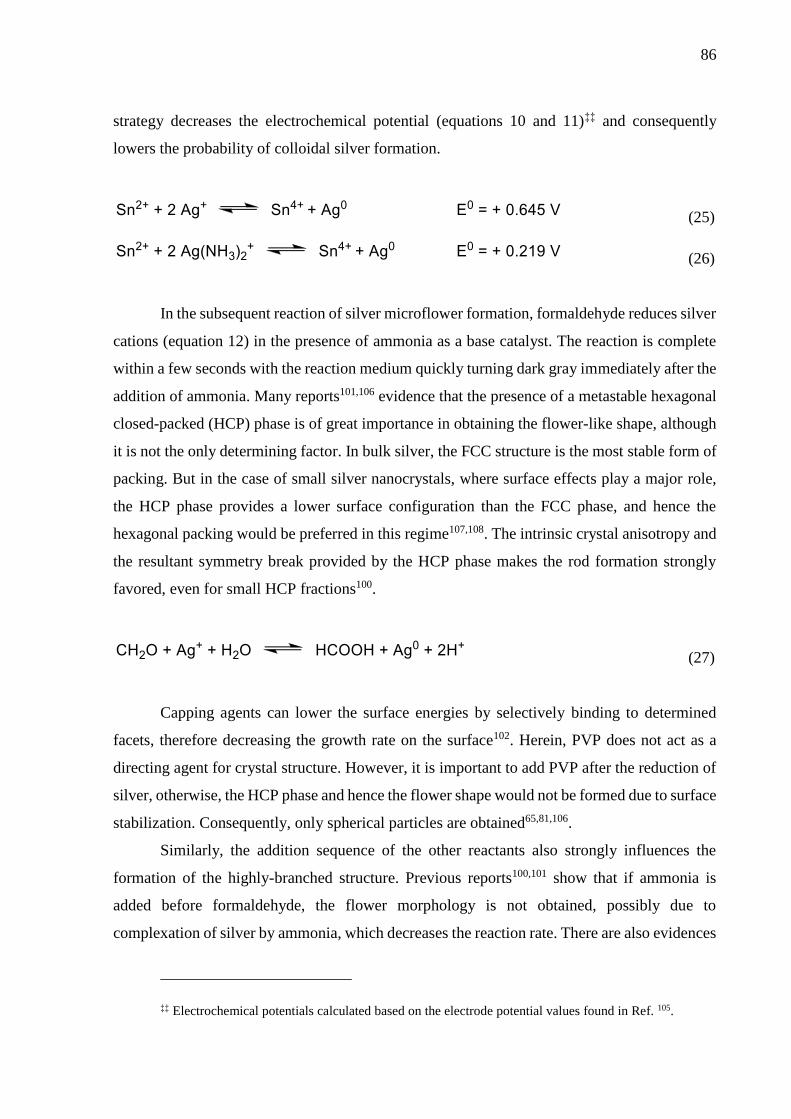
Figure 37: UV-Vis-NIR extinction spectra of microflowers in colloidal form (gray curve) and
dried (red curve). The gray area highlights the regions of maximum extinction. In the blue
region, the dips in the spectra denote interband electronic transitions of silver. The orange
region ........................................................................................................................................ 84
Page 14
Figure 38: Raman and SERS spectra of 4-ABT (structure in the inset) and 4-ABT on
Fe3O4@SiO2@Ag microflowers. Both spectra were acquired with a 532 nm laser (7.5 mW
power) with 1s accumulation time and 1 acquisition. .............................................................. 88
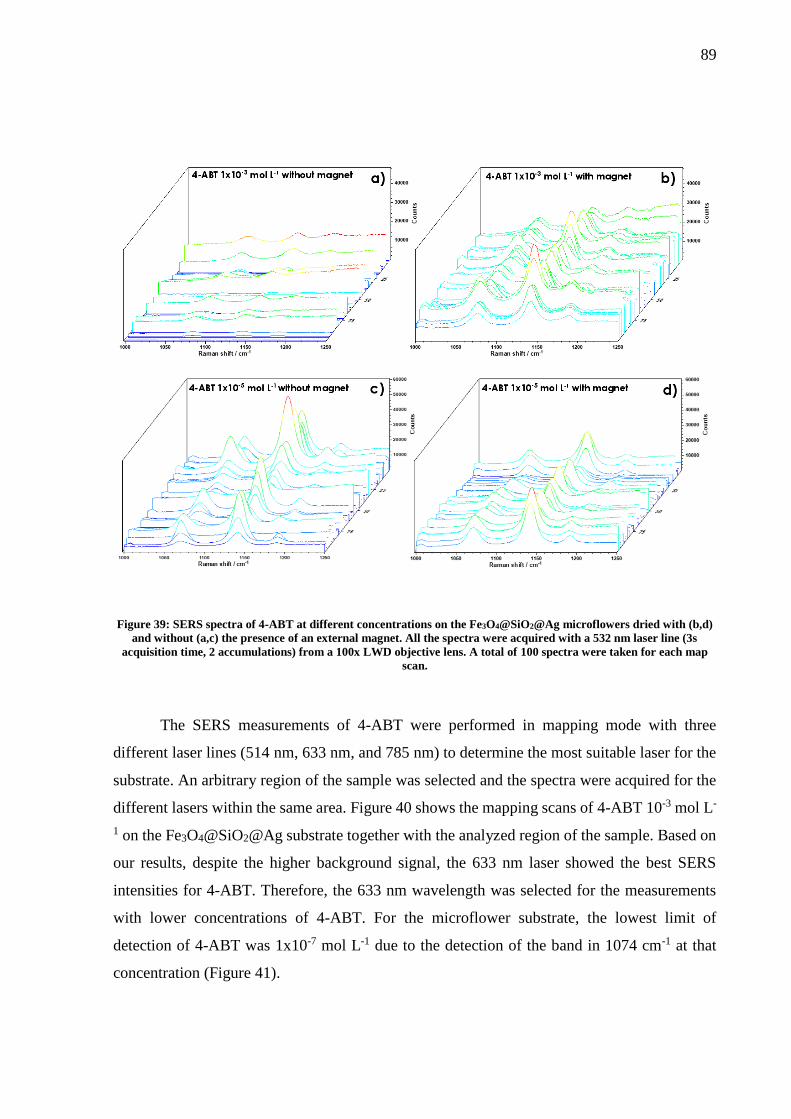
Figure 39: SERS spectra of 4-ABT at different concentrations on the Fe3O4@SiO2@Ag
microflowers dried with (b,d) and without (a,c) the presence of an external magnet. All the
spectra were acquired with a 532 nm laser line (3s acquisition time, 2 accumulations) from a
100x LWD objective lens. A total of 100 spectra were taken for each map scan. ................... 89
Figure 40: SERS spectra of 4-ABT 1x10⁻³ mol L-1 acquired with different lasers – 514 nm (b),
633 nm (c), and 785 nm (d) – within the same region of the sample (a). Each mapping spectrum
contains 150 individual spectra. All the measurements were acquired with a 100x objective lens
with 1s acquisition time and 1 accumulation............................................................................ 90
Figure 41: Determination of the limit of detection of 4-ABT. From the SERS spectra, the
smallest concentration of 4-ABT that could be detected was 1x10⁻⁷ mol L-1. All the
measurements were acquired with a 100x objective lens with 1s acquisition time and 1
accumulation. For a better comparison, the SERS spectra of 4-ABT 1x10⁻⁵ mol L-1 have
undergone baseline correction due to the strong background signal. The original spectra can be
found in Figure 56 (Appendix B). ............................................................................................ 90
Figure 42: Reaction of aptamer activation by DTT. ................................................................. 91
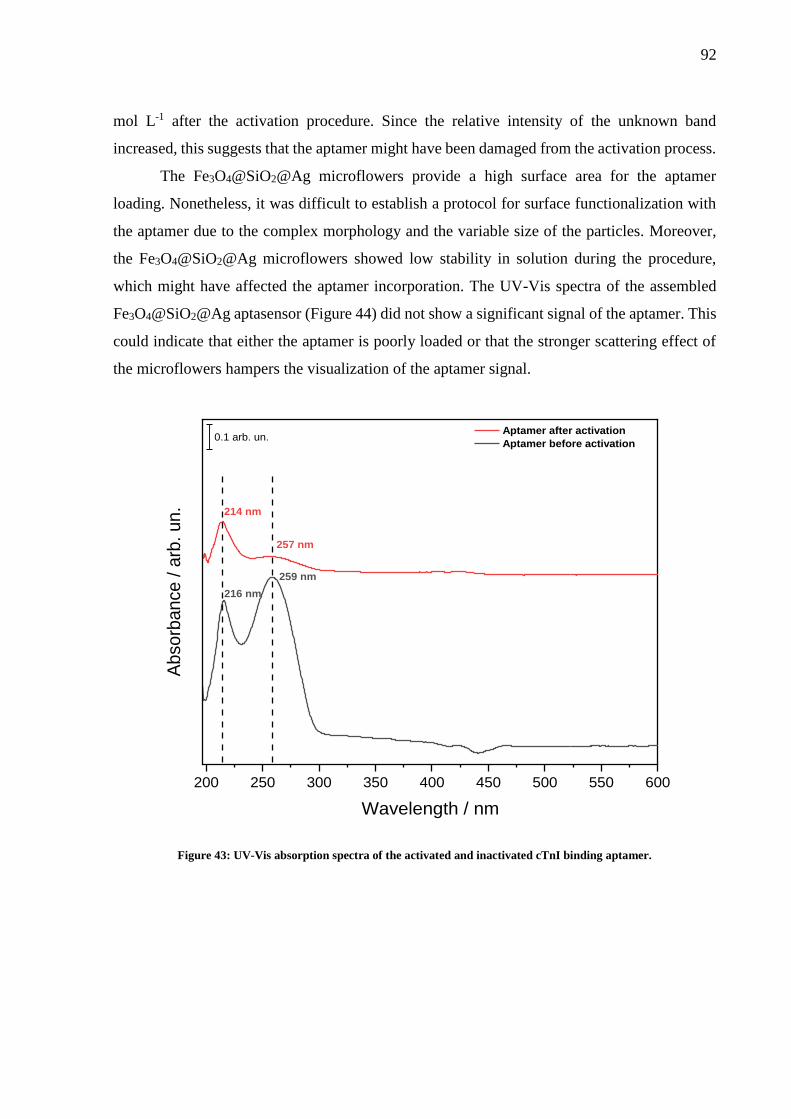
Figure 43: UV-Vis absorption spectra of the activated and inactivated cTnI binding aptamer.
.................................................................................................................................................. 92
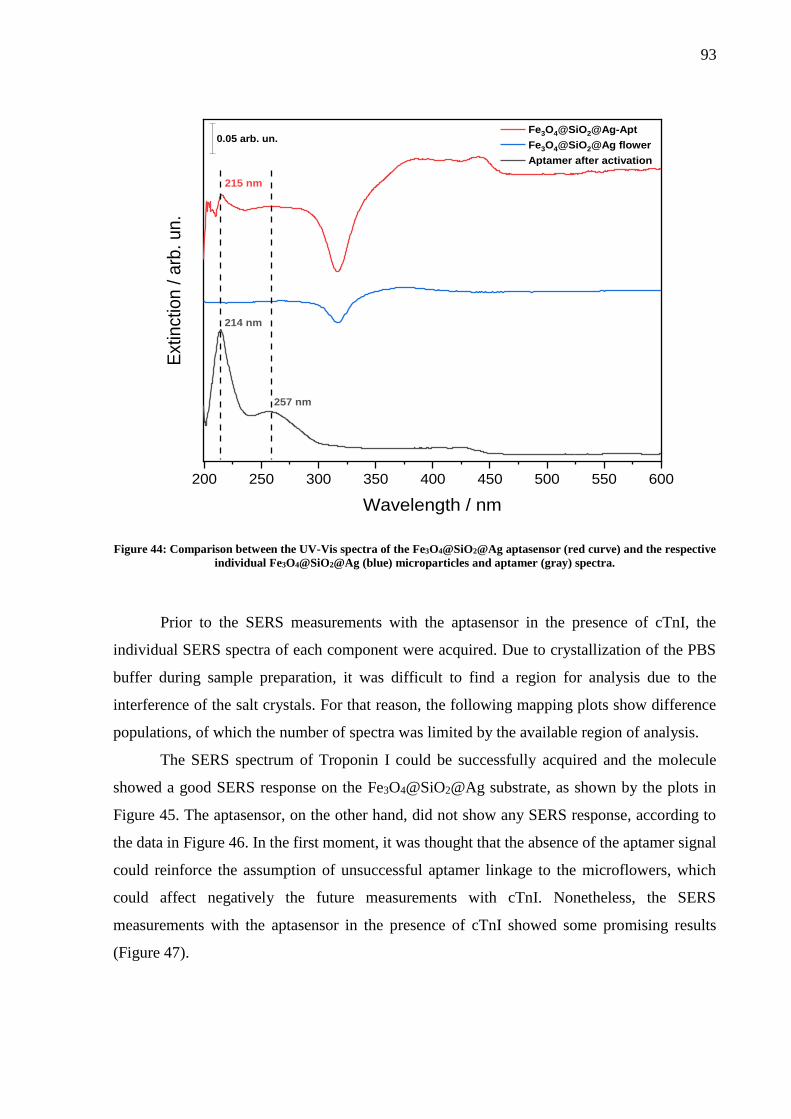
Figure 44: Comparison between the UV-Vis spectra of the Fe3O4@SiO2@Ag aptasensor (red
curve) and the respective individual Fe3O4@SiO2@Ag (blue) microparticles and aptamer (gray)
spectra. ...................................................................................................................................... 93
Figure 45: Individual SERS spectrum (a) and SERS mapping (b) of cTnI 1x10⁻³ mol L-1 on the
microflowers. In (b), a total of 15 spectra were acquired from random points of the sample. For
better visualization, the spectra in the plot (b) have undergone baseline subtraction. The original
plot can be found in Figure 57 (Appendix B). All the measurements were carried out with a 785
nm laser with 10s acquisition time and 1 accumulation. The signal was collected through a 100x
objective lens. ........................................................................................................................... 94
Page 15
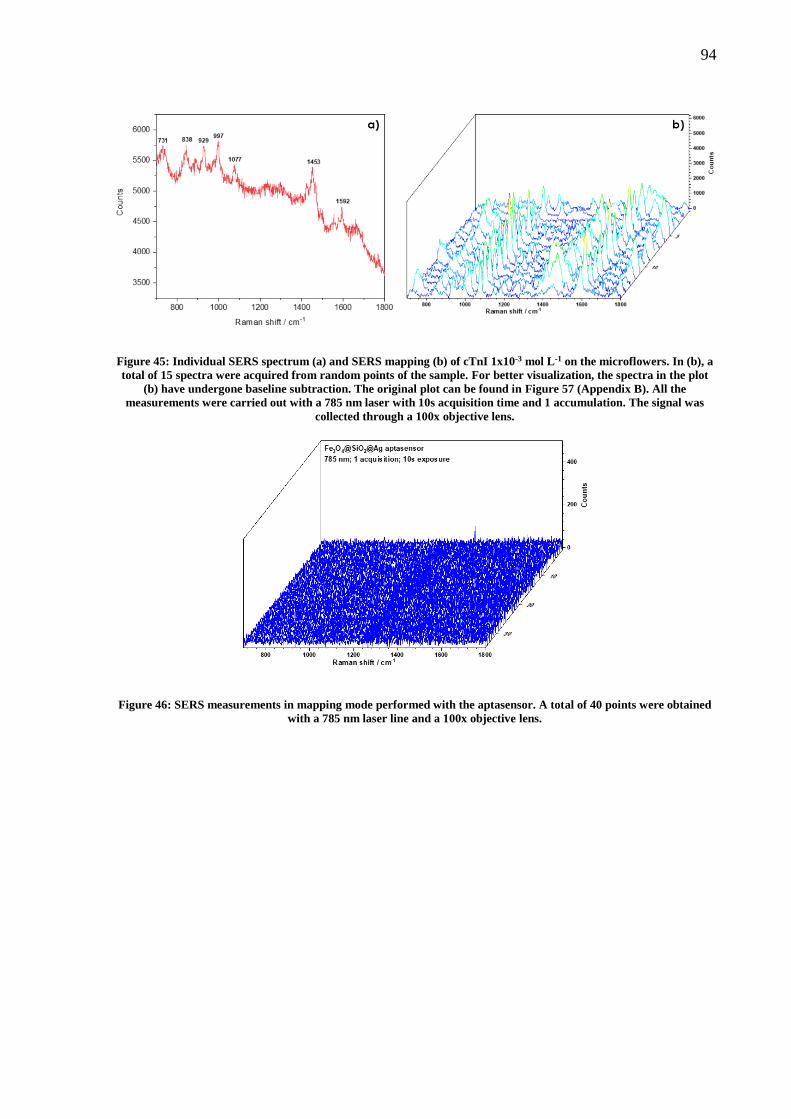
Figure 46: SERS measurements in mapping mode performed with the aptasensor. A total of 40
points were obtained with a 785 nm laser line and a 100x objective lens. ............................... 94
Figure 47: SERS measurements with the aptasensor in the presence of cTnI at two different
concentrations: 1x10⁻⁴ mol L-1 (top) and 1x10⁻⁸ mol L-1 (bottom). On the right, the respective
average plots of each SERS spectra in mapping mode. All the spectra were obtained with a 785
nm laser and collected through a 100x objective lens (10s acquisition time, 1 scan). ............. 95
Figure 48: TEM images of Fe3O4@SiO2-Ag seeds synthesized by Wang and co-workers with
different AgNO3 concentrations: 0.25 (a), 0.5 (b), 0.75 (c), and 1 mmol L-1 (d). Reproduced
from ref. 65. ............................................................................................................................ 106
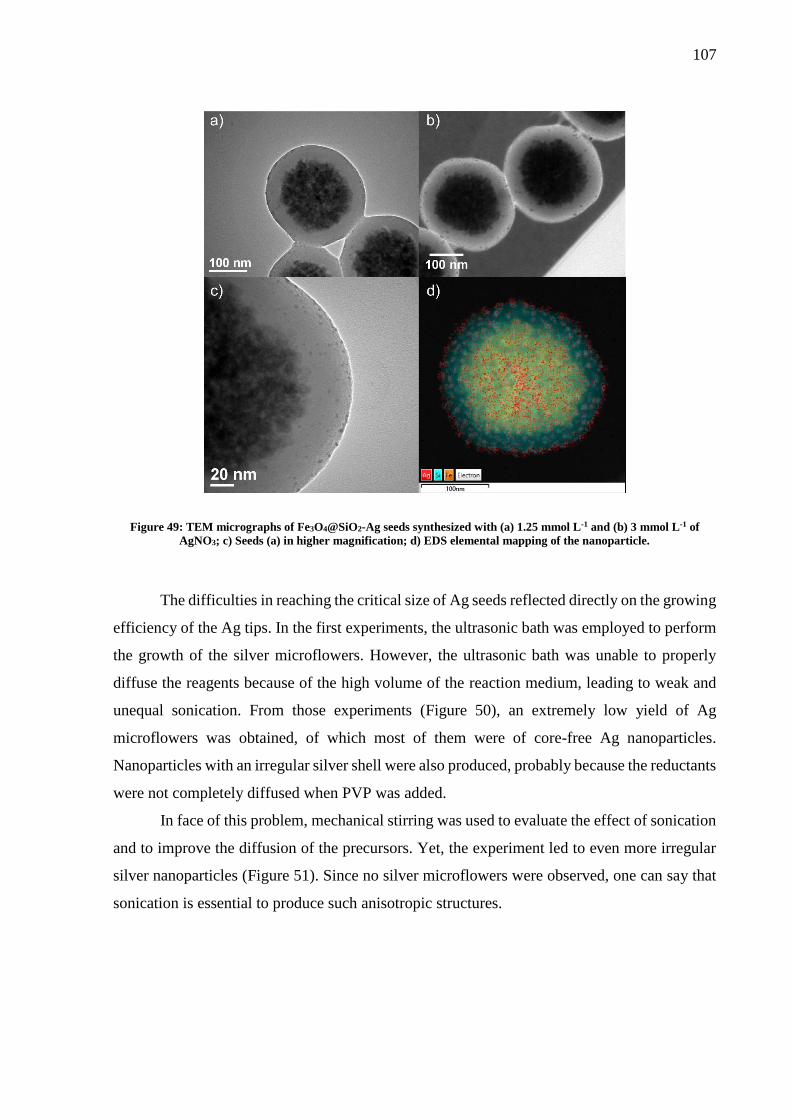
Figure 49: TEM micrographs of Fe3O4@SiO2-Ag seeds synthesized with (a) 1.25 mmol L-1 and
(b) 3 mmol L-1 of AgNO3; c) Seeds (a) in higher magnification; d) EDS elemental mapping of
the nanoparticle....................................................................................................................... 107
Figure 50: TEM micrographs of core-free Ag microflowers (left) and Fe3O4@SiO2@Ag
nanoparticles (right) synthesized by ultrasonic bath. ............................................................. 108
Figure 51: STEM images of Fe3O4@SiO2-Ag nanoparticles synthesized by mechanical stirring.
................................................................................................................................................ 108
Figure 52: Comparison between the ATR-FTIR spectra of synthesized Fe3O4@SiO2 and
Fe3O4@SiO2-Ag seed nanoparticles. ...................................................................................... 109
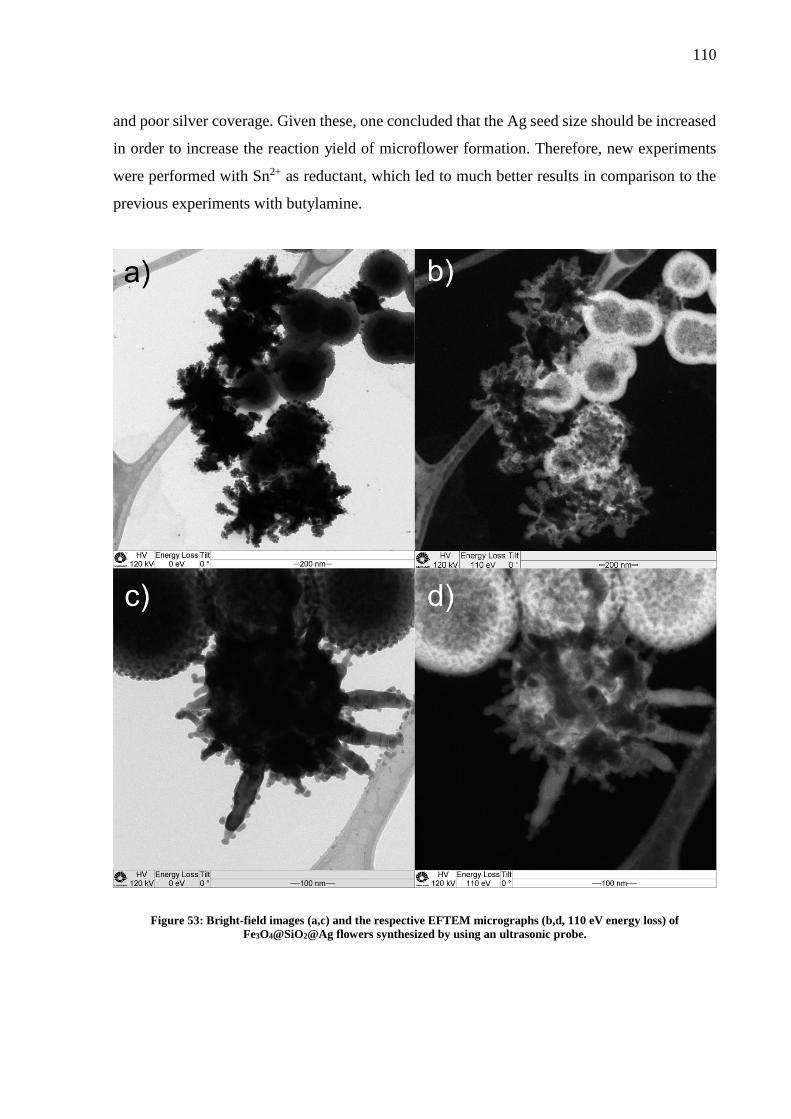
Figure 53: Bright-field images (a,c) and the respective EFTEM micrographs (b,d, 110 eV
energy loss) of Fe3O4@SiO2@Ag flowers synthesized by using an ultrasonic probe. .......... 110
Figure 54: Characteristic UV-Vis absorption spectra of Fe3O4@SiO2@Ag microflowers
synthesized at different AgNO3 concentrations. Reproduced from ref. 65. ........................... 111
Figure 55: UV-Vis absorption spectra of synthesized Fe3O4@SiO2-Ag seed and
Fe3O4@SiO2@Ag flower. ...................................................................................................... 111
Figure 56: Original SERS spectra of 4-ABT 1x10⁻⁵ mol L-1 at 633 nm excitation laser. All the
spectra were acquired with a 100x objective lens with 1s acquisition time and 1 accumulation.
................................................................................................................................................ 113
Page 16
Figure 57: Original SERS spectra in mapping mode of cTnI on the microflowers. All the
measurements were acquired with a 100x objective lens with 10s acquisition time and 1
accumulation. A total of 15 spectra were acquired from random points of the sample. ........ 113
Page 17
LIST OF TABLES
Table 1: List of chemicals used in this work and their specifications. ..................................... 51
Table 2: Extinction coefficients (L mol -1 cm-1) for the different base pairs. Values extracted
from ref. 83. .............................................................................................................................. 56
Table 3: Extinction coefficients (L mol -1 cm-1) for the individual bases. Values extracted from
ref. 84. ....................................................................................................................................... 56
Table 4: Raman and SERS vibrational assignments of solid 4-ABT and 4-ABT on
Fe3O4@SiO2@Ag substrate, respectively. ............................................................................. 112
Page 18
LIST OF ABBREVIATIONS
AMI Acute myocardial infarction
ccp Cubic closed-packed structure
CE Chemical enhancement mechanism
CFSE Crystal field stabilization energy
CNPEM Brazilian Center for Research in Energy and
Materials
CT Charge-transfer resonance enhancement
cTnI Cardiac troponin I
cTnT Cardiac troponin T
CVD Cardiovascular Disease
DTT 1,4-Dithiothreitol
ECG Electrocardiogram
EDS Electron Dispersive X-Ray Spectrometry
EELS Electron Energy-Loss Spectroscopy
EF Enhancement factor
EFTEM Energy Filtered Transmission Electron
Microscopy
EM Electromagnetic enhancement mechanism
FEG Field Emission Electron Gun
FWHM Full-Width at Half Maximum
HCP Hexagonal closed-packed structure
HOMO Highest occupied molecular orbital
HRTEM High-Resolution Transmission Electron
Microscopy
LSP / LSPR Localized surface plasmon / Localized surface
plasmon resonance
LUMO Lowest unoccupied molecular orbital
MNP Metal nanoparticle
MW Molecular weight
MWCO Molecular weight cutoff
NA Numerical aperture
Page 19
PEG Polyethylene glycol
PVP Polyvinylpyrrolidone
R6G Rhodamine 6G
RRS Resonance Raman scattering/spectroscopy
SDD Silicon Drift Detector
SDS Sodium dodecyl sulfate
SEM Scanning Electron Microscopy
SERS Surface-Enhanced Raman Scattering/Spectroscopy
SM-SERS Single Molecule Surface-Enhanced Raman
Scattering
TBA Thrombin-binding aptamer
TEM Transmission Electron Microscopy
TEOS Tetraethyl orthosilicate
UV-Vis Ultraviolet-visible
XRD X-Ray Diffraction
Page 20
LIST OF SYMBOLS
�⃗� Induced dipole moment
�⃗� Oscillating electric field
𝛼 Molecular polarizability
𝛼𝑖𝑗
Elements of the i-th row and j-th column the matrix of the molecular
polarizability tensor
k Normal vibrational mode
x, y, z Cartesian coordinates
�̂�, �̂�, �̂� Unit vectors
0 Subscript indicative of equilibrium position
Q Normal vibrational coordinate
ν Frequency
νv Vibrational frequency of a molecule
I Intensity of light
t Time
c Speed of light
IA Intensity of anti-Stokes Raman scattering
IS Intensity of Stokes Raman scattering
𝜎𝑅 Raman cross-section
ev Energy of the excited vibrational state of the molecule
T Temperature
EF Fermi Level
λ Wavelength of light
ω Angular frequency
𝜀(𝜔) Frequency-dependent dielectric function
𝜀1(𝜔) Real component of the dielectric function
𝜀2(𝜔) Imaginary component of the dielectric function
�⃗� 𝑜𝑢𝑡 Electric field outside the metal nanoparticle
r Distance
𝜀0 Dielectric constant of the medium
a Sphere radius
Page 21
ωLSP Localized surface plasmon frequency
𝜀260 Molar extinction coefficient at 260 nm
A260 Absorbance maximum at 260 nm
C Molar concentration
l Optical path length
K Shape factor
𝜃 Bragg angle
w Peak broadening expressed by the full-width at half maximum (FWHM)
wib Instrumental broadening
wreal Real peak broadening
Page 22
CONTENTS
1 Introduction ....................................................................................................................... 24
2 Principles of Raman and Surface-Enhanced Raman Spectroscopy .................................. 26
2.1 The discovery of the Raman effect ..................................................................... 26
2.2 Fundamentals of Raman scattering ..................................................................... 28
3 Surface-Enhanced Raman Scattering (SERS) ................................................................... 33
3.1 History of SERS .................................................................................................. 33
3.2 Enhancement mechanisms .................................................................................. 34
3.2.1 Chemical mechanism ................................................................................... 34
3.2.2 Electromagnetic mechanism ........................................................................ 36
3.3 Plasmonic substrates for SERS ........................................................................... 41
3.3.1 Effect of particle size and shape ................................................................... 41
3.3.2 Evolution of plasmonic substrates ............................................................... 44
4 Motivation for the research ............................................................................................... 48
5 Objetives and scope of this work ...................................................................................... 50
6 Methodology ..................................................................................................................... 51
6.1 Materials .............................................................................................................. 51
6.2 Synthesis Protocols ............................................................................................. 52
6.2.1 Synthesis of Fe3O4 nanoparticles ................................................................. 52
6.2.2 Synthesis of Fe3O4@SiO2 nanoparticles ...................................................... 53
6.2.3 Synthesis of Fe3O4@SiO2@Ag nanoparticles ............................................. 54
6.3 Aptasensor assembly ........................................................................................... 55
6.3.1 Aptamer activation ....................................................................................... 55
6.3.2 Troponin I reconstitution and storage .......................................................... 56
6.3.3 Aptasensor assembly .................................................................................... 57
Page 23
6.4 Characterization of the Substrates ....................................................................... 57
6.4.1 Transmission Electron Microscopy (TEM) ................................................. 57
6.4.2 Scanning Electron Microscopy (SEM) ........................................................ 58
6.4.3 X-Ray Diffraction (XRD) ............................................................................ 58
6.4.4 UV-Vis Spectroscopy ................................................................................... 59
6.4.5 Surface-Enhanced Raman Spectroscopy (SERS) ........................................ 59
7 Results and Discussion ...................................................................................................... 61
7.1 Fe3O4 nanoparticles ............................................................................................. 61
7.1.1 Characterization ........................................................................................... 61
7.1.2 Mechanism of formation .............................................................................. 64
7.2 Fe3O4@SiO2 nanoparticles .................................................................................. 67
7.2.1 Characterization ........................................................................................... 68
7.2.2 Mechanism of formation .............................................................................. 70
7.3 Fe3O4@SiO2@Ag microflowers ......................................................................... 71
7.3.1 Characterization ........................................................................................... 71
7.3.2 Mechanism of formation .............................................................................. 84
7.4 SERS measurements ........................................................................................... 87
7.5 Fe3O4@SiO2@Ag aptasensor .............................................................................. 91
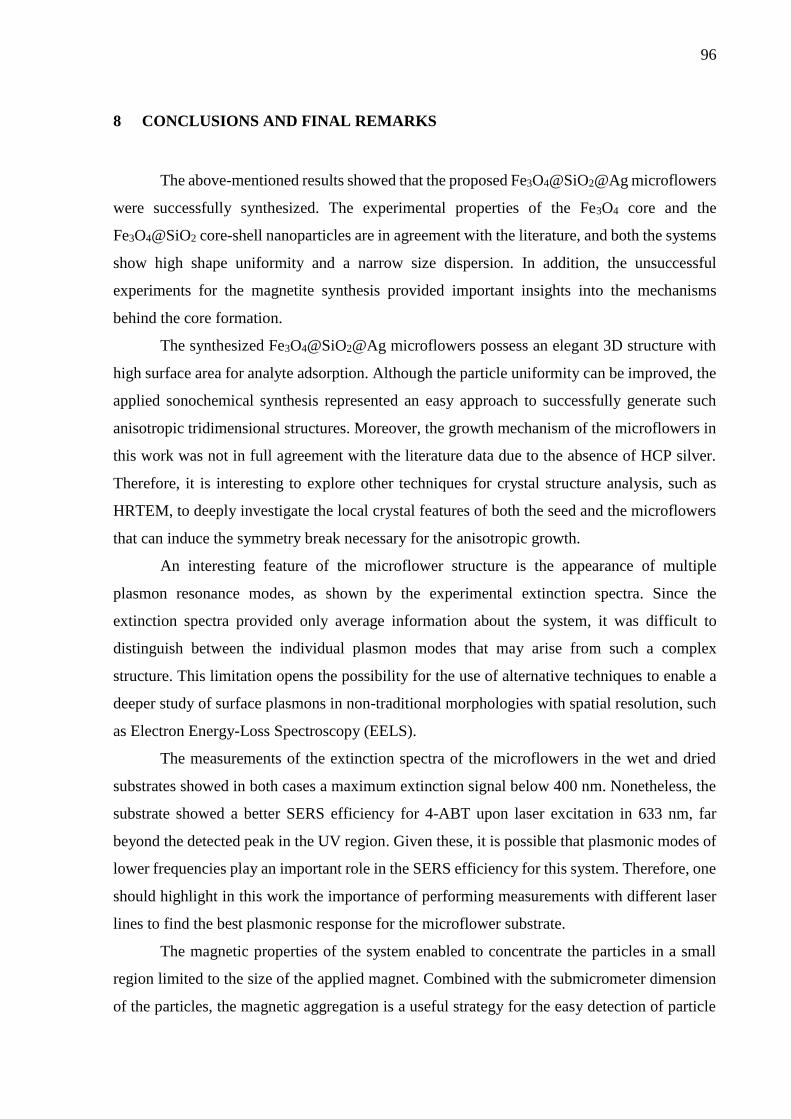
8 Conclusions and final remarks .......................................................................................... 96
9 References ......................................................................................................................... 98
Appendix A ............................................................................................................................ 106
Appendix B ............................................................................................................................. 112
Page 24
24
1 INTRODUCTION
Since the discovery of the Raman Effect, the phenomenon has been extensively explored
as a powerful source to deliver compositional and structural information about the material
under study. The effect was named after its discoverer, the Indian physicist Chandrasekara
Venkataraman in 1928. The so-called Raman spectroscopy is a technique based on the inelastic
scattering of light associated with molecular modes of vibration. For that purpose, the sample
is irradiated with a beam of monochromatic light and the spectral shift of the scattered radiation
is analyzed to infer the nature of the material.
The Raman spectra provide the spectroscopic fingerprint of the substance, leading to
much more accurate results when compared to other characterization techniques, such as
fluorescence spectroscopy. It is a non-destructive method that demands minimum sample
handling and preparation. A wide range of organic and inorganic samples in either liquid, solid,
polymeric or vapor states can be easily and directly analyzed by Raman spectroscopy.
Moreover, advances in Raman instrumentation, especially with the discovery of laser sources
in the 1960s, have increased the range of applications of Raman spectroscopy1. Nowadays,
Raman spectroscopy has been used in diverse fields such as biomedicine2,3, material sciences4,
archaeology5, art conservation6 etc.
Despite the many advantages, Raman spectroscopy still faces some intrinsic limitations.
Because Raman scattering is a low-probability event, the generated Raman signal is usually
very weak. The low sensitivity is then one of the main issues in Raman spectroscopy, especially
when it comes to highly diluted samples in solution. That obstacle hinders the large-scale
application of Raman spectroscopy as a routine analytical technique7. For that reason, it is clear
the need to find efficient methods to improve the detection efficiency of Raman spectroscopy.
In the past few decades, several approaches have emerged to enhance the Raman
response of substances. A common strategy involves interacting molecular species with metal
nanoparticles or roughened metal surfaces. For the signal enhancement to occur, the molecules
must be either directly adsorbed on the metal surface or separated by only a few-nanometer
gap. Upon light excitation e.g. from the Raman laser source, the conduction electrons from the
metal surface oscillate in a concerted fashion, a phenomenon known as plasmon resonance.
This creates a strong light amplification near the metal surface, which further increases the
Raman scattering of the molecules located nearby. A contribution of chemical nature also plays
Page 25
25
a role in Raman signal enhancement, but to a much lesser extend when compared to the
electromagnetic effect. This principle of Raman data collection gave rise to the technique
known today as surface-enhanced Raman spectroscopy (SERS)8.
SERS has become a central research field in Raman spectroscopy, and one of the main
publication themes in the last few years9. The technique has been applied for a wide range of
studies of both fundamental and applied nature. Most fundamental research in the field is
devoted to SERS studies on single-molecule regime. Other research questions involve the use
of the technique to achieve sub-nanometer resolution and in femtosecond processes to elucidate
chemical reactivity.10 Applied research has been focused on making SERS a powerful and
reliable technique for routine analysis. Therefore, a lot of effort has been made to produce low-
cost, efficient and reproducible SERS substrates. SERS has been explored for a wide range of
applications such as electrochemistry11, and environmental analysis12. The technique gained
attention because of the promising results in the field of biosensing, being explored as a
potential diagnosis tool of several diseases, such as cancer13, Alzheimer’s disease14 and
Parkinson’s disease.15,16 The present work is then intended to contribute from an applied
perspective to SERS focused on the biosensing capability of the technique. Herein, we propose
to apply SERS for the detection of the biomarker cardiac troponin I. The tracking of this
biomolecule can lead to much more accurate results on the early diagnosis of cardiovascular
diseases than the available traditional techniques.
Page 26
26
2 PRINCIPLES OF RAMAN AND SURFACE-ENHANCED RAMAN
SPECTROSCOPY
2.1 The discovery of the Raman effect
Almost a century ago, the Indian physicist Chandrasekara Venkata Raman, or C.V.
Raman, made a discovery that would greatly impact the physical and chemical sciences. Raman
(1888-1970) was a very curious collector of minerals and a well-known scientist of the time
due to his work in optics and acoustics. In 1921 after spending a few days in England discussing
his work with other prominent scientists of that time, C.V. Raman started a two-week ship trip
back to his home country. Once aboard the SS Narkunda, Raman was amazed by the marvelous
of the deep blue sea. He then came up with a simple but intriguing question: why is the sea
blue? At the time, the accepted explanation was the one proposed by Lord Rayleigh, who stated
that the blue color of the sea was caused by the reflection of the color of the sky. Raman,
however, was not convinced by that explanation17.
After deep thinking about the subject, Raman could later prove that the blue color of the
sea was caused by the scattering of light by water molecules, similarly as the theory proposed
by Lord Rayleigh. Later then, Raman started to deeply investigate the light scattering
phenomenon by transparent media, mostly by liquids17. An interesting result of Raman’s
experiments was that the color of light scattered by different liquid samples did not correspond
exactly to the color of the incident light. The effect was explained at the time as being resultant
of a “trace of fluorescence” due to impurities. However, Raman was convinced that this new
phenomenon was totally different from fluorescence. Inspired by the work of Prof. Arthur
Compton on X-ray scattering, Raman thought that this effect could be an optical analog of the
recently discovered Compton Effect18.
Raman and his co-worker Kariamanickam Srinivasa Krishnan conducted then a careful
re-examination of the samples. The depiction of Raman and Krishnan`s experiment is given in
Figure 1. Since the phenomenon under investigation was weak in intensity, a powerful light
source was required. A 7-inch telescope was used in combination with a short-focus lens to
provide a strong and narrow light beam from the sun, which was passed through a blue-violet
filter. The filtered radiation was passed through the vacuum distilled liquid sample confined in
an evacuated bulb19. Raman noticed that most of the light scattered from the sample showed
the same violet color of the incident beam. This was a phenomenon already known as Rayleigh
scattering. However, a very small fraction of scattered light exhibited a different color. By
Page 27
27
placing a second yellow-green filter between the bulb with the sample and the observer, the
scattered light could be isolated and properly analyzed. In 1924, Raman and Krishnan analyzed
over 60 liquids of different compositions and noticed that this weak effect was common to all
samples even after careful purification processes. This enabled them to generalize that this
phenomenon was present in all types of matter17–19. Raman was able to distinguish this
phenomenon from fluorescence since the scattered radiation was strongly polarized.
Figure 1: Representation of Raman and Krishnan’s experiment to investigate the light scattering of liquid samples.
In the very famous paper “A new type of secondary radiation”19, Raman and Krishnan
announced their striking finding, which was later called the Raman effect. Two years later,
Raman was awarded the Nobel Prize for his discovery. It should be stressed, however, that the
inelastic scattering of light was theoretically predicted by the Austrian physicist Adolf Smekal
in 1923 20, and sometimes the phenomenon is referred to as the Smekal-Raman effect.
Moreover, the Russian physicists Grigory Landsberg and Leonid Mandelstam independently
discovered the Raman Effect in solid quartz also in 192821. Nevertheless, since Raman
published the results first, he was the only one credited for the discovery.
Page 28
28
2.2 Fundamentals of Raman scattering
When light interacts with a medium, it can be reflected, propagated or transmitted
throughout the material without any interaction. The fraction of propagated light can undergo
either refraction, absorption or scattering. The prevalence of one phenomenon over another will
depend upon the nature of both the incident light (wavelength, polarization, angle of incidence
etc.) and the material itself (chemical composition, internal structure, dimension, among
others)22.
From the chemical point of view, absorption and scattering are the most relevant
processes for the characterization of molecular species. When a molecule interacts with light
and absorbs a photon, the energy from the photon is transferred and the molecule is promoted
to a higher energy state. The energy of the incident photon must then necessarily match the
energy difference between the ground state and an excited state of the molecule for the
absorption to occur.
On the other hand, scattering is independent upon the energy of the incident light.
Briefly, scattering is a light attenuation process in which the direction of light propagation
changes after interacting with a particle. For a better understanding of the scattering
phenomenon, one must recall the idea of light as an oscillating electric dipole that propagates
over the time. The magnetic contribution can be set aside for this purpose. The interaction
between the electric dipole of light and the molecule causes a distortion of the electron cloud.
Since the size of the molecule is negligible when compared to the wavelength of light, the
electron cloud is highly polarized through this interaction. As a result, a complex high energy
state between the photon and the electron cloud is formed, which is sometimes referred to as
“virtual state”. The virtual state is very unstable and decays immediately by emitting a photon
in the form of scattered radiation. In most cases, the energy decay occurs without disturbing the
atomic nuclei, and the scattered radiation has the same energy of the incident photon. This
phenomenon, also termed Rayleigh scattering, is an elastic process since there is no energy
difference between the incident and the scattered light.
Nonetheless, an inelastic scattering can occur in which energy is transferred to the
molecule thereby inducing a vibrational transition, which describes the Raman scattering. This
promotes a considerable energy shift due to the movement of the nuclei, which are much heavier
when compared to the electrons. If the molecule is initially on the ground energy state, the
energy transfer will lead to the scattering of lower energy radiation, and the process is called
Stokes Raman scattering. Conversely, a higher energy light will be scattered if the initial state
Page 29
29
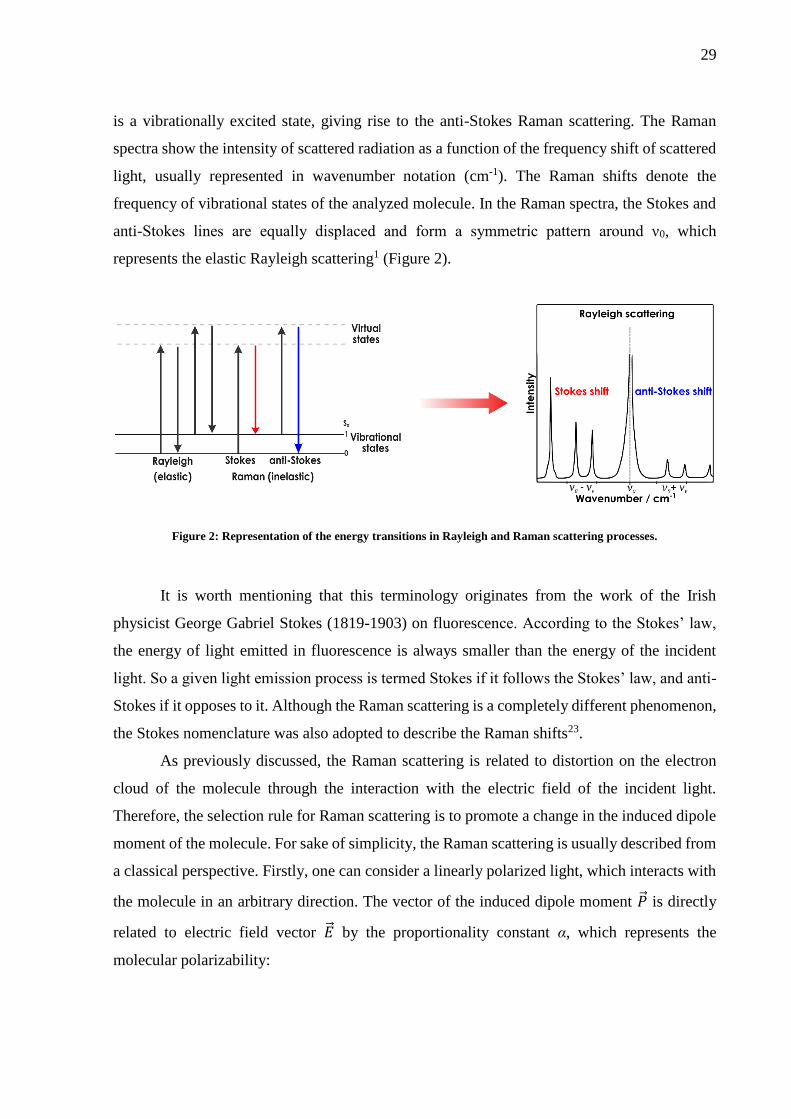
is a vibrationally excited state, giving rise to the anti-Stokes Raman scattering. The Raman
spectra show the intensity of scattered radiation as a function of the frequency shift of scattered
light, usually represented in wavenumber notation (cm-1). The Raman shifts denote the
frequency of vibrational states of the analyzed molecule. In the Raman spectra, the Stokes and
anti-Stokes lines are equally displaced and form a symmetric pattern around ν0, which
represents the elastic Rayleigh scattering1 (Figure 2).
Figure 2: Representation of the energy transitions in Rayleigh and Raman scattering processes.
It is worth mentioning that this terminology originates from the work of the Irish
physicist George Gabriel Stokes (1819-1903) on fluorescence. According to the Stokes’ law,
the energy of light emitted in fluorescence is always smaller than the energy of the incident
light. So a given light emission process is termed Stokes if it follows the Stokes’ law, and anti-
Stokes if it opposes to it. Although the Raman scattering is a completely different phenomenon,
the Stokes nomenclature was also adopted to describe the Raman shifts23.
As previously discussed, the Raman scattering is related to distortion on the electron
cloud of the molecule through the interaction with the electric field of the incident light.
Therefore, the selection rule for Raman scattering is to promote a change in the induced dipole
moment of the molecule. For sake of simplicity, the Raman scattering is usually described from
a classical perspective. Firstly, one can consider a linearly polarized light, which interacts with
the molecule in an arbitrary direction. The vector of the induced dipole moment �⃗� is directly
related to electric field vector �⃗� by the proportionality constant α, which represents the
molecular polarizability:
Page 30
30
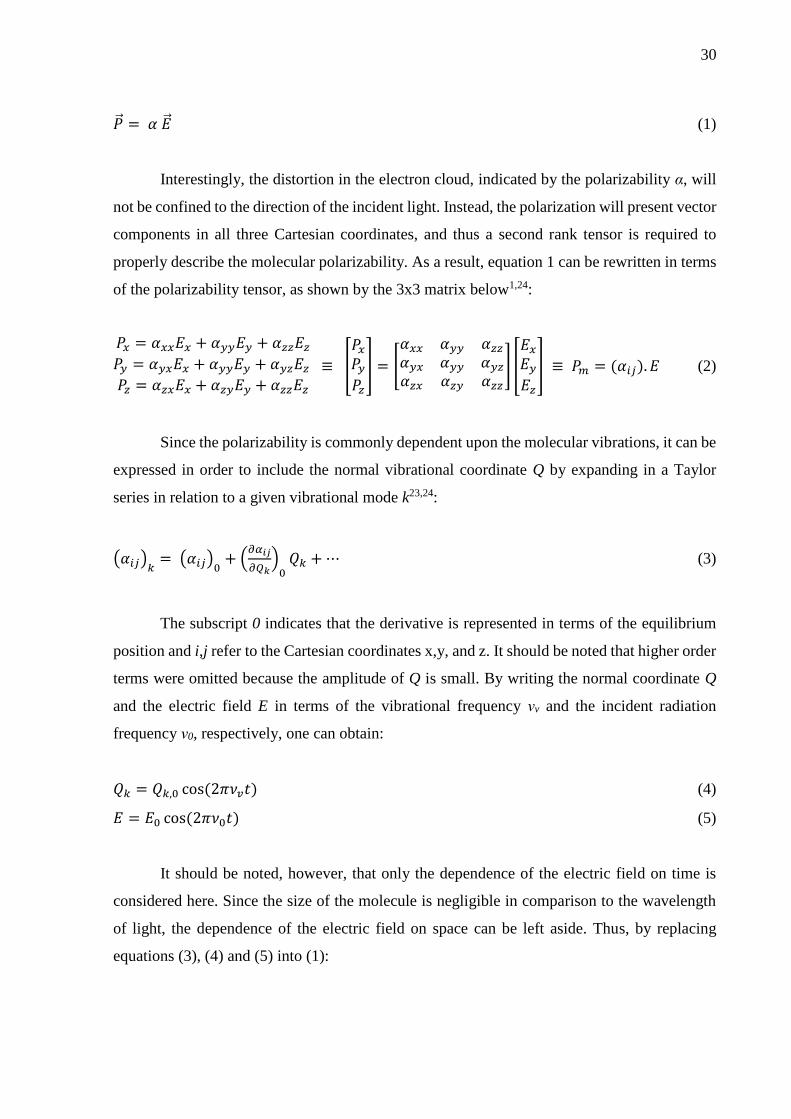
�⃗� = 𝛼 �⃗� (1)
Interestingly, the distortion in the electron cloud, indicated by the polarizability α, will
not be confined to the direction of the incident light. Instead, the polarization will present vector
components in all three Cartesian coordinates, and thus a second rank tensor is required to
properly describe the molecular polarizability. As a result, equation 1 can be rewritten in terms
of the polarizability tensor, as shown by the 3x3 matrix below1,24:
𝑃𝑥 = 𝛼𝑥𝑥𝐸𝑥 + 𝛼𝑦𝑦𝐸𝑦 + 𝛼𝑧𝑧𝐸𝑧𝑃𝑦 = 𝛼𝑦𝑥𝐸𝑥 + 𝛼𝑦𝑦𝐸𝑦 + 𝛼𝑦𝑧𝐸𝑧
𝑃𝑧 = 𝛼𝑧𝑥𝐸𝑥 + 𝛼𝑧𝑦𝐸𝑦 + 𝛼𝑧𝑧𝐸𝑧
≡ [
𝑃𝑥𝑃𝑦𝑃𝑧
] = [
𝛼𝑥𝑥 𝛼𝑦𝑦 𝛼𝑧𝑧𝛼𝑦𝑥 𝛼𝑦𝑦 𝛼𝑦𝑧𝛼𝑧𝑥 𝛼𝑧𝑦 𝛼𝑧𝑧
] [
𝐸𝑥𝐸𝑦𝐸𝑧
] ≡ 𝑃𝑚 = (𝛼𝑖𝑗). 𝐸 (2)
Since the polarizability is commonly dependent upon the molecular vibrations, it can be
expressed in order to include the normal vibrational coordinate Q by expanding in a Taylor
series in relation to a given vibrational mode k23,24:
(𝛼𝑖𝑗)𝑘 = (𝛼𝑖𝑗)0 + (𝜕𝛼𝑖𝑗
𝜕𝑄𝑘)0𝑄𝑘 +⋯ (3)
The subscript 0 indicates that the derivative is represented in terms of the equilibrium
position and i,j refer to the Cartesian coordinates x,y, and z. It should be noted that higher order
terms were omitted because the amplitude of Q is small. By writing the normal coordinate Q
and the electric field E in terms of the vibrational frequency νv and the incident radiation
frequency ν0, respectively, one can obtain:
𝑄𝑘 = 𝑄𝑘,0 cos(2𝜋𝜈𝑣𝑡) (4)
𝐸 = 𝐸0 cos(2𝜋𝜈0𝑡) (5)
It should be noted, however, that only the dependence of the electric field on time is
considered here. Since the size of the molecule is negligible in comparison to the wavelength
of light, the dependence of the electric field on space can be left aside. Thus, by replacing
equations (3), (4) and (5) into (1):
Page 31
31
𝑃 = 𝛼0𝐸0 cos(2𝜋𝜈0𝑡) + (𝜕𝛼
𝜕𝑄𝑘)0𝑄𝑘,0𝐸0 cos(2𝜋𝜈𝑣𝑡) cos(2𝜋𝜈0𝑡) (6)
At this moment, one must recall the trigonometric identity cos(𝑥) cos(𝑦) =1
2[cos(𝑥 − 𝑦) +
cos(𝑥 + 𝑦)], so that equation 6 is rewritten as:
𝑃 = 𝛼0𝐸0 cos(2𝜋𝜈0𝑡) +1
2(𝜕𝛼
𝜕𝑄𝑘)0𝑄𝑘,0𝐸0{cos[2𝜋(𝜈0 + 𝜈𝑣)𝑡] + cos[2𝜋(𝜈0 − 𝜈𝑣)𝑡]} (7)
To sum up, by adding the polarizability dependence on the vibrational motion as
expressed in equation 3, the Raman effect can be mathematically described in equation 7. The
first term in equation 7, 𝛼0𝐸0 cos(2𝜋𝜈0𝑡), relates to the previously mentioned Rayleigh scattering.
The second and third terms, in which the scattering frequencies differ by ν0 + νv and ν0 - νv,
denote the anti-Stokes and Stokes shifts, respectively. For the Raman effect to take place, then
(𝜕𝛼 𝜕𝑄𝑘⁄ )
0
must be nonzero. In other words, a change in polarizability with the normal mode of
vibration is needed to cause the Raman scattering. Otherwise, only the Rayleigh scattering
should be expected. Since now the polarizability is described in terms of the normal coordinates
of vibration, the derivative (𝜕𝛼 𝜕𝑄𝑘⁄ )0is related a new tensor, which can be referred to as the
Raman polarizability tensor. More precisely, the Raman polarizability tensor comprises the
whole term 1 2⁄ (𝜕𝛼 𝜕𝑄𝑘⁄ )
0𝑄𝑘,0
23,24. The intensity of Raman scattering is directly proportional to
the square of the polarizability tensor and to the fourth power of the frequency of the scattered
light ν, as given by equation 8:
𝐼𝑘 = (16𝜋2
9𝑐4) 𝐼0𝜈
4∑ ∑ |(𝛼𝑖𝑗)𝑘|2
𝑗𝑖 (8)
The above equation also indicates that the Raman scattering is dependent upon the
intensity of the incident light, I0.24 Alternatively, the intensity of Raman scattering can be
expressed in terms of a proportionality constant σR, which indicates the Raman cross-section:
𝐼𝑘 = 𝜎𝑅𝐼0 (9)
The cross-section, with dimensions of cm2, represents a measurement of the efficiency
of a given optical process. It indicates the area of a homogeneous light beam in which all the
Page 32
32
photons are involved in the optical phenomenon. For instance, the cross-section for infrared
absorption is in the magnitude of 10-21. In contrast, the normal Raman scattering cross-section
is only 10-29 cm2, reflecting low probability of the event.25
At normal conditions, the majority of molecules in a substance will be present in the
ground vibrational state following a Boltzmann distribution. However, due to thermal motion,
some molecules may be excited to a higher energy level. Therefore, because of the smaller
population of species in the excited state at room temperature, the intensity of anti-Stokes
Raman scattering is considerably lower than the Stokes Raman scattering (recall Figure 2).
Thus usually, only the Stokes shifts are considered for molecular characterization in traditional
Raman spectroscopy. Nevertheless, with increasing temperature the probability of anti-Stokes
Raman scattering also increases, as shown by equation 10 below:
𝐼𝐴
𝐼𝑆= (
𝜈0+ 𝜈𝑣
𝜈0− 𝜈𝑣)4
𝑒𝑥𝑝 (−𝑒𝑣
𝑘𝑇) (10)
Here, ev represents the energy of the excited vibrational state of the molecule, k the
Boltzmann constant (should not be confused with the k vibrational mode introduced earlier),
and T the temperature in Kelvin.24
The discussions made so far have assumed that the energy of the incident light is far
below the energy of any possible electronic transitions of the molecule. However, if the
excitation wavelength possesses a value close enough to induce a transition between two
electronic states of the molecule, then the resonance Raman scattering (RRS) takes place. As a
result, the resonance condition affects directly the polarizability tensor of the molecule,
changing its Raman cross-section. In contrast to traditional Raman spectroscopy, the cross-
section for RRS is in the order of 10-24 cm2, which represents a significant increase.
Consequently, some vibrational modes are strongly intensified in the Raman spectrum of the
analyzed compound in comparison to non-resonance conditions.24,25 Thus, Resonance Raman
spectroscopy is explored as an effective tool for the analysis of chromophore substances with
good Raman signal enhancement. However, most analytes do not exhibit electronic transitions
favorable to RRS so that other strategies for Raman signal enhancement are required.
Page 33
33
3 SURFACE-ENHANCED RAMAN SCATTERING (SERS)
3.1 History of SERS
In the early 1970s, the study of molecular monolayers on solid surfaces was a promising
research topic. In this context, the interest in characterization techniques to investigate
molecules on a single monolayer level was dramatically raising. For instance, surface-enhanced
infrared spectroscopy was showing a rapid development at the time to meet this demand26. In
1974, Fleischmann and co-workers reported a significant increase in the Raman signal of
pyridine adsorbed on a roughened silver electrode. At the time, it was believed that such an
enhancement effect was due to the larger surface area provided by the roughened electrode,
which led to an increase in the number of adsorbed molecules27.
However, the work of Fleischmann et al left some important unanswered questions.
Firstly, an increase in the electrode capacitance should have been observed as a result of the
monolayer coverage, which was not the case. Secondly, the surface area argument was not able
to explain the high values of Raman intensity of adsorbed pyridine (~ 500-1000 counts s-1).
Moreover, if the enhancement effect were resultant of an increased surface area, then the
intensity of the Raman signal should be directly proportional to the surface roughness.
Interestingly, in an attempt to reproduce the results of Fleischmann’s experiments, Jeanmaire
and Van Duyne actually observed the opposite effect: when starting with the same roughness
conditions employed by Fleischmann, they observed that the Raman signal of adsorbed pyridine
actually decreased with increasing surface roughness. Jeanmaire and Van Duyne also
developed a method to quantify the enhancement effect and discovered that the Raman signal
of pyridine was enhanced by five to six orders of magnitude when compared to free pyridine in
solution28. Simultaneously in 1977, Albrecht and Creighton independently reached the same
conclusions, which reinforced that the surface area hypothesis could not explain the effect29. A
year later in 1979, Van Duyne named the effect surface-enhanced Raman scattering (SERS)30.
Jeanmaire and Van Duyne suggested that the enhancement effect was due an increase
in the electromagnetic field near the roughened metal surface. Meanwhile, Albrecht and
Creighton associated the effect to the formation of a charge-transfer complex between the metal
and the adsorbed molecule. Considering the ideas of Jeanmaire and Van Duyne, Moskovits was
the first to explain in 1978 the SERS enhancement in terms of coupling to a resonant oscillation
of the conduction electrons of the metal. He argued that small bumps present on roughened
metal surfaces could be interpreted as forming a two-dimensional colloid of small metal
Page 34
34
spheres, which could support such kind of oscillation known as surface plasmons. Moskovits
also predicted that the same behavior should be expected for silver and copper colloids covered
with adsorbate and immersed in a dielectric medium31. Creighton and co-workers confirmed
the validity of Moskovits’ prediction while working with silver and gold colloids in 1979 32.
Nowadays, the two hypotheses of Jeanmaire and Van Duyne and of Albrecht and
Creighton are known as electromagnetic (EM) and chemical enhancement (CE) mechanisms of
SERS, respectively.26 Such theories are still subject of intense debate in the scientific
community and are discussed in more details in the following subsection.
3.2 Enhancement mechanisms
Since the discovery of SERS decades ago, two different mechanisms have been
proposed to elucidate the underlying principles of the enhancement effect. It is well accepted
that both the electromagnetic and chemical contributions are complementary to each other
regarding the signal intensification. Yet so far is still not possible from the experimental point
of view to make a clear distinction between the two individual contributions.33
3.2.1 Chemical mechanism
Briefly, any chemical interaction that could transform the Raman polarizability tensor
is regarded as a chemical enhancement (CE). As a result, it is possible to observe not only the
enhancement but also de suppression of some vibrational modes8. The CE mechanism can occur
in different conditions, namely: ω
a) Enhancement resulting from a pure adsorption effect, where only ground state chemical
interactions between molecule and metal are present. In this case, the metal causes a
perturbation on the electronic structure of the molecule, inducing a change in molecular
polarizability. No photon excitation of the nanoparticle-molecule system occurs;
b) Resonance Raman enhancement, in which a surface molecule-metal complex is formed
either by direct covalent binding or indirect ion-assisted binding (commonly by chloride
ions). This induces a significant change in molecular polarizability due to the overlap of
molecular orbitals. The possibility of new electronic states is increased, which can be
eventually in resonance with the excitation laser;
Page 35
35
c) Charge-transfer (CT) resonance Raman enhancement, in which the energy of the incident
photon drives a charge transfer between the molecule and the metal. This charge-transfer
process can be either between the HOMO* of the molecule and unoccupied states above
the Fermi level (EF) of the metal or between occupied states slightly below the EF and the
LUMO† of the molecule. For the CT mechanism to occur, the excitation energy must
match the energy difference between the EF and the HOMO/LUMO of the molecule,
which can vary by applying an external potential.8,33
Figure 3: Representation of the chemical enhancement mechanisms of SERS.
Figure 3 above depicts the processes involved in the chemical enhancement mechanism
of SERS. In contrast to the EM mechanism, the CE mechanism is still somewhat obscure due
to difficulties to properly describe the role of size, shape and surface roughness of SERS
substrates both theoretically and experimentally. An accurate determination of the CE
magnitude must encompass a precise description of the role of surface orientation and molecule
concentration in the spectral intensities, as well as how the surface immobilization affects the
Raman cross section of the adsorbate. Such questions challenge the current technologies for
surface analysis. Therefore, a full description behind the enhancement mechanism of SERS is
still lacking.34
* HOMO stands for highest occupied molecular orbital. † LUMO stands for lowest unnocupied molecular orbital.
Page 36
36
3.2.2 Electromagnetic mechanism
The electromagnetic enhancement mechanism (EM) is better understood and considered
the main responsible for SERS. It arises from local electric field enhancement provided by the
light-induced excitation of surface plasmons of the metal nanoparticle. A plasmon is often
defined as a quantum of plasma oscillation, as indicated by the suffix -on.35 Briefly speaking, a
plasma is a macroscopically neutral substance containing interacting free charged particles such
as electrons and ionized atoms or molecules. An interesting feature of a plasma is the occurrence
of collective effects due to the long-range coulomb forces.36 In metals, the free electron gas is
treated as a solid-state plasma. The term plasmon was introduced by David Pines (1924-2018)
in 1956 in his review article about the collective nature of energy losses in solids.37 Despite the
quantum mechanical definition, the phenomenon of plasmons can be accurately treated by
classical physics.35
To offer a simple explanation of surface plasmons, one should first assume a spherical
metal nanoparticle with dimensions much smaller than the wavelength of the incident light (d
<< λ). By doing so, the electrostatic approximation to the EM problem can be applied, and only
the dipolar contribution to the surface plasmon is considered. This approach, known as
electrostatic or quasistatic approximation, greatly simplifies the theoretical calculations to
model the optical behavior of nanoparticles.8 In this sense, the theory proposed by the German
physicist Gustav Mie (1869-1957) offers a solution to the Maxwell’s equations, and describes
the light extinction processes (i.e. absorption and scattering) by spherical particles.38 As a result,
the electromagnetic modes and hence the surface plasmon modes of a spherical nanoparticle
can be studied.
Upon the previous condition (d << λ), when light strikes a metallic nanoparticle, the
oscillating electric field of light interacts with the conduction electrons of the metal. The
electron cloud is disturbed and shifted with respect to the positive ionic core. Due to this charge
displacement, a dipole is formed and a coulombic force arises in order to restore the equilibrium
position of the electron cloud. Consequently, the dipole oscillates coherently with respect to the
incident light (Figure 4). Those collective electron oscillations occur at the metal surface and
are called surface plasmons. Because of the confinement provided by the nanoscale
environment, such surface plasmons are termed localized surface plasmons (LSP)35,39.
Page 37
37
Figure 4: Plasmon oscillation on a metallic sphere with respect to the electric field of the incident light. Consequently,
the conduction electron density (purple) is displaced relative to the nuclei.
The main consequence of LSP is that the electric fields near the particle surface are
strongly enhanced. This enhancement is maximum at the nanoparticle surface and decays
rapidly with increasing distance.35 Therefore from the excitation of LSP, light is not only
amplified but also strongly confined on the nanoparticle surface, especially in gaps, crevices or
sharp regions of metal nanoparticles.40 Due to the strong EM effect resultant of the coupling of
plasmonic modes, such regions are termed are hot spots. This configuration enables to strongly
concentrate and amplify the incident electromagnetic field between and around the
nanostructures (Figure 5).41
As previously shown (recall equation 8, section 2.2), the Raman scattering is directly
proportional to the intensity of the incident electromagnetic field. Therefore, the huge light
exposure experienced by the adsorbed molecule due to the amplified electric field also increases
the magnitude of its Raman activity. One should not expect, however, the normal Raman and
SERS spectra of a molecule to be the same due to the different selection rules in the two cases.
So, as more in resonance the incident light is with the LSP of the nanoparticle, the greater the
extent of electromagnetic enhancement to SERS. Such a condition is often referred to as
localized surface plasmon resonance (LSPR).42
Page 38
38
Figure 5: Representation of hot spot formation upon the light excitation of two interacting metal nanoparticles (gold
spheres), and the different responses of the adsorbed analyte (purple) under normal Raman, SERS and hot spot
conditions.
In 1997, the groups of Nie43 and Kneipp44 simultaneously reported single-molecule
detection by SERS. With this achievement, SERS became the first spectroscopy technique to
obtain such an ultralow detection limit. By employing scanning probe microscopy, Brus and
co-workers45 showed in 1999 that single molecule SERS (SM-SERS) is generated when the
target molecule interacts with hot spots of the metal nanoparticle. Therefore, a great number of
publications in SERS is concerned with the development of plasmonic substrates to maximize
the formation of hot spots. For that, it is of central importance to know what properties govern
the plasmonic nature of metal nanoparticles.
3.2.2.1 The properties of metals
Coinable metals such as silver (Ag), gold (Au) and copper (Cu) are the most suitable for
SERS due to their optical properties, which dictates their plasmonic responses. The optical
properties of a metal nanoparticle can be related to the optical properties of the bulk material,
given by the wavelength-dependent dielectric function:
𝜀(𝜔) = 𝜀1(𝜔) + 𝑖𝜀2(𝜔) (11)
Where ε1(ω) and ε2(ω) are the real and imaginary part, respectively, of the dielectric
function ε(ω). For sake of simplicity, the angular frequency ω is used instead of the ordinary
Page 39
39
frequency ν.‡ As a consequence of the electrostatic approximation, the electric field outside the
particle Eout can be obtained by solving the LaPlace’s equation for the electrostatic potential at
a given distance r, as shown in the equation below:
�⃗� 𝑜𝑢𝑡(𝑟) = |�⃗� 0|�̂� − 𝛼|�⃗� 0| [�̂�
𝑟3−3𝑥
𝑟5(𝑥�̂� + 𝑦�̂� + 𝑧�̂�)] (12)
Since in this case the nanoparticle dimension is much smaller than the wavelength of
light, the electric field of the incident light E0 is considered constant. Here, E0 is assumed to be
in the x-direction, so that it is represented together with the unit vector �̂� to describe the applied
field. The term αE0 on the right-hand side of equation 11, in which α is the polarizability of the
sphere, represents the induced dipole moment resultant of the polarization of the conduction
electron density. In other words, αE0 describes the induced dipole field. From the solution of
the LaPlace equation, the polarizability α is:39
𝛼 = 𝜀(𝜔)−𝜀0
𝜀(𝜔)+2𝜀0𝑎3 (13)
Where ε0 represents the dielectric constant of the medium, and a denotes the sphere
radius. By adding equations 10, 12 in 11, the equation of the electric field outside the sphere
assumes the form:
�⃗� 𝑜𝑢𝑡(𝑟) = |�⃗� 0|�̂� − |�⃗� 0| (𝜀1(𝜔)+𝑖𝜀2(𝜔)−𝜀0
𝜀1(𝜔)+𝑖𝜀2(𝜔)+2𝜀0) 𝑎3 [
�̂�
𝑟3−3𝑥
𝑟5(𝑥�̂� + 𝑦�̂� + 𝑧�̂�)] (14)
The maximum field enhancement is achieved when ε1(ω) = -2ε0, considering that the
imaginary component is small. This represents the resonance condition for LSP, also termed
Fröhlich condition, from which the LSP frequency ωLSP of the dipole mode can be obtained. In
other words, equation 13 indicates that the resonance condition for LSP is dictated by the
dielectric properties of both the metal and the surrounding.46 Figure 6 shows the plots of the
real and imaginary dielectric functions for several metals.
‡ ω is related to ν by: ω = 2πν.
Page 40
40
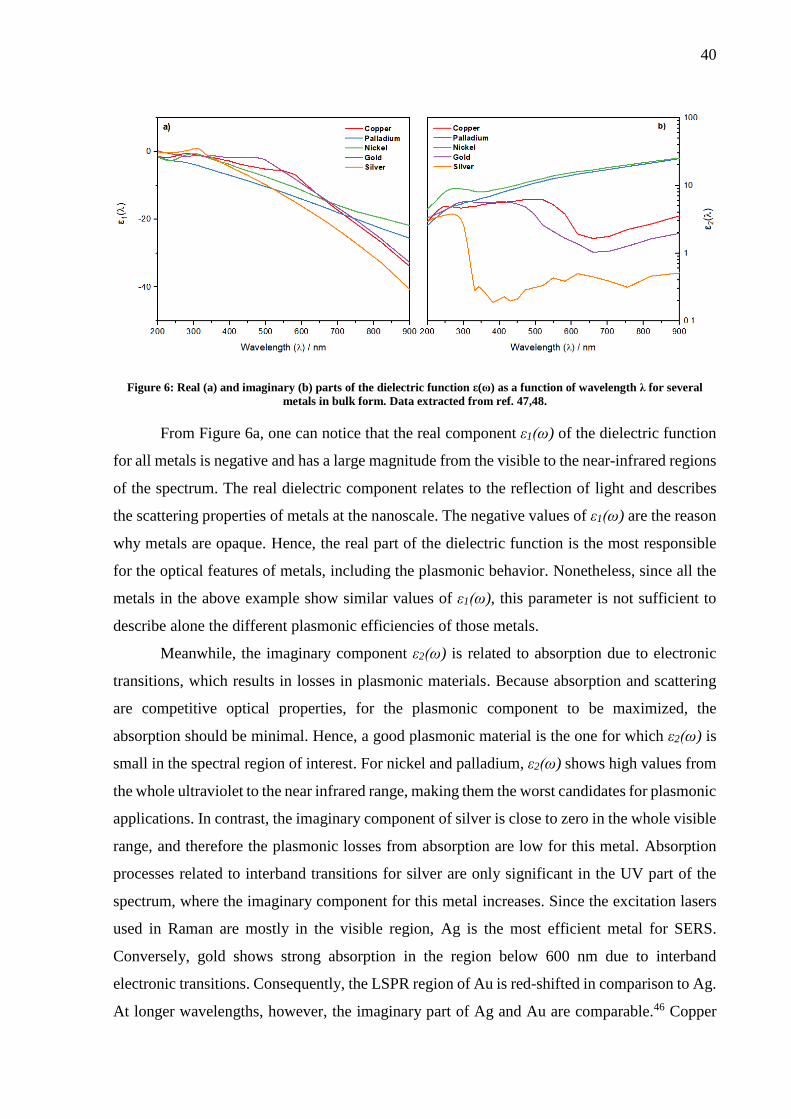
Figure 6: Real (a) and imaginary (b) parts of the dielectric function ε(ω) as a function of wavelength λ for several
metals in bulk form. Data extracted from ref. 47,48.
From Figure 6a, one can notice that the real component ε1(ω) of the dielectric function
for all metals is negative and has a large magnitude from the visible to the near-infrared regions
of the spectrum. The real dielectric component relates to the reflection of light and describes
the scattering properties of metals at the nanoscale. The negative values of ε1(ω) are the reason
why metals are opaque. Hence, the real part of the dielectric function is the most responsible
for the optical features of metals, including the plasmonic behavior. Nonetheless, since all the
metals in the above example show similar values of ε1(ω), this parameter is not sufficient to
describe alone the different plasmonic efficiencies of those metals.
Meanwhile, the imaginary component ε2(ω) is related to absorption due to electronic
transitions, which results in losses in plasmonic materials. Because absorption and scattering
are competitive optical properties, for the plasmonic component to be maximized, the
absorption should be minimal. Hence, a good plasmonic material is the one for which ε2(ω) is
small in the spectral region of interest. For nickel and palladium, ε2(ω) shows high values from
the whole ultraviolet to the near infrared range, making them the worst candidates for plasmonic
applications. In contrast, the imaginary component of silver is close to zero in the whole visible
range, and therefore the plasmonic losses from absorption are low for this metal. Absorption
processes related to interband transitions for silver are only significant in the UV part of the
spectrum, where the imaginary component for this metal increases. Since the excitation lasers
used in Raman are mostly in the visible region, Ag is the most efficient metal for SERS.
Conversely, gold shows strong absorption in the region below 600 nm due to interband
electronic transitions. Consequently, the LSPR region of Au is red-shifted in comparison to Ag.
At longer wavelengths, however, the imaginary part of Ag and Au are comparable.46 Copper
Page 41
41
shows a similar behavior to gold. Nonetheless, the low air stability of copper substrates upon
oxidation reduces the applicability of this metal. From the dielectric functions of gold and silver,
one can notice that the resonance condition introduced in equation 13 is easily fulfilled for those
metals. Thus, silver and gold are most applied metals for SERS.46
3.3 Plasmonic substrates for SERS
3.3.1 Effect of particle size and shape
In the previous section, the dependence of plasmon oscillation with the composition of
both the metal nanoparticle and the medium was discussed. Likewise, other parameters such as
the nanoparticle size and shape can greatly affect the charge distribution i.e. the polarization
modes within the particle, thereby altering the possible plasmonic modes that can arise upon
excitation.49
The theoretical discussion given so far was only valid for very small nanoparticles with
spherical shape. As a result, only the dipole plasmon oscillation was considered. This represents
the limit for which the electrostatic approximation holds. For larger systems, the size of the
particle gradually becomes comparable to the wavelength of light so that the electrostatic
approximation no longer applies.46
Considering a fixed particle geometry, the plasmon frequencies of nanoparticles are
shifted to longer wavelengths with increasing particle size. This is because the larger the
particle, the greater is the charge separation upon the plasmon excitation. As the charges are
further apart from each other, the resultant restoring force is smaller, which lowers the plasmon
oscillation frequency. In addition, as the particle size increases, the LSPR is strongly damped
due to the higher radiation losses. Thus, the resonance band typically appears broadened in the
extinction spectrum of the particle, as shown by the example in Figure 7.46 Besides from
spectral shifts of the LSPR band, additional modes of oscillation become possible as the particle
size increases. Consequently, higher order plasmon resonances e.g. quadrupole and octupole
arise. Similarly, multipole plasmon resonance can be driven by changes in the particle
geometry.39,50
Page 42
42
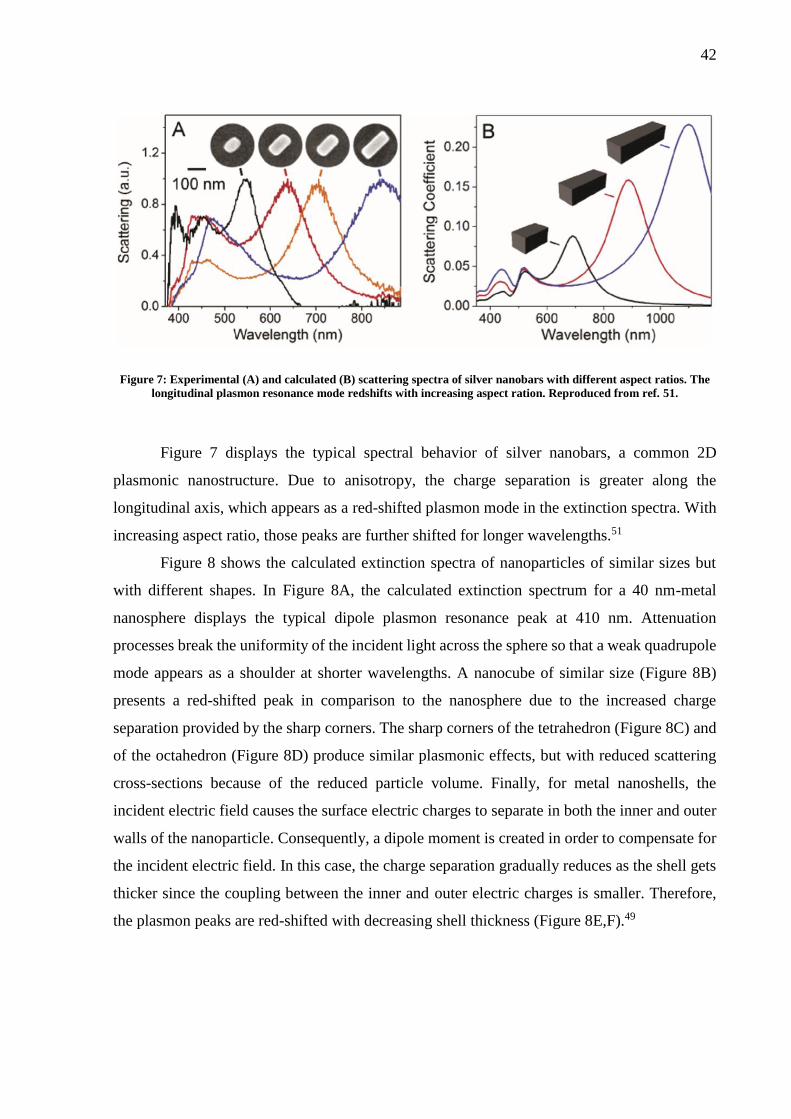
Figure 7: Experimental (A) and calculated (B) scattering spectra of silver nanobars with different aspect ratios. The
longitudinal plasmon resonance mode redshifts with increasing aspect ration. Reproduced from ref. 51.
Figure 7 displays the typical spectral behavior of silver nanobars, a common 2D
plasmonic nanostructure. Due to anisotropy, the charge separation is greater along the
longitudinal axis, which appears as a red-shifted plasmon mode in the extinction spectra. With
increasing aspect ratio, those peaks are further shifted for longer wavelengths.51
Figure 8 shows the calculated extinction spectra of nanoparticles of similar sizes but
with different shapes. In Figure 8A, the calculated extinction spectrum for a 40 nm-metal
nanosphere displays the typical dipole plasmon resonance peak at 410 nm. Attenuation
processes break the uniformity of the incident light across the sphere so that a weak quadrupole
mode appears as a shoulder at shorter wavelengths. A nanocube of similar size (Figure 8B)
presents a red-shifted peak in comparison to the nanosphere due to the increased charge
separation provided by the sharp corners. The sharp corners of the tetrahedron (Figure 8C) and
of the octahedron (Figure 8D) produce similar plasmonic effects, but with reduced scattering
cross-sections because of the reduced particle volume. Finally, for metal nanoshells, the
incident electric field causes the surface electric charges to separate in both the inner and outer
walls of the nanoparticle. Consequently, a dipole moment is created in order to compensate for
the incident electric field. In this case, the charge separation gradually reduces as the shell gets
thicker since the coupling between the inner and outer electric charges is smaller. Therefore,
the plasmon peaks are red-shifted with decreasing shell thickness (Figure 8E,F).49
Page 43
43
Figure 8: Calculated extinction (black), absorption (red) and scattering (blue) spectra of silver nanostructures of
different geometries. Multipole resonance peaks are visible for more complex particle geometries. Reproduced from
ref. 49.
The simulations of the optical properties of metal nanoparticles, such as those from
Figure 8, are based on the solutions of Maxwell’s equations for the system under study.
However, exact solutions to the Maxwell equations are only possible for a restrict number of
Page 44
44
geometries. For instance, the optical properties of spherical nanoparticles of arbitrary size can
be calculated by using the Mie theory. Another example is the Gans theory, which provides an
approximate solution for rod-shaped nanoparticles with dimensions much smaller than the
wavelength of light. For particles with arbitrary geometries, numerical methods are required
since analytical solutions are no longer possible. Among the commonly used numerical
methods are the discrete dipole approximation (DDA), finite difference time domain (FDTD),
and the finite element method.52 It should be mentioned, though, that the discussion on the
simulation methods is beyond the scope of this work.
3.3.2 Evolution of plasmonic substrates
A few years ago, Brolo et al53 published a review article summarizing the different
fabrication techniques of SERS substrates. The authors categorized the SERS substrates into
three main classes according to the production method, namely:
i) Colloidal metal nanoparticles, produced from wet chemical synthesis routes.
Because the nanoparticles result from the nucleation of smaller units, such as
atoms and molecules, this synthesis strategy is further classified as a “bottom-
up” approach;
ii) Nanostructures synthesized directly on solid supports, obtained by
nanolithography and template-assisted techniques. In contrast to the wet
chemical methods, bigger structures are reduced and tailored into nanoscale
systems so that those methods are labeled “top-down”;
iii) Metal nanoparticles (MNPs) immobilized on planar solid supports. In this case,
the nanoparticles are synthesized by wet chemistry approaches and immobilized
on solid substrates to increase the signal reproducibility. The most common way
of obtaining those substrates is by either chemical or electrostatic self-assembly
of the nanoparticles on the supports This can be achieved by functionalizing the
planar substrate with substances with high affinity with the nanoparticle e.g.
molecules and polymers. Other possible strategies are the transfer of pre-
assembled MNPs films to solid substrates, and chemical- or photochemical-
induced growth of the nanoparticles on the supports53.
Page 45
45
As a result of advances in synthesis methods, a plethora of metal nanoparticles with
different topologies have been reported in the literature, such as spheres54,55, rods56, wires57,
stars58, cubes59,60, triangles15, etc. In recent years, a new class of highly-branched flower-like or
star-like nanostructures has emerged, which are considered promising high-efficient substrates
for SERS. The multiple and sharp branches of those nanostructures can strongly concentrate
the electric charge, generating superior field enhancement around the tips. Moreover, the
plasmon hybridization between the core and the individual nanoparticle tips delivers additional
electric field enhancement. Here, the core acts as an antenna, inducing the field enhancement
of the plasmons at the tip.61 Those systems can not only induce the formation of a high number
of SERS hot spots due to the tip effect but also offer a large surface area for analyte adsorption.
For instance, a zeptomole single-molecule SERS detection was be achieved by applying such
structures.62,63
Another consequence of the advance in synthesis techniques is the possibility of
combining different materials to obtain multipurpose SERS substrates. Hybrid systems also
offer alternative ways of tuning the properties of metal nanoparticles, aside from the change in
nanoparticle size and shape. In this sense, core-shell nanoparticles constitute a common
configuration for such systems, which can be combined in several different ways, as
summarized in Figure 9.
Figure 9: The main classes of core-shell nanoparticles. Reproduced from ref. 64.
The main advantage of core-shell nanoparticles is the versatility provided by the new
components. As a consequence, new functionalities are incorporated to those systems,
expanding their range of applications. Since only the interaction with the nanoparticle surface
is important for most applications of metal nanosystems, core-shell nanoparticles are of great
Page 46
46
interest. The cost of fabrication for core-shell nanoparticles can be significantly lowered in
comparison to pure metal nanoparticles. This is because smaller quantities of noble-metal
precursors are required for the production of metal nanoshells, thereby decreasing the costs of
the synthesis.64
In this context, magnetic nanoparticles have been explored for separation and
bioseparation processes, as well as preconcentration of samples. By combining magnetic and
plasmonic nanoparticles, it is possible to obtain both plasmonic and magnetic properties in just
one system of easy manipulation under external magnetic fields.64 Recently, Wang and co-
workers65 reported the synthesis of sophisticated highly branched Fe3O4@SiO2@Ag flower-
like particles of sub-micrometer dimensions with good dispersity and reproducibility. The
microcomposite production involved only ultrasound-driven processess, which ensured the
particle dispersibility during the synthesis of each individual component (Figure 10).
Figure 10: a) Scheme of the synthesis steps for the production of the microflowers. b-d) Transmission electron
microscopy images of Fe3O4 (b), Fe3O4@SiO2 (c), Fe3O4@SiO2-Ag seeds (d), and Fe3O4@SiO2@Ag microflowers (e).
Reproduced from ref. 65.
The synthesis of the branched Fe3O4@SiO2@Ag structure involved a seed-mediated
route, in which small silver seeds were firstly deposited on the surface of core-shell
Fe3O4@SiO2 nanoparticles to induce the further nucleation of silver into the flower structure
(Figure 10). Those particles showed an excellent SERS response, with a detection limit of 10-
14 mol/L for rhodamine 6G (R6G) and 10-11 mol/L for the pesticide thiram. The
Page 47
47
microcomposites were also applied as aptasensors for the detection of S. aureus in tap water
with very good signal enhancement. For that reason, they can be seen as promising SERS
substrates for applications in chemical and biological analysis.65
Page 48
48
4 MOTIVATION FOR THE RESEARCH
Statistics from the World Health Organization show that Cardiovascular Diseases
(CVDs) are the leading death cause worldwide. In 2012, around 17.5 million people died from
CVDs, representing over 30% of all global deaths. Acute myocardial infarction (AMI) is one
of the most common CVDs, which together with stroke comprises approximately 80% of all
the deaths due to CVDs.66
Electrocardiogram (ECG) is still nowadays the main technique for AMI diagnosis.
Nonetheless, the technique often delivers unreliable results, due to its lack of sensitivity and the
subjective interpretation of the results67. Much more accurate results are obtained by the
monitoring of cardiac biomarkers, such as myoglobin and cardiac troponins, which are rapidly
released into the bloodstream when myocytes die. Among them, cardiac troponin I (cTnI) and
cardiac troponin T (cTnT) have shown much higher sensitivity and specificity toward AMI
compared to other biomarkers, being therefore considered “gold standard” in AMI detection67–
70. Both cTnI and cTnT can remain in the bloodstream for more than 10 days, reaching a peak
within 1-2 days after the cardiac injury. For instance, the cTnI concentration in healthy patients
is approximately 0.001 μg L-1, and increases to 100 μg L-1 in patients with AMI.67 Given the
high diagnostic potential of cTnI, the biomolecule was applied in this work as a SERS probe.
A variety of biosensors based on electrochemical methods and surface plasmon
resonance (SPR) has been developed for the detection of cTnI71 and cTnT72. Traditionally,
antibodies have been employed as biorecognition agents. However, aptamers have emerged as
a promising and more advantageous alternative to the antibodies68.
Also known as “chemical antibodies”, aptamers are synthetically isolated single-
stranded oligonucleotides, either DNA or RNA, which can fold into unique three-dimensional
shapes. This feature associated with the base pairing allows them to bind with high specificity
and affinity to a variety of targets, such as proteins, peptides, organic and inorganic compounds,
or even whole cells. Aptamers are chemically stable, smaller in size, and have a low cost of
production. While the antibodies preparation requires a living organism, the aptamers can be
selected by an in-vitro process called Systematic Evolution of Ligands by Exponential
Enrichment (SELEX).73,74 Alternatively, aptamers can be synthesized from a definite sequence
of nucleotide bases. Since the discovery of aptamers in 1990, their use has strongly increased,
playing a key role in biomedicine, biosensing and drug delivery.75–78
Page 49
49
Moreover, when the high specific aptamers are coupled with nanomaterials, thereby
creating aptamer-conjugated nanomaterials or aptasensors, it is possible to achieve a high signal
amplification, representing an enormous enhancement in molecular recognition77,78. In SERS,
aptasensors can be useful to promote an effective interaction between the MNP and the target
molecule. For instance, Wang and co-workers79 reported the creation of an AuNP/TBA-based
aptasensor§ in a sandwich array for the detection of α-thrombin in human blood serum by SERS.
The obtained results showed a very high selectivity of the aptasensor against α-thrombin
accompanied by a high sensitivity, with a detection limit of 0.5nmol/L.
Given the presented discussion, the creation of aptasensors can be an excellent approach
for a fast and accurate troponin I detection with high sensitivity by SERS. This could will lead
in the future to early and more reliable diagnosis of AMI. Yet, it should be stressed that the use
of aptasensors in SERS is still an emerging research field. A quick search on Thomson Reuters
ISI Web of Science database shows a small number of results for papers including both “SERS”
and “aptasensor” in the last 10 years, indicating that further research on the topic is needed.
Moreover, one can say that the search for versatile, efficient, highly reproducible and cost-
effective SERS substrates is still a major concern in the field and it is a prerequisite for the
further development of aptasensors.
§ TBA: Thrombin-binding aptamer.
Page 50
50
5 OBJETIVES AND SCOPE OF THIS WORK
The main goal of this work was to develop a highly-branched silver magnetic
microcomposite, referred as Fe3O4@SiO2@Ag microflowers, for application as an efficient and
versatile SERS substrate. The combination of the magnetic aggregation provided by the Fe3O4
core and the sharp Ag tips could induce the formation of numerous hot spots, thereby increasing
the SERS response of the substrate. The intermediate silica layer not only shields the magnetite
core against chemical degradation but also suppresses the spontaneous particle aggregation due
to magnetism. Additionally, the surface silanol groups of SiO2 offer anchoring sites to form the
subsequent silver layer.
The SERS efficiency of the proposed system was tested against 4-aminobenzenthiol (4-
ABT) as a probe molecule. The substance 4-ABT is a common Raman reporter with strong
chemical affinity for silver substrates. Therefore, the high Raman signal of 4-ABT is useful to
investigate the SERS efficiency and the detection limit of the Fe3O4@SiO2@Ag microflowers.
Finally, an aptasensor was assembled for the detection of cardiac troponin I to explore
the potential of the substrate as a SERS-based biosensor. For that, the substrate was
functionalized with a 5’ thiol modified aptamer. SERS measurements were carried out with the
microflower aptasensor in the presence of the target troponin I. Additionally, each component
of the substrate was characterized throughout the work by several techniques such as UV-Vis
spectroscopy, X-Ray diffraction and electron microscopy to elucidate the features of the system.
Page 51
51
6 METHODOLOGY
6.1 Materials
The complete list of reagents can be found in Table 1. All chemicals were of analytical
grade and used as received without further purification.
Table 1: List of chemicals used in this work and their specifications.
Chemical Manufacturer Purity / Concentration
1,4-Dithiothreitol (DTT) Sigma-Aldrich 1 mol L-1 solution in water
4-Aminobenzenthiol (4-ABT) Sigma-Aldrich 97%
Ethanol Anidrol 99.5%
Ammonium hydroxide LS Chemicals 28-30% in water
Ethylene glycol Synth -
Ferric chloride Sigma-Aldrich > 97%
Formaldehyde Sigma-Aldrich
37% in water, with 10-15%
of methanol as stabilizer
Hydrochloric acid Merck-Millipore 37%
Polyethylene glycol-4000 (PEG) Vetec -
Polyvinylpyrrolidone (PVP; MW 40,000) Sigma-Aldrich -
Silver nitrate Sigma-Aldrich > 99%
Sodium acetate trihydrate Synth 99%
Sodium chloride Sigma-Aldrich > 99.5%
Sodium dodecyl sulfate (SDS) Synth 90%
Stannous chloride dihydrate Sigma-Aldrich > 98%
Tetraethyl orthosilicate (TEOS) Sigma-Aldrich 98%
cTnI binding aptamer (oligonucleotide
sequence: 5’-
CGTGCAGTACGCCAACCTTTCTCATGCG
CTGCCCCTCTTA – Dithiol serinol -3’ (MW
12kDa)
Exxtend HPLC purification
Troponin I (cTnI) from human heart
(lyophilized powder) Sigma-Aldrich -
Page 52
52
All aqueous solutions were prepared with water purified by Milli-Q® ultrapure water
system (18.2 MΩ cm-1 at 25 ºC). The sonochemically-assisted syntheses (section 6.2.3) were
performed with an Eco Sonics Ultronique Q-3.0L ultrasonic bath (110 W RMS, 40 kHz) and
an Eco Sonics Ultronique QR750 sonicator (750 W, 20 kHz) equipped with a titanium
microprobe. For the aptamer activation procedure (section 6.3.1), a NAP™-10 column (GE
Healthcare) and a Vivaspin® 2 centrifugal concentrator 3,000 MWCO** (Sartorius, Germany)
were employed.
6.2 Synthesis Protocols
Unless otherwise stated, all the synthetic procedures described in this section were
performed at the Functional Materials Laboratory (Institute of Chemistry, University of
Campinas) and are outlined in the representation below:
Figure 11: Outline of the synthetic process of the Fe3O4@SiO2@Ag microflowers.
6.2.1 Synthesis of Fe3O4 nanoparticles
The synthesis of the Fe3O4 magnetic core followed the strategy described by Carvalho
et al.80, based on a modified solvothermal method. In this procedure, the quantities were
adjusted to increase the reaction yield. First, 10 mmol (~1.672 mg) of FeCl3 was dissolved in
80mL of EG under constant stirring. The mixture was heated to 120 ºC, and 2 g of PEG-4000
was added. The system was kept under stirring until a clear, transparent medium was obtained.
Later, 53 mmol (~ 7.22 g) of NaAc.3H2O was added, and the reaction medium was maintained
under the same conditions for another 30 minutes to allow the formation of a reddish
** Molecular weight cutoff.
Page 53
53
suspension. Here, ethylene glycol promoted the reduction of Fe3+ in alkaline medium with PEG
acting as a stabilizer. Subsequently, the mixture was transferred into a Teflon-lined autoclave
and heated at 200ºC for 8 hours. Once cooled to room temperature, the obtained magnetic cores
were washed five times with ethanol and water, and then dried in vacuum at 60ºC for 5 hours.
Figure 12: Outline of the Fe3O4 synthesis route.
6.2.2 Synthesis of Fe3O4@SiO2 nanoparticles
To synthesize the silica shell onto the magnetite nanoparticles, the Stöber method was
applied with slight modifications. Here, 0.1 g of the Fe3O4 was dispersed into 20 mL of HCl
0.1 mol L-1 and sonicated for 30 minutes in an ultrasonic bath for surface activation. The
magnetic cores were rinsed with water and dispersed into a water/ethanol solution (20 mL/80
mL) under sonication bath for another 30 minutes. Then, 1 mL of ammonia was added. The
mixture was mechanically stirred at 500 rpm, and then 600 µL of TEOS was added dropwise
(1 drop/5 s). The beaker was sealed with Parafilm® to avoid ammonia evaporation, and the
system was kept under constant stirring at the same speed for 6 hours. Subsequently, the
products were rinsed several times with ethanol and water and then dried overnight at 60ºC.
Figure 13: Scheme of the Fe3O4@SiO2 nanoparticle synthesis.
Page 54
54
6.2.3 Synthesis of Fe3O4@SiO2@Ag nanoparticles
The experimental procedure described in this section is based on the sonochemically-
assisted route for silver microflower formation as described elsewhere65,81 and involves a two-
step seed-mediated synthesis.
6.2.3.1 Synthesis of Fe3O4@SiO2-Ag seeds
To deposit silver seeds onto silica-coated magnetite nanoparticles, 100 mg of
Fe3O4@SiO2 was dispersed into 10 mL of 3% SnCl2.2H2O acidic solution, in which 100 µL of
HCl was previously added to suppress the hydrolysis of Sn2+ species. The mixture was
incubated in ultrasound for 1h to allow the adsorption of Sn2+ ions onto the silica surface. The
Fe3O4@SiO2-Sn2+ particles were magnetically collected to remove non-adsorbed Sn2+ ions and
redispersed in 1 mL Milli-Q® water. Subsequently, 10 mL of freshly prepared 25 mmol L-1
ammonia silver solution was added, and the mixture was incubated under ultrasound for another
30 minutes. Finally, the products were washed and dispersed in 20 mL ethanol for further use.
It should be mentioned that the reaction was performed in a 50 mL polypropylene centrifuge
tube to avoid nonspecific interaction with the reaction vessel. The products were stored
protected from light with an aluminum foil wrap.
6.2.3.2 Synthesis of Fe3O4@SiO2@Ag flower
This step was performed in the lab facilities of Prof. Juliano Bonacin, where the
sonicaion probe was available. Afterward, 0.4 mL of Fe3O4@SiO2-Ag seed solution was
dispersed into 200 mL of AgNO3 0.5 mmol L-1 aqueous solution by sonication with titanium
ultrasound probe at 30% power (~225 W) for 2 minutes. Then, excess formaldehyde (150 µL)
and ammonia (300 µL) was added in sequence. After 2 minutes of ultrasonic treatment, 200 mg
of PVP was added. The mixture was sonicated for another 30 minutes under the same
conditions. After that, the products were washed and dispersed in 10 mL Milli-Q water. The
reaction was performed in a 250 mL polypropylene beaker to avoid nonspecific interaction with
the reaction vessel. To protect from light-induced damage, the samples were wrapped in
aluminum foil after the synthesis.
Page 55
55
6.3 Aptasensor assembly
6.3.1 Aptamer activation
Firstly, the 3’ dithiol functionalized TnI aptamer was reconstituted with 303 µL of PBS
buffer containing sodium chloride to a final concentration of 1x10⁻⁴ mol L-1. Subsequently, 100
µL of DTT 0.1 mol L-1 was added to the reconstituted aptamer and shaken at 195 rpm for 1h.
Subsequently, the DTT was removed from the aptamer solution by gravity-assisted filtration
with a NAP-10 column. The NAP-10 column was previously conditioned by passing 4mL of
PBS buffer through the column for five times. Then, the DTT containing aptamer solution was
diluted with PBS buffer to a final volume of 1 mL. The solution was passed through the NAP-
10 column and collected in a 2 mL Eppendorf tube.
Later, the filtered aptamer was added to a Vivaspin 2 sample concentrator tube and
centrifuged for 30 minutes at 2,000 rpm. The aptamer sample was fractioned in 20 μL aliquots
and stored at -20° C. Before the storage, the aptamer concentration was determined by applying
the Beer-Lambert law from the maximum absorption value, which occurs typically around 260
nm. This spectral region is characteristic of nucleotides.82 The molar extinction coefficient (ε260)
at 260 nm can be estimated from the nearest-neighbor method, which is based on the nucleotide
sequence.
𝜀260 = ∑ 𝜀𝑁𝑒𝑎𝑟𝑒𝑠𝑡 𝑁𝑒𝑖𝑔ℎ𝑏𝑜𝑟𝑁−11 − ∑ 𝜀𝐼𝑛𝑑𝑖𝑣𝑖𝑑𝑢𝑎𝑙 𝐵𝑎𝑠𝑒𝑠
𝑁−12 (15)
Where the first term on the right side of the above equation represents the sum of the
extinction coefficients of each pair of bases of the oligonucleotide sequence, and the second
term is the sum over the extinction values of the individual bases.83 The extinction coefficients
of the dimers and individual bases are shown in tables in the following:
Page 56
56
Table 2: Extinction coefficients (L mol -1 cm-1) for the different base pairs. Values extracted from ref. 83.
3’ position
5’ position
Bases A C G T
A 27,400 21,200 25,000 22,800
C 21,200 14,600 18,000 15,200
G 25,200 17,600 21,600 20,000
T 23,400 16,200 19,000 16,800
Table 3: Extinction coefficients (L mol -1 cm-1) for the individual bases. Values extracted from ref. 84.
Base
A C G T
15,400 7,400 11,500 8,700
The calculated ε260 value for the cTnI binding aptamer used in this work was 350.8 x10³
L mol-1 cm-1. Due to the lack of reference values, the effect of the terminal dithiol serinol group
was neglected on the extinction coefficient calculation. The aptamer concentration C (mol L-1)
can then be determined from:
𝐶 = 𝐴260
𝜀260𝑙 (16)
Where A260 is the maximum nucleotide absorbance value and l is the optical path length
(cm).
6.3.2 Troponin I reconstitution and storage
The lyophilized troponin I (cTnI, MW 23.9 kDa) was reconstituted with PBS buffer.
The reconstituted cTnI was then fractioned in 5 μL aliquots and stored at -20° C. The
concentration cTnI after reconstitution was 4.18x10⁻³ mol L-1. This procedure was performed
at the Laboratory of Electrochemistry, Electroanalytics and Sensor Development (LEEDS),
coordinated by Prof. Dr. Lauro Tatsuo Kubota.
Page 57
57
6.3.3 Aptasensor assembly
To immobilize the aptamer onto the Fe3O4@SiO2@Ag microflowers, 6.5 μL of the
aptamer solution was added to 100 μL of nanoparticle suspension. The mixture was kept
overnight under constant stirring (195 rpm) at 37 °C. Afterwards, 10 μL of 1% SDS solution
(m/v) was added. The mixture was homogenized by sonication treatment for a few seconds and
kept under stirring (195 rpm) for 30 minutes at room temperature. 5 μL of a 2 mol L-1 NaCl
solution was added gradually to a final addition volume of 25 μL. Between each addition, the
mixture was kept under constant stirring (100 rpm) for 30 minutes. Subsequently, the sample
was incubated overnight at 100 rpm and 37 °C. After incubation, the sample was washed with
PBS buffer and centrifuged at 5 °C and 14,000 rpm. The washing procedure was performed for
three times. The sample was redispersed in PBS buffer to a final volume of 200 μL and kept
refrigerated for future use.
To promote the linkage of cTnI on the aptamer structure, cTnI was added to the aptamer-
functionalized Fe3O4@SiO2@Ag microflower suspension and diluted with PBS buffer to a final
volume of 30 μL. After the addition of cTnI, the mixture was stirred and sonicated for 10
seconds. The concentration of the silver substrate was kept constant for all samples (29.3 μL of
aptamer-functionalized Fe3O4@SiO2@Ag microflower suspension). All the procedures in this
section were performed at the Laboratory of Electrochemistry, Electroanalytics and Sensor
Development (LEEDS).
6.4 Characterization of the Substrates
All the equipment mentioned in this section is available at the Institute of Chemistry of
Unicamp unless otherwise stated.
6.4.1 Transmission Electron Microscopy (TEM)
Transmission electron microscopy (TEM) was performed in a Carl Zeiss LIBRA® 120
Energy Filtered Transmission Electron Microscope (EFTEM), available at Unicamp, with an
accelerating voltage of 120kV. Additionally, High-Resolution TEM (HRTEM), Scanning
Transmission Electron Microscopy (STEM), as well as some other TEM micrographs were
obtained in a Jeol(R) JEM 2100F operating at 200kV, equipped with a field emission electron
gun (TEM-FEG). For electron dispersive X-Ray spectrometry (EDS, line scan, and mapping
Page 58
58
mode), an Oxford Silicon Drift Detector (SDD) X-MaxN (detector size of 80 m2) was used in
windowless mode. All the last mentioned equipment is available at the Brazilian Center for
Research in Energy and Materials (CNPEM).
In the TEM grid preparation, the samples were dispersed in absolute ethanol by
ultrasound to obtain a very dilute suspension. One drop of solution was placed onto a copper
grid covered by a thin carbon film (400 mesh size). A small filter paper was used to absorb the
excess of solvent, and the grid was allowed to dry naturally at room temperature. After complete
drying, the process was repeated for another two times.
6.4.2 Scanning Electron Microscopy (SEM)
SEM images were obtained in a Jeol JSM-6360LV scanning electron microscope (30kV
of accelerating voltage) and in a FEI Quanta FEG 250 (10 kV of accelerating voltage). For
sample preparation, a conductive double-sided carbon tape was fixed onto a previously polished
metal stub. Then, a small amount of powder sample was transferred onto the carbon tap to form
a thin layer. Excess of powder was removed by air blowing the stub. Finally, a thin gold film
was applied onto the sample by a sputter coater.
For colloidal samples, 7 μL of suspension was dropped onto a clean silicon wafer, and
dried under magnetic attraction. Once dried, the Si wafer containing the sample was fixed onto
a metal stub with the aid of a double-sided carbon tape. The samples were sputtered with iridium
before the analysis. All the SEM images were acquired by the collaborator Bsc. Hugo C.
Loureiro.
6.4.3 X-Ray Diffraction (XRD)
The diffraction patterns were taken with a Shimadzu XRD-7000 with Cu Kα radiation
(X-Ray tube operating at 40.0 kV, 30mA) in continuous scanning mode (2θ: 5º-70º, 0.02º step,
exposure time of 1.2s). Additionally, XRD was performed in step-scanning mode (0.01º/10 s)
to calculate the crystallite size of fine-grained magnetite. For that purpose, the Scherrer equation
was applied based on the broadening of the two most intense peaks of magnetite. As described
by the Scherrer equation, the extension of the broadening will be inversely proportional to the
grain size:
Page 59
59
𝑡 = 𝐾𝜆
𝑤𝑐𝑜𝑠𝜃𝐵 (17)
Where t is the mean crystallite size, λ is the wavelength of the incident radiation, w is
the peak broadening in radians, and K is a dimensionless shape factor, commonly approximated
to 0.9 for spherical crystals with cubic symmetry. In a peak shape function, w is expressed by
the full-width at half maximum (FWHM). To obtain an accurate value for the crystallite size of
the sample from the Scherrer relation a correction for the instrumental broadening wib must be
performed. Since the peak broadening follows a square law in a Gaussian peak shape function,
which was applied in this work to obtain the FWHM, the real peak broadening wreal can be
calculated by the following relation85:
𝑤𝑟𝑒𝑎𝑙2 (𝜃) = 𝑤2(𝜃) − 𝑤𝑖𝑏
2 (𝜃) (18)
Which leads to:
𝑡 = 0.9𝜆
𝑐𝑜𝑠𝜃𝐵√𝑤2(𝜃)−𝑤𝑖𝑏2 (𝜃)
(19)
6.4.4 UV-Vis Spectroscopy
UV-Vis absorption spectra were obtained in a Hewlett Packard® 8453 UV-Vis
spectrophotometer by using a quartz cuvette with an optical path length of 10 mm. Briefly, the
samples were ultrasonically dispersed in Milli-Q water (18.2 MΩ cm-1 at 25 ºC) and taken for
analysis.
6.4.5 Surface-Enhanced Raman Spectroscopy (SERS)
The Raman and SERS measurements were performed in a Renishaw® InVia Reflex
confocal Raman spectrometer, available at the Carbon Sci-Tech Labs (School of Electrical and
Computer Engineering – Faculdade de Engenharia Elétrica e Computação, FEEC),
coordinated by Prof. Dr. Hudson Zanin. A Leica N PLAN 100x objective lens (numerical
aperture, N.A. = 0.90) and an 1800 gr mm-1 grating were selected to analyze the samples. The
following laser lines were employed: 514 nm argon ion laser (Stellar-RMN 514/50, Modu-
Laser™); 633 nm He-Ne laser (Renishaw®); and 785 nm diode laser (Renishaw®).For the 514
Page 60
60
nm laser, a 2400 l/mm diffraction grating was used. For the 633 nm and 785 nm lasers, a 1200
l/mm grating was employed. The Raman peak of a silicon wafer at 520 cm-1 was used for
equipment calibration.
The Raman and SERS measurements with the 532 nm laser were performed in a Horiba
T64000 confocal Raman spectrometer in single mode equipped with a nitrogen cooled CCD
detector (-130 °C). An OLYMPUS 100x LWD objective lens (numerical aperture, N.A. = 0.8)
and 1800 l/mm grating were used to analyze the samples. Similarly, the Raman peak of Si was
used for calibration. The last mentioned Raman microscope in available at the Multiuser
Laboratory of Advanced Optical Spectroscopy (Laboratório Multiusuário de Espectroscopia
Óptica Avançada – LMEOA/IQ/UNICAMP).
Whenever specified, the SERS spectra were processed using Renishaw WiRE 4.3
software and have undergone cosmic ray removal, and baseline correction. For SERS sample
preparation, one drop of the microflower aqueous suspension (7 µL) was placed onto a silicon
wafer (5 mm x 5 mm) and concentrated by using a small cylindrical Nd magnet (2 mm diameter)
placed under the wafer. The sample was left undisturbed and protected from light for drying
under magnetic attraction. Once the substrate was dried, the analyte was dropped onto the
substrate, naturally dried, and taken for analysis.
For the SERS measurements with the aptasensor, 10 μL of the as-prepared
Fe3O4@SiO2@Ag aptasensor suspension containing cTnI (section 6.3.3) was dropped directly
onto the Si wafer. The sample was dried under magnetic attraction, according to the standard
procedure previously described in this paragraph.
Page 61
61
7 RESULTS AND DISCUSSION
7.1 Fe3O4 nanoparticles
Magnetite (Fe3O4) is one of the first minerals of which crystal structure was elucidated
by X-Ray diffraction. Furthermore, it is one of the most important spinel-type ferrite, a class of
iron oxides with a strong magnetic response under an external magnetic field. The chemical
formula of iron ferrites is represented as MIIFe2IIIO4, in which MII is a divalent metal such as
Fe, Co, Zn or Cu. In ferrites with spinel structure, the oxygen ions form a closed-packed cubic
lattice (ccp) presenting both tetrahedral (A) and octahedral (B) sites. Each unit cell presents 32
oxygen ions forming 8 A-type sites and 16 B-type sites overall. In normal spinels, divalent
cations occupy the 8 A-sites, and trivalent cations the 16 B-sites. In contrast, in inverse spinels,
the 8 A-sites are all occupied by trivalent cations, while 8 divalent and 8 trivalent cations are
randomly distributed within the16 B-type sites.
An approximate way to determine if a crystal will assume either a normal or an inverse
spinel structure is by analyzing the crystal field stabilization energies (CFSE) of the respective
cations in both tetrahedral and octahedral fields. For instance, Fe3+ ions have a zero CFSE for
both tetrahedral and octahedral coordination, and hence there is no preference site for
occupation. However, the CFSE for Fe2+ in tetrahedral and octahedral fields are 29.9 and 44.7
kJ mol-1, respectively, leading to an octahedral site preference energy of 14.8 kJ mol-1.
Therefore, Fe2+ occupies octahedral sites, resulting in an inverse spinel structure, characteristic
of magnetite85–87.
7.1.1 Characterization
The XRD pattern of the synthesized sample (Figure 14) confirms the formation of the
magnetite phase. By analyzing the diffraction pattern of the compound obtained by this route,
one can observe the good correlation between the experimental diffractogram and the reference
diffraction pattern of magnetite (JCPDS card no. 19-629). Additionally, XRD was performed
in step-scanning mode (0.01º/10 s) to calculate the crystallite size of fine-grained magnetite. By
applying the Scherrer equation upon subtraction of the instrumental broadening for silicon
powder standard, the obtained crystallite size was 15 nm.
Moreover, one can notice that highly monodisperse Fe3O4 nanoparticles were obtained,
with an approximate core diameter of 189 ± 29 nm (Figure 15). From (Figure 17), it is possible
Page 62
62
to observe the magnetite characteristic black powder formed after vacuum drying the sample.
Due to the PEG capping layer, the nanoparticles are highly hydrophilic and form a stable
suspension with ethanol, being easily separated by a magnet.
Figure 14: X-Ray powder diffraction pattern of the synthesized magnetite and the magnetite reference (JCPDS card
no. 19-629).
Additionally, the TEM images (Figure 16) revealed the porous nature of the Fe3O4
nanocrystals, which is characteristic of magnetite samples synthesized by the solvothermal
method. Mechanistic discussions regarding the referred synthetic route will be presented in the
next section. From the high-resolution TEM micrographs (Figure 18), atomic plane distances
of magnetite could be calculated with the aid of ImageJ software††. The values found are in
accordance with the crystal planes exhibited in the experimental diffractogram previously
shown. ). From Figure 17, it is possible to observe the magnetite characteristic black powder
formed after vacuum drying the sample. Due to the PEG capping layer, the nanoparticles are
†† Rueden, C. T.; Schindelin, J.; Hiner, M. C.; DeZonia, B. E.; Walter, A. E.; Arena, E. T.; Eliceiri, K.
W. ImageJ2: ImageJ for the next Generation of Scientific Image Data. BMC Bioinformatics 2017, 18 (1).
5 10 15 20 25 30 35 40 45 50 55 60 65 70
No
rma
lize
d in
ten
sity / a
rb. u
n.
2q / degree
Synthesized Fe3O4
Fe3O4 (JCPDS card no. 19-629)10 arb. un.
111
220
311
400
422
511
440
Page 63
63
highly hydrophilic and form a stable suspension with ethanol, being easily separated by a
magnet.
Figure 15: SEM micrograph of the synthesized Fe3O4 and the respective histogram of particle counting (inset in the
lower right corner).
Figure 16: TEM micrographs of synthesized Fe3O4 nanoparticles.
Page 64
64
Figure 17: Magnetite sample synthesized by the solvothermal method in powder form after vacuum drying (left) and
suspended in ethanol (center, right).
Figure 18: High-resolution TEM micrographs of magnetite nanocrystals highlighting the respective lattice planes.
7.1.2 Mechanism of formation
In the first attempts to synthesize magnetite nanoparticles, anhydrous precursors were
employed. However, although the magnetite phase was clearly formed (Figure 19), the TEM
images showed that the particles obtained from those essays possessed irregular morphology
and poor size control. In contrast, by replacing anhydrous NaAc for NaAc.3H2O in the synthesis
procedure, it was possible to obtain uniform Fe3O4 nanoparticles (Figure 15). Hence, according
to our experiments, the crystal water from sodium acetate was essential to obtain a good size
and morphology control of magnetite nanoparticles.
Page 65
65
In fact, Zhang and co-workers88 investigated the role of water in the solvothermal
synthesis of magnetite nanoparticles. In their work, several volume ratios of ethylene glycol to
water (EG /W) were used, ranging from EG/W = ∞ (pure EG) to 5. Additionally, the effect of
the crystal water of the precursors was also considered. They concluded that trace
concentrations of water are required for the crystallization of magnetite from the iron alkoxide
intermediate precursor. This effect was observed for both crystal water and water from the
solvent mixture, leading to very monodispersed nanoparticles with tunable size. Their results
showed that increasing water content in the reaction medium led to smaller magnetite particles.
The proposed mechanism to explain the phenomenon involves the formation of a
“quasi-reverse-emulsion” system. According to the authors, since the Fe3O4 phase is not formed
in the absence of water, in small concentrations the H2O molecules would self-assemble through
hydrogen bonding to produce small sites for nanocrystal formation and further aggregation.
This mechanism complements the ideas presented a few years earlier by Zhu and Diao89.
Briefly, first, primary Fe3O4 particles nucleate and grow to produce small crystals, which self-
assemble into larger nanospheres, resulting in porous nanostructures typical of the solvothermal
route.
Therefore, at first sight, it seems contradictory that magnetite was obtained from
anhydrous precursors, as shown by the early experiments. However, that observation can be
partially explained by the hygroscopic and deliquescent nature of sodium acetate and ferric
chloride, respectively. Those substances absorb a large amount of moist from the environment
so that water molecules incorporate into the reaction medium to allow the formation of
magnetite.
Page 66
66
Figure 19: XRD pattern of magnetite formed from anhydrous precursors and the respective TEM micrographs (inset)
evidencing the irregular morphology of the particles.
As previously stated, an iron alkoxide, namely iron oxide acetate hydroxide hydrate –
IOAHH, chemical formula (Fe2O)(CH3COO)(OH)3.H2O –, is the precursor of magnetite88,90,
which leads to the appearance of a reddish suspension in the reaction medium. To generate this
precursor, acetate anions assist the deprotonation of ethylene glycol molecules leading to the
respective alkoxide. Then, the so formed EG alkoxide coordinates with the metal cations and
partially reduces Fe3+ to Fe2+, according to the following equations91,92:
(20)
(21)
Page 67
67
Alternatively, acetate can undergo hydrolysis producing OH- anions, which react with
ethylene glycol, again leading to the same alkoxide:
(22)
(23)
(24)
Since water molecules have higher affinity with metal ions, the EG ligands are gradually
replaced by water as the reaction proceeds, releasing iron in a controlled fashion93. In this
context, IOAHH is thermally decomposed at 200ºC in the autoclave to maghemite and finally
to magnetite with increasing reaction time. The slow kinetics promoted by the high viscosity of
EG allows the freshly formed Fe3O4 nanocrystals to rotate and self-assemble into well-oriented
aggregates in a low-energy configuration at the interface, increasing the nanoparticle
crystallinity94. Finally, PEG acts as a capping agent not only to prevent particle coalescence
driven by magnetic attraction but also to increase magnetite solubility in polar media89.
7.2 Fe3O4@SiO2 nanoparticles
Bare magnetite nanoparticles are usually highly unstable to long-term storage due to
their high surface to volume ratio, and ease of undergoing oxidation. To enhance their chemical
stability, several organic and inorganic materials are employed for coating. For instance,
various organic molecules such as surfactants and polymers are used. Similarly, inorganic
substances, e.g. oxides and metals, are equally used according to the desired application.
Among them, silica is a common inorganic material applied as a protective shell. SiO2 not only
endows chemical inertness to the system against several chemical environments but also
prevents undesired magnetic aggregation and promotes easy particle dispersion in various
solvents. Furthermore, the high concentration of surface silanol groups on silica enables a
variety of surface reactions, as well as the binding of biomolecules, metals, and polymers.
Therefore, silica is a very versatile substrate which provides numerous and excellent sites for
further surface functionalization, opening a large field of possibilities to design multifunctional
nanostructures95.
Page 68
68
7.2.1 Characterization
By the route previously described (section 6.2.2), core-shell Fe3O4@SiO2 nanoparticles
were synthesized (Figure 23). The experimental diffractogram of Fe3O4@SiO2 (Figure 20)
indicates the presence of amorphous silica in the system due to the halo at low diffraction angles
(2θ = 15° to 30°), along with well-defined peaks of crystalline magnetite. For that reason, one
can say that the silica coating does not interfere in the crystallinity of magnetite.
Figure 20: Comparison between the XRD patterns of the synthesized Fe3O4 and the core-shell Fe3O4@SiO2
nanoparticles.
Both the TEM micrographs and the inset with the respective EDS elemental mapping
(Figure 21) indicate that silica was successfully deposited on magnetite nanoparticles and
formed a uniform layer with 40 ± 4 nm width. The images also indicate that the core was totally
preserved during the synthesis and that silica is exclusively located at the nanoparticle outer
shell (Figure 22). Hence, highly uniform nanoparticles were obtained.
5 10 15 20 25 30 35 40 45 50 55 60 65 70
No
rma
lize
d in
ten
sity /
arb
. u
n.
2q / degree
Fe3O4
Fe3O4@SiO2
10 arb. un.
111
220
311
400
422
511440
Page 69
69
Figure 21: TEM micrographs and EDS elemental mapping (inset, lower right corner) of Fe3O4@SiO2 core-shell
nanoparticles.
Figure 22: EDS line scan of synthesized core-shell Fe3O4@SiO2 nanoparticles.
Page 70
70
Figure 23: Fe3O4@SiO2 powder sample synthesized by the modified Stöber method after drying (left). Comparison
between ethanolic suspensions of Fe3O4 and Fe3O4@SiO2 (center) under the influence of a magnet (right).
Figure 23 (left) shows the final aspect of the powder sample obtained after drying. One
can notice the slight change of color of the sample from black to dark brown after the silica
coating. Because surface silanol groups are present on silica shell, the particles are highly
dispersible in both water and ethanol (Figure 23 center, right).
7.2.2 Mechanism of formation
The Stöber method is one of the most applied routes to synthesize monodisperse silica
nanoparticles. In this sol-gel approach, an alkoxysilane (typically tetraethyl orthosilicate,
TEOS) is hydrolyzed (a) in an alcoholic medium (methanol or ethanol) in the presence of
ammonia as a base catalyst. A condensation (b) between the ethoxysilanols formed in the
hydrolysis step occurs, leading to a crosslinking process building the silica chains.96,97
Hydrolysis: 𝑆𝑖(𝑂𝐸𝑡)4 + 𝐻2𝑂 𝑁𝐻3→ 𝑆𝑖(𝑂𝐸𝑡)3𝑂𝐻 + 𝐸𝑡𝑂𝐻 (a)
Condensation: 2𝑆𝑖(𝑂𝐸𝑡)3𝑂𝐻 𝑁𝐻3→ (𝐸𝑡𝑂)3𝑆𝑖 − 𝑂 − 𝑆𝑖(𝑂𝐸𝑡)3 + 𝐻2𝑂 (b)
This route is very suitable for synthesizing the silica coating on magnetite due to the
strong affinity between the Fe3O4 surface and SiO2.98 Furthermore, one can assume that the
SiO2 coating formation is a process of heterogeneous nucleation of silica onto preformed
magnetite seeds. Hence, the control of reaction kinetics is crucial to avoid homogeneous
nucleation of SiO2 in the reaction medium. For that reason, the dropwise addition of TEOS is
Page 71
71
essential to prevent the formation of core-free silica particles and to generate monodisperse
Fe3O4@SiO2 nanostructures.
7.3 Fe3O4@SiO2@Ag microflowers
Recalling the experimental section, the synthesis of Fe3O4@SiO2@Ag microflowers
involved a two-step approach, in which small silver seeds were reduced in situ on the surface
of Fe3O4@SiO2 nanoparticles, followed by the microflower growth in the subsequent step. The
synthesis of silver seeds of adequate size showed to be critical to the successful microflower
formation. In early experiments, butylamine was employed as reductant to the synthesis of Ag
seeds. However, difficulties in reaching the seed critical size arose from this route, which
hindered the synthesis of the Fe3O4@SiO2@Ag system. Therefore, another method for the Ag
seed synthesis was required. In this context, tin chloride led to better results, which are
discussed in the following section. The results of the experiments with butylamine can be found
in Appendix A to the interested reader.
7.3.1 Characterization
7.3.1.1 Fe3O4@SiO2-Ag seed nanoparticles
After the deposition of silver seeds onto silica-coated magnetite, no significant change
in the aspect of the sample was observed. From the UV-Vis extinction spectrum, it is noticeable
that the silver seeds promote only a slight red shift of the extinction band when compared to
bare silica-coated magnetite. Since no additional bands that could indicate the presence of
metallic silver are present, one can say that the seeds do not affect significantly the optical
properties of the sample, probably owing to their small size.
Page 72
72
Figure 24: Normalized extinction spectra of the synthesized Fe3O4@SiO2 and Fe3O4@SiO2–Ag seed nanoparticles.
The TEM images (Figure 25) confirm the formation of silver nanoparticles anchored to
the silica surface. The estimated particle size was 17 ± 3 nm. Although non-bonded silver seeds
were found, it is clear that silver was successfully reduced in situ on the silica surface, leading
to a high yield of silver-decorated Fe3O4@SiO2 nanoparticles. The SEM images (Figure 26)
help to visualize the extent of silver seed deposition, indicating that Ag seeds were formed in a
large number of Fe3O4@SiO2 particles.
Page 73
73
Figure 25: TEM images of Fe3O4@SiO2–Ag seed nanoparticles in different magnifications. Inset (b) shows the
respective EFTEM image (25 eV energy loss). The scale bar is 500 nm (left) and 200 nm (center, right), respectively.
Page 74
74
Figure 26: SEM images of Fe3O4@SiO2–Ag nanoparticles in 8,000x (a), 60,000x (b) and 120,000x (inset)
magnifications. The scale bars represent 5 μm (a), 1 μm (b), and 500 nm (inset) size.
Page 75
75
Figure 27: EDS spectrum (a) and EDS mapping (b) of Fe3O4@SiO2–Ag seed nanoparticles.
The presence of silver is barely detectable from both the EDS spectrum and the
elemental mapping of the Fe3O4@SiO2–Ag seed nanoparticles (Figure 27). This can be related
to the low relative amount of silver as a result of the small seed size in comparison to the
0 2 4 6 8 10 12 14 16 18 20
0
5
10
15
20
25
IrC FeFe Ir
O
Cps / e
V
Energy / keV
Fe3O4@SiO2-Ag seedSi
Ag
a)
Page 76
76
Fe3O4@SiO2 core-shell dimensions. The presence of a small peak of carbon in the spectrum
can be explained by residual PEG used as a capping agent for the magnetite core. Moreover,
the peaks from iridium are detectable since the element was used for the sample metallization.
The elemental mapping for Si was neglected due to the strong interference of the background
signal of the Si wafer, as shown by the strong Si signal in Figure 27b. Therefore, oxygen was
traced as a way to represent both the magnetite core and the silica shell in the system (Figure
27b).
Figure 28: XRD diffraction pattern of Fe3O4@SiO2–Ag seed nanoparticles (gray) compared with bare silica-coated
nanoparticles (red), as well as FCC-Ag (blue) and AgCl (green) reference patterns.
In contrast, the XRD pattern of Fe3O4@SiO2–Ag seed nanoparticles (Figure 28) show a
stronger evidence of metallic silver in the sample due to a small peak at the 38.3° diffraction
angle, characteristic of the (111) plane of FCC silver. The broadness of the diffraction peak of
silver is consistent with the dimension of the nanoparticles. The Interestingly, strong and narrow
peaks at 27.9°, 32.3°, and 43.6° diffraction angles appeared in the diffractogram. In this context,
those peaks were reasonably attributed to the presence of AgCl in the sample. The formation of
10 20 30 40 50 60 70
(400)(222)
(220)
(311)
(200)
(111)
(220)
(200)
Norm
aliz
ed inte
nsity / a
rb. un.
2q / degree
FCC Ag (JCPDS card no. 87-719)
AgCl (JCPDS card no. 31-1238)
(111)
0.5 arb. un.
Page 77
77
silver chloride can be explained both by unreacted Ag+ ions and by partial oxidative dissolution
of silver nanoparticles by dissolved oxygen in the medium, leading to the release of Ag+ ions.
The Ag+ species then precipitate as AgCl upon interaction with residual chloride ions99 from
stannous chloride precursor. During the solvent evaporation before performing the powder
XRD analysis, the crystallization of AgCl could have been favored. It is worth mentioning that
despite AgCl was clearly detected on the experimental diffractogram, they were not visually
noticeable neither in the stored colloidal suspension nor in the dry powder. And apparently,
AgCl did not affect the subsequent formation of silver microflowers.
7.3.1.2 Fe3O4@SiO2@Ag microflowers
From the sonochemical route employed in this work (sections 6.2.3.1 and 6.2.3.2), the
proposed Fe3O4@SiO2@Ag microflowers were produced (Figure 29). It is observed that
numerous tips were obtained for each particle, although the amount of branches per particle is
variable. (Figure 31 and Figure 32). Due to the 3D structure, it is difficult to precisely determine
the tip length from the 2D projections of the TEM and SEM micrographs. One can notice,
though, that the size distribution is broad, with silver tip size ranging from 80 to 300 nm. In
contrast to the length of the branches, the tip thickness is apparently more uniform, with an
estimated size of 60 nm. Preliminary results from TEM tomography help to visualize the 3D
character of the particles (Figure 30).
Furthermore, the microflowers showed low stability in aqueous suspension, even in the
presence of the PVP stabilizer. The Fe3O4@SiO2@Ag microflowers easily aggregate and
deposit on the bottom of the vial if kept undisturbed after a few minutes. This behavior can be
linked to the large particle size and the intrinsic magnetism of the sample, which induces the
aggregation. Nonetheless, the microflowers can be easily redispersed either by agitation of the
vial or by ultrasound treatment for a few seconds. Figure 29 shows the aspect of the
microparticle suspension, with an opaque gray shade, and the movement of the particles under
the magnetic attraction.
Page 78
78
Figure 29: Synthesized Fe3O4@SiO2@Ag microflowers in aqueous suspension. The magnetic activity of the sample
can be observed by placing a magnet on the side wall of the vial.
With the microflower formation, the relative amount of silver is strongly increased in
comparison to the observed for the Fe3O4@SiO2-Ag seeds, as shown by the EDS spectrum for
the sample (Figure 33a). The dense silver shell produces a high contrast in the elemental
mapping of silver (Figure 33b), which follows the particle morphology as allowed by the
resolution limit. Moreover, the contrast of oxygen and iron in the mapping images are
considerably lower than that of silver as a result of being located in deeper layers of the particle.
The experimental XRD pattern of the system shows well-defined and narrow peaks of
FCC silver (Figure 34). The sharp peaks denote the long-distance correlation of the crystal
structure, meaning that the silver structure is highly crystalline. The peaks of the magnetic core
are no longer observable, suggesting a good coverage of the underlying Fe3O4@SiO2
nanoparticles by the silver layer.
Figure 30: Frames from TEM tomography of the Fe3O4@SiO2@Ag microparticles.
Page 79
79
Figure 31: TEM images of microflowers. a,b) TEM images in higher magnification evidencing the high crystallinity of
the tips.
Page 80
80
Figure 32: SEM images of Fe3O4@SiO2@Ag microflowers in 8,000x (a), 60,000x (b) and 120,000x (inset)
magnifications. The scale bars represent 5 μm (a), 1 μm (b), and 500 nm (inset) size.
Page 81
81
Figure 33: EDS spectrum (a) and EDS mapping (b) of Fe3O4@SiO2@Ag microflowers
0 2 4 6 8 10 12 14 16 18 20
0
2
4
6
8
10
12
IrFeFe
O
C
Cps / e
V
Energy / keV
Fe3O4@SiO2@Ag microflowers
Si
Ag
Ir
Ir
Fe
a)
Page 82
82
Particles with incomplete silver coating were also found (Figure 35), which enabled to
make assumptions about the formation process of the silver flowers. From the TEM and SEM
images, one can suppose that silver first nucleates onto the preformed Ag seed forming a thick
shell with roughened topography onto the silica surface. Then, Ag tips protrude radially from
the surface of the freshly formed shell, leading to the flower morphology (Figure 36).
Figure 34: XRD diffraction pattern of Fe3O4@SiO2@Ag microflowers (gray) showing the excellent correlation with
the reference diffraction pattern of FCC-Ag (JCPDS card no. 87-719)
Figure 35: SEM images of Fe3O4@SiO2@Ag microflowers evidencing the incomplete shell formation.
10 20 30 40 50 60 70 80 90
0.2 arb. un.
No
rma
lize
d in
ten
sity / a
rb. u
n.
2q / degree
FCC Ag (JCPDS card no. 87-719)
Fe3O4@SiO2@Ag flower(111)
(200)
(220) (311)
(222)
Page 83
83
Figure 36: Suggested formation process of Fe3O4@SiO2@Ag microflowers from seed-decorated Fe3O4@SiO2
nanoparticles.
In contrast to bare and silver-decorated Fe3O4@SiO2 nanoparticles, the extinction
spectra of Fe3O4@SiO2@Ag microflowers show a distinct and broad extinction peak. For
comparison, the measurements were performed with both the microflower colloidal suspension
the dried microflower sample. For that, the Fe3O4@SiO2@Ag microflower suspension was
dropped onto a glass slide. The sample was allowed to dry under ambient conditions, and the
spectrum was measured by using the glass slide as blank. Interestingly, both spectra were very
similar (Figure 37).
The peak maxima are centered at 375 nm and 360 nm for the wet and dried substrate,
respectively, extending from the near visible to the near-infrared spectral region. The spectral
shifts are associated with the change in the dielectric environment from water (ε0 ~ 1.77) to air
(ε0 ~ 1.00). Since the dielectric constant of air is lower than that of water, the extinction
spectrum of the microflowers is blue-shifted for the dried substrate.
Page 84
84
Figure 37: UV-Vis-NIR extinction spectra of microflowers in colloidal form (gray curve) and dried (red curve). The
gray area highlights the regions of maximum extinction. In the blue region, the dips in the spectra denote interband
electronic transitions of silver. The orange region
The submicrometer size and the complex morphology of the system account for such a
broad signal, which is attributed to plasmon hybridization between the silver shell and the tips,
as well as to the appearance of multipole plasmon resonance modes. Moreover, the longitudinal
plasmon resonance of the silver tips leads to the observed increase in extinction in the lower
energy region of the spectra100,101. The dip at 317 nm and 321 nm are associated with interband
transitions due to the agreement with the threshold value for silver (~3.9 eV). Hence, the
interband transitions cause the plasmon resonance to decay in this region50.
7.3.2 Mechanism of formation
In nanocrystal synthesis, the growth of isotropic structures is thermodynamically
favored and can be achieved by setting up synthesis parameters of relevance, such as redox
potential and surface capping. In contrast, a tightly controlled kinetic regime is needed to obtain
anisotropic structures such as nanorods, nanostars, etc. A series of reaction parameters can be
Page 85
85
explored for this purpose, e.g. precursor concentration, reactant diffusion, temperature, and
foreign chemical species. By changing those factors, one can alter the relative rates of atomic
deposition (vdeposition) and adatom diffusion (vdiffusion), which dictates the final shape of the
nanostructure. When 𝑣𝑑𝑒𝑝𝑜𝑠𝑖𝑡𝑖𝑜𝑛
𝑣𝑑𝑖𝑓𝑓𝑢𝑠𝑖𝑜𝑛⁄ ≪ 1, the adatoms can migrate over the nanocrystal
surface to reach a lower energy configuration, leading to a thermodynamically favored shape.
Conversely, when 𝑣𝑑𝑒𝑝𝑜𝑠𝑖𝑡𝑖𝑜𝑛
𝑣𝑑𝑖𝑓𝑓𝑢𝑠𝑖𝑜𝑛⁄ ≫ 1, the adatom diffusion to lower energy facets is
negligible, and kinetically-favored products are formed102.
The formation of anisotropic structures from noble metals that adopt only an FCC
structure is thermodynamically unfavorable owing to the high lattice symmetry. Because there
is no driving force for this symmetry breaking, those metals tend to assume polyhedral shapes
in nanoscale according to the growth rate along specific crystallographic directions. In this
context, seed-mediated routes consist an alternative to obtaining anisotropic nanostructures.
The presence of preformed seeds can greatly reduce the surface energy, therefore favoring the
deposition of new atoms. Furthermore, the seed formation and the growth into the final
nanocrystals occur in distinct and hence more controllable processes103.
Regarding the mass transport in kinetically controlled syntheses, sonication is an
important strategy because it can strongly improve the reactant diffusion in the medium.
Moreover, sonochemical routes enable to keep the particles well dispersed during the synthesis.
This aspect of sonication is very advantageous for reactions involving magnetic nanoparticles,
which are commonly very prone to magnetically induced aggregation. The chemical effect of
ultrasound is due to acoustic cavitation, in which cavitational bubbles collapse and produce
intense local heating and pressure at short times. As a result, it is possible to reach transient
temperatures of 5000 K, 500 atm of local pressure, and cooling rates of at least 109 K s-1 104.
In this work, a seed-mediated approach was used to produce the Fe3O4@SiO2@Ag
microflowers. In the seed formation step, Sn2+ was employed to reduce silver cations into Ag0
atoms. As previously explained, the surface silanol groups of the silica shell act as anchoring
sites where Sn2+ ions adsorb to further promote the in situ reduction of silver. To inhibit the
formation of free silver seeds, two strategies were applied. Firstly, the non-adsorbed Sn2+
species were removed from the reaction medium before the addition of the silver precursor.
Secondly, a silver complex was used instead of a simple Ag+ source such as silver nitrate. This
Page 86
86
strategy decreases the electrochemical potential (equations 10 and 11)‡‡ and consequently
lowers the probability of colloidal silver formation.
(25)
(26)
In the subsequent reaction of silver microflower formation, formaldehyde reduces silver
cations (equation 12) in the presence of ammonia as a base catalyst. The reaction is complete
within a few seconds with the reaction medium quickly turning dark gray immediately after the
addition of ammonia. Many reports101,106 evidence that the presence of a metastable hexagonal
closed-packed (HCP) phase is of great importance in obtaining the flower-like shape, although
it is not the only determining factor. In bulk silver, the FCC structure is the most stable form of
packing. But in the case of small silver nanocrystals, where surface effects play a major role,
the HCP phase provides a lower surface configuration than the FCC phase, and hence the
hexagonal packing would be preferred in this regime107,108. The intrinsic crystal anisotropy and
the resultant symmetry break provided by the HCP phase makes the rod formation strongly
favored, even for small HCP fractions100.
(27)
Capping agents can lower the surface energies by selectively binding to determined
facets, therefore decreasing the growth rate on the surface102. Herein, PVP does not act as a
directing agent for crystal structure. However, it is important to add PVP after the reduction of
silver, otherwise, the HCP phase and hence the flower shape would not be formed due to surface
stabilization. Consequently, only spherical particles are obtained65,81,106.
Similarly, the addition sequence of the other reactants also strongly influences the
formation of the highly-branched structure. Previous reports100,101 show that if ammonia is
added before formaldehyde, the flower morphology is not obtained, possibly due to
complexation of silver by ammonia, which decreases the reaction rate. There are also evidences
‡‡ Electrochemical potentials calculated based on the electrode potential values found in Ref. 105.
Page 87
87
that formaldehyde plays a directing role in the flower formation. The carboxyl groups of formic
acid, which results from the oxidation of formaldehyde, may be correlated with the appearance
of the HCP phase according to previous works101. This hypothesis is reinforced by the fact that
the Ag+ reduction by citrate ions lead to a small amount of HCP phase109. Besides, the synthesis
of highly branched silver nanoparticles of FCC structures with citrate and l-ascorbic acid was
also reported, strengthening the hypothesis of the directing role of carboxyl groups110. In
addition, the carboxyl groups of formic acid can act as weak stabilizing agents. Nonetheless,
since formic acid is unstable and quickly decomposes in the reaction medium, PVP must be
added to stabilize the particles100.
Interestingly, the experimental XRD pattern (Figure 34) did not detect the HCP phase
in the structure. Thus, based on our results, the HCP phase was not essential to obtain the flower
morphology. In other words, other factors such as the presence of formaldehyde could be of
greater impact for this synthesis route.
7.4 SERS measurements
To perform the SERS measurements with the synthesized substrate, 4-aminobenzenthiol
(4-ABT) was used as probe molecule. 4-ABT is a common target molecule used in the SERS
due to its strong Raman response. The thiol groups of 4-ABT (inset, Figure 38) easily bind to
surface silver atoms due to strong chemical affinity, and therefore 4-ABT has been explored to
investigate the chemical enhancement mechanism of SERS. As a result of this close proximity
with the substrate, the target molecules also experience a strong electromagnetic enhancement
effect on the surface-enhanced Raman scattering.
An interesting feature regarding the SERS spectrum of 4-ABT is the appearance of
several additional peaks when compared to the normal Raman spectrum (Figure 38). Such
bands were originally attributed to symmetry-forbidden b2 modes of 4-ABT that arise from the
vibronic coupling with the metal surface111. However, a few years ago it was suggested that
those b2 bands were actually a1 bands of 4,4-dimercapto azobenzene (4,4-DMAB), formed from
the laser-induced photooxidation of 4-ABT112. Even today, the origin of such b2 bands is still
object of intense debate in the SERS community. For that reason, such discussion is beyond the
scope of this work. Figure 38 shows a comparison between the experimental Raman and SERS
spectra of 4-ABT on Fe3O4@SiO2@Ag, evidencing the arising b2 vibrational modes. The
respective vibrational assignments can be found in Table 4 (Appendix ).
Page 88
88
Figure 38: Raman and SERS spectra of 4-ABT (structure in the inset) and 4-ABT on Fe3O4@SiO2@Ag microflowers.
Both spectra were acquired with a 532 nm laser (7.5 mW power) with 1s accumulation time and 1 acquisition.
Finding the right parameters for the SERS measurements was a difficult task in this
work. The Fe3O4@SiO2@Ag substrate possesses bulk-like properties, leading to high
reflectivity of the sample and a consequent strong background signal. Early SERS
measurements with 4-ABT were performed with the 532 nm laser line, from which experiments
to evaluate the relationship between magnetic aggregation and SERS response were made. The
initial hypothesis was that the higher the particle aggregation, the more numerous hot spots
would be formed, leading to a stronger SERS activity. To test the validity of this idea, SERS
measurements were performed with the substrate dried with and without external magnetic
attraction. From our results (Figure 39), the presence of a magnet led to an increase in the SERS
intensities for 4-ABT 1x10⁻³ mol L-1. However, the spectra for 4-ABT 1x10⁻⁵ mol L-1 indicated
similar SERS efficiencies with and without the external magnet. For that reason, it is difficult
to conclude whether the presence of a magnet effectively increases or hinders the SERS activity.
Nonetheless, one decided to keep the magnet for the subsequent SERS measurements because
this makes it easier to visualize regions rich in particles where the analyte can be deposited.
1000 1100 1200 1300 1400 1500 1600
a1
b2
a1b2a1
b2
b2
a1
Co
unts
/ a
rb. u
n.
Raman shift / cm-1
SERS
Raman
5000 counts
b2
4-ABT
Page 89
89
Figure 39: SERS spectra of 4-ABT at different concentrations on the Fe3O4@SiO2@Ag microflowers dried with (b,d)
and without (a,c) the presence of an external magnet. All the spectra were acquired with a 532 nm laser line (3s
acquisition time, 2 accumulations) from a 100x LWD objective lens. A total of 100 spectra were taken for each map
scan.
The SERS measurements of 4-ABT were performed in mapping mode with three
different laser lines (514 nm, 633 nm, and 785 nm) to determine the most suitable laser for the
substrate. An arbitrary region of the sample was selected and the spectra were acquired for the
different lasers within the same area. Figure 40 shows the mapping scans of 4-ABT 10-3 mol L-
1 on the Fe3O4@SiO2@Ag substrate together with the analyzed region of the sample. Based on
our results, despite the higher background signal, the 633 nm laser showed the best SERS
intensities for 4-ABT. Therefore, the 633 nm wavelength was selected for the measurements
with lower concentrations of 4-ABT. For the microflower substrate, the lowest limit of
detection of 4-ABT was 1x10⁻⁷ mol L-1 due to the detection of the band in 1074 cm-1 at that
concentration (Figure 41).
Page 90
90
Figure 40: SERS spectra of 4-ABT 1x10⁻³ mol L-1 acquired with different lasers – 514 nm (b), 633 nm (c), and 785 nm
(d) – within the same region of the sample (a). Each mapping spectrum contains 150 individual spectra. All the
measurements were acquired with a 100x objective lens with 1s acquisition time and 1 accumulation.
Figure 41: Determination of the limit of detection of 4-ABT. From the SERS spectra, the smallest concentration of 4-
ABT that could be detected was 1x10⁻⁷ mol L-1. All the measurements were acquired with a 100x objective lens with 1s
acquisition time and 1 accumulation. For a better comparison, the SERS spectra of 4-ABT 1x10⁻⁵ mol L-1 have
undergone baseline correction due to the strong background signal. The original spectra can be found in Figure 56
(Appendix B).
Page 91
91
7.5 Fe3O4@SiO2@Ag aptasensor
To facilitate the aptamer linkage to the Fe3O4@SiO2@Ag microflowers, a dithiol serinol
group was incorporated to the 3’-terminus of the aptamer. The presence of a double thiol
termination offers additional sites for bond formation on the metal surface. Moreover, the
structure of dithiol serinol increases the spacing between the recognition region of the aptamer
and the terminal dithiol group in order to reduce the steric hindrance during the aptamer loading.
Before the aptamer addition on the silver substrate, DTT was added to the lyophilized
oligonucleotide. The purpose of DTT addition was to promote the cleavage of the S-S bond to
enable the attachment of the aptamer onto the surface of the Fe3O4@SiO2@Ag microflowers
(Figure 42). Furthermore, the salting process increases the aptamer loading on the particles by
reducing the electrostatic interactions between neighboring oligonucleotides.113 Here, the prior
addition of the surfactant SDS is essential to prevent the particle aggregation induced by the
chloride ions.114
Figure 42: Reaction of aptamer activation by DTT.
Figure 43 shows the absorption spectra of the aptamer before and after the S-S bond
cleavage of the dithiol serinol group. The lyophilized aptamer showed a characteristic
absorption band located at 259 nm. Another band at 216 nm of unknown origin was also
detected. The calculated aptamer concentration dropped from ~1.66x10⁻⁴ mol L-1 to 1.80x10⁻⁵
Page 92
92
mol L-1 after the activation procedure. Since the relative intensity of the unknown band
increased, this suggests that the aptamer might have been damaged from the activation process.
The Fe3O4@SiO2@Ag microflowers provide a high surface area for the aptamer
loading. Nonetheless, it was difficult to establish a protocol for surface functionalization with
the aptamer due to the complex morphology and the variable size of the particles. Moreover,
the Fe3O4@SiO2@Ag microflowers showed low stability in solution during the procedure,
which might have affected the aptamer incorporation. The UV-Vis spectra of the assembled
Fe3O4@SiO2@Ag aptasensor (Figure 44) did not show a significant signal of the aptamer. This
could indicate that either the aptamer is poorly loaded or that the stronger scattering effect of
the microflowers hampers the visualization of the aptamer signal.
Figure 43: UV-Vis absorption spectra of the activated and inactivated cTnI binding aptamer.
200 250 300 350 400 450 500 550 600
257 nm
259 nm
216 nm
Absorb
ance / a
rb. un.
Wavelength / nm
Aptamer after activation
Aptamer before activation
214 nm
0.1 arb. un.
Page 93
93
Figure 44: Comparison between the UV-Vis spectra of the Fe3O4@SiO2@Ag aptasensor (red curve) and the respective
individual Fe3O4@SiO2@Ag (blue) microparticles and aptamer (gray) spectra.
Prior to the SERS measurements with the aptasensor in the presence of cTnI, the
individual SERS spectra of each component were acquired. Due to crystallization of the PBS
buffer during sample preparation, it was difficult to find a region for analysis due to the
interference of the salt crystals. For that reason, the following mapping plots show difference
populations, of which the number of spectra was limited by the available region of analysis.
The SERS spectrum of Troponin I could be successfully acquired and the molecule
showed a good SERS response on the Fe3O4@SiO2@Ag substrate, as shown by the plots in
Figure 45. The aptasensor, on the other hand, did not show any SERS response, according to
the data in Figure 46. In the first moment, it was thought that the absence of the aptamer signal
could reinforce the assumption of unsuccessful aptamer linkage to the microflowers, which
could affect negatively the future measurements with cTnI. Nonetheless, the SERS
measurements with the aptasensor in the presence of cTnI showed some promising results
(Figure 47).
200 250 300 350 400 450 500 550 600
257 nm
215 nmE
xtin
ctio
n /
arb
. un
.
Wavelength / nm
Fe3O4@SiO2@Ag-Apt
Fe3O4@SiO2@Ag flower
Aptamer after activation
214 nm
0.05 arb. un.
Page 94
94
Figure 45: Individual SERS spectrum (a) and SERS mapping (b) of cTnI 1x10⁻³ mol L-1 on the microflowers. In (b), a
total of 15 spectra were acquired from random points of the sample. For better visualization, the spectra in the plot
(b) have undergone baseline subtraction. The original plot can be found in Figure 57 (Appendix B). All the
measurements were carried out with a 785 nm laser with 10s acquisition time and 1 accumulation. The signal was
collected through a 100x objective lens.
Figure 46: SERS measurements in mapping mode performed with the aptasensor. A total of 40 points were obtained
with a 785 nm laser line and a 100x objective lens.
Page 95
95
Figure 47: SERS measurements with the aptasensor in the presence of cTnI at two different concentrations: 1x10⁻⁴
mol L-1 (top) and 1x10⁻⁸ mol L-1 (bottom). On the right, the respective average plots of each SERS spectra in mapping
mode. All the spectra were obtained with a 785 nm laser and collected through a 100x objective lens (10s acquisition
time, 1 scan).
Two concentrations of cTnI were tested in this work, namely 1x10⁻⁴ mol L-1 and 1x10⁻⁸
mol L-1. In both cases, the SERS mapping was performed with 40 different points. Despite the
high signal fluctuation, the average plot of the SERS maps led to a good spectral correlation
with the original cTnI signal (Figure 45). As mentioned before, the absence of the aptamer
signal actually showed to be beneficial for the cTnI detection, leading to a detection capability
lower than the observed for 4-ABT.
Page 96
96
8 CONCLUSIONS AND FINAL REMARKS
The above-mentioned results showed that the proposed Fe3O4@SiO2@Ag microflowers
were successfully synthesized. The experimental properties of the Fe3O4 core and the
Fe3O4@SiO2 core-shell nanoparticles are in agreement with the literature, and both the systems
show high shape uniformity and a narrow size dispersion. In addition, the unsuccessful
experiments for the magnetite synthesis provided important insights into the mechanisms
behind the core formation.
The synthesized Fe3O4@SiO2@Ag microflowers possess an elegant 3D structure with
high surface area for analyte adsorption. Although the particle uniformity can be improved, the
applied sonochemical synthesis represented an easy approach to successfully generate such
anisotropic tridimensional structures. Moreover, the growth mechanism of the microflowers in
this work was not in full agreement with the literature data due to the absence of HCP silver.
Therefore, it is interesting to explore other techniques for crystal structure analysis, such as
HRTEM, to deeply investigate the local crystal features of both the seed and the microflowers
that can induce the symmetry break necessary for the anisotropic growth.
An interesting feature of the microflower structure is the appearance of multiple
plasmon resonance modes, as shown by the experimental extinction spectra. Since the
extinction spectra provided only average information about the system, it was difficult to
distinguish between the individual plasmon modes that may arise from such a complex
structure. This limitation opens the possibility for the use of alternative techniques to enable a
deeper study of surface plasmons in non-traditional morphologies with spatial resolution, such
as Electron Energy-Loss Spectroscopy (EELS).
The measurements of the extinction spectra of the microflowers in the wet and dried
substrates showed in both cases a maximum extinction signal below 400 nm. Nonetheless, the
substrate showed a better SERS efficiency for 4-ABT upon laser excitation in 633 nm, far
beyond the detected peak in the UV region. Given these, it is possible that plasmonic modes of
lower frequencies play an important role in the SERS efficiency for this system. Therefore, one
should highlight in this work the importance of performing measurements with different laser
lines to find the best plasmonic response for the microflower substrate.
The magnetic properties of the system enabled to concentrate the particles in a small
region limited to the size of the applied magnet. Combined with the submicrometer dimension
of the particles, the magnetic aggregation is a useful strategy for the easy detection of particle
Page 97
97
agglomerates on the silicon substrate. Since the regions rich in particles are visually accessible,
the probability of reaching a SERS responsive area is increased. Even so, our results showed
that the magnetic attraction did not lead to an evident increase in the SERS response of the
substrate. This can be related to the natural aggregation trend among the microflowers, even
without an external magnetic field.
Furthermore, the substrate showed a good SERS response for the probe molecule 4-
ABT, especially when considering the significant number of recorded spectra. The detection
limit of 4-ABT in which a reproducible SERS signal could be achieved was reached to a
concentration of 1x10⁻⁷ mol L-1 for the 633 nm laser. However, even lower concentrations could
be detectable if the signal repeatability was unimportant. For instance, Wang and co-workers65
achieved a detection limit of 1x10-14 mol L-1 for R6G for the same type of substrate used in this
work. However, it is not possible to make any statements about the signal reproducibility in
their work since the spectra population is only 5 for each concentration of R6G tested (10-6 to
10-14 mol L-1).
From the measurements with the biomarker troponin I, the substrate showed the ability
to detect the molecule even without the bridging aptamer. Although some uncertainties arose
regarding the effective anchoring of the aptamer onto the microflower structure, the SERS
measurements with the aptasensor in the presence of troponin I led to promising results. For
both the concentrations of cTnI that were tested (1x10⁻⁴ mol L-1 and 1x10⁻⁸ mol L-1), both of
them could be detected from the assembled aptasensor system. Nevertheless, the need to keep
the biomolecule system in physiological conditions introduced an obstacle in the SERS
measurements, due to the crystallization of salts from the saline buffer. Consequently, only a
limited number of spectra could be analyzed without the interference of the macroscopic salt
crystals. As a future perspective, the selectivity and detection capability of the
Fe3O4@SiO2@Ag aptasensor could be tested for the cTnI target in the presence of other
interfering biomolecules. From those studies, the viability of the aptasensor for real samples
can be better determined, opening the field for the large-scale applications of this system in
medical analysis.
Page 98
98
9 REFERENCES
1. Smith, E. & Dent, G. Modern Raman Spectroscopy: a Practical Approach. (Wiley, 2008).
2. Perticaroli, S. et al. Translating chemometric analysis into physiological insights from in
vivo confocal Raman spectroscopy of the human stratum corneum. Biochim. Biophys.
Acta BBA - Biomembr. 1861, 403–409 (2019).
3. Kong, K., Kendall, C., Stone, N. & Notingher, I. Raman spectroscopy for medical
diagnostics — From in-vitro biofluid assays to in-vivo cancer detection. Adv. Drug Deliv.
Rev. 89, 121–134 (2015).
4. Nayak, M. T. & Desa, J. A. E. Roles of iron and lithium in silicate glasses by Raman
spectroscopy. J. Raman Spectrosc. 49, 1507–1513 (2018).
5. Vieira Ferreira, L. F. et al. Spectroscopic characterization of amphorae from the 8th to the
7th c. BCE found at the Almaraz settlement in Almada, Portugal. J. Archaeol. Sci. Rep.
21, 166–174 (2018).
6. Rousaki, A. et al. On-field Raman spectroscopy of Patagonian prehistoric rock art:
Pigments, alteration products and substrata. TrAC Trends Anal. Chem. 105, 338–351
(2018).
7. Ferraro, J. R., Nakamoto, K. & Brown, C. W. Introductory Raman spectroscopy.
(Academic Press, 2003).
8. Le Ru, E. C. & Etchegoin, P. G. Principles of surface-enhanced Raman spectroscopy: and
related plasmonic effects. (Elsevier, 2009).
9. Nafie, L. A. Recent advances in linear and nonlinear Raman spectroscopy. Part XII. J.
Raman Spectrosc. 49, 1874–1906 (2018).
10. Huang, Y.-F. et al. Bridging the Gap between Electrochemical and Organometallic
Activation: Benzyl Chloride Reduction at Silver Cathodes. J. Am. Chem. Soc. 132, 17199–
17210 (2010).
11. Paxton, W. F., Kleinman, S. L., Basuray, A. N., Stoddart, J. F. & Van Duyne, R. P.
Surface-Enhanced Raman Spectroelectrochemistry of TTF-Modified Self-Assembled
Monolayers. J. Phys. Chem. Lett. 2, 1145–1149 (2011).
12. Gu, B., Tio, J., Wang, W., Ku, Y.-K. & Dai, S. Raman Spectroscopic Detection for
Perchlorate at Low Concentrations. Appl. Spectrosc. 58, 741–744 (2004).
13. Qian, X. et al. In vivo tumor targeting and spectroscopic detection with surface-enhanced
Raman nanoparticle tags. Nat. Biotechnol. 26, 83–90 (2008).
14. Beier, H. T. et al. Application of Surface-Enhanced Raman Spectroscopy for Detection of
Beta Amyloid Using Nanoshells. Plasmonics 2, 55–64 (2007).
Page 99
99
15. Luo, Y., Ma, L., Zhang, X., Liang, A. & Jiang, Z. SERS Detection of Dopamine Using
Label-Free Acridine Red as Molecular Probe in Reduced Graphene Oxide/Silver
Nanotriangle Sol Substrate. Nanoscale Res. Lett. 10, (2015).
16. Panneerselvam, R. et al. Surface-enhanced Raman spectroscopy: bottlenecks and future
directions. Chem. Commun. 54, 10–25 (2018).
17. American Chemical Society International Historic Chemical Landmarks. The Raman
Effect. (American Chemical Society, 1998).
18. Raman, C. V. A New Radiation. Indian J. Phys. 2, 387–398 (1928).
19. Raman, C. V. & Krishnan, K. S. A New Type of Secondary Radiation. Nature 121, 501–
502 (1928).
20. Smekal, A. Zur Quantentheorie der Dispersion. Naturwissenschaften 11, 873–875 (1923).
21. Landsberg, G. & Mandelstam, L. Eine neue Erscheinung bei der Lichtzerstreuung in
Krystallen. Naturwissenschaften 16, 557–558 (1928).
22. Fox, M. Optical properties of solids. (Oxford University Press, 2001).
23. Long, D. A. The Raman Effect. (John Wiley & Sons, Ltd, 2002). doi:10.1002/0470845767
24. Sala, O. Fundamentos de Espectroscopia no Raman e no Infravermelho. in Fundamentos
da Espectroscopia Raman e no Infravermelho (Unesp, 2008).
25. Aroca, R. Surface-enhanced vibrational spectroscopy. (Wiley, 2007).
26. Haynes, C. L., Yonzon, C. R., Zhang, X. & Van Duyne, R. P. Surface-enhanced Raman
sensors: early history and the development of sensors for quantitative biowarfare agent
and glucose detection. J. Raman Spectrosc. 36, 471–484 (2005).
27. Fleischmann, M., Hendra, P. J. & McQuillan, A. J. Raman spectra of pyridine adsorbed at
a silver electrode. Chem. Phys. Lett. 26, 163–166 (1974).
28. Jeanmaire, D. L. & Van Duyne, R. P. Surface raman spectroelectrochemistry. J.
Electroanal. Chem. Interfacial Electrochem. 84, 1–20 (1977).
29. Albrecht, M. G. & Creighton, J. A. Anomalously intense Raman spectra of pyridine at a
silver electrode. J. Am. Chem. Soc. 99, 5215–5217 (1977).
30. Van Duyne, R. P. Laser excitation of Raman scattering from adsorbed molecules on
electrode surfaces. in Chemical and biochemical applications of lasers. Vol. 4: ... (ed.
Moore, C. B.) 101–185 (Acad. Press, 1979).
31. Moskovits, M. Surface roughness and the enhanced intensity of Raman scattering by
molecules adsorbed on metals. J. Chem. Phys. 69, 4159–4161 (1978).
32. Creighton, J. A., Blatchford, C. G. & Albrecht, M. G. Plasma resonance enhancement of
Raman scattering by pyridine adsorbed on silver or gold sol particles of size comparable
to the excitation wavelength. J. Chem. Soc. Faraday Trans. 2 75, 790 (1979).
Page 100
100
33. Jensen, L., Aikens, C. M. & Schatz, G. C. Electronic structure methods for studying
surface-enhanced Raman scattering. Chem. Soc. Rev. 37, 1061 (2008).
34. Porter, M. D. & Granger, J. H. Surface-enhanced Raman scattering II: concluding
remarks. Faraday Discuss. 205, 601–613 (2017).
35. Mayer, K. M. & Hafner, J. H. Localized Surface Plasmon Resonance Sensors. Chem. Rev.
111, 3828–3857 (2011).
36. Bittencourt, J. A. Fundamentals of plasma physics. (Springer, 2004).
37. Pines, D. Collective Energy Losses in Solids. Rev. Mod. Phys. 28, 184–198 (1956).
38. Mie, G. Beiträge zur Optik trüber Medien, speziell kolloidaler Metallösungen. Ann. Phys.
330, 377–445 (1908).
39. Kelly, K. L., Coronado, E., Zhao, L. L. & Schatz, G. C. The Optical Properties of Metal
Nanoparticles: The Influence of Size, Shape, and Dielectric Environment. J. Phys. Chem.
B 107, 668–677 (2003).
40. Sharma, B. et al. High-performance SERS substrates: Advances and challenges. MRS
Bull. 38, 615–624 (2013).
41. Kleinman, S. L., Frontiera, R. R., Henry, A.-I., Dieringer, J. A. & Van Duyne, R. P.
Creating, characterizing, and controlling chemistry with SERS hot spots. Phys Chem
Chem Phys 15, 21–36 (2013).
42. Etchegoin, P. et al. Electromagnetic contribution to surface enhanced Raman scattering
revisited. J. Chem. Phys. 119, 5281–5289 (2003).
43. Nie, S. Probing Single Molecules and Single Nanoparticles by Surface-Enhanced Raman
Scattering. Science 275, 1102–1106 (1997).
44. Kneipp, K. et al. Single Molecule Detection Using Surface-Enhanced Raman Scattering
(SERS). Phys. Rev. Lett. 78, 1667–1670 (1997).
45. Michaels, A. M., Nirmal, M. & Brus, L. E. Surface Enhanced Raman Spectroscopy of
Individual Rhodamine 6G Molecules on Large Ag Nanocrystals. J. Am. Chem. Soc. 121,
9932–9939 (1999).
46. Etchegoin, P. G. & Le Ru, E. C. Basic Electromagnetic Theory of SERS. in Surface
enhanced Raman spectroscopy: analytical, biophysical and life science applications (ed.
Schlücker, S.) 1–37 (Wiley-VCH, 2011).
47. Johnson, P. B. & Christy, R. W. Optical Constants of the Noble Metals. Phys. Rev. B 6,
4370–4379 (1972).
48. Johnson, P. & Christy, R. Optical constants of transition metals: Ti, V, Cr, Mn, Fe, Co,
Ni, and Pd. Phys. Rev. B 9, 5056–5070 (1974).
49. Wiley, B. J. et al. Maneuvering the Surface Plasmon Resonance of Silver Nanostructures
through Shape-Controlled Synthesis. J. Phys. Chem. B 110, 15666–15675 (2006).
Page 101
101
50. Kumbhar, A. S., Kinnan, M. K. & Chumanov, G. Multipole Plasmon Resonances of
Submicron Silver Particles. J. Am. Chem. Soc. 127, 12444–12445 (2005).
51. Wiley, B. J. et al. Synthesis and Optical Properties of Silver Nanobars and Nanorice. Nano
Lett. 7, 1032–1036 (2007).
52. Hartland, G. V. Optical Studies of Dynamics in Noble Metal Nanostructures. Chem. Rev.
111, 3858–3887 (2011).
53. Fan, M., Andrade, G. F. S. & Brolo, A. G. A review on the fabrication of substrates for
surface enhanced Raman spectroscopy and their applications in analytical chemistry. Anal.
Chim. Acta 693, 7–25 (2011).
54. Feng, Y. et al. Engineering “Hot” Nanoparticles for Surface-Enhanced Raman Scattering
by Embedding Reporter Molecules in Metal Layers. Small 8, 246–251 (2012).
55. Shen, J., Zhu, Y., Yang, X., Zong, J. & Li, C. Multifunctional Fe3O4@Ag/SiO2/Au Core–
Shell Microspheres as a Novel SERS-Activity Label via Long-Range Plasmon Coupling.
Langmuir 29, 690–695 (2013).
56. Huang, J. et al. Site-Specific Growth of Au–Pd Alloy Horns on Au Nanorods: A Platform
for Highly Sensitive Monitoring of Catalytic Reactions by Surface Enhancement Raman
Spectroscopy. J. Am. Chem. Soc. 135, 8552–8561 (2013).
57. Tao, A. et al. Langmuir−Blodgett Silver Nanowire Monolayers for Molecular Sensing
Using Surface-Enhanced Raman Spectroscopy. Nano Lett. 3, 1229–1233 (2003).
58. Dam, D. H. M., Lee, R. C. & Odom, T. W. Improved in Vitro Efficacy of Gold
Nanoconstructs by Increased Loading of G-quadruplex Aptamer. Nano Lett. 14, 2843–
2848 (2014).
59. Zhang, Q. et al. Seed-Mediated Synthesis of Ag Nanocubes with Controllable Edge
Lengths in the Range of 30−200 nm and Comparison of Their Optical Properties. J. Am.
Chem. Soc. 132, 11372–11378 (2010).
60. Sun, X. & Qin, D. Co-titration of AgNO 3 and HAuCl 4 : a new route to the synthesis of
Ag@Ag–Au core–frame nanocubes with enhanced plasmonic and catalytic properties. J
Mater Chem C 3, 11833–11841 (2015).
61. Barbosa, S. et al. Tuning Size and Sensing Properties in Colloidal Gold Nanostars.
Langmuir 26, 14943–14950 (2010).
62. Pérez-Mayen, L., Oliva, J., Torres-Castro, A. & De la Rosa, E. SERS substrates fabricated
with star-like gold nanoparticles for zeptomole detection of analytes. Nanoscale 7, 10249–
10258 (2015).
63. Rodríguez-Lorenzo, L. et al. Zeptomol Detection Through Controlled Ultrasensitive
Surface-Enhanced Raman Scattering. J. Am. Chem. Soc. 131, 4616–4618 (2009).
64. Li, J.-F., Zhang, Y.-J., Ding, S.-Y., Panneerselvam, R. & Tian, Z.-Q. Core–Shell
Nanoparticle-Enhanced Raman Spectroscopy. Chem. Rev. 117, 5002–5069 (2017).
Page 102
102
65. Wang, C. et al. Sonochemical synthesis of highly branched flower-like Fe3O4@SiO2@Ag
microcomposites and their application as versatile SERS substrates. Nanoscale 8, 19816–
19828 (2016).
66. World Health Organization. WHO | Cardiovascular diseases (CVDs). WHO (2016).
Available at: http://www.who.int/mediacentre/factsheets/fs317/en/. (Accessed: 8th April
2017)
67. Fathil, M. F. M. et al. Diagnostics on acute myocardial infarction: Cardiac troponin
biomarkers. Biosens. Bioelectron. 70, 209–220 (2015).
68. Jo, H. et al. Electrochemical Aptasensor of Cardiac Troponin I for the Early Diagnosis of
Acute Myocardial Infarction. Anal. Chem. 87, 9869–9875 (2015).
69. Dorraj, G. S., Rassaee, M. J., Latifi, A. M., Pishgoo, B. & Tavallaei, M. Selection of DNA
aptamers against Human Cardiac Troponin I for colorimetric sensor based dot blot
application. J. Biotechnol. 208, 80–86 (2015).
70. Abdolrahim, M. et al. Development of optical biosensor technologies for cardiac troponin
recognition. Anal. Biochem. 485, 1–10 (2015).
71. Ko, S., Kim, B., Jo, S.-S. J., Oh, S. Y. & Park, J.-K. Electrochemical detection of cardiac
troponin I using a microchip with the surface-functionalized poly(dimethylsiloxane)
channel. Biosens. Bioelectron. 23, 51–59 (2007).
72. Dutra, R. F., Mendes, R. K., Lins da Silva, V. & Kubota, L. T. Surface plasmon resonance
immunosensor for human cardiac troponin T based on self-assembled monolayer. J.
Pharm. Biomed. Anal. 43, 1744–1750 (2007).
73. Song, K.-M., Lee, S. & Ban, C. Aptamers and Their Biological Applications. Sensors 12,
612–631 (2012).
74. Song, S., Wang, L., Li, J., Fan, C. & Zhao, J. Aptamer-based biosensors. TrAC Trends
Anal. Chem. 27, 108–117 (2008).
75. Proske, D., Blank, M., Buhmann, R. & Resch, A. Aptamers—basic research, drug
development, and clinical applications. Appl. Microbiol. Biotechnol. 69, 367–374 (2005).
76. Famulok, M., Hartig, J. S. & Mayer, G. Functional Aptamers and Aptazymes in
Biotechnology, Diagnostics, and Therapy. Chem. Rev. 107, 3715–3743 (2007).
77. Yang, L. et al. Aptamer-conjugated nanomaterials and their applications. Adv. Drug Deliv.
Rev. 63, 1361–1370 (2011).
78. Wang, H., Yang, R., Yang, L. & Tan, W. Nucleic Acid Conjugated Nanomaterials for
Enhanced Molecular Recognition. ACS Nano 3, 2451–2460 (2009).
79. Wang, Y. et al. SERS opens a new way in aptasensor for protein recognition with high
sensitivity and selectivity. Chem. Commun. 5220 (2007). doi:10.1039/b709492b
Page 103
103
80. Carvalho, B. da C., Andrade Corbi, F. C., Sigoli, F. A. & Mazali, I. O. Precursor
dissolution temperature as a size-controller in Fe3O4 submicrospheres syntheses and their
effect in the catalytic degradation of Rhodamine B. RSC Adv 6, 38617–38623 (2016).
81. Zhang, K. et al. Silver coated magnetic microflowers as efficient and recyclable catalysts
for catalytic reduction. New J. Chem. 41, 14199–14208 (2017).
82. Gerstein, A. S. Nucleotides, Oligonucleotides,and Polynucleotides. in Molecular biology
problem solver a laboratory guide (ed. Gerstein, A. S.) 267–289 (Wiley-Liss, 2002).
83. Cantor, C. R., Warshaw, M. M. & Shapiro, H. Oligonucleotide interactions. III. Circular
dichroism studies of the conformation of deoxyoligonucleolides. Biopolymers 9, 1059–
1077 (1970).
84. Cavaluzzi, M. J. Revised UV extinction coefficients for nucleoside-5’-monophosphates
and unpaired DNA and RNA. Nucleic Acids Res. 32, 13e – 13 (2004).
85. De Graef, M. & McHenry, M. E. Structure of materials: an introduction to
crystallography, diffraction and symmetry. (Cambridge University Press, 2007).
86. Cornell, R. M. & Schwertmann, U. The iron oxides: structure, properties, reactions,
occurrences, and uses. (Wiley-VCH, 2003).
87. Huheey, J. E., Keiter, E. A. & Keiter, R. L. Inorganic chemistry: principles of structure
and reactivity. (HarperCollins College Publishers, 1993).
88. Zhang, D., Lu, C., Ni, Y., Xu, Z. & Zhang, W. Effect of water on size-controllable
synthesis of mesoporous Fe3O4 microspheres and their applications in waste water
treatment. CrystEngComm 15, 4755 (2013).
89. Zhu, M. & Diao, G. Synthesis of Porous Fe3O4 Nanospheres and Its Application for the
Catalytic Degradation of Xylenol Orange. J. Phys. Chem. C 115, 18923–18934 (2011).
90. Fan, T., Pan, D. & Zhang, H. Study on Formation Mechanism by Monitoring the
Morphology and Structure Evolution of Nearly Monodispersed Fe3O4 Submicroparticles
with Controlled Particle Sizes. Ind. Eng. Chem. Res. 50, 9009–9018 (2011).
91. Larcher, D., Sudant, G., Patrice, R. & Tarascon, J.-M. Some Insights on the Use of
Polyols-Based Metal Alkoxides Powders as Precursors for Tailored Metal-Oxides
Particles. Chem. Mater. 15, 3543–3551 (2003).
92. Cao, S.-W., Zhu, Y.-J., Ma, M.-Y., Li, L. & Zhang, L. Hierarchically Nanostructured
Magnetic Hollow Spheres of Fe3O4 and γ-Fe2O3: Preparation and Potential Application in
Drug Delivery. J. Phys. Chem. C 112, 1851–1856 (2008).
93. Cao, S.-W., Zhu, Y.-J. & Chang, J. Fe3O4 polyhedral nanoparticles with a high
magnetization synthesized in mixed solvent ethylene glycol–water system. New J. Chem.
32, 1526 (2008).
94. Yu, D. et al. Oriented Assembly of Fe3O4 Nanoparticles into Monodisperse Hollow
Single-Crystal Microspheres. J. Phys. Chem. B 110, 21667–21671 (2006).
Page 104
104
95. de Dios, A. S. & Díaz-García, M. E. Multifunctional nanoparticles: Analytical prospects.
Anal. Chim. Acta 666, 1–22 (2010).
96. The Colloid chemistry of silica: developed from a symposium sponsored by the Division
of Colloid and Surface Chemistry, at the 200th National Meeting of the American
Chemical Society, Washington, DC, August 26-31, 1990. (American Chemical Society,
1994).
97. Stöber, W., Fink, A. & Bohn, E. Controlled growth of monodisperse silica spheres in the
micron size range. J. Colloid Interface Sci. 26, 62–69 (1968).
98. Yang, D., Hu, J. & Fu, S. Controlled Synthesis of Magnetite−Silica Nanocomposites via
a Seeded Sol−Gel Approach. J. Phys. Chem. C 113, 7646–7651 (2009).
99. Loza, K. et al. The dissolution and biological effects of silver nanoparticles in biological
media. J. Mater. Chem. B 2, 1634 (2014).
100. Liu, T., Li, D., Yang, D. & Jiang, M. Fabrication of Flower-Like Silver Structures through
Anisotropic Growth. Langmuir 27, 6211–6217 (2011).
101. Zhou, N., Li, D. & Yang, D. Morphology and composition controlled synthesis of flower-
like silver nanostructures. Nanoscale Res. Lett. 9, 302 (2014).
102. Xia, Y., Xia, X. & Peng, H.-C. Shape-Controlled Synthesis of Colloidal Metal
Nanocrystals: Thermodynamic versus Kinetic Products. J. Am. Chem. Soc. 137, 7947–
7966 (2015).
103. Lim, B. & Xia, Y. Metal Nanocrystals with Highly Branched Morphologies. Angew.
Chem. Int. Ed. 50, 76–85 (2011).
104. Wu, T. Y., Guo, N., Teh, C. Y. & Hay, J. X. W. Theory and Fundamentals of Ultrasound.
in Advances in Ultrasound Technology for Environmental Remediation 5–12 (Springer
Netherlands, 2013). doi:10.1007/978-94-007-5533-8_2
105. Lange’s handbook of chemistry. (McGraw-Hill, 2005).
106. Liu, T., Li, D., Yang, D. & Jiang, M. Preparation of echinus-like SiO2@Ag structures with
the aid of the HCP phase. Chem. Commun. 47, 5169 (2011).
107. Yang, C. C. & Li, S. Size-Dependent Phase Stability of Silver Nanocrystals. J. Phys.
Chem. C 112, 16400–16404 (2008).
108. Liu, X., Luo, J. & Zhu, J. Size Effect on the Crystal Structure of Silver Nanowires. Nano
Lett. 6, 408–412 (2006).
109. Grouchko, M., Popov, I., Uvarov, V., Magdassi, S. & Kamyshny, A. Coalescence of Silver
Nanoparticles at Room Temperature: Unusual Crystal Structure Transformation and
Dendrite Formation Induced by Self-Assembly. Langmuir 25, 2501–2503 (2009).
110. Lou, X. W., Yuan, C. & Archer, L. A. An Unusual Example of Hyperbranched Metal
Nanocrystals and Their Shape Evolution. Chem. Mater. 18, 3921–3923 (2006).
Page 105
105
111. Osawa, M., Matsuda, N., Yoshii, K. & Uchida, I. Charge transfer resonance Raman
process in surface-enhanced Raman scattering from p-aminothiophenol adsorbed on
silver: Herzberg-Teller contribution. J. Phys. Chem. 98, 12702–12707 (1994).
112. Huang, Y.-F. et al. When the Signal Is Not from the Original Molecule To Be Detected:
Chemical Transformation of para -Aminothiophenol on Ag during the SERS
Measurement. J. Am. Chem. Soc. 132, 9244–9246 (2010).
113. Hurst, S. J., Lytton-Jean, A. K. R. & Mirkin, C. A. Maximizing DNA Loading on a Range
of Gold Nanoparticle Sizes. Anal. Chem. 78, 8313–8318 (2006).
114. Hill, H. D., Millstone, J. E., Banholzer, M. J. & Mirkin, C. A. The Role Radius of
Curvature Plays in Thiolated Oligonucleotide Loading on Gold Nanoparticles. ACS Nano
3, 418–424 (2009).
Page 106
106
APPENDIX A
Synthesis of Fe3O4@SiO2-Ag seeds with butylamine as reductant and Fe3O4@SiO2@Ag
microflower formation
According to the results of Wang and co-workers65, for the Ag petals to grow, the silver
seeds must have between 10 and 30 nm size. Otherwise, the flower microtructure is not formed
in the subsequent step. They were able to successfully tune the seed size by varying the
concentration of silver nitrate from 0.25 to 1 mmol L-1. However, in our experiments, those
concentrations showed to be too low produce a substantial amount of seeds. For that reason,
various tests were performed with higher concentrations of silver nitrate, from 1 to 3 mM. The
molar ratio of AgNO3 to butylamine was always kept as 1, in agreement with the reference
work. Nonetheless, the TEM micrographs showed that the seeds did not grow to a significant
degree with increasing silver nitrate concentration. For instance, for [AgNO3] = 1.25 and 3mmol
L-1, seeds with a mean size of respectively 4 ± 1 nm and 6 ± 2 nm were obtained (Figure 49).
Figure 48: TEM images of Fe3O4@SiO2-Ag seeds synthesized by Wang and co-workers with different AgNO3
concentrations: 0.25 (a), 0.5 (b), 0.75 (c), and 1 mmol L-1 (d). Reproduced from ref. 65.
Page 107
107
Figure 49: TEM micrographs of Fe3O4@SiO2-Ag seeds synthesized with (a) 1.25 mmol L-1 and (b) 3 mmol L-1 of
AgNO3; c) Seeds (a) in higher magnification; d) EDS elemental mapping of the nanoparticle.
The difficulties in reaching the critical size of Ag seeds reflected directly on the growing
efficiency of the Ag tips. In the first experiments, the ultrasonic bath was employed to perform
the growth of the silver microflowers. However, the ultrasonic bath was unable to properly
diffuse the reagents because of the high volume of the reaction medium, leading to weak and
unequal sonication. From those experiments (Figure 50), an extremely low yield of Ag
microflowers was obtained, of which most of them were of core-free Ag nanoparticles.
Nanoparticles with an irregular silver shell were also produced, probably because the reductants
were not completely diffused when PVP was added.
In face of this problem, mechanical stirring was used to evaluate the effect of sonication
and to improve the diffusion of the precursors. Yet, the experiment led to even more irregular
silver nanoparticles (Figure 51). Since no silver microflowers were observed, one can say that
sonication is essential to produce such anisotropic structures.
Page 108
108
Figure 50: TEM micrographs of core-free Ag microflowers (left) and Fe3O4@SiO2@Ag nanoparticles (right)
synthesized by ultrasonic bath.
Figure 51: STEM images of Fe3O4@SiO2-Ag nanoparticles synthesized by mechanical stirring.
Another hypothesis emerged to explain the unsuccessful deposition of silver onto the
preformed seeds in the growth step. The possibility of remaining butylamine coordinated with
Ag seeds was considered since silver has high affinity for amine groups and forms stable
coordination compounds with those ligands. In this sense, the complex could be then hindering
the deposition of freshly reduced silver atoms onto the seeds. Nevertheless, the hypothesis was
rapidly discarded based on the ATR-FTIR spectra of the Fe3O4@SiO2-Ag seeds, which did not
show any band that could indicate the presence of butylamine (Figure 52).
Page 109
109
Figure 52: Comparison between the ATR-FTIR spectra of synthesized Fe3O4@SiO2 and Fe3O4@SiO2-Ag seed
nanoparticles.
By using a sonication probe on the growth step, the reaction medium rapidly turned gray
after adding the precursors, indicating a substantial reduction of Ag+ ions to Ag0. As indicated
by the TEM and EFTEM micrographs (Figure 53), it is noticeable that better results were
achieved from this route. Although the reaction yield is still low, a considerable amount of
silver microflowers were formed. The high contrast of EFTEM micrographs confirms the
presence of Fe3O4@SiO2 in the microstructures. According to the literature65,81, a strong UV-
Vis absorption peak between 350 and 380 nm depending on the petal length indicates the
formation of Fe3O4@SiO2-Ag microflowers (Figure 54). In those spectra, the peaks relative to
Fe3O4@SiO2 are no longer observed, because silver forms a continuous shell on the
nanoparticle surface. In the experimental UV-Vis absorption spectrum, however, only a discrete
signal centered at approximately 352 nm is present (Figure 55). The LSPR peak of silver is
almost entirely covered by the Fe3O4@SiO2 band, which reflects the low yield of microflowers
Page 110
110
and poor silver coverage. Given these, one concluded that the Ag seed size should be increased
in order to increase the reaction yield of microflower formation. Therefore, new experiments
were performed with Sn2+ as reductant, which led to much better results in comparison to the
previous experiments with butylamine.
Figure 53: Bright-field images (a,c) and the respective EFTEM micrographs (b,d, 110 eV energy loss) of
Fe3O4@SiO2@Ag flowers synthesized by using an ultrasonic probe.
Page 111
111
Figure 54: Characteristic UV-Vis absorption spectra of Fe3O4@SiO2@Ag microflowers synthesized at different
AgNO3 concentrations. Reproduced from ref. 65.
Figure 55: UV-Vis absorption spectra of synthesized Fe3O4@SiO2-Ag seed and Fe3O4@SiO2@Ag flower.
Page 112
112
APPENDIX B
Supplementary material of SERS measurements
Table 4: Raman and SERS vibrational assignments of solid 4-ABT and 4-ABT on Fe3O4@SiO2@Ag substrate,
respectively.
Experimental Raman signal
of 4-ABT / cm-1
Experimental SERS signal
of 4-ABT on
Fe3O4@SiO2@Ag
substrate / cm-1
Vibrational Assignment111
1007 1006 γ(C-C) + γ(C-C-C) (a1)
1086 1074 ν(C-S) (a1)
- 1142 δ(C-H) (b2)
1178 - δ(C-H) (a1)
- 1189 δ(C-H) (a1)
- 1302 δ(C-H) + ν(C-C) (b2)
- 1390 ν(C-C) + δ(C-H) (b2)
- 1441 ν(C-C) + δ(C-H) (b2)
- 1474 ν(C-C) + δ(C-H) (a1)
1495 - ν(C-C) + δ(C-H) (a1)
- 1577 ν(C-C) (b2)
1592 - ν(C-C) (a1)
Page 113
113
Figure 56: Original SERS spectra of 4-ABT 1x10⁻⁵ mol L-1 at 633 nm excitation laser. All the spectra were acquired
with a 100x objective lens with 1s acquisition time and 1 accumulation.
Figure 57: Original SERS spectra in mapping mode of cTnI on the microflowers. All the measurements were acquired
with a 100x objective lens with 10s acquisition time and 1 accumulation. A total of 15 spectra were acquired from
random points of the sample.
800 1000 1200 1400 1600 1800
10000
15000
20000
25000
30000
35000
40000
45000
5
10
cTnI on Fe3O4@SiO2@Ag microflowers
785 nm laser; 10 s acquisition time; 1 scan
Raman shift / cm-1
Co
un
ts