UNIVERSIDADE ESTADUAL DE CAMPINAS INSTITUTO DE BIOLOGIA THAÍS HELENA SILVA FERREIRA AVALIAÇÃO DO PAPEL DA SUBUNIDADE II DA ATP SINTASE NA TOLERÂNCIA A ESTRESSES ABIÓTICOS EM CANA-DE-AÇÚCAR. ASSESSING THE ROLE IN TOLERANCE OF THE ATP SYNTHASE SUBUNIT II UNDER ABIOTIC STRESS IN SUGARCANE. CAMPINAS (2016)
Transcript
UNIVERSIDADE ESTADUAL DE CAMPINAS
INSTITUTO DE BIOLOGIA
THAÍS HELENA SILVA FERREIRA
AVALIAÇÃO DO PAPEL DA SUBUNIDADE II DA ATP
SINTASE NA TOLERÂNCIA A ESTRESSES ABIÓTICOS EM
CANA-DE-AÇÚCAR.
ASSESSING THE ROLE IN TOLERANCE OF THE ATP
SYNTHASE SUBUNIT II UNDER ABIOTIC STRESS IN
SUGARCANE.
CAMPINAS
(2016)
THAÍS HELENA SILVA FERREIRA
AVALIAÇÃO DO PAPEL DA SUBUNIDADE II DA ATP SINTASE NA TOLERÂNCIA A ESTRESSES ABIÓTICOS EM CANA-DE-AÇÚCAR
ASSESSING THE ROLE IN TOLERANCE OF THE ATP SYNTHASE SUBUNIT II UNDER ABIOTIC STRESS IN SUGARCANE.
Tese apresentada ao Instituto de Biologia da Universidade Estadual de Campinas como parte dos requisitos exigidos para a obtenção do Título de Doutora em Genética e Biologia Molecular, na área de Genética vegetal e Melhoramento.
Thesis presented to the Institute of Biology of the University of Campinas in partial fulfillment of the requirements for the degree of Genetic and Molecular Biology in Plant Genetics and Breeding.
Orientador: MARCELO MENOSSI TEIXEIRA
CAMPINAS
(2016)
ESTE ARQUIVO DIGITAL CORRESPONDE À
VERSÃO FINAL DA TESE DEFENDIDA PELA
ALUNA THAÍS HELENA SILVA FERREIRA E
ORIENTADA PELO MARCELO MENOSSI
TEIXEIRA.
Agência(s) de fomento e nº(s) de processo(s): FAPESP, 2012/06908-1; CNPq,
211317/2013-6
Ficha catalográfica
Universidade Estadual de Campinas
Biblioteca do Instituto de Biologia
Mara Janaina de Oliveira - CRB 8/6972
Ferreira, Thaís Helena Silva, 1986-
F413a FerAvaliação do papel da subunidade II da ATP sintase na tolerância a
estresses abióticos em cana-de-açúcar / Thaís Helena Silva Ferreira. –
Campinas, SP : [s.n.], 2016.
FerOrientador: Marcelo Menossi Teixeira.
FerTese (doutorado) – Universidade Estadual de Campinas, Instituto de
Figura 1: A: Sequência completa do gene que codifica a subunidade II da ATP sintase obtida a partir do sequenciamento do genoma de cana-de-açúcar. B: Sequência proteica deduzida.
Para confirmar a provável função da proteína codificada pelo gene alvo, foi
gerada uma árvore filogenética de máxima verossimilhança seguindo o modelo de evolução
de sequências WAG (Whelan and Goldman, 2001), para confirmar a homologia entre a
sequência alvo de cana e as subunidades II da ATP sintase de cloroplasto de outras espécies
de plantas (Figura 2).
Figura 2: Árvore de máxima verossimilhança da subunidade alvo de cana-de-açúcar (Ssp) e as subunidades β, I e II da ATP sintase de cinco espécies de plantas. A subunidade da ATP sintase de cana-de-açúcar está destacada por uma flecha vermelha. Os grupos estão divididos de acordo com a subunidade. Grupo 1: subunidade II, Grupo 2: subunidade I e Grupo 3: subunidade β. O valor de bootstrap é baseado em 1000 réplicas e está indicado abaixo de cada nó. Os Loci estão especificados na tabela 1.
Para tal, foi realizado o alinhamento múltiplo entre as sequências proteicas da
subunidade alvo de cana-de-açúcar e das subunidades β, I e II de quatro espécies de
gramíneas (Oryza sativa, Brachypodium distachyon, Zea mays e Sorghum bicolor) e uma
dicotiledônea (Arabidopsis thaliana) (Tabela 1). Para as comparações foram escolhidas uma
19
subunidade catalítica proveniente do genoma do cloroplasto (β) e a subunidades I, já que I e
II são estruturalmente e funcionalmente parecidas, sendo provenientes do mesmo gene
ancestral (Herrmann et al., 1993; Michl et al., 1999).
Tabela 1: Loci utilizados nas análises filogenéticas.
Sequências provenientes dos seguintes bancos de dados: Phytozome e GenBank
As diferentes subunidades foram divididas em três grupos distintos (Grupo 1:
subunidade II, Grupo 2: subunidade I e Grupo 3: subunidade β). A subunidade de cana-de-
açúcar faz parte do grupo 1, que representa as relações filogenéticas entre a subunidade II
de ATP sintase de diferentes plantas, indicando que o gene isolado de cana-de-açúcar
codifica a subunidade II da ATP sintase de cloroplasto. O gene foi então nomeado ScatpG.
Locus EspécieSubunidade
daATPsintase
OrniCp031 Oryzasativa Β
OrniCp020 Oryzasativa I
Os03g17070 Oryzasativa II
BrdiC_p032 Brachypodiumdistachyon Β
BrdiC_p021 Brachypodiumdistachyon I
Bradi3g56270 Brachypodiumdistachyon II
ZemaCp031 Zeamays Β
ZemaCp019 Zeamays I
GRMZM5G825759 Zeamays II
SobiCp028 Sorghumbicolor Β
SobiCp018 Sorghumbicolor I
Sb01g039270 Sorghumbicolor II
BAA84392.1 Arabidopsisthaliana Β
BAA84371 Arabidopsisthaliana I
AT4G32260 Arabidopsisthaliana II
20
Após amplificação com primers específicos para o gene ScatpG, a região
codificante do gene foi clonada no vetor pTZ57R/T e a confirmação foi feita por digestão
com as enzimas BamHI + XbaI e SacI (Figura 3) e por sequenciamento.
Figura 3: Digestão enzimática do plasmídeo pTZ57R/T contendo o gene ScatpG. L: marcador de peso molecular Gene Ruler 1KB Plus (Thermo Scientific). C: plasmídio sem digerir. P1-P4: Plasmídeos provenientes de colônias isoladas 1 a 4. D1: Dupla digestão com enzimas BamHI e XbaI (padrão de bandas esperado: 2.876 pb e 654 pb). D2: Digestão com enzima SacI (padrão esperado de bandas: 2.977 pb, 379 pb e 174 pb).
Como parte do conhecimento funcional dessa subunidade e confirmação da
obtenção do gene da subunidade II de cloroplasto, foi realizada a localização subcelular
dessa subunidade fusionada à proteína GFP através da agroinfiltração de folhas de Nicotiana
benthamiana. Conforme pode ser observado na Figura 4, a construção pGWB7:ScatpG:GFP,
contendo uma fusão da proteína ScATPG com a proteína GFP, tem uma colocalização com
cloroplastos.
Figura 4: Microscopia confocal revelando a localização subcelular da proteína referente à subunidade II da ATP sintase de cana-de-açúcar fusionada a GFP e agroinfiltrada em folhas de Nicotiana benthamiana. A: luz branca. B: mRFP (controle citoplasmático). C: auto-fluorescência cloroplasto (controle de cloroplasto). D: pGWB7:ScatpG:GFP. E: combinação das imagens B, C e D.
Produção de plantas transgênicas de cana-de-açúcar superexpressando o gene que codifica
a subunidade II da ATP sintase de cana-de-açúcar.
Plantas transgênicas de cana-de-açúcar superexpressando o gene ScatpG foram
produzidas para verificar se, assim como em tabaco, elas apresentam tolerância a estresses
abióticos.
21
O fragmento correspondente ao gene da subunidade II da ATP sintase de cana-
de-açúcar foi clonado sob controle do promotor Ubi1 de milho e terminador 3´ NOS no vetor
de expressão pUBILN (Camargo, 2007). O vetor utilizado para transformação de cana-de-
açúcar foi denominado pUBILN:ScatpG (Figura 5). Discos foliares embriogênicos e calos de
cana-de-açúcar da variedade australiana Q208 foram co-bombardeados em experimentos de
transformação, com os vetores pUBILN:ScatpG e com o vetor pUKN (SRA, AU) que confere
resistência à geneticina, antibiótico utilizado para seleção em meio de cultura dos eventos
transformados.
Figura 5. A: Diagrama do vetor pUBLIN:ScatpG. O gene que codifica a subunidade II da ATPsintase de cana-de-açúcar foi clonado sob controle do promotor Ubi1 de milho e terminador 3´ NOS. Os sítios de restrição das enzimas mais relevantes são indicados. O plasmídeo possui resistência ao antibiótico ampicilina para seleção em bactéria.
Foram produzidos 18 eventos independentes de transformação, confirmados por
PCR de DNA genômico de folha (Figura 6). As reações foram realizadas com
oligonucleotídeos específicos para a amplificação do cassete de expressão pUBI:ScatpG:NOS,
nas quais o primer direto anela-se ao gene alvo enquanto o primer reverso anela-se ao
terminador NOS.
Figura 6: PCR de DNA genômico de folha dos 18 eventos de cana-de-açúcar usando primers específicos para a confirmação da integração do cassete de expressão. L: Marcador de peso
22
molecular Gene Ruler 1KB (Thermo Scientific, USA). C+: Controle positivo (vetor pUBILN:ScatpG). C-: Controle negativo (água). WT: Selvagem. Tamanho da banda esperado: 431 pb. Primer direto liga-se ao gene alvo enquanto o primer reverso liga-se ao terminador NOS.
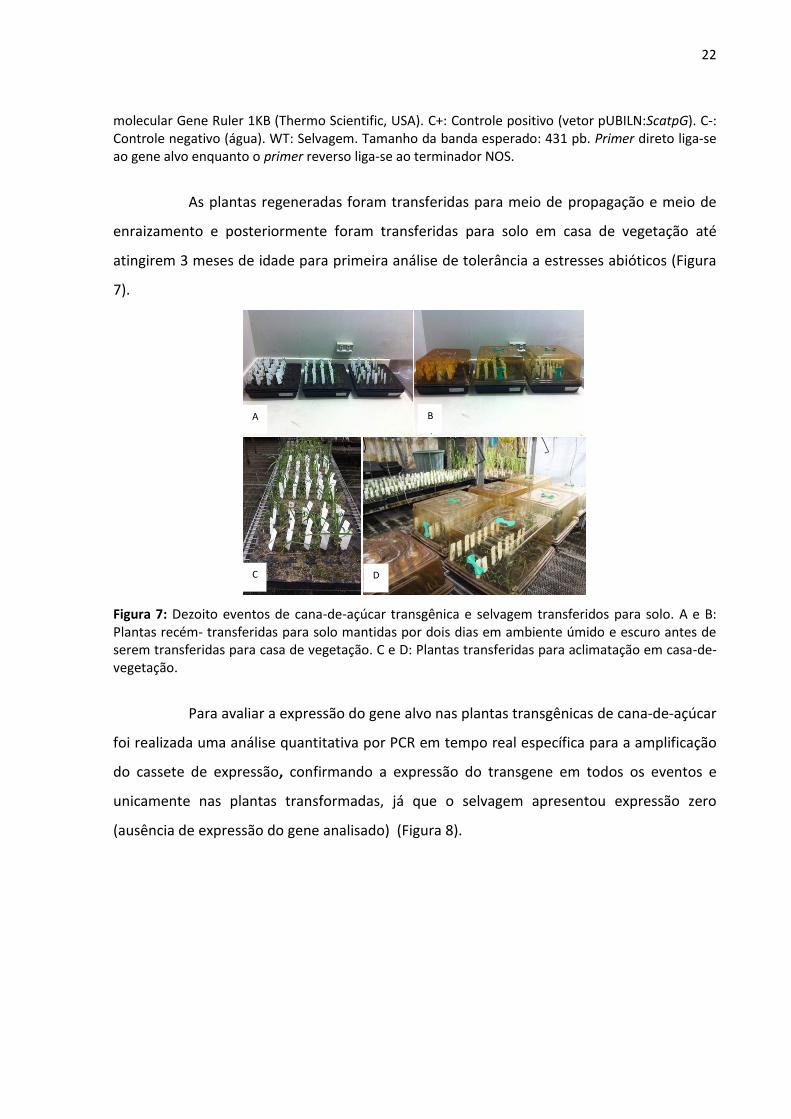
As plantas regeneradas foram transferidas para meio de propagação e meio de
enraizamento e posteriormente foram transferidas para solo em casa de vegetação até
atingirem 3 meses de idade para primeira análise de tolerância a estresses abióticos (Figura
7).
Figura 7: Dezoito eventos de cana-de-açúcar transgênica e selvagem transferidos para solo. A e B: Plantas recém- transferidas para solo mantidas por dois dias em ambiente úmido e escuro antes de serem transferidas para casa de vegetação. C e D: Plantas transferidas para aclimatação em casa-de-vegetação.
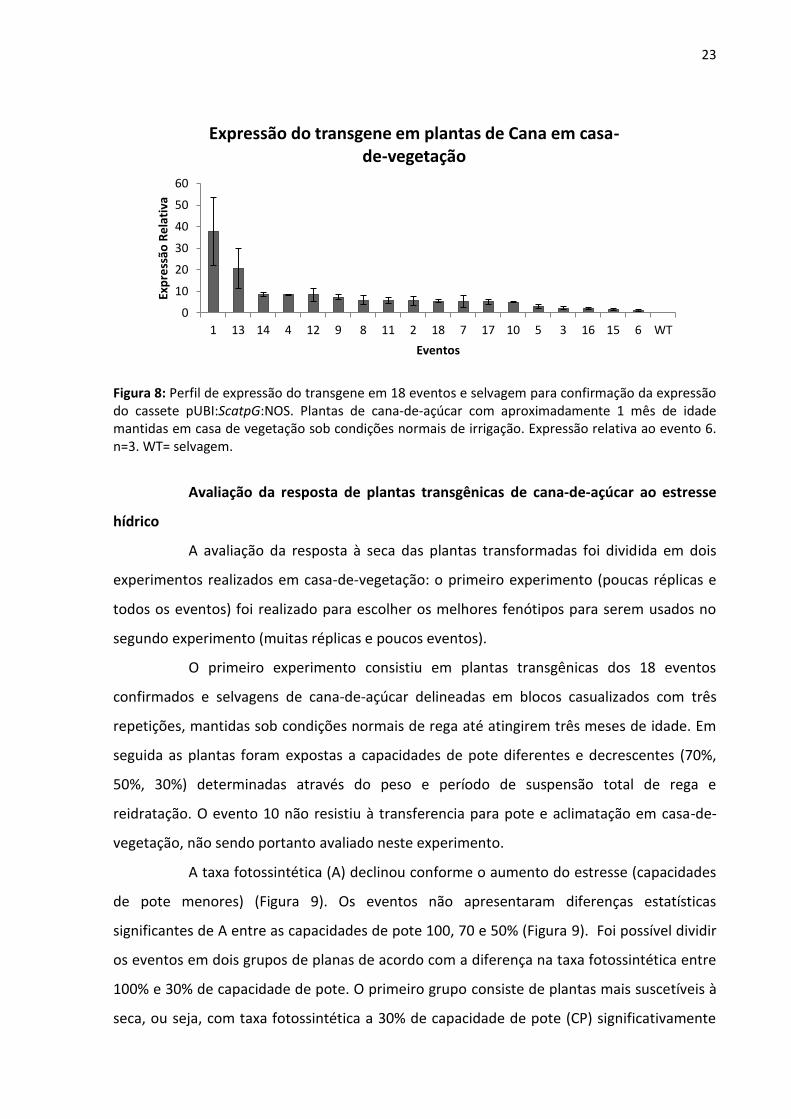
Para avaliar a expressão do gene alvo nas plantas transgênicas de cana-de-açúcar
foi realizada uma análise quantitativa por PCR em tempo real específica para a amplificação
do cassete de expressão, confirmando a expressão do transgene em todos os eventos e
unicamente nas plantas transformadas, já que o selvagem apresentou expressão zero
(ausência de expressão do gene analisado) (Figura 8).
A B
C D
23
Figura 8: Perfil de expressão do transgene em 18 eventos e selvagem para confirmação da expressão do cassete pUBI:ScatpG:NOS. Plantas de cana-de-açúcar com aproximadamente 1 mês de idade mantidas em casa de vegetação sob condições normais de irrigação. Expressão relativa ao evento 6. n=3. WT= selvagem.
Avaliação da resposta de plantas transgênicas de cana-de-açúcar ao estresse
hídrico
A avaliação da resposta à seca das plantas transformadas foi dividida em dois
experimentos realizados em casa-de-vegetação: o primeiro experimento (poucas réplicas e
todos os eventos) foi realizado para escolher os melhores fenótipos para serem usados no
segundo experimento (muitas réplicas e poucos eventos).
O primeiro experimento consistiu em plantas transgênicas dos 18 eventos
confirmados e selvagens de cana-de-açúcar delineadas em blocos casualizados com três
repetições, mantidas sob condições normais de rega até atingirem três meses de idade. Em
seguida as plantas foram expostas a capacidades de pote diferentes e decrescentes (70%,
50%, 30%) determinadas através do peso e período de suspensão total de rega e
reidratação. O evento 10 não resistiu à transferencia para pote e aclimatação em casa-de-
vegetação, não sendo portanto avaliado neste experimento.
A taxa fotossintética (A) declinou conforme o aumento do estresse (capacidades
de pote menores) (Figura 9). Os eventos não apresentaram diferenças estatísticas
significantes de A entre as capacidades de pote 100, 70 e 50% (Figura 9). Foi possível dividir
os eventos em dois grupos de planas de acordo com a diferença na taxa fotossintética entre
100% e 30% de capacidade de pote. O primeiro grupo consiste de plantas mais suscetíveis à
seca, ou seja, com taxa fotossintética a 30% de capacidade de pote (CP) significativamente
0
10
20
30
40
50
60
1 13 14 4 12 9 8 11 2 18 7 17 10 5 3 16 15 6 WT
Exp
ress
ão R
ela
tiva
Eventos
Expressão do transgene em plantas de Cana em casa-de-vegetação
24
menor que a taxa observada em plantas com 100% de CP. O segundo grupo, na maioria dos
eventos, apresentou taxas fotossintéticas a 30% de CP também inferiores às taxas
observadas a 100% de CP, mas essas diferenças foram menores e não significativas
estatisticamente (Figura 9). Dessa forma, a maioria dos eventos (E4, E7, E12, E5, E16, E11,
E6, E14, E8, E9 e E1) sofre menos com o estresse, mantendo a taxa de fotossíntese,
enquanto que os eventos 15, 18, 17, 2, 13 e 12 mais o selvagem sofrem mais com o estresse,
apresentando um declínio significativo da mesma (Figura 9).
Figura 9: Fotossíntese (A) de plantas transgênicas e selvagem de cana-de-açúcar com três meses mantidas em casa- de-vegetação sob diferentes capacidades de pote. n=3. ANOVA F (p=0.00) e teste Tukey (Alpha=0,05). CP= capacidade de pote. WT= selvagem. *= diferenças estatísticas significativas entre capacidade de pote 100% e 30% de um mesmo evento.
Os eventos também apresentaram uma variação pequena e não estatisticamente
significativa de tamanho (Figura 10A) e de crescimento durante o experimento (Figura 10B).
Análises de correlação linear entre a expressão relativa do transgene e o tamanho das
plantas antes do estresse, o crescimento durante o experimento e a fotossíntese durante o
estresse de 30% de capacidade de pote apresentaram uma correlação linear fraca, já que os
valores dos coeficientes de determinação são muito próximos de zero (Figura 11).
25
Figura 10: A: Altura do caule de plantas transgênicas e selvagem de cana-de-açúcar inicialmente com três meses de idade mantidas em casa-de-vegetação sob diferentes capacidades de pote durante 1 mês de experimento. A, AB e B = grupos estatísticos segundo ANOVA com significante F (p=0,02) e teste de Tukey (Alpha=0,05) para capacidade de pote 100%. B: Crescimento (diferença entre altura das plantas no final do experimento e no início) de plantas transgênicas e selvagem de cana-de-açúcar inicialmente com três meses de idade mantidas em casa-de-vegetação sob diferentes capacidades de pote durante 1 mês de experimento,. n=3. PC= capacidade de pote. WT= selvagem.
Figura 11: Gráfico de dispersão dos dados de expressão gênica, crescimento, fotossíntese e altura. A: Correlação entre crescimento e expressão relativa do transgene. B: Correlação entre fotossíntese durante o estresse de 30% de capacidade de pote e expressão relativa do transgene. C: Correlação entre altura das plantas transformadas com três meses de idade e expressão relativa do transgene. CP= capacidade de pote. Y= equação da reta. R2= coeficiente de determinação linear.
Ao longo do experimento, através do peso do pote medido diariamente e a
quantidade de água adicionada para se atingir a capacidade de pote desejada, foi possível
inferir a quantidade de água perdida (consumida e evaporada pela planta) em cada pote,
26
considerada como uso da água (Figura 12 A). Os transgênicos apresentaram uma perda
menor (números absolutos em gramas) de água do que o selvagem (Figura 12A). Ao final do
experimento, foi recolhido o total de massa seca (colmo, folhas e perfilho), de maneira que o
selvagem apresentou o maior acúmulo de massa (Figura 12B).
Figura 12: A: Perda de água por pote (água consumida e perdida por evaporação por plantas transgênicas de cana-de-açúcar). ANOVA com valor de F não- significativo (p= 0,22), n=3. B: Biomassa total de plantas transgênicas de cana-de-açúcar (massa seca do colmo, folhas e perfilho). ANOVA com valor de F não- significativo (p= 0,20), n=3. WT= selvagem.
A fim de relacionar os parâmetros analisados com o uso da água, outra
característica associada à resposta ao estresse hídrico em cana-de-açúcar, a WUE (eficiência
do uso da água), também foi calculada. Duas formas de WUE foram analisadas: a eficiência
do uso da água da produtividade (Figura 13) e a eficiência do uso da água da fotossíntese
(Figura 14). Para analisar a WUE da produtividade, dois cálculos foram realizados: o primeiro
foi a razão entre o crescimento e a quantidade de água perdida por pote por dia ao longo do
experimento (Figura 13A) e o segundo foi a razão entre a biomassa (massa seca total final) e
a quantidade de água perdida (Figura 13B). Os eventos e o selvagem não apresentaram
diferenças na eficiência do uso da água da produtividade, não sendo esse um parâmetro
interessante para diferenciá-los quanto ao desempenho durante estresse por seca.
27
Figura 13: Eficiência do uso da água (WUE) da produtividade de plantas transgênicas de cana-de-açúcar. A: Razão entre o crescimento (cm) e a quantidade de água (g) consumida e perdida por evaporação por plantas transgênicas de cana-de-açúcar. ANOVA com valor de F não- significativo (p= 0,45), n=3. B: Razão entre a material seca total (biomassa) (g) e a quantidade de água (g) consumida e perdida por evaporação por plantas transgênicas de cana-de-açúcar. ANOVA com valor de F não- significativo (p= 0,59), N=3. WT= selvagem.
A eficiência do uso da água da fotossíntese foi calculada através da razão entre a
razão entre a fotossíntese no estresse 30% de capacidade de pote e a taxa de transpiração
na mesma condição (Figura 14). Não houve diferenças estatísticas entre eventos e selvagem
(Figura 14).
Figura 14: Eficiência do uso da água (WUE) da fotossíntese de plantas transgênicas de cana-de-açúcar. Razão entre a fotossíntese no estresse 30% de capacidade de pote e a taxa de transpiração na mesma condição. ANOVA com valor de F não-significativo (p=0,49). WT= selvagem.
De maneira geral, os transgênicos sofrem menos com o estresse, mantendo a
fotossíntese (Figura 9). O objetivo do primeiro experimento foi escolher eventos que
possuem um fenótipo que melhor responde ao estresse hídrico dentre os 18 eventos. Dessa
forma, foram escolhidos os eventos 1 e 14 para uma investigação mais profunda da
fotossíntese em resposta à seca pelos seguintes motivos: o evento 1 apresenta a maior
expressão do transgene, os dois eventos fazem parte do grupo que sofreu menos com o
28
estresse (pouca diferença da fotossíntese quando submetidos a 100% capacidade de pote e
a 30% capacidade de pote). Além disso, o evento 14, mesmo apresentando tamanho similar
ao selvagem apresenta uma eficiência do uso da água melhor que a maioria dos eventos
transgênicos e do que o selvagem, mesmo que não estatisticamente relevante na população
(Figura 13).
Assim, no segundo experimento apenas clones dos eventos 1 e 14 e do selvagem
foram utilizados para coleta de dados. O experimento foi delineado em blocos casualizados
com sete repetições, sendo colocado em cada bloco plantas com tamanhos aproximados, de
forma que as diferenças de tamanho estão principalmente entre os blocos, não dentro dos
blocos, apesar do evento 1 ser ligeiramente menor que os demais (Figura 15). Os dados
foram coletados a 50%, 25% e 0% de capacidade de pote. Porém, como controle irrigado, em
cada bloco foram mantidas plantas transformadas e não-transformadas a 100% de
capacidade de pote.
Figura 15: A: Altura do caule de plantas transgênica e selvagem de cana-de-açúcar mantidas a 100% de capacidade de pote. ANOVA com valor de F significativo (p=0,00) e teste de comparação de médias Tukey (Alpha= 0.05), n= 14. A e B = grupos estatísticos B: Altura do caule de plantas transgênicas e selvagem de cana-de-açúcar mantidas a 100% de capacidade de pote, mostrando a diferenças entre blocos. ANOVA com valor de F significativo (p=0,00) e teste de comparação de médias Tukey (Alpha= 0.05), N= 14. Letras em maiúsculo = grupos estatísticos. WT= selvagem.
As plantas mantidas a 100% de capacidade de pote apresentaram maior
crescimento do que as plantas submetidas ao estresse hídrico. Porém, não houve diferenças
significativas entre os eventos e o selvagem (Figura 16).
29
Figura 16: Crescimento do caule de plantas transgênicas e selvagem de cana-de-açúcar submetidas ao estresse hídrico. Plantas controle: plantas mantidas a 100% de capacidade de pote. Plantas estressadas: plantas submetidas ao estresse hídrico, diminuindo a capacidade de pote gradativamente, dados coletados ao final do experimento de 1 mês de duração, quando as plantas estavam submetidas ao estresse de aproximadamente 0% de capacidade de pote. Fatorial ANOVA com F significante para evento (p=0,0012), com F significante para tratamento (p= 0,00) e F não significante para evento e tratamento (p=0,48). Teste de comparação de médias LSD (Alpha= 0.05), n= 7. Letras em maiúsculo = grupos estatísticos. WT= selvagem.
Durante a queda gradativa da capacidade de pote os parâmetros como taxa
fotossintética, condutância estomática, PhiPS2, ETR e Fv/Fm também foram decrescendo,
como esperado, mostrando que as plantas estavam sofrendo com a falta de água (Figura
17). Porém, entre as capacidades de pote 100% e 50% pouca diferença foi encontrada, ou
seja, as plantas ainda não estão estressadas o suficiente para repercutir em uma baixa
eficiência fotossintética. As diferenças estão principalmente entre os tratamentos 100 e
50%, comparativamente aos tratamentos 25% e 0%, já que os eventos transgênicos e o
selvagem comportaram-se de maneira igual durante o estresse, comprovando que as
plantas sofrem com o estresse, mas sofrem da mesma forma.
30
Figura 17: A: Taxa fotossintética de plantas transgênicas e selvagem de cana-de-açúcar quando submetidas a estresse hídrico. Fatorial ANOVA com F não significante para tratamento e evento (p=0,41), com F significante para tratamento (p= 0,00) e F não significante para evento (p=0,47). Teste de comparação de médias LSD (Alpha= 0,05), n= 7. Letras em maiúsculo = grupos estatísticos. B: Condutância estomática (gs) de plantas transgênicas e selvagem de cana-de-açúcar quando submetidas a estresse hídrico. Fatorial ANOVA com F não significante para tratamento e evento (p=0,78), com F significante para tratamento (p= 0,00) e F não significante para evento (p=0,83). Teste de comparação de médias LSD (Alpha= 0,05), n= 7. Letras em maiúsculo = grupos estatísticos. C: Rendimento quântico efetivo do PSII (PhiPS2) de plantas transgênicas e selvagem de cana-de-açúcar quando submetidas a estresse hídrico. Fatorial ANOVA com F não significante para tratamento e evento (p=0,93), com F significante para tratamento (p= 0,00) e F não significante para evento (p=0,90). Teste de comparação de médias LSD (Alpha= 0,05), n= 7. Letras em maiúsculo = grupos estatísticos. D: Taxa de transporte de elétrons (ETR) de plantas transgênicas e selvagem de cana-de-açúcar quando submetidas a estresse hídrico. Fatorial ANOVA com F não significante para tratamento e evento (p=0,97), com F significante para tratamento (p= 0,00) e F não significante para evento (p=0,95). Teste de comparação de médias LSD (Alpha= 0,05), n= 7. Letras em maiúsculo = grupos estatísticos. E: Rendimento quântico máximo do PSII (Fv/Fm) de plantas transgênicas e selvagem de cana-de-açúcar quando submetidas a estresse hídrico. Fatorial ANOVA com F não significante para tratamento e evento (p=0,95), com F significante para tratamento (p= 0,00) e F não significante para evento (p=0,66). Teste de comparação de médias LSD (Alpha= 0,05), n= 7. Letras em maiúsculo = grupos estatísticos. E1= evento 1, E14= evento 14 e WT= selvagem.
A assimilação de carbono decai principalmente a partir da capacidade de pote
50% (Figura 17A), reflexo do fechamento estomático (Figura 17B) e também da deficiência
do PSII em absorver luz e usá-la nas reações fotoquímicas (Figura 17C). O decaimento da
31
taxa de transporte de elétrons (Figura 17D) e o decaimento da Fv/Fm (< 0,8) (Figura 17E),
sugerem processos de fotoinibição resultantes de estresse ambientais (Ogren and Sjostrom,
1990), ou seja, mudanças na eficiência de processos não-fotoquímicos. Ambos fatores
podem explicar a baixa eficiência do PSII (Maxwell and Johnson, 2000).
O quenching fotoquímico (qP) é a dissipação da fluorescência da clorofila
associada às reações fotoquímicas, relacionado com a quantificação da energia de excitação
capturada pelos centros de reação abertos (Quinona a oxidada), representando a fração
“aberta” do PSII em relação à fração total desse fotossistema (Hall, 1993; Krause and Weis,
1991).
Para acessar o qP durante o estresse, uma curva de indução foi feita, de forma
que plantas adaptadas ao escuro foram submetidas a consecutivos pulsos de saturação
(período de 20s entre pulsos) durante a aplicação de luz actínia (Figura 18). Espera-se que o
qP decresça na proporção que os centros de reação são fechados, ou seja, redução da Qa
(Quinona a) (Hall, 1993). Quando as plantas são mantidas a capacidade de pote de 50% não
há diferença no decaimento do qP em relação às plantas mantidas a 100% capacidade de
pote e os valores de qP são mantidos ao longo do período de medição (Figura 18A). Também
não há diferenças entre os eventos e selvagem quando submetidos a essas capacidades de
pote (Figura 18A). Porém, quando as plantas são submetidas ao estresse de 25% de
capacidade de pote, passam a existir diferenças estatisticamente significantes de qP entre
tratamentos, de forma que os eventos e o selvagem apresentam valores maiores de qP
durante o estresse e também um decaimento desses valores ao longo do tempo, resultado
de uma maior proporção de centros de reação fechados durante o tempo, devido à
saturação da fotossíntese pelo estresse (Maxwell et al., 1994; Maxwell and Johnson, 2000)
(Figura 18B). Porém, não existem diferenças estatísticas entre os eventos e selvagem (Figura
18B). Da mesma forma, quando submetidas ao estresse de 0% de capacidade de pote, as
plantas estressadas apresentam valores de qP maiores e o declínio desses valores é mais
evidente do que a 25% de capacidade de pote (Figura 18C). Novamente, diferenças
estatisticamente significantes dos valores de qP entre tratamentos existem, com os eventos
e o selvagem apresentam valores maiores de qP durante o estresse (Figura 18C). Também
existem diferenças estatísticas entre evento 14 controle e evento 14 a 0% capacidade de
pote e entre selvagem controle e a 0% capacidade de pote, enquanto que para o evento 1
quase não houve diferença entre os tratamentos. Assim, pode-se dizer que os valores de qP
32
são mais afetados devido ao estresse no evento 14 e no selvagem, do que no evento 1
(Figura 18C).
Figura 18: A: Quenching fotoquímico (qP) de plantas transgênicas e selvagem de cana-de-açúcar quando submetidas a estresse hídrico 50% capacidade de pote. Fatorial ANOVA com F não significante (p=0,95) Teste de comparação de médias LSD (Alpha= 0,05), n= 7. B: Quenching fotoquímico (qP) de plantas transgênicas e selvagem de cana-de-açúcar quando submetidas a estresse hídrico 25% capacidade de pote. Fatorial ANOVA com F não significante (p=0,99) Teste de comparação de médias LSD (Alpha= 0,05), n= 7. C: Quenching fotoquímico (qP) de plantas transgênicas e selvagem de cana-de-açúcar quando submetidas a estresse hídrico 0% capacidade de pote. Fatorial ANOVA com F não significante (p= 0,99). Teste de comparação de médias LSD (Alpha= 0,05), n= 7. Tempo: medições realizadas a cada 20s durante aplicação de luz actínia após período de adaptação ao escuro. CP= capacidade de pote. E1= evento 1, E14= evento 14 e WT= selvagem.
O quenching não-fotoquímico (NPQ) é o decréscimo da fluorescência associado
principalmente à dissipação termal de energia de excitação (Pospisil, 1997), e reflete o
excesso de energia liberado em forma de calor.
Novamente as medidas realizadas durante a capacidade de pote 50% não
mostram diferenças significativas quando compradas à situação controle e também quanto
ao comportamento dos eventos e do selvagem durante o estresse (Figura 19A). No ponto t8
(NPQ máximo), quando o evento 14 e selvagem são submetidos ao estresse 25% CP, os
valores de NPQ em relação ao controle são maiores estatisticamente (Figura 19B) e quando
as plantas são submetidas à capacidade de pote 0%, os valores do NPQ do selvagem
continuam maiores estatisticamente em relação ao controle (Figura 19C). Dessa forma,
pode-se considerar que o evento 1 sofre menos com a fotoinibição durante o estresse do
33
que o evento 14 e o selvagem.
Figura 19: A: Quenching não-fotoquímico (NPQ) de plantas transgênicas e selvagem de cana-de-açúcar quando submetidas a estresse hídrico 50% capacidade de pote. Fatorial ANOVA com F não significante (p=0,07) Teste de comparação de médias LSD (Alpha= 0,05), n= 7. B: Quenching não-fotoquímico (NPQ) de plantas transgênicas e selvagem de cana-de-açúcar quando submetidas a estresse hídrico 25% capacidade de pote. Fatorial ANOVA com F não significante (p=0,60) Teste de comparação de médias LSD (Alpha= 0,05), n= 7. C: Quenching não-fotoquímico (NPQ) de plantas transgênicas e selvagem de cana-de-açúcar quando submetidas a estresse hídrico 0% capacidade de pote. Fatorial ANOVA com F não significante (p= 0,99). Teste de comparação de médias LSD (Alpha= 0,05), n= 7. Tempo: medições realizadas a cada 20s durante aplicação de luz actínia após período de adaptação ao escuro. CP= capacidade de pote. E1= evento 1, E14= evento 14 e WT= selvagem.
Os eventos apresentam uma quantidade ligeiramente maior de ATP em relação
às plantas selvagens (Figura 20), que apresentam uma leve diminuição dos níveis de ATP
após o período de estresse hídrico, revelando indícios de regulação da quantidade de ATP
como consequência desse estresse (Figura 20). As diferenças estatísticas não significativas
podem ter ocorrido em razão do reduzido número amostral (n=3). Dessa forma, ainda não se
pode concluir que o melhor desempenho do evento 1 em relação ao evento 14 e ao
selvagem se deve à maior produção de ATP pelo complexo enzimático da ATP sintase.
34
Figura 20: Quantidade relativa de ATP em cloroplastos de folha +1 de cana-de-açúcar submetidas ao estresse hídrico. Plantas controle= plantas mantidas a 100% de capacidade de pote. Plantas estressadas= plantas submetidas ao estresse hídrico, diminuindo a capacidade de pote gradativamente, dados coletados ao final do experimento de 1 mês de duração, quando as plantas estavam submetidas ao estresse de aproximadamente 0% de capacidade de pote. Fatorial ANOVA com F não significante (p=0,4). Teste de comparação de médias LSD (Alpha= 0,05), n= 3. Letras em maiúsculo = grupos estatísticos. E1= evento 1, E14= evento 14 e WT= selvagem.
A fim de quantificar o conteúdo de subunidade II da ATP sintase nas plantas
transgênicas e selvagens sob situação controle e após estresse, anticorpos específicos para essa
subunidade (Agrisera, EUA) foram usados em ensaios de Western blot. Porém, a proteína alvo não
foi detectada em plantas transgênicas, nem no selvagem depois da revelação dos filmes. Isso pode
se dever ao fato do anticorpo comercial não capaz de detectar eficientemente a proteína de cana-
de-açúcar, apesar de informações do fabricante preverem a utilização em uma grande gama de
monocotiledôneas.
Avaliação dos efeitos do estresse salino e oxidativo em folhas de plantas transgênicas
Também foram avaliados os efeitos dos estresses salino e oxidativo em folhas
dos eventos transgênicos 1 e 14 e do selvagem (Figuras 21 e 22).
35
Figura 21: Estresse salino em discos foliares de plantas transgênicas e selvagem de cana-de-açúcar. WT= selvagem. E1= evento 1. E14= evento 14. A. Discos foliares submetidos a diferentes concentrações de NaCl em meio MS líquido. Foto de uma das triplicatas do experimento. B. Quantificação de Clorofila a. Fatorial ANOVA F (p>0.05), n=3.
Figura 22: Estresse oxidativo em folhas de plantas transgênicas e selvagem de cana-de-açúcar. WT= selvagem. E1= evento 1. E14= evento 14. A. Discos foliares submetidos a diferentes concentrações de H2O2 em meio MS líquido. Foto de uma das triplicatas do experimento. B. Quantificação de Clorofila a. Fatorial ANOVA F (p>0.05), n=3.
No experimento de estresse salino, nenhum dos eventos ou o selvagem
apresentou mudanças estatisticamente significativas na quantidade dos pigmentos com o
aumento da salinidade. Isso pode ter ocorrido devido ao estresse não ter sido severo ou
longo o suficiente para que houvesse a perda significativa de pigmentação. Com o aumento
das concentrações de H2O2, ocorre o declínio na quantidade de clorofila, porém as diferenças
entre eventos e selvagem também não são significativas.
Avaliação da expressão do gene ScatpG em folhas de plantas transgênicas
Como parte da caracterização funcional desse gene ScatpG e tentativa de relacionar
sua expressão com a seca, foi traçado o perfil de expressão do gene endógeno que codifica a
subunidade II e do transcrito derivado do cassete pUBI:ScatpG:NOS. Também foi quantificada a
expressão do gene que codifica a subunidade Delta da ATP sintase de cana, para verificar se a
superexpressão de uma subunidade pode acarretar na indução de expressão de outra, ou até
mesmo do complexo inteiro, devido ao estresse. Para tal foram empregadas plantas transgênicas e
selvagens de cana-de-açúcar em situação controle e após estresse hídrico, através de análises
quantitativas por PCR em tempo real (Figura 23). Oligonucleotídeos específicos para a sequência
codificante do gene da subunidade II bem como do transgene foram desenhados.
36
Figura 23: Perfil de expressão de plantas transgênicas e selvagem de cana-de-açúcar em situação controle e após estresse hídrico A: Perfil de expressão do gene que codifica a subunidade Delta da ATP sintase de cana-de-açúcar. Expressão relativa ao selvagem controle. Fatorial ANOVA com F não significante (p=0,55). Teste de comparação de médias LSD (Alpha= 0,05). B: Perfil de expressão do gene endógeno que codifica a subunidade II mais do cassete pUBI:ScatpG:NOS. Expressão relativa ao selvagem controle. Fatorial ANOVA com F não significante (p=0,90). Teste de comparação de médias LSD (Alpha= 0,05). C: Perfil de expressão do cassete pUBI:ScatpG:NOS. Expressão relativa ao evento 14 estressado. Fatorial ANOVA com F não significante (p=0,77). Teste de comparação de médias LSD (Alpha= 0,05). Plantas controle= plantas mantidas a 100% de capacidade de pote. Plantas estressadas= plantas submetidas ao estresse hídrico, diminuindo a capacidade de pote gradativamente, dados coletados ao final do experimento de 1 mês de duração, quando as plantas estavam submetidas ao estresse de aproximadamente 0% de capacidade de pote. E1= evento 1, E14= evento 14 e WT= selvagem. n=3. Letras em maiúsculo = grupos estatísticos.
A subunidade Delta não apresentou diferenças na expressão devido ao estresse
hídrico (Figura 23A), enquanto que a subunidade II apresenta uma tendência de redução na
expressão devido a esse estresse, apesar das diferenças entre as médias não serem
estaticamente significantes (Figura 23B), mas que concordam com os dados de
experimentos realizados em plantas com 7 meses em campo, submetidas a estresse (G.M.
Souza, IQ-USP, dados não publicados). Apesar das plantas transgênicas apresentarem forte
expressão do cassete introduzido, que emprega o promotor da ubiquitina de milho (Figura
23C), o impacto nos níveis totais dos transcritos da subunidade II foi pequeno e não
estatisticamente significativo, em relação ao selvagem (Figura 23B).
Dessa forma, os perfis de expressão descritos acima podem explicar as
pequenas diferenças encontradas nas análises fisiológicas entre a maioria dos transgênicos e
37
o selvagem, já que os níveis de expressão da subunidade II são praticamente iguais. Ainda
assim, pode-se observar que há uma tendência de que a produção de ATP nas plantas
transgênicas é maior que nas plantas selvagens (Figura 20). Adicionalmente, o evento 1
apresenta maiores níveis de expressão da subunidade II, em linha com um provável maior
nível de ATP, que estão alinhados com uma melhor performance fotossintética desse evento
em relação ao selvagem durante o estresse hídrico descritos nas figuras 9, 18B e C e 19B e C,
nas quais o evento 1 mantém mais próximo do controle os valores da taxa fotossintética (A),
qP e NPQ durante o estresse aplicado.
Para entender melhor os resultados obtidos das plantas transgênicas de cana
produzidas nesse trabalho, foi utilizado um estudo sobre o transcriptoma de folha de cana-
de-açúcar empregando RNAseq (Mattiello, 2015). A análise consiste na comparação da
expressão do gene da poliubiquitina e da subunidade II da ATP sintase em partes diferentes
da folha de cana-de-açúcar (Figura 24), a fim de inferir sobre o nível de atividade dos
promotores dos genes.
Figura 24: Perfil de expressão do gene da Poliubiquitina e da ATP sintase Subunidade II ao longo da folha+1 de cana-de-açúcar. P= ponta (terço superior da folha+1). M= meio (terço médio da folha+1). B= base (terço inferior da folha+1). ANOVA F (p<0.01), n=4 e 3, teste LSD (Alpha=0.05).
Os perfis de expressão descritos acima podem explicar o baixo impacto nos
níveis totais dos transcritos da subunidade II, uma vez que a expressão endógena do gene é
muito alta, três vezes maior que a do gene da poliubiquitina que é expresso
constitutivamente e é amplamente utilizado como normalizador (Papini-Terzi et al., 2005).
Considerando que os níveis de atividade dos promotores da poliubiquitina de cana-de-
açúcar e de milho são similares (Wei et al., 2003), podemos concluir que o promotor de
BB B
A A A
0
200
400
600
800
1000
1200
1400
P M B
RP
KM
Poliubiquitina
ATP sintaseSubuidade II
38
milho empregado na construção do cassete de expressão não foi forte o suficiente para
aumentar significativamente os níveis de transcritos da subunidade II. Dessa forma, o
acréscimo na expressão da ATP sintase nas plantas transgênicas pode ter sido insuficiente
para gerar algum fenótipo contrastante.
Conclusão
Do trabalho descrito pode-se concluir que a sequência isolada corresponde ao
gene ScatpG, que codifica a subunidade II da ATP sintase de cloroplasto de cana-de-açúcar.
Também foi possível inferir que o promotor do gene ScatpG é mais forte que o promotor da
poliubiquitina, resultando em um pequeno acréscimo na expressão de ScatpG nas plantas
transgênicas e consequentemente, na ausência de fenótipo claro. Apesar da escolha do gene
ter sido proveniente de ensaios anteriores de seca em cana-de-açúcar, os níveis de
expressão do gene ScatpG não são claramente modulados pela seca. É provável que outros
fatores influenciem a expressão do gene em questão, assim como é possível que as
diferentes condições de estresse por seca aplicados nos experimentos discutidos, possam ter
refletido em respostas diferentes.
Materiais e métodos
Obtenção e confirmação do gene candidato
O cluster do SUCEST correspondente ao gene selecionado (SCACSD2014C10.g)
não possui a região codificante completa. A sequência completa de nucleotídeo da
subunidade da ATP sintase de cana-de-açúcar foi obtida por análises in silico, provenientes
do sequenciamento do genoma da cana-de-açúcar, realizado por um grupo de cientistas
vinculados ao Programa FAPESP de Pesquisa em Bioenergia (BIOEN), coordenado pela Dra.
Glaucia Mendes Souza (IQ, Universidade de São Paulo- USP).
A construção da árvore filogenética de máxima verossimilhança se deu através
do programa MEGA5 (Tamura et al., 2011). Foi utilizado o modelo de evolução de
sequências de WAG, usando o programa de alinhamento múltiplo webPRANK (Loytynoja and
Goldman, 2010).
A partir da sequência obtida, primers direto e reverso (GGA TCC ATG GCC ACG
GCT e ACG CGT TCA GGC GGA TGG) foram desenhados para a amplificação da região
codificante completa, possuindo sítios das enzimas de restrição BamHI e MluI (Thermo
39
Scientific, EUA) respectivamente, para posterior clonagem direcional nos vetores de
expressão.
A reação de amplificação foi realizada com a enzima Phusion High-Fidelity DNA
polimerase (Thermo Scientific, EUA), seguindo protocolo específico para produtos com alto
conteúdo de GC.
Foram utilizados 1,0 µL de DNA, 0,4 µL dNTP (10 mM), 1,0 µL de primer direto
High-Fidelity polimerase, 11,8µL de água Milli-Q e 0,6 µL DMSO. Essa reação foi submetida
ao seguinte programa de amplificação: 30 segundos à 98°C, mais 35 ciclos de 10 segundos a
98°C, 30 segundos a 60°C, 1 minuto a 72°C e uma extensão final de 7 minutos a 72°C.
O produto correspondente ao tamanho esperado (642 pb) foi extraído do gel de
agarose 1%, purificado com o Kit GeneJETTM Gel Extraction (Thermo Scientific, EUA) e
clonado no vetor pTZ57R/T (Thermo Scientific, EUA). Para tal, foi preciso submeter o
produto da PCR a uma reação de adenilação, que consistiu em 5 µL do produto purificado,
0,5 µL de enzima Taq polimerase (Thermo Scientific, EUA), 0,2 µL dATP (10 mM), 1 µL de
tampão Taq 10 x, 0,6 µL MgCl2 (25 mM) e 2,7 µL de água Milli-Q, colocada à 72°C por 30
minutos.
O vetor pTZ57R/T contendo o gene da subunidade II da ATP sintase foi
transformado em Escherichia coli DH5α termo-competentes que foram estriadas em placas
de Petri contendo meio LB com ampicilina 50 µg/mL e incubadas à 37°C pelo período de 16
horas. Colônias isoladas foram inoculadas em 5 mL de meio de cultura LB líquido com o
antibiótico adequado e incubada à 37°C por 16 horas sob agitação de 250 rpm. Alíquotas de
850 µL das culturas bacterianas foram separadas e acrescidas de 150 µL de glicerol 50%
(w/v) e armazenadas a -80°C para estoque permanente. O restante das suspensões
bacterianas foi utilizado para minipreparação de DNA plasmidial por lise alcalina utilizando o
kit “QIAprep Spin Miniprep Kit” (Qiagen®, EUA), segundo orientações do fabricante. Os
plasmídeos extraídos foram confirmados por digestão com as enzimas BamHI + XbaI e SacI
(Thermo Scientific, EUA) e por sequenciamento utilizando os primers M13/PUC (-20) direto e
reverso.
Localização subcelular
A região codificante do gene ScatpG foi clonada sem códon de parada no vetor
Gateway pENTR/D-TOPO (Life Technologies, EUA) e confirmada por sequenciamento. A
40
recombinação foi realizada através da enzima LR Clonase (Life Technologies, EUA) com o
vetor de destino pB7WG2 (Karimi et al., 2002) promovendo a fusão C-terminal da proteína
verde fluorescente GFP. O ensaio foi realizado através da agroinfiltração de folhas de
Nicotiana benthamiana de acordo com o protocolo de (Sparkes et al., 2006).
Construção do vetor de expressão para transformação de cana-de-açúcar
O fragmento correspondente ao gene da subunidade II da ATP sintase de cana-
de-açúcar foi retirado do vetor de subclonagem pTZ57R/T com as enzimas de restrição
BamHI e MluI, extraídos de gel de agarose 1% e purificados com o Kit GeneJETTM Gel
Extraction (Thermo Scientific, EUA) para clonagem direcionada no vetor de expressão
pUBILN (Camargo, 2007) correspondente ao vetor pAHC17 (Christensen and Quail, 1996)
com o sítio de múltipla clonagem modificado. O vetor pUBILN foi digerido com as mesmas
enzimas de restrição e o produto da digestão correspondente ao vetor também foi extraído
e purificado de gel de agarose 1%. Os fragmentos contendo o gene alvo e o vetor pUBILN
foram ligados pela ação da enzima T4 DNA ligase (Thermo Scientific) à 4°C, por 16 horas. O
vetor final para transformação de cana-de-açúcar foi denominado pUBILN:ScatpG e foi
transformado em E. coli DH5α termo-competentes. As colônias que foram confirmadas por
digestão com as enzimas de restrição BamHI e MluI e tiveram sua sequência validada por
sequenciamento foram armazenadas a -80°C para estoque permanente.
Transformação genética de cana-de-açúcar via biobalística
A transformação genética de cana-de-açúcar via biobalística e as análises
fisiológicas dos transgênicos foram realizadas no Instituto SRA-Sugar Research Australia
(Austrália) supervisionado pelo pesquisador Dr. Prakash Lakshmanan.
Ponteiros de plantas saudáveis de cana-de-açúcar da variedade australiana Q208
com aproximadamente sete meses de idade tiveram suas folhas removidas até a obtenção
do palmito (aproximadamente 3 mm de diâmetro), que foi cortado transversalmente,
produzindo discos foliares com 2- 3 mm de espessura. Os discos obtidos foram transferidos
para meio MS padrão (Murashige and Skoog, 1962) com 2,4-D (1 mg/L) no escuro por 2-3
semanas para produção de discos foliares embriogênicos e por 4-6 semanas para produção
de calos embriogênicos para experimentos transformação (Figura 25).
41
Figura 25. Produção de discos foliares e calos embriogênicos: A: Ponteiros de cana-de-açúcar variedade Q208. B e C: Ponteiros descascados até o palmito. D, E e F: Produção dos discos e transferência para meio MS. G: Tecido embriogênico. H: Discos foliares prontos para bombardeamento.
Nos experimentos de transformação, o vetor pUBILN:ScatpG foi co-
bombardeado com o vetor pUKN (SRA, AU) que contém a sequência codificadora do gene
nptII, da enzima neomicina fosfotransferase II, que confere resistência ao antibiótico
geneticina, sob controle do promotor do gene da poliubiquitina de milho (Ubi -1) e do
terminador NOS do gene da nopalina sintase de Agrobactéria.
Após o bombardeamento, os calos foram transferidos para meio MS contendo
geneticina (30 mg/L) e 2,4- D (1 mg/L) e mantidos no escuro por 4-6 semanas para seleção
dos transformantes. Após o período de escuro, os tecidos regenerados foram transferidos
para meio seletivo sem 2,4-D e mantidos na luz (fotoperíodo 16/8), sendo repicados a cada 3
semanas (Figura 26).
H
F
D
B A
C
E
G
42
Figura 26. Seleção e regeneração de plântulas a partir de tecido embriogênico de cana-de-açúcar: A: Calos em meio seletivo. B: Plântula regenerada a partir de calo bombardeado em meio seletivo, considerada um evento único. C: Plântulas clones de um mesmo evento individualizadas em meio de propagação. D: Plântulas clones individualizadas em meio de enraizamento.
As plantas regeneradas foram transferidas para meio de propagação (meio MS
padrão com adição do hormônio sintético BAP (1,2mg/L), a fim de produzir o maior número
de clones de cada evento e posteriormente para meio de enraizamento (meio com metade
da concentração de MS), a fim de preparar os clones para transferência ao solo.
Os clones foram mantidos em meio de cultura, sendo que 3 clones de cada
evento e do selvagem (não contendo o transgene, mas que passaram por todo o processo de
transformação) transferidos para pote contendo 60% de solo e 40% de areia. Esses clones
foram mantidos em casa-de-vegetação até atingirem 3 meses de idade para primeira análise
de tolerância a estresses abióticos.
PCR de DNA genômico e RT- qPCR
Para confirmação por PCR, DNA genômico foi extraído de tecido de folha
processada em FastPrep-24 em 200 uL de tampão TPS (100mM Tris pH 9,5, 1M KCl, 10mM
EDTA). Óligos específicos para amplificação da construção foram desenhados e foram
realizadas reações de PCR usando as especificações para amplificação da Go Taq Green
Master Mix (Promega).
Para avaliar a expressão do gene alvo nas plantas transgênicas de cana-de-açúcar
foi realizada uma análise quantitativa por PCR em tempo real. Para tal, RNA total foi extraído
de 50 mg de folha de plantas transgênicas e do selvagem através do RNeasyR Mini Kit
(QIAGEM, EUA) segundo instruções do fabricante e posteriormente tratado com DNAse
(Promega RQ1 DNase, EUA). Foram usados Randons Primers (Invitrogen, EUA) e Improm -
A B
C D
43
IITM Reverse Transcriptase (Promega, EUA) para a produção de cDNA, segundo
recomendações do fabricante.
Oligonucleotídeos específicos para a amplificação do cassete de expressão,
desenhados para amplificar a porção entre a região 5’UTR da poliubiquitina de milho e
região codificante do gene da subunidade II da ATP sintase de cana, foram utilizados em um
ensaio de PCR em tempo real (Applied Biosystems, USA) com Sensi Mix SYBER Low-ROX PCR
(BIOLINE, USA) num volume total de 10 𝜇L e as corridas foram realizadas em triplicata.
Os dados foram analisados segundo o método comparativo 2-ΔΔCT (Livak and
Schmittgen, 2001). Foi usado como gene referência a região codificante do gene ADF (Fator
depolimerizador da Actina) de cana-de-açúcar.
Análise de parâmetros fotossintéticos
Os parâmetros fotossintéticos como taxa fotossintética ou fotossíntese (A) e
condutância estomática (gs) foram medidos utilizando o equipamento IRGA (LI-6400 version
5, LI-COR biotechnology, USA), numa concentração de CO2 de 400 µL L-1, intensidade de luz
de 2000 µmol m-2 s-1, fluxo de gás 500 mL min-1 e temperatura dentro da câmara de 30°C em
folhas +1, assim como dados de fluorescência, como rendimento quântico efetivo do
fotossistema II (PhiPS2) e taxa de transporte de elétrons (ETR). Parâmetros que necessitam
de plantas adaptadas ao escuro (20 minutos utilizando-se clipes foliares), como rendimento
quântico máximo do PSII (Fv/Fm) e quenching não-fotoquímico e fotoquímico foram
coletados através do fluorômetro portátil (MINI-PAM, Heinz Walz, Alemanhã).
Quantificação de ATP
A concentração de ATP no cloroplasto foi determinada através do ensaio de
bioluminescência luciferina-luciferase usando o kit CLS II (Roche Diagnostic, EUA) de acordo
com o fabricante. Para tal, cloroplastos intactos foram extraídos de acordo com Motohashi
et al. (2001) de folha +1 de cana em condição controle e após período de estresse hídrico.
Ensaios de estresse salino e oxidativo
Para a avaliação do efeito do estresse salino, discos foliares de 0,35cm (5 discos
por tratamento) de folhas dos eventos 1 e 14 e do selvagem foram colocados em MS com
diferentes concentrações de NaCl (0, 100, 200 e 300 mM) por 9 dias e foi medido o conteúdo
de clorofila A. A extração dos pigmentos foi realizada em acetona 100% e as concentrações
calculadas segundo (Lichtenthaler, 2001). O experimento foi realizado em triplicata.
44
Para avaliação do efeito do estresse oxidativo, discos foliares de plantas
transgênicas e selvagens de cana-de-açúcar medindo 0,5 cm de diâmetro serão tratados com
1 mL de peróxido de hidrogênio (H2O2) nas concentrações: 0, 0,25, 0,5, 0,75 e 1 M, por 48
horas. O experimento foi realizado em triplicata por evento. Após o período de estresse
oxidativo foi realizada a extração da clorofila total através da maceração das folhas na
presença de acetona, seguida de sua quantificação como descrito por (Lichtenthaler, 2001).
45
Capítulo II
Proteômica de cloroplasto de plantas de cana-de-açúcar
submetidas ao estresse hídrico
Este capítulo é dedicado para o melhor entendimento do funcionamento de
cloroplasto de cana-de-açúcar durante o estresse hídrico, assim como da subunidade II da
ATP sintase, possibilitando a identificação de genes com papel chave na resposta à seca para
futuros ensaios biotecnológicos.
Resultados e discussão
Aplicação do estresse hídrico e isolamento de cloroplastos de cana-de-açúcar
Plantas de cana-de-açúcar da variedade SP80-3280 foram submetidas a estresse
hídrico através de suspensão de rega em casa-de-vegetação. Para controle do estresse, a
taxa fotossintética foi avaliada ao longo do experimento e a coleta da folha+1 foi realizada
quando a diferença entre irrigado e estressado foi estatisticamente significante (Figura 1).
Figura 1: Ensaio de estresse hídrico de plantas de cana-de-açúcar em casa de vegetação. A: Plantas de cana-de-açúcar estressadas (7 dias de suspensão de rega) e controle (irrigado). B: Taxa fotossintética durante ensaio de estresse hídrico de plantas de cana-de-açúcar em casa de vegetação. * = diferença significativa entre tratamentos (p<0,01), teste de comparação de medias (teste –T), n=6. Sétimo dia= ponto de coleta.
-5.
0.
5.
10.
15.
20.
25.
30.
35.
40.
45.
0 1 2 3 4 5 6 7 8 9 10 11 12
A(umolCO2m
-2s-1)
Dias
Fotossíntese
Irrigado
Seca
*
A B
* *
*
46
Para análise de proteômica, cloroplastos das plantas estressadas e controle
foram isolados (Figura 2A) e através de microscopia foi verificada sua integridade (Figura
2B).
Figura 2. Isolamento de cloroplastos em cana-de-açúcar. A. Banda de cloroplastos intactos na interface entre as camadas de 40% e 80% de Percoll. B. Microscopia de cloroplastos intactos de cana-de-açúcar. 10μL da suspensão plastidial concentrada depositada em uma lâmina de vidro coberta com lamínula em aumento de 100x.
Identificação de proteínas cloroplastidiais de cana-de-açúcar
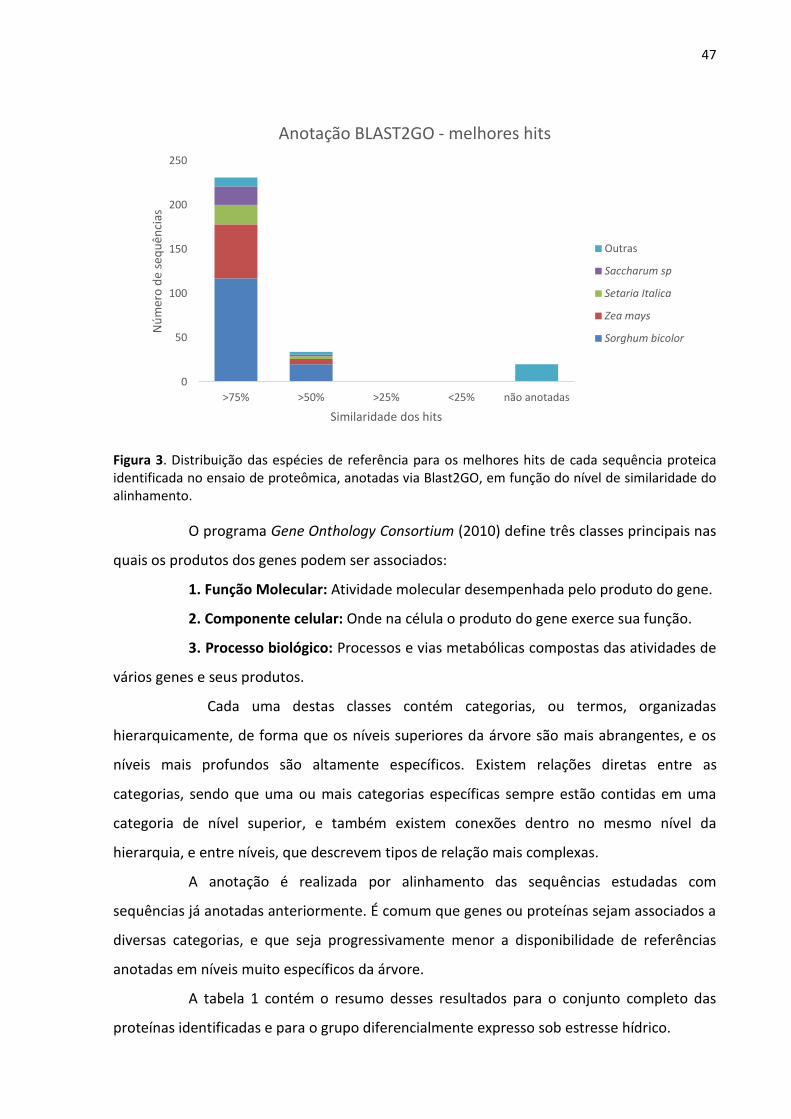
Foram identificadas 278 proteínas de cloroplasto de cana-de-açúcar (Tabela
suplementar 1), das quais 264 (95%) foram anotadas através de alinhamentos por BLAST
usando o programa Blast2GO (Conesa et al., 2005), enquanto que 14 não tiveram hit com
nenhuma outra sequência. Das sequências anotadas, 230 (87%) possuem similaridade maior
que 75% com o melhor hit encontrado. As demais (34 sequências) apresentam similaridade
superior a 50%. A espécie com maior número de melhores hits foi Sorghum bicolor, seguida
de Zea mays (Figura 3).
47
Figura 3. Distribuição das espécies de referência para os melhores hits de cada sequência proteica identificada no ensaio de proteômica, anotadas via Blast2GO, em função do nível de similaridade do alinhamento.
O programa Gene Onthology Consortium (2010) define três classes principais nas
quais os produtos dos genes podem ser associados:
1. Função Molecular: Atividade molecular desempenhada pelo produto do gene.
2. Componente celular: Onde na célula o produto do gene exerce sua função.
3. Processo biológico: Processos e vias metabólicas compostas das atividades de
vários genes e seus produtos.
Cada uma destas classes contém categorias, ou termos, organizadas
hierarquicamente, de forma que os níveis superiores da árvore são mais abrangentes, e os
níveis mais profundos são altamente específicos. Existem relações diretas entre as
categorias, sendo que uma ou mais categorias específicas sempre estão contidas em uma
categoria de nível superior, e também existem conexões dentro no mesmo nível da
hierarquia, e entre níveis, que descrevem tipos de relação mais complexas.
A anotação é realizada por alinhamento das sequências estudadas com
sequências já anotadas anteriormente. É comum que genes ou proteínas sejam associados a
diversas categorias, e que seja progressivamente menor a disponibilidade de referências
anotadas em níveis muito específicos da árvore.
A tabela 1 contém o resumo desses resultados para o conjunto completo das
proteínas identificadas e para o grupo diferencialmente expresso sob estresse hídrico.
0
50
100
150
200
250
>75% >50% >25% <25% não anotadas
Nú
mer
o d
e se
qu
ênci
as
Similaridade dos hits
Anotação BLAST2GO - melhores hits
Outras
Saccharum sp
Setaria Italica
Zea mays
Sorghum bicolor
48
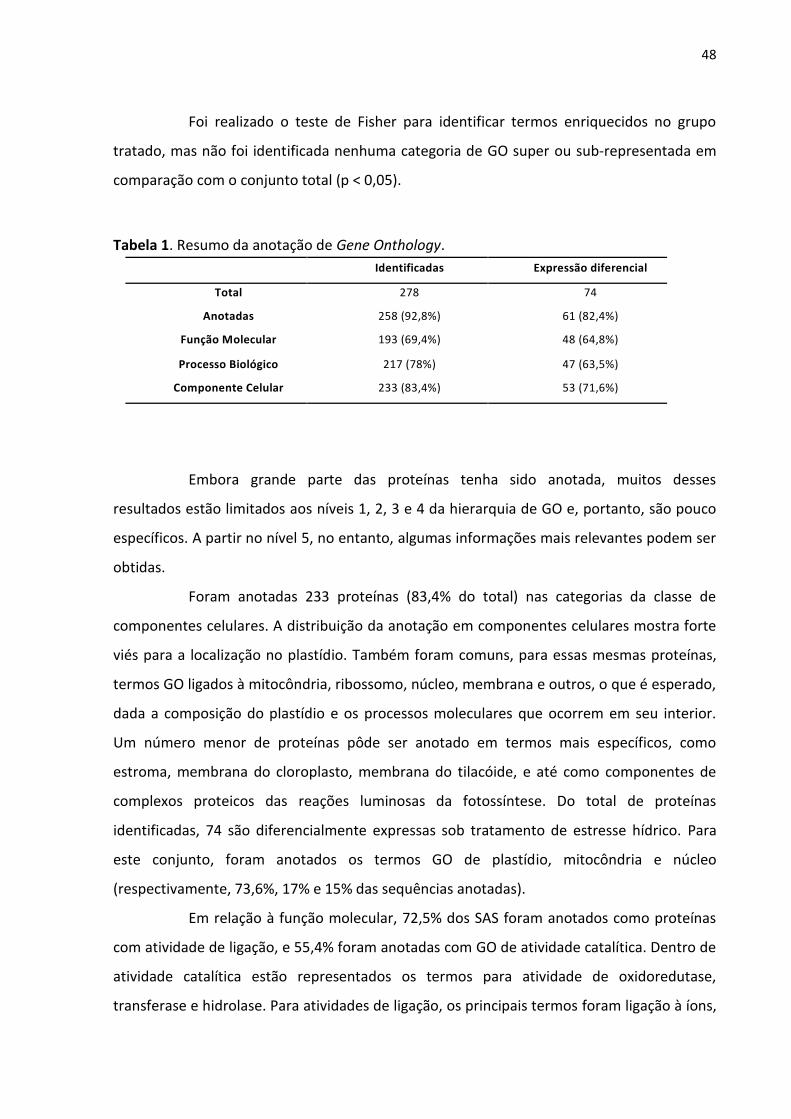
Foi realizado o teste de Fisher para identificar termos enriquecidos no grupo
tratado, mas não foi identificada nenhuma categoria de GO super ou sub-representada em
comparação com o conjunto total (p < 0,05).
Tabela 1. Resumo da anotação de Gene Onthology.
Embora grande parte das proteínas tenha sido anotada, muitos desses
resultados estão limitados aos níveis 1, 2, 3 e 4 da hierarquia de GO e, portanto, são pouco
específicos. A partir no nível 5, no entanto, algumas informações mais relevantes podem ser
obtidas.
Foram anotadas 233 proteínas (83,4% do total) nas categorias da classe de
componentes celulares. A distribuição da anotação em componentes celulares mostra forte
viés para a localização no plastídio. Também foram comuns, para essas mesmas proteínas,
termos GO ligados à mitocôndria, ribossomo, núcleo, membrana e outros, o que é esperado,
dada a composição do plastídio e os processos moleculares que ocorrem em seu interior.
Um número menor de proteínas pôde ser anotado em termos mais específicos, como
estroma, membrana do cloroplasto, membrana do tilacóide, e até como componentes de
complexos proteicos das reações luminosas da fotossíntese. Do total de proteínas
identificadas, 74 são diferencialmente expressas sob tratamento de estresse hídrico. Para
este conjunto, foram anotados os termos GO de plastídio, mitocôndria e núcleo
(respectivamente, 73,6%, 17% e 15% das sequências anotadas).
Em relação à função molecular, 72,5% dos SAS foram anotados como proteínas
com atividade de ligação, e 55,4% foram anotadas com GO de atividade catalítica. Dentro de
atividade catalítica estão representados os termos para atividade de oxidoredutase,
transferase e hidrolase. Para atividades de ligação, os principais termos foram ligação à íons,
Identificadas Expressãodiferencial
Total 278 74
Anotadas 258(92,8%) 61(82,4%)
FunçãoMolecular 193(69,4%) 48(64,8%)
ProcessoBiológico 217(78%) 47(63,5%)
ComponenteCelular 233(83,4%) 53(71,6%)
49
ligação à compostos heterocíclicos e ligação a compostos orgânicos cíclicos. Entre as
diferencialmente expressas, 70,8% foram anotadas como proteínas com atividade de
ligação, enquanto 64,6% em atividade catalítica.
Para as categorias de processo biológico, os termos superiores mais relevantes
foram processo metabólico (68,6%), processo celular (68,6%) e processos de organismo
único (58%). Alguns dos termos com maior número de proteínas anotadas no nível 5 desta
classe foram processo metabólico de proteínas, modificação de proteínas, modificação de
macromoléculas, expressão gênica, e biossíntese de macromoléculas.
Foram identificadas proteínas já descritas como participantes de processos como
Ciclo de Calvin, reações do ciclo fotossintético C4, metabolismo de lipídeos, reações
luminosas, eliminação de ROS, metabolismo de ácidos nucléicos, metabolismo de
aminoácidos, entre outros. Zhao et al. (2013) revisaram estudos de proteômica de
cloroplastos em Zea mays onde proteínas envolvidas nestes processos também foram
identificadas. Os estudos revisados também investigaram a diferença na presença de
proteínas entre cloroplastos de células do mesófilo e da bainha, além de efeitos de estresses
salino, por luz e por temperatura.
Análise de proteínas de cloroplasto diferencialmente expressas sob estresse hídrico.
Das 74 proteínas diferencialmente expressas (Tabela suplementar 2), 18 são
de função desconhecida ou não apresentam alinhamento algum. Outras 48 são proteínas
ribossomais, histonas, chaperonas, subunidades com domínios de ligação à ácidos nucléicos
ou outras funções envolvidas no metabolismo de lipídeos, proteínas e metabolismo de
clorofila. As demais proteínas diferencialmente expressas foram anotadas e identificadas
como participantes do ciclo de Calvin, das reações luminosas e do ciclo C4 (Tabela 2).
Tabela 2. Proteínas de cloroplasto de cana-de-açúcar diferencialmente expressas em condições de estresse hídrico anotadas como participantes do ciclo de Calvin, das reações luminosas e do ciclo C4.
50
up: proteínas induzidas pelo estresse hídrico. down: proteínas reprimidas pelo estresse hídrico. 1: presença somente em condições de estresse hídrico. -1: presença somente no irrigado (controle).
As proteínas diferencialmente expressas envolvidas nas reações luminosas estão
representadas na figura 4.
Figura 4. Proteínas identificadas e diferencialmente expressas de cloroplasto de cana-de-açúcar sob estresse hídrico. Verde: proteínas reprimidas pelo estresse. Vermelho: proteínas induzidas pelo estresse. Cinza: proteínas identificadas que não possuem expressão variável neste experimento. Azul: subunidade II identificada, porém não é diferencialmente expressa. Modificada de Taiz e Zeiger, (2006).
Dentre as proteínas reprimidas pelo estresse hídrico, encontram-se Psbp-like,
STN8 (serina treonina quinase) e OHP2. É sabido que Psbp-like são proteínas extrínsecas que
compõe o complexo de evolução do oxigênio (CEO), que por sua vez é responsável por
remover 4 elétrons de duas moléculas de água para formar oxigênio molecular (Roose et al.,
2007). Essas proteínas não são necessárias para o funcionamento do complexo, mas
possuem papel importante no aumento de sua capacidade (Ishihara et al., 2007; Seidler,
1996). STN8, é uma quinase que possui um papel central na fosforilação da proteína D1,
proteína do centro de reação PSII, protegendo-a da degradação indesejada que resulta na
produção de espécie reativas de oxigênio. Por outro lado, a degradação de D1 é um
importante passo para evitar fotoinibição. Dessa forma STN8 está envolvida no ajuste fino
da degradação de D1 (Kato and Sakamoto, 2014). OHP2 é um membro da família LHC (light-
harvesting chlorophyll a/b-binding proteins), que compõe o complexo antena. Ohp2 é
51
induzido quando há alta intensidade luminosa, sendo uma estratégia de fotoproteção do PSI
em resposta ao estresse por luz intensa (Andersson et al., 2003). Essas evidências sugerem
que essas proteínas exercem um papel importante no controle do fluxo linear de elétrons,
que por sua vez está sendo reprimido pelo estresse hídrico. Por outro lado, o aumento da
expressão de Ferredoxina e da subunidade psaK sugerem que o fluxo cíclico de elétrons está
sendo favorecido. Ferredoxina é um forte aceptor de elétrons do PSI e a subunidade psaK
está envolvida na interação entre LHCI e o centro de reação do fotossistema I (Jensen et al.,
2000). O transporte linear de elétrons da água ao NADP+ ocorre através do PSII e PSI. Devido
ao transporte de elétrons linear, H+ é acumulado no lúmen resultante da oxidação da água e
da translocação de prótons pela membrana através do complexo Cytb6f (Citocromo b6f),
resultando na geração de uma força próton-motriz que direciona a produção de ATP. Em
contrapartida, o transporte cíclico de elétrons em torno do PSI recicla os elétrons da
Ferredoxina reduzida e transporta para a plastoquinona, contribuindo para a geração da
força próton-motriz sem produção de NADPH (Nakamura et al., 2013). Como a razão da
produção ATP/NADPH é fixa (1,29) através do transporte linear (Allen 2003), o transporte
cíclico de elétrons é importante para preencher o restante requerido para o metabolismo (1,
4 a 5) em células de plantas C4 (Munekage and Taniguchi, 2016). A fotossíntese C4 requer
mais ATP por carbono fixado para concentrar CO2 nas células da bainha, necessitando de
mais energia do que necessita a fotossíntese C3 (Munekage and Taniguchi, 2016).
Estudos revelam que NDH desidrogenase está envolvida no transporte cíclico de
elétrons pelo PSI em plantas C3, reciclando elétrons da Ferredoxina para Plastoquinona e
consequentemente para o PSI através do Cytb6f (Yamori and Shikanai, 2016). Acredita-se
que em plantas C4, como milho e sorgo, esse complexo também esteja envolvido na geração
de ATP através do transporte cíclico de elétrons (Darie et al., 2006; Kubicki et al., 1996;
Takabayashi et al., 2005). No presente trabalho, a subunidade I da NDH desidrogenase é
reprimida, o que sugere a repressão do complexo e, consequentemente, que o transporte
cíclico de elétrons de cana-de-açúcar quando submetida ao estresse hídrico não é NDH-
dependente.
Subunidades do Cytb6f e da ATP sintase foram identificadas, incluindo a
subunidade II, mas não foram diferencialmente expressas sob condições de seca. Dessa
forma, a indução ou repressão desses complexos não são o principal fator regulatório da
cadeia de elétrons e da produção de ATP e consequentemente da fotossíntese em plantas
52
de cana-de-açúcar submetidas à seca. O ATP produzido é utilizado nas reações subsequentes
da fotossíntese, como as reações do ciclo de Calvin. Nesse contexto, grandes quantidades de
ATP são necessárias para que ocorra a regeneração de Ribulose- 1,5- bisfosfato. No presente
trabalho frutose-1,6- bifosfato adolase e a maior subunidade da RuBisco (Ribulose-1,5-
bisfosfato carboxilase) foram induzidas pelo estresse (Figura 5), sugerindo uma alta
demanda de carboxilação e regeneração da Ribulose-1,5-bifosfato e consequentemente um
maior consumo de ATP pelas plantas estressadas para manter a fotossíntese.
A enzima do metabolismo C4, PEPC (fosfoenolpiruvato carboxilase), responsável
pela catálise irreversível de carboxilação do fosfoenolpiruvato em oxalacetato, também foi
encontrada como sendo induzida ela seca. Essa enzima é sabidamente citosólica, porém
estudos em arroz demostram a existência de PEPC intrínseca de cloroplasto, com um papel
fundamental na assimilação de amônia em folhas (Masumoto et al., 2010). Uma investigação
mais aprofundada seria necessária, para inferir o papel dessa enzima em cloroplastos de
cana-de-açúcar submetida a estresse hídrico.
Figura 5. Proteínas identificadas e diferencialmente expressas participantes do ciclo de Calvin de cloroplasto de cana-de-açúcar sob estresse hídrico. Vermelho: proteínas induzidas pelo estresse. Azul: proteína identificada que não possui expressão variável neste experimento. Modificada Taiz e Zeiger, (2006).
Conclusão
Os níveis de proteínas cloroplastidiais de cana-de-açúcar variam com estresse
por seca. Porém, o complexo da ATP sintase e Citocromo b6f não controlam a fotossíntese
de cana-de-açúcar sob estresse hídrico, através da diminuição da quantidade de suas
53
subunidades.
A alta demanda de ATP para as reações de concentração de CO2 e carboxilação
são compensadas pelo transporte cíclico de elétrons, sendo pontos estratégicos para
regulação da fotossíntese proteínas envolvidas na evolução do oxigênio (PsbP-like),
regulação da captação de energia pelo PSII e reciclagem de elétrons (Ferredoxina e psaK).
Estas duas últimas proteínas têm potencial biotecnológico para aumento da produção de
ATP em plantas submetidas ao estresse por seca.
Materiais e métodos
Material vegetal e aplicação do estresse hídrico
Plantas de cana de açúcar cultivar SP80-3280 foram crescidas em casa de
vegetação (Campinas, Brasil, 22°S, 47°W) sob irrigação diária por três meses em potes de 30
L. Em outubro de 2015, foi realizada a suspensão de rega para a evolução do estresse.
O ensaio foi delineado em blocos casualizados, dividido em três blocos com duas
réplicas por tratamento. O parâmetro utilizado para guiar as coletas foi a taxa fotossínteca
(A). Após 7 dias, a folha+1 foi coletada de plantas estressadas e controle (sem suspensão de
rega), quando a diferença na taxa fotossintética entre estressado e controle foi
estatisticamente significante.
Os parâmetros fotossintéticos foram medidos utilizando o equipamento IRGA (LI-
6400 XT, LI-COR biotechnology, EUA), numa concentração de CO2 de 400 µL L-1, intensidade
de luz de 2.000 µmol m-2 s-1, fluxo de gás 400 mL min-1 e temperatura dentro da câmara de
30 °C.
Isolamento de Cloroplastos
Para o isolamento de cloroplastos foi utilizado o Chloroplast Isolation Kit (CP-ISO,
Sigma Aldrich, EUA), segundo indicações do fabricante, com algumas adaptações. Três
gramas de folha+1 de plantas estressadas e do controle dos dois pontos de coleta foram
depositados em tubo contendo 18 mL de chloroplast isolation buffer (CIB) com BSA 0,1%
gelado. As amostras foram processadas em homogeneizador Turrax Omni GLH, em 3 ciclos
de 5 segundos, em velocidade média, depois filtradas em membrana de Nylon (Mesh 100) e
em seguida centrifugado a 200xg por 3 minutos a 4 °C para remover células intactas e
pedaços de parede celular. Para precipitar os cloroplastos, o sobrenadante foi coletado em
novo tubo e centrifugado a 1000 xg por 7 minutos a 4 °C. O pellet foi ressuspendido em 1 mL
54
de CIB com BSA 0,1%.
A suspensão de cloroplastos foi adicionada a um gradiente de Percoll 80%/40%
na proporção 1:2 v/v, que foi posteriormente submetido a centrifugação em 4.000 rpm por
15 minutos a 4°C. Os cloroplastos intactos foram coletados, formando uma banda na
interface entre as camadas de 40% e 80% de Percoll e transferidos para um novo tubo para
etapas de lavagem.
Foi adicionado um volume igual a 3 vezes o volume dos cloroplastos coletados de
CIB, seguido de centrifugação a 1.700 xg por 3 minutos a 4°C. O sobrenadante foi descartado
e o pellet de cloroplastos foi ressuspendido em 500 μL de CIB.
Extração de proteínas de cloroplasto e processamento das amostras
A extração das proteínas dos cloroplastos foi realizada segundo protocolo
adaptado de (Shiraya et al., 2014). Foi adicionado à suspensão de cloroplastos cinco vezes o
volume de tampão de extração de proteínas (Tioureia; CHAPS; 1M Tris-HCl, pH 8; Glicerol
50%; Triton X-100; 1 M DTT e 8 M Ureia), seguido de centrifugação a 4.000 rpm por 5min a
4°C para remoção de material membranoso. O sobrenadante foi coletado e transferido para
um novo tubo.
Foi adicionado um volume igual a 10 vezes o volume do sobrenadante de
acetona gelada que foi armazenado por 48 horas a -20 °C. O conteúdo de acetona foi
submetido a centrifugação a 4.000 rpm por 15 minutos a 4 °C. O sobrenadante foi
descartado e o pellet proteico foi ressuspendido em tampão de amostra contendo 125 mM
Tris pH 6,8; 20% glicerol; 1% SDS e 1% DTT, armazenado a -80 °C.
A suspensão proteica foi precipitada através da adição de acetona gelada, que foi
incubada apor 1hora a 4 °C, posteriormente centrifugada por 10 min a 10.000 g. O
sobrenadante foi descartado. O procedimento foi repetido mais duas vezes. Em seguida foi
realizada a digestão com tripsina e dessalinização através do kit Pierce C18 Spin Columns
(Thermo Fischer Scientific, Bremen, Alemanhã) previamente às análises por espectrometria
de massas.
Análises por espectrometria de massas e identificação de proteínas
Previamente às análises no espectrômetro de massas, os peptídeos digeridos
foram ressuspendidos em solução aquosa de 0,1% de ácido fórmico e separados em um
sistema cromatográfico do tipo EASY-nLC1000 (Thermo Fischer Scientific, Bremen,
Alemanhã).
55
A ionização e injeção dos peptídeos no espectrômetro de massas (Q-Exactive,
Thermo) foi realizada por electrospray (ESI), utilizando-se 2,5kV de potencial aplicado
diretamente na agulha de injeção.
A identificação das proteínas foi realizada por buscas baseadas nas sequências de
proteínas do banco de dados de cana-de-açúcar do SUCEST. O alinhamento e a anotação
foram realizados por meio do uso do programa Blast2GO (Conesa et al., 2005).
Análise de proteínas de cloroplasto diferencialmente expressas sob estresse
hídrico.
A expressão das proteínas identificadas foi normalizada através do fator NSAF
(normalized spectral abundance factor), descrito por Zybailov et al. (2006). A comparação
entre a abundância de proteínas nos tratamentos Seca e Controle foi representada em fold-
change e foram consideradas diferencialmente expressas as que apresentaram fold-change
maior que 1,5 e aquelas que estão presentes em um dos tratamentos e ausentes no outro.
Como os dados não apresentaram distribuição normal, o teste estatístico aplicado foi o não-
paramétrico Kruskal-Wallis.
56
Material Suplementar
Tabela Suplementar 1. Resultados resumidos da anotação via Blast2GO e expressão diferencial das proteínas identificadas.
SAS Descrição sinal | fold change Lembke et al. (2012) Vias envolvidas Blast E-Value Blast Similarity Mean
Reference Promoter Gene choice Gene function Transformation
method
Age
(DAP)
Time of
stress
(days)
Experimental
conditions
Zhang et al., 2006 p35S
enhanced Tsase
biomolecules
stabilization Agrobacterium 90 15 G/F
Kumar et al., 2014 p35S AVP1 osmotic regulation Agrobacterium 21 15 G
Reis et al., 2014 pRab17 DREB2A CA gene regulation Biolistic 90 6 G
Augustine et al.,
2015a pUbi PDH45
nucleic acids
metabolism Agrobacterium 120 10 G
Augustine et al.,
2015b pUbi PDH4; DREB2
nucleic acids
metabolism; gene
regulation
Agrobacterium/
biolistic 120 10 G
Augustine et al.,
2015c pUbi HSP70
cellular
componentes;
stabilization
Agrobacterium 120 10 G
Ramiro et al., 2016 pUbi BI-1 PCD regulation Biolistic 90 21 G
Raza et al., 2016 p35S
enhanced AVP1 osmotic regulation Biolistic 60 180* G
89
Figure and Table legends
Table 1and 2: DAP: days after planting. ET: evapotranspiration. G: greenhouse. F: field *:
increase under drought.
Table 3: DAP: days after planting. SAS: sugarcane assembled sequence. ESTs: expression
sequence tags. G: greenhouse.
Table 4: PCD: programmed cell death. DAP: day after planting. G: greenhouse. F: field.* :
irrigation reduced 50%.
Figure 1: Fluorescence emission under drought stress. Fluorescence dynamics on dark- or
light-adapted leaves when cultivated under normal conditions (green lines) or under drought
stress (red lines). When leaves are dark-adapted the QA (Plastoquinone) is maximally oxidized
and the PSII is called “open”. The exposure of the leaf to a weak measuring light (asterisks
mark the point where the measuring light was turned on) results in a minimal level of
measured fluorescence (F0). A saturating pulse is emitted (blue arrows) and Fm, or maximum
fluorescence is recorded. The difference between Fm and F0 in called Fv or variable
fluorescence. The Fv/Fm is called maximum quantum yield of QA reduction or PSII
photochemistry. When the leaf is light adapted, the minimal level of fluorescence shifts above
the original background (F’). In this situation less QA is oxidized and when a light pulse is
emitted the maximum fluorescence for light adapted leaves (Fm’) is recorded and its level is
lower that the Fm because when the plants are subjected to stress the photochemical quenching
is diminished due to the photoinativation of the PSII leading to a higher level of the non-
photochemical quenching (NPQ) or the dissipation of energy through heat. Fv’ is calculated as
Fm’-F’. Fv’/Fm’ is called maximum PSII efficiency. This parameter is used to measure the
contribution of the NPQ on the observed changes on the PSII operation.
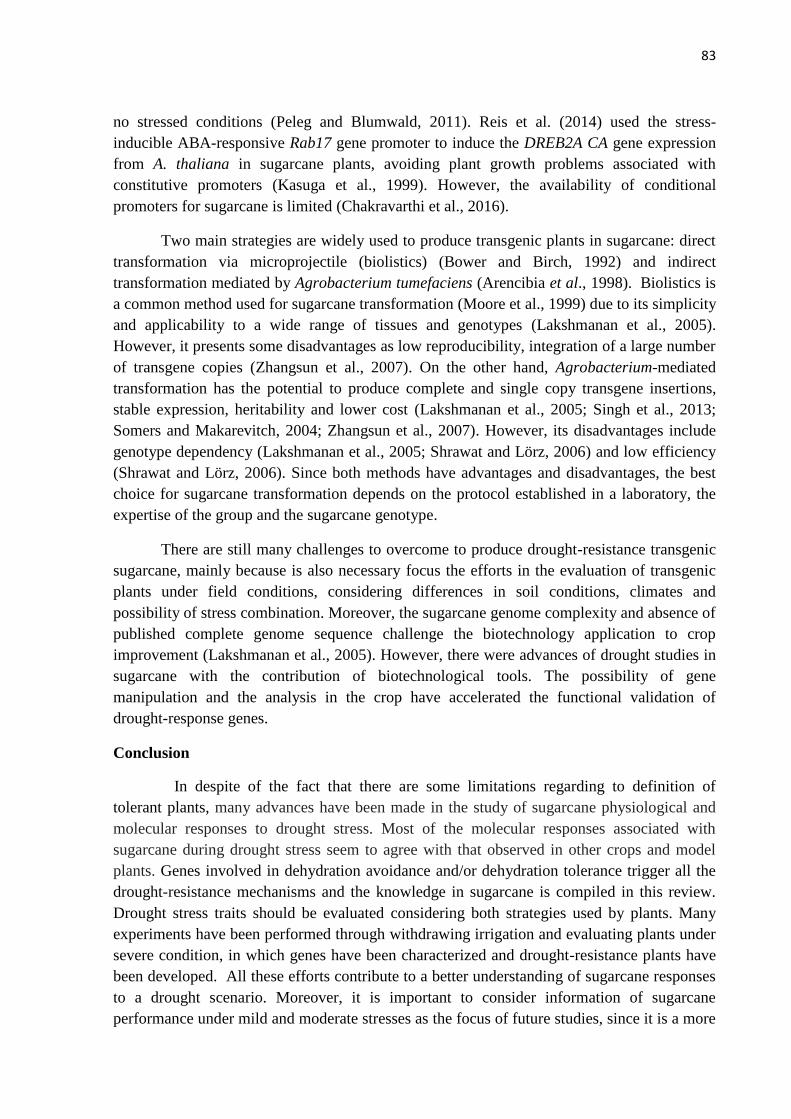
Figure 2: Scheme of sugarcane drought-response mechanisms.
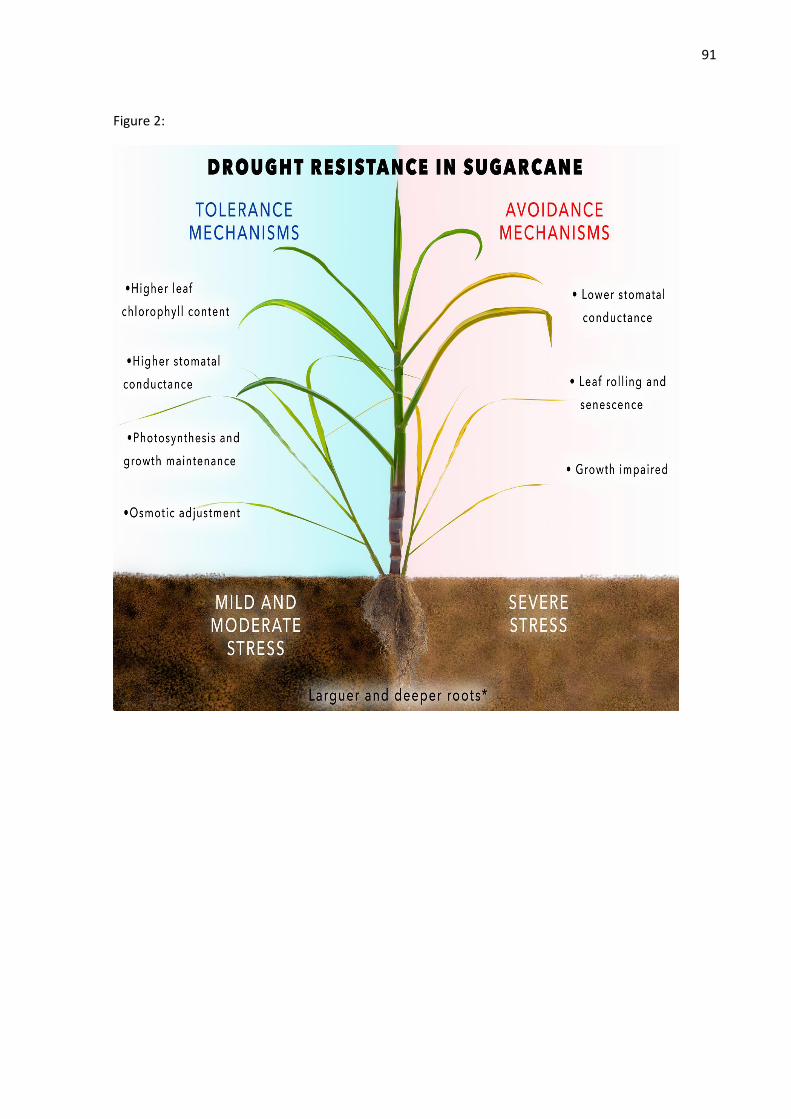
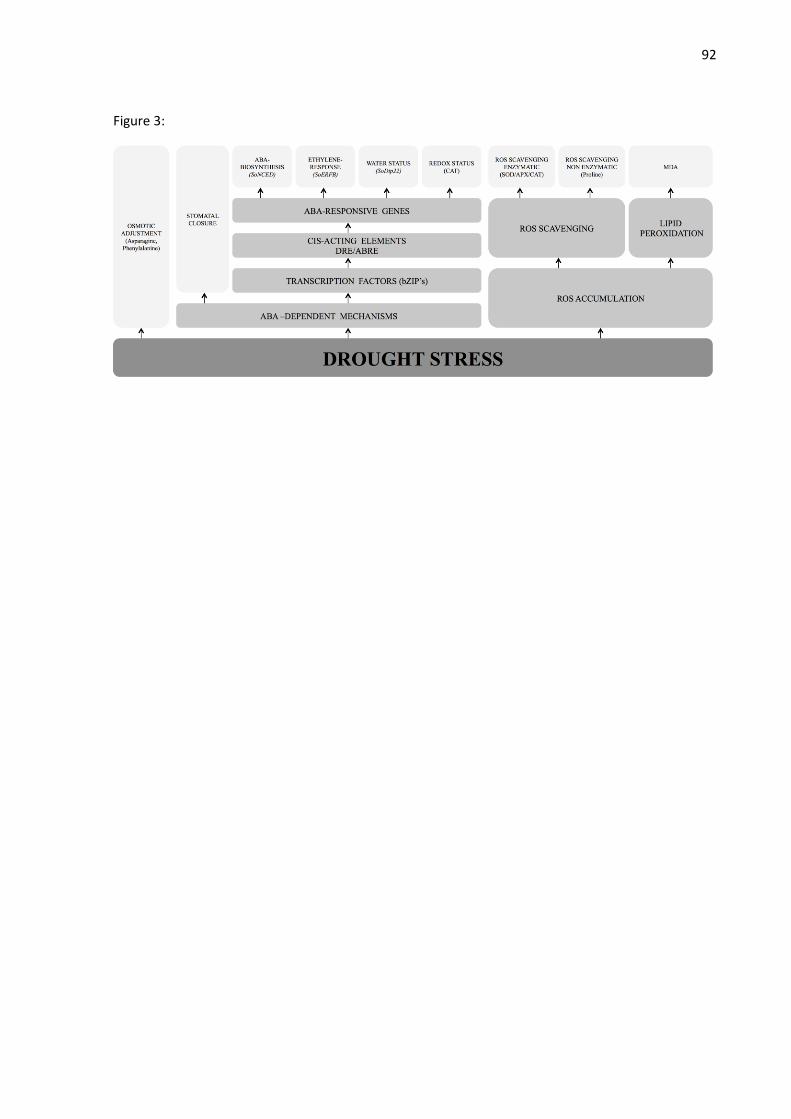
Figure 3: Known biochemical drought
90
Figures
Figure1:
91
Figure 2:
92
Figure 3:
93
Conflict of Interest
The authors declare that the research was conducted in the absence of any commercial or
financial relationships that could be construed as a potential conflict of interest.
Author Contributions
Contributed equally to this work: TF, MT, DB. Substantial contributions to the conception or
design of the work: TF, MT, DB, LM, PA, GG, GR, VG. Drafting the work: TF, MT, DB, LM, PA,
GG, GR, VG. Revising it critically for important intellectual content: MM, TF, MT, DB. Final
approval of the version to be published: MM. Agreement to be accountable for all aspects of the work
in ensuring that questions related to the accuracy or integrity of any part of the work are appropriately
investigated and resolved: MM, TF, MT, DB, LM, PA, GG, GR, VG.
Acknowledgments
The Laboratório de Genoma Funcional (LGF) is supported by São Paulo Research
Foundation (FAPESP), National Council for Scientific and Technological Development
(CNPq) and Brazilian Federal Agency for Support and Evaluation of Graduate Education
(CAPES).
94
References
Abbas, S., Ahmad, S., Sabir, S., and Shah, A. (2014). Detection of drought tolerant sugarcane genotypes (Saccharum officinarum) using lipid peroxidation, antioxidant activity, glycine-betaine and proline contents. Journal of soil science and plant nutrition 14, 233-243.
Abdeeva, I., Piruzian, E., Abdeev, R., and Bruskin, S. (2012). Transgenic plants as a tool for plant functional genomics (INTECH Open Access Publisher).
Ahmad, P., Jaleel, C.A., Salem, M.A., Nabi, G., and Sharma, S. (2010). Roles of enzymatic and nonenzymatic antioxidants in plants during abiotic stress. Critical reviews in biotechnology 30, 161-175.
Alexandersson, E., Fraysse, L., Sjövall-Larsen, S., Gustavsson, S., Fellert, M., Karlsson, M., Johanson, U., and Kjellbom, P. (2005). Whole gene family expression and drought stress regulation of aquaporins. Plant molecular biology 59, 469-484.
An, Y., Liu, L., Chen, L., and Wang, L. (2016). ALA Inhibits ABA-induced Stomatal Closure via Reducing H2O2 and Ca2+ Levels in Guard Cells. Frontiers in Plant Science 7.
Augustine, S.M., Narayan, J.A., Syamaladevi, D.P., Appunu, C., Chakravarthi, M., Ravichandran, V., and Subramonian, N. (2015a). Erianthus arundinaceus HSP70 (EaHSP70) overexpression increases drought and salinity tolerance in sugarcane (Saccharum spp. hybrid). Plant Science 232, 23-34.
Augustine, S.M., Narayan, J.A., Syamaladevi, D.P., Appunu, C., Chakravarthi, M., Ravichandran, V., Tuteja, N., and Subramonian, N. (2015b). Introduction of Pea DNA Helicase 45 into Sugarcane (Saccharum spp. Hybrid) Enhances Cell Membrane Thermostability and Upregulation of Stress-Responsive Genes Leads to Abiotic Stress Tolerance. Molecular Biotechnology 57, 475-488.
Augustine, S.M., Narayan, J.A., Syamaladevi, D.P., Appunu, C., Chakravarthi, M., Ravichandran, V., Tuteja, N., and Subramonian, N. (2015c). Overexpression of EaDREB2 and pyramiding of EaDREB2 with the pea DNA helicase gene (PDH45) enhance drought and salinity tolerance in sugarcane (Saccharum spp. hybrid). Plant cell reports 34, 247-263.
Barclay, K.D., and McKersie, B.D. (1994). Peroxidation reactions in plant membranes: effects of free fatty acids. Lipids 29, 877-882.
Bartels, D., and Sunkar, R. (2005). Drought and salt tolerance in plants. Critical Reviews in Plant Sciences 24, 23-58.
Battraw, M.J., and Hall, T.C. (1990). Histochemical analysis of CaMV 35S promoter-
β-glucuronidase gene expression in transgenic
rice plants. Plant Molecular Biology 15, 527-538.
Baxter, A., Mittler, R., and Suzuki, N. (2014). ROS as key players in plant stress signalling. Journal of experimental botany 65, 1229-1240.
Benfey, P.N., Ren, L., and Chua, N.-H. (1990). Tissue-specific expression from CaMV 35S enhancer subdomains in early stages of plant development. The EMBO journal 9, 1677.
Bhaskara, G.B., Yang, T.-H., and Verslues, P.E. (2015). Dynamic proline metabolism: importance and regulation in water limited environments. Frontiers in plant science 6.
Blum, A. (2005). Drought resistance, water-use efficiency, and yield potential—are they compatible, dissonant, or mutually exclusive? Crop and Pasture Science 56, 1159-1168.
Boaretto, L.F., Carvalho, G., Borgo, L., Creste, S., Landell, M.G., Mazzafera, P., and Azevedo, R.A. (2014). Water stress reveals differential antioxidant responses of tolerant and non-tolerant sugarcane genotypes. Plant Physiology and Biochemistry 74, 165-175.
95
Bonnett, G.D. (2014). Developmental Stages (Phenology), First edn.
Bower, R., and Birch, R.G. (1992). Transgenic sugarcane plants via microprojectile bombardment. The Plant Journal 2, 409-416.
Bueno, L.C.S., Mendes, A.N.G., and Carvalho, S.P. (2006). Melhoramento genético de plantas: princípios e procedimentos. (Lavras: UFLA), pp. 319.
Bustin, S. (2002). Quantification of mRNA using real-time reverse transcription PCR (RT-PCR): trends and problems. Journal of molecular endocrinology 29, 23-39.
Bustin, S.A. (2000). Absolute quantification of mRNA using real-time reverse transcription polymerase chain reaction assays. Journal of molecular endocrinology 25, 169-193.
Camargo, S.R. (2007). Identificação de genes e uso de promotores modulados por etanol em cana-de-açúcar. In Genética e Evolução (Campinas: Unicamp).
Cha-Um, S., and Kirdmanee, C. (2008). Effect of osmotic stress on proline accumulation, photosynthetic abilities and growth of sugarcane plantlets (Saccharum officinarum L.). Pak J Bot 40, 2541-2552.
Chakravarthi, M., Syamaladevi, D.P., Harunipriya, P., Augustine, S.M., and Subramonian, N. (2016). A novel PR10 promoter from Erianthus arundinaceus directs high constitutive transgene expression and is enhanced upon wounding in heterologous plant systems. Molecular biology reports 43, 17-30.
Chaves, M.M., Maroco, J.P., and Pereira, J.S. (2003). Understanding plant responses to drought—from genes to the whole plant. Functional plant biology 30, 239-264.
Christensen, A.H., Sharrock, R.A., and Quail, P.H. (1992). Maize polyubiquitin genes: structure, thermal perturbation of expression and transcript splicing, and promoter activity following transfer to protoplasts by electroporation. Plant molecular biology 18, 675-689.
Cia, M., Guimarães, A., Medici, L., Chabregas, S., and Azevedo, R. (2012). Antioxidant responses to water deficit by
drought‐tolerant and‐sensitive sugarcane
varieties. Annals of Applied Biology 161, 313-324.
Cominelli, E., Conti, L., Tonelli, C., and Galbiati, M. (2013). Challenges and perspectives to improve crop drought and salinity tolerance. New biotechnology 30, 355-361.
Cruz de Carvalho, M.H. (2008). Drought stress and reactive oxygen species: production, scavenging and signaling. Plant signaling & behavior 3, 156-165.
Czechowski, T., Stitt, M., Altmann, T., Udvardi, M.K., and Scheible, W.R. (2005). Genome-wide identification and testing of superior reference genes for transcript normalization in Arabidopsis. Plant Physiology 139, 5-17.
Da Graça, J., Rodrigues, F., Farias, J., Oliveira, M.d., Hoffmann-Campo, C., and Zingaretti, S. (2010). Physiological parameters in sugarcane cultivars submitted to water deficit (BRAZILIAN SOCIETY OF PLANT PHYSIOLOGY).
Da Silva, A.L.C., and Da Costa, W.A.J.M. (2004). Varietal variation in growth,physiology and yield of sugarcane under two contrasting water regimes (Tropical Agricultural Research), pp. 1-12.
da Silva, M.D., Silva, R.L.d.O., Costa Ferreira Neto, J.R., Guimarães, A.C.R., Veiga, D.T., Chabregas, S.M., Burnquist, W.L., Kahl, G., Benko-Iseppon, A.M., and Kido, E.A. (2013). Expression Analysis of Sugarcane Aquaporin Genes under Water Deficit. Journal of Nucleic Acids 2013, 763945.
da Silva, P.P., Soares, L., da Costa, J.G., da Silva Viana, L., de Andrade, J.C.F., Gonçalves, E.R., dos Santos, J.M., de Souza Barbosa, G.V., Nascimento, V.X., Todaro, A.R., et al. (2012a). Path analysis for selection of drought tolerant sugarcane genotypes through physiological components. 37, 11-19.
da Silva, P.P., Soares, L., da Costa, J.G., Viana, L.d.S., Farias de Andrade, J.C., Goncalves, E.R.,
96
dos Santos, J.M., de Souza Barbosa, G.V., Nascimento, V.X., Todaro, A.R., et al. (2012b). Path analysis for selection of drought tolerant sugarcane genotypes through physiological components. Industrial Crops and Products 37, 11-19.
Das, K., and Roychoudhury, A. (2014). Reactive oxygen species (ROS) and response of antioxidants as ROS-scavengers during environmental stress in plants. Frontiers in Environmental Science 2, 53.
Delorge, I., Janiak, M., Carpentier, S., and Van Dijck, P. (2014). Fine tuning of trehalose biosynthesis and hydrolysis as novel tools for the generation of abiotic stress tolerant plants. Frontiers in plant science 5, 147.
Dhadi, S.R., Krom, N., and Ramakrishna, W. (2009). Genome-wide comparative analysis of putative bidirectional promoters from rice, Arabidopsis and Populus. Gene 429, 65-73.
Dodd, I.C. (2003). Hormonal interactions and stomatal responses. Journal of plant growth regulation 22, 32-46.
Domaingue, R. (1995). Family and varietal adaptation of sugarcane to dry conditions and relevante to selection procedures. (Bangkok: ISSCT: Proceedings), pp. 418-435.
dos Santos, C.M., and de Almeida Silva, M. (2015). Physiological and biochemical responses of sugarcane to oxidative stress induced by water deficit and paraquat. Acta Physiologiae Plantarum 37, 1-14.
dos Santos, C.M., de Almeida Silva, M., Lima, G.P.P., Bortolheiro, F.P.d.A.P., Brunelli, M.C., de Holanda, L.A., and Oliver, R. (2015). Physiological changes associated with antioxidant enzymes in response to sugarcane tolerance to water deficit and rehydration. Sugar Tech 17, 291-304.
Du, Y., Kawamitsu, Y., Nose, A., Hiyane, S., Murayama, S., Wasano, K., and Uchida, Y. (1996). Effects of water stress on carbon exchange rate and activities of photosynthetic enzymes in leaves of sugarcane (Saccharum sp). Australian Journal of Plant Physiology 23, 719-726.
Dutt, M., Dhekney, S.A., Soriano, L., Kandel, R., and Grosser, J.W. (2014). Temporal and spatial control of gene expression in horticultural crops. Horticulture research 1, 14047.
Endres, L., Silva, J.V., Ferreira, V.M., and Barbosa, G.V.S. (2010). Photosynthesis and water relations in Brazilian sugarcane (Open Agric. J.), pp. 31-37.
FAO (2015). Food and Agriculture Organization statistics.
Ferreira, T.H., Gentile, A., Vilela, R.D., Costa, G.G., Dias, L.I., Endres, L., and Menossi, M. (2012). microRNAs associated with drought response in the bioenergy crop sugarcane (Saccharum spp.). PLoS One 7, e46703.
Gentile, A., Dias, L.I., Mattos, R.S., Ferreira, T.H., and Menossi, M. (2015). MicroRNAs and drought responses in sugarcane. Front Plant Sci 6, 58.
Gentile, A., Ferreira, T.H., Mattos, R.S., Dias, L.I., Hoshino, A.A., Carneiro, M.S., Souza, G.M., Calsa, T., Nogueira, R.M., Endres, L., et al. (2013). Effects of drought on the microtranscriptome of field-grown sugarcane plants. Planta 237, 783-798.
Gill, S.S., and Tuteja, N. (2010). Reactive oxygen species and antioxidant machinery in abiotic stress tolerance in crop plants. Plant physiology and biochemistry 48, 909-930.
Goldschmidt, E.E., and Huber, S.C. (1992). Regulation of photosynthesis by end-product accumulation in leaves of plants storing starch, sucrose, and hexose sugars. Plant physiology 99, 1443-1448.
Guan, L.M., Zhao, J., and Scandalios, J.G.
(2000). Cis‐elements and trans‐factors that
regulate expression of the maize Cat1 antioxidant gene in response to ABA and osmotic stress: H2O2 is the likely intermediary signaling molecule for the response. The Plant Journal 22, 87-95.
Guimarães, E.R., Mutton, M.A., Mutton, M.J.R., Ferro, M.I.T., Ravaneli, G.C., and Silva, J.A.d. (2008). Free proline accumulation in sugarcane under water restriction and
97
spittlebug infestation. Scientia agricola 65, 628-633.
Guo, J., Ling, H., Wu, Q., Xu, L., and Que, Y. (2014). The choice of reference genes for assessing gene expression in sugarcane under salinity and drought stresses. Scientific reports 4.
Guo, Y., and Tan, J. (2015). Recent Advances in the Application of Chlorophyll a Fluorescence from Photosystem II. Photochemistry and Photobiology 91, 1-14.
Gupta, A.K., and Kaur, N. (2005). Sugar signalling and gene expression in relation to carbohydrate metabolism under abiotic stresses in plants. Journal of biosciences 30, 761-776.
Gupta, P., Raghuvanshi, S., and K TYAGI, A. (2001). Assessment of the Efficiency of Various Gene Promoters via Biolistics in Leaf and Regenerating Seed Callus of Millets, Eleusine coracana and Echinochloa crusgalli. Plant Biotechnology 18, 275-282.
Gutierrez, L., Mauriat, M., Guenin, S., Pelloux, J., Lefebvre, J.-F., Louvet, R., Rusterucci, C., Moritz, T., Guerineau, F., Bellini, C., et al. (2008). The lack of a systematic validation of reference genes: a serious pitfall undervalued in reverse transcription-polymerase chain reaction (RT-PCR) analysis in plants. Plant Biotechnology Journal 6, 609-618.
Han, C., and Yang, P. (2015). Studies on the molecular mechanisms of seed germination. Proteomics 15, 1671-1679.
Hemaprabha, G., Nagarajan, R., and Alarmelu, S. (2004). Response of sugarcane genotypes to water deficit stress. Sugar Tech 6, 165-168.
Himmelbach, A., Yang, Y., and Grill, E. (2003). Relay and control of abscisic acid signaling. Curr Opin Plant Biol 6, 470-479.
Hirayama, T., and Shinozaki, K. (2010). Research on plant abiotic stress responses in the post-genome era: past, present and future. Plant J 61, 1041-1052.
Hodges, D.M., DeLong, J.M., Forney, C.F., and Prange, R.K. (1999). Improving the thiobarbituric acid-reactive-substances assay for estimating lipid peroxidation in plant tissues containing anthocyanin and other interfering compounds. Planta 207, 604-611.
Hu, H., and Xiong, L. (2014). Genetic engineering and breeding of drought-resistant crops. Annu Rev Plant Biol 65, 715-741.
Huang, G.-T., Ma, S.-L., Bai, L.-P., Zhang, L., Ma, H., Jia, P., Liu, J., Zhong, M., and Guo, Z.-F. (2012). Signal transduction during cold, salt, and drought stresses in plants. Molecular biology reports 39, 969-987.
Inman-Bamber, N. (2004). Sugarcane water stress criteria for irrigation and drying off. Field Crops Research 89, 107-122.
Inman-Bamber, N., Bonnett, G., Spillman, M., Hewitt, M., and Jackson, J. (2008). Increasing sucrose accumulation in sugarcane by manipulating leaf extension and photosynthesis with irrigation. Australian Journal of Agricultural Research 59, 13-26.
Inman-Bamber, N., Lakshmanan, P., and Park, S. (2012). Sugarcane for water-limited environments: Theoretical assessment of suitable traits. Field Crops Research 134, 95-104.
Inman-Bamber, N., and Smith, D. (2005). Water relations in sugarcane and response to water deficits. Field Crops Research 92, 185-202.
Iskandar, H.M., Casu, R.E., Fletcher, A.T., Schmidt, S., Xu, J., Maclean, D.J., Manners, J.M., and Bonnett, G.D. (2011). Identification of drought-response genes and a study of their expression during sucrose accumulation and water deficit in sugarcane culms. Bmc Plant Biology 11.
Iskandar, H.M., Simpson, R.S., Casu, R.E., Bonnett, G.D., Maclean, D.J., and Manners, J.M. (2004). Comparison of reference genes for quantitative real-time polymerase chain reaction analysis of gene expression in sugarcane. Plant Molecular Biology Reporter 22, 325-337.
98
Ito, T., and Meyerowitz, E.M. (2000). Overexpression of a gene encoding a cytochrome P450, CYP78A9, induces large and seedless fruit in Arabidopsis. The Plant Cell 12, 1541-1550.
Jain, R., Chandra, A., Venugopalan, V.K., and Solomon, S. (2015). Physiological changes and expression of SOD and P5CS genes in response to water deficit in sugarcane. Sugar Tech 17, 276-282.
Jangpromma, N., Kitthaisong, S., Lomthaisong, K., Daduang, S., Jaisil, P., and Thammasirirak, S. (2010). A proteomics analysis of drought stress-responsive proteins as biomarker for drought-tolerant sugarcane cultivars. American Journal of Biochemistry and Biotechnology 6, 89-102.
Jangpromma, N., Thammasirirak, S., Jaisil, P., and Songsri, P. (2012). Effects of drought and recovery from drought stress on above ground and root growth, and water use efficiency in sugarcane ( Saccharum officinarum L.). (Aust J Crop Sci).
Jiang, M., and Zhang, J. (2001). Effect of abscisic acid on active oxygen species, antioxidative defence system and oxidative damage in leaves of maize seedlings. Plant and Cell Physiology 42, 1265-1273.
Jiang, M., and Zhang, J. (2002). Water
stress‐induced abscisic acid accumulation
triggers the increased generation of reactive
oxygen species and up‐regulates the
activities of antioxidant enzymes in maize leaves. Journal of Experimental Botany 53, 2401-2410.
Johnson, R.R., Wagner, R.L., Verhey, S.D., and Walker-Simmons, M.K. (2002). The abscisic acid-responsive kinase PKABA1 interacts with a seed-specific abscisic acid response element-binding factor, TaABF, and phosphorylates TaABF peptide sequences. Plant Physiology 130, 837-846.
Kasuga, M., Liu, Q., Miura, S., Yamaguchi-Shinozaki, K., and Shinozaki, K. (1999). Improving plant drought, salt, and freezing tolerance by gene transfer of a single stress-
Kizis, D., and Lumbreras, V. (2001). Role of AP2/EREBP transcription factors in gene regulation during abiotic stress. FEBS letters 498, 187-189.
Kondou, Y., Higuchi, M., and Matsui, M. (2010). High-throughput characterization of plant gene functions by using gain-of-function technology. Annual review of plant biology 61, 373-393.
Kooyers, N.J. (2015). The evolution of drought escape and avoidance in natural herbaceous populations. Plant Science 234, 155-162.
Kumar, T., Khan, M.R., Abbas, Z., and Ali, G.M. (2014). Genetic improvement of sugarcane for drought and salinity stress tolerance using Arabidopsis vacuolar pyrophosphatase (AVP1) gene. Molecular biotechnology 56, 199-209.
Lakshmanan, P., Geijskes, R.J., Aitken, K.S., Grof, C.L., Bonnett, G.D., and Smith, G.R. (2005). Sugarcane biotechnology: the challenges and opportunities. In Vitro Cellular & Developmental Biology-Plant 41, 345-363.
Lakshmanan, P., and Robinson, N. (2014). Stress physiology: Abiotic stresses, First edn.
Lapidot, M., and Pilpel, Y. (2006). Genome-wide natural antisense transcription: coupling its regulation to its different regulatory mechanisms. EMBO Reports 7, 1216-1222.
Last, D., Brettell, R., Chamberlain, D., Chaudhury, A., Larkin, P., Marsh, E., Peacock, W., and Dennis, E. (1991). pEmu: an improved promoter for gene expression in cereal cells. Theoretical and Applied Genetics 81, 581-588.
Lembke, C.G., Nishiyama, M.Y., Sato, P.M., de Andrade, R.F., and Souza, G.M. (2012). Identification of sense and antisense transcripts regulated by drought in sugarcane. Plant Mol Biol 79, 461-477.
Levitt, J. (1972). Responses of plants to environmental stresses, pp. 697.
99
Li, C., Nong, Q., Solanki, M.K., Liang, Q., Xie, J., Liu, X., Li, Y., Wang, W., Yang, L., and Li, Y. (2016). Differential expression profiles and pathways of genes in sugarcane leaf at elongation stage in response to drought stress. Scientific reports 6.
Li, C.-N., Srivastava, M.-K., Nong, Q., Yang, L.-T., and Li, Y.-R. (2013). Molecular cloning and characterization of SoNCED, a novel gene encoding 9-cis-epoxycarotenoid dioxygenase from sugarcane (Saccharum officinarum L.). Genes & Genomics 35, 101-109.
Li, S., Assmann, S.M., and Albert, R. (2006). Predicting essential components of signal transduction networks: a dynamic model of guard cell abscisic acid signaling. PLoS Biol 4, e312.
Ling, H., Wu, Q., Guo, J., Xu, L., and Que, Y. (2014). Comprehensive selection of reference genes for gene expression normalization in sugarcane by real time quantitative RT-PCR. PloS one 9, e97469.
Lobell, D.B., Schlenker, W., and Costa-Roberts, J. (2011). Climate trends and global crop production since 1980. Science 333, 616-620.
Luis, A. (2015). ROS and RNS in plant physiology: an overview. Journal of experimental botany 66, 2827-2837.
Luna, C.M., Pastori, G.M., Driscoll, S., Groten, K., Bernard, S., and Foyer, C.H. (2005). Drought controls on H2O2 accumulation, catalase (CAT) activity and CAT gene expression in wheat. Journal of experimental botany 56, 417-423.
Machado, R., Ribeiro, R., Marchiori, P., Machado, D., Machado, E., and Landell, M. (2009). Biometric and physiological responses to water deficit in sugarcane at different phenological stages. Pesquisa Agropecuaria Brasileira 44, 1575-1582.
Mahajan, S., and Tuteja, N. (2005). Cold, salinity and drought stresses: An overview. Archives of Biochemistry and Biophysics 444, 139-158.
Matsumura, H., Yoshida, K., Luo, S., Krüger, D.H., Kahl, G., Schroth, G.P., and Terauchi, R. (2011). High-throughput superSAGE. PCR Protocols, 135-146.
Maurel, C., Verdoucq, L., Luu, D.-T., and Santoni, V. (2008). Plant aquaporins: membrane channels with multiple integrated functions. Annu Rev Plant Biol 59, 595-624.
McCormick, A.J., Cramer, M.D., and Watt, D.A. (2008). Regulation of photosynthesis by sugars in sugarcane leaves. Journal of plant physiology 165, 1817-1829.
McElroy, D., Blowers, A.D., Jenes, B., and Wu, R. (1991). Construction of expression vectors
based on the rice actin 1 (Act1) 5′ region for
use in monocot transformation. Molecular and General Genetics MGG 231, 150-160.
Medeiros, D.B., da Silva, E.C., Mansur Custodio Nogueira, R.J., Teixeira, M.M., and Buckeridge, M.S. (2013). Physiological limitations in two sugarcane varieties under water suppression and after recovering. Theoretical and Experimental Plant Physiology 25, 213-222.
Miller, G., Suzuki, N., CIFTCI‐YILMAZ, S., and
Mittler, R. (2010). Reactive oxygen species homeostasis and signalling during drought and salinity stresses. Plant, cell & environment 33, 453-467.
Mittler, R. (2002). Oxidative stress, antioxidants and stress tolerance. Trends in plant science 7, 405-410.
Mittler, R., Vanderauwera, S., Gollery, M., and Van Breusegem, F. (2004). Reactive oxygen gene network of plants. Trends in plant science 9, 490-498.
Mittler, R., Vanderauwera, S., Suzuki, N., Miller, G., Tognetti, V.B., Vandepoele, K., Gollery, M., Shulaev, V., and Van Breusegem, F. (2011). ROS signaling: the new wave? Trends in plant science 16, 300-309.
100
Molinari, H.B.C., Marur, C.J., Bespalhok Filho, J.C., Kobayashi, A.K., Pileggi, M., Júnior, R.P.L., Pereira, L.F.P., and Vieira, L.G.E. (2004). Osmotic adjustment in transgenic citrus rootstock Carrizo citrange (Citrus sinensis Osb. x Poncirus trifoliata L. Raf.) overproducing proline. Plant Science 167, 1375-1381.
Molinari, H.B.C., Marur, C.J., Daros, E., De Campos, M.K.F., De Carvalho, J.F.R.P., Pereira, L.F.P., and Vieira, L.G.E. (2007). Evaluation of
the stress‐inducible production of proline in
transgenic sugarcane (Saccharum spp.): osmotic adjustment, chlorophyll fluorescence and oxidative stress. Physiologia Plantarum 130, 218-229.
Montillet, J.-L., Chamnongpol, S., Rustérucci, C., Dat, J., Van De Cotte, B., Agnel, J.-P., Battesti, C., Inzé, D., Van Breusegem, F., and Triantaphylidès, C. (2005). Fatty acid hydroperoxides and H2O2 in the execution of hypersensitive cell death in tobacco leaves. Plant Physiology 138, 1516-1526.
Moore, P.H., Singh, V., and Kumar, V. (1999). PROGRESS AND DEVELOPMENTS IN SUGARCANE BIOTECHNOLOGB! Paper presented at: Proceedings of the XXIII ISSCT Congress, New Delhi, India, 22-26 February, 1999 Volume 2 (Sugar Technologists' Association of India).
Moran, J.F., Becana, M., Iturbe-Ormaetxe, I., Frechilla, S., Klucas, R.V., and Aparicio-Tejo, P. (1994). Drought induces oxidative stress in pea plants. Planta 194, 346-352.
Moreira, J., Goswami, D., and Zhao, Y. (2007). Bioenergy-successes and barriers. Proceedings of Ises Solar World Congress 2007: Solar Energy and Human Settlement, Vols I-V, 38-45.
Nakazawa, M., Yabe, N., Ichikawa, T., Yamamoto, Y.Y., Yoshizumi, T., Hasunuma, K., and Matsui, M. (2001). DFL1, an
auxin‐responsive GH3 gene homologue,
negatively regulates shoot cell elongation and lateral root formation, and positively regulates the light response of hypocotyl length. The Plant Journal 25, 213-221.
Neill, S., Barros, R., Bright, J., Desikan, R., Hancock, J., Harrison, J., Morris, P., Ribeiro, D., and Wilson, I. (2008). Nitric oxide, stomatal closure, and abiotic stress. Journal of experimental botany 59, 165-176.
Nelson, N. (1994). Energizing porters by proton-motive force. Journal of Experimental Biology 196, 7-13.
Nogueira, F.T., De Rosa, V.E., Menossi, M., Ulian, E.C., and Arruda, P. (2003). RNA expression profiles and data mining of sugarcane response to low temperature. Plant Physiol 132, 1811-1824.
Pagariya, M.C., Devarumath, R.M., and Kawar, P.G. (2012). Biochemical characterization and identification of differentially expressed candidate genes in salt stressed sugarcane. Plant science 184, 1-13.
Papini-Terzi, F.S., Rocha, F.R., Vencio, R.Z.N., Oliveira, K.C., Felix, J.D., Vicentini, R., Rocha, C.D., Simoes, A.C.Q., Ulian, E.C., Di Mauro, S.M.Z., et al. (2005). Transcription profiling of signal transduction-related genes in sugarcane tissues. DNA Research 12, 27-38.
Parent, B., Hachez, C., Redondo, E., Simonneau, T., Chaumont, F., and Tardieu, F. (2009). Drought and abscisic acid effects on aquaporin content translate into changes in hydraulic conductivity and leaf growth rate: a trans-scale approach. Plant physiology 149, 2000-2012.
101
Park, S.-H., Yi, N., Kim, Y.S., Jeong, M.-H., Bang, S.-W., Do Choi, Y., and Kim, J.-K. (2010). Analysis of five novel putative constitutive gene promoters in transgenic rice plants. Journal of experimental botany 61, 2459-2467.
Patade, V.Y., Suprasanna, P., and Bapat, V.A. (2008). Effects of salt stress in relation to osmotic adjustment on sugarcane (Saccharum officinarum L.) callus cultures. Plant Growth Regulation 55, 169-173.
Pei, Z.-M., Murata, Y., Benning, G., Thomine, S., Klüsener, B., Allen, G.J., Grill, E., and Schroeder, J.I. (2000). Calcium channels activated by hydrogen peroxide mediate abscisic acid signalling in guard cells. Nature 406, 731-734.
Peleg, Z., and Blumwald, E. (2011). Hormone balance and abiotic stress tolerance in crop plants. Current opinion in plant biology 14, 290-295.
Pimentel, C. (2004). A relação da planta com a água. (Rio de Janeiro: Seropédica), pp. 191.
Porto, M.S., Pinheiro, M.P.N., Batista, V.G.L., dos Santos, R.C., de Albuquerque Melo Filho, P., and de Lima, L.M. (2014). Plant promoters: an approach of structure and function. Molecular biotechnology 56, 38-49.
Rabbani, M.A., Maruyama, K., Abe, H., Khan, M.A., Katsura, K., Ito, Y., Yoshiwara, K., Seki, M., Shinozaki, K., and Yamaguchi-Shinozaki, K. (2003). Monitoring expression profiles of rice genes under cold, drought, and high-salinity stresses and abscisic acid application using cDNA microarray and RNA gel-blot analyses. Plant Physiol 133, 1755-1767.
Ramesh, P. (2000). Effect of different levels of drought during the formative phase on growth parameters and its relationship with dry matter accumulation in sugarcane. Journal of Agronomy and Crop Science-Zeitschrift Fur Acker Und Pflanzenbau 185, 83-89.
Ramiro, D.A., Melotto-Passarin, D.M., Barbosa, M.d.A., Santos, F.d., Gomez, S.G.P., Massola Júnior, N.S., Lam, E., and Carrer, H. (2016). Expression of Arabidopsis Bax
Inhibitor-1 in transgenic sugarcane confers drought tolerance. . Plant Biotechnol J.
Rampino, P., Pataleo, S., Gerardi, C., Mita, G., and Perrotta, C. (2006). Drought stress response in wheat: physiological and molecular analysis of resistant and sensitive genotypes. Plant Cell and Environment 29, 2143-2152.
RAZA, G., ALI, K., ASHRAF, M.Y., MANSOOR, S., JAVID, M., and ASAD, S. (2016). Overexpression of an H+-PPase gene from Arabidopsis in sugarcane improvesdrought tolerance, plant growth, and photosynthetic responses. Turkish Journal of Biology 40, 109-119.
Reis, R., da Cunha, B., Martins, P., Martins, M., Alekcevetch, J., Chalfun, A., Andrade, A., Ribeiro, A., Qin, F., Mizoi, J., et al. (2014). Induced over-expression of ArDREB2A CA improves drought tolerance in sugarcane. Plant Science 221, 59-68.
Ribeiro, R.V., Machado, R.S., Machado, E.C., Machado, D.F.S.P., Magalhaes Filho, J.R., and Landell, M.G.A. (2013). REVEALING DROUGHT-RESISTANCE AND PRODUCTIVE PATTERNS IN SUGARCANE GENOTYPES BY EVALUATING BOTH PHYSIOLOGICAL RESPONSES AND STALK YIELD. Experimental Agriculture 49, 212-224.
Rocha, F.R., Papini-Terzi, F.S., Nishiyama, M.Y., Vêncio, R.Z., Vicentini, R., Duarte, R.D., de Rosa, V.E., Vinagre, F., Barsalobres, C., Medeiros, A.H., et al. (2007). Signal transduction-related responses to phytohormones and environmental challenges in sugarcane. BMC Genomics 8, 71.
Rodrigues, F.A., Da Graça, J.P., De Laia, M.L., Nhani-Jr, A., Galbiati, J.A., Ferro, M.I.T., FERRO, J.A., and Zingaretti, S.M. (2011). Sugarcane genes differentially expressed during water deficit. Biologia Plantarum, 43-53.
Rodrigues, F.A., de Laia, M.L., and Zingaretti, S.M. (2009). Analysis of gene expression profiles under water stress in tolerant and sensitive sugarcane plants. Plant Science 176, 286-302.
102
Rutherford, R. (1989). The assessment of proline accumulation as a mechanism of drought resistance in sugarcane. Paper presented at: Proceeding of the South African Sugar Technologists’ Association (Citeseer).
Sales, C., Marchiori, P., Machado, R., Fontenele, A., Machado, E., Silveira, J., and Ribeiro, R. (2015). Photosynthetic and antioxidant responses to drought during sugarcane ripening. Photosynthetica 53, 547-554.
Sales, C.R.G., Ribeiro, R.V., Machado, D.F.S.P., Machado, R.S., Dovis, V.L., and Lagôa, A.M.M.A. (2012). Gas exchange and carbohydrate balance in sugarcane plants under root stressful conditions. Bragantia 71, 319-327.
Schlögl, P.S., Nogueira, F.T.S., Drummond, R., Felix, J.M., De Rosa Jr, V.E., Vicentini, R., Leite, A., Ulian, E.C., and Menossi, M. (2008). Identification of new ABA-and MEJA-activated sugarcane bZIP genes by data mining in the SUCEST database. Plant cell reports 27, 335-345.
Seki, M., Ishida, J., Narusaka, M., Fujita, M., Nanjo, T., Umezawa, T., Kamiya, A., Nakajima, M., Enju, A., Sakurai, T., et al. (2002). Monitoring the expression pattern of around 7,000 Arabidopsis genes under ABA treatments using a full-length cDNA microarray. Funct Integr Genomics 2, 282-291.
Sharma, P., Jha, A.B., Dubey, R.S., and Pessarakli, M. (2012). Reactive oxygen species, oxidative damage, and antioxidative defense mechanism in plants under stressful conditions. Journal of Botany 2012.
Shinozaki, K., and Yamaguchi-Shinozaki, K. (1997). Gene expression and signal transduction in water-stress response. Plant physiology 115, 327.
Shinozaki, K., and Yamaguchi-Shinozaki, K. (2007). Gene networks involved in drought
stress response and tolerance. Journal of experimental botany 58, 221-227.
Shulaev, V., and Oliver, D.J. (2006). Metabolic and proteomic markers for oxidative stress. New tools for reactive oxygen species research. Plant Physiology 141, 367-372.
Silva, M., Jifon, J., Da Silva, J., and Sharma, V. (2007). Use of physiological parameters as fast tools to screen for drought tolerance in sugarcane. (Braz. J. Plant Physiol.), pp. 193-201.
Silva, M.d.A., Goncalves da Silva, J.A., Enciso, J., Sharma, V., and Jifon, J. (2008). Yield components as indicators of drought tolerance of sugarcane. Scientia Agricola 65, 620-627.
Silva, M.D.A., Jifon, J.L., Da Silva, J.A.G., Dos Santos, C.M., and Sharma, V. (2014a). Relationships between physiological traits and productivity of sugarcane in response to water deficit. Journal of Agricultural Science 152, 104-118.
Silva, M.d.A., Jifon, J.L., dos Santos, C.M., Jadoski, C.J., and da Silva, J.A.G. (2013). Photosynthetic Capacity and Water Use Efficiency in Sugarcane Genotypes Subject to Water Deficit During Early Growth Phase. Brazilian Archives of Biology and Technology 56, 735-748.
Silva, R.L.d.O., Silva, M.D., Ferreira Neto, J.R.C., Nardi, C.H.d., Chabregas, S.M., Burnquist, W.L., Kahl, G., Benko-Iseppon, A.M., and Kido, E.A. (2014b). Validation of novel reference genes for reverse transcription quantitative real-time PCR in drought-stressed sugarcane. The Scientific World Journal 2014.
Singh, K., Foley, R.C., and Oñate-Sánchez, L. (2002). Transcription factors in plant defense
103
and stress responses. Curr Opin Plant Biol 5, 430-436.
Singh, R., Kumar, P., Tiwari, N., Rastogi, J., and Singh, S. (2013). Current status of sugarcane transgenic: an overview. Advancements in Genetic Engineering 2013.
Skirycz, A., Vandenbroucke, K., Clauw, P., Maleux, K., De Meyer, B., Dhondt, S., Pucci, A., Gonzalez, N., Hoeberichts, F., and Tognetti, V.B. (2011). Survival and growth of Arabidopsis plants given limited water are not equal. Nature biotechnology 29, 212-214.
Skorzynska-Polit, E. (2007). Lipid peroxidation in plant cells, its physiological role and changes under heavy metal stress. Acta Societatis Botanicorum Poloniae 76.
Smit, M., and Singels, A. (2006). The response of sugarcane canopy development to water stress. Field Crops Research 98, 91-97.
Smith, D., Inman-Bamber, N., and Thorburn, P. (2005). Growth and function of the sugarcane root system. Field Crops Research 92, 169-183.
Soares, R.A.B., Oliveira, P.F.M., Cardoso, H.R., Vasconcelos, A.C.M., Landell, M.G.A., and Rosenfeld, U. (2004). Efeito da irrigação sobre o desenvolvimento e a produtividade de duas variedades de cana-de-açúcar colhidas em início de safra. (STAB Açúcar, Álcool e Subprodutos), pp. 38-41.
Somers, D.A., and Makarevitch, I. (2004). Transgene integration in plants: poking or patching holes in promiscuous genomes? Current opinion in Biotechnology 15, 126-131.
Songsri, P., Jogloy, S., Vorasoot, N., Akkasaeng, C., Patanothai, A., and Holbrook, C.C. (2008). Root distribution of drought-resistant peanut genotypes in response to drought. Journal of Agronomy and Crop Science 194, 92-103.
Spiteller, G. (2003). The relationship between changes in the cell wall, lipid peroxidation, proliferation, senescence and cell death. Physiologia Plantarum 119, 5-18.
Su, Y., Guo, J., Ling, H., Chen, S., Wang, S., Xu, L., Allan, A.C., and Que, Y. (2014). Isolation of a novel peroxisomal catalase gene from sugarcane, which is responsive to biotic and abiotic stresses. PloS one 9, e84426.
Sugiharto, B., Sakakibara, H., and Sugiyama, T. (1997). Differential expression of two genes for sucrose-phosphate synthase in sugarcane: molecular cloning of the cDNAs and comparative analysis of gene expression. Plant and cell physiology 38, 961-965.
Tanaka, Y., Sano, T., Tamaoki, M., Nakajima, N., Kondo, N., and Hasezawa, S. (2005). Ethylene inhibits abscisic acid-induced stomatal closure in Arabidopsis. Plant Physiology 138, 2337-2343.
Tardieu, F. (2011). Any trait or trait-related allele can confer drought tolerance: just design the right drought scenario. Journal of experimental botany, err269.
Tardieu, F., Bruckler, L., and Lafolie, F. (1992). Root clumping may affect the root water potential and the resistance to soil-root water transport. Plant and Soil 140, 291-301.
Thiebaut, F., Grativol, C., Tanurdzic, M., Carnavale-Bottino, M., Vieira, T., Motta, M.R., Rojas, C., Vincentini, R., Chabregas, S.M., Hemerly, A.S., et al. (2014). Differential sRNA regulation in leaves and roots of sugarcane under water depletion. PLoS One 9, e93822.
Thomas, H., and Howarth, C.J. (2000). Five ways to stay green. Journal of experimental botany 51, 329-337.
Trujillo, L., Sotolongo, M., Menendez, C., Ochogavia, M., Coll, Y., Hernandez, I., Borras-Hidalgo, O., Thomma, B., Vera, P., and Hernandez, L. (2008). SodERF3, a novel sugarcane ethylene responsive factor (ERF), enhances salt and drought tolerance when overexpressed in tobacco plants. Plant and Cell Physiology 49, 512-525.
Umezawa, T., Nakashima, K., Miyakawa, T., Kuromori, T., Tanokura, M., Shinozaki, K., and Yamaguchi-Shinozaki, K. (2010). Molecular basis of the core regulatory network in ABA
104
responses: sensing, signaling and transport. Plant and cell physiology 51, 1821-1839.
Vargas, L., Santa Brigida, A.B., Mota Filho, J.P., de Carvalho, T.G., Rojas, C.A., Vaneechoutte, D., Van Bel, M., Farrinelli, L., Ferreira, P.C.G., Vandepoele, K., et al. (2014). Drought Tolerance Conferred to Sugarcane by Association with Gluconacetobacter diazotrophicus: A Transcriptomic View of Hormone Pathways. Plos One 9.
Venekamp, J., Grashoff, C., and Koot, J. (1987). An analysis of conditions determining decline in water potential and concurrent proline accumulation in leaves of four cultivars of Vicia faba L. Journal of Agronomy and Crop Science 158, 304-316.
Verbruggen, N., and Hermans, C. (2008). Proline accumulation in plants: a review. Amino acids 35, 753-759.
Vettore, A.L., da Silva, F.R., Kemper, E.L., Souza, G.M., da Silva, A.M., Ferro, M.I., Henrique-Silva, F., Giglioti, E.A., Lemos, M.V., Coutinho, L.L., et al. (2003). Analysis and functional annotation of an expressed sequence tag collection for tropical crop sugarcane. Genome Res 13, 2725-2735.
Wahid, A., and Close, T.J. (2007). Expression of dehydrins under heat stress and their relationship with water relations of sugarcane leaves. Biologia Plantarum 51, 104-109.
Walter, A., Galdos, M., Scarpare, F., Seabra, J., Leal, M., Cunha, M., and Oliveira, C. (2013). Brazilian sugarcane ethanol: developments so far and challenges for the future. (Wires Energy Environment).
Wang, H., Shao, H., and Tang, X. (2016). Recent Advances in Utilizing Transcription Factors to Improve Plant Abiotic Stress Tolerance by Transgenic Technology. Front Plant Sci 7, 67.
Wang, H., Siopongco, J., Wade, L.J., and Yamauchi, A. (2009). Fractal analysis on root systems of rice plants in response to drought stress. Environmental and Experimental Botany 65, 338-344.
Wang, P., and Song, C.P. (2008). Guard‐cell
signalling for hydrogen peroxide and abscisic acid. New Phytologist 178, 703-718.
Wang, W., Vinocur, B., and Altman, A. (2003). Plant responses to drought, salinity and extreme temperatures: towards genetic engineering for stress tolerance. Planta 218, 1-14.
Watanabe, N., and Lam, E. (2008). BAX inhibitor-1 modulates endoplasmic reticulum stress-mediated programmed cell death in Arabidopsis. Journal of Biological Chemistry 283, 3200-3210.
Weeks, J.T., Anderson, O.D., and Blechl, A.E. (1993). Rapid production of multiple independent lines of fertile transgenic wheat (Triticum aestivum). Plant Physiology 102, 1077-1084.
Wilkinson, S., and Davies, W.J. (2002).
ABA‐based chemical signalling: the
co‐ordination of responses to stress in
plants. Plant, cell & environment 25, 195-210.
Wilkinson, S., and Davies, W.J. (2010). Drought, ozone, ABA and ethylene: new insights from cell to plant to community. Plant, Cell & Environment 33.
Wu, Y., Zhou, H., Que, Y.-X., Chen, R.-K., and Zhang, M.-Q. (2008). Cloning and identification of promoter Prd29A and its application in sugarcane drought resistance. Sugar Tech 10, 36-41.
Xiong, L., Schumaker, K.S., and Zhu, J.K. (2002). Cell signaling during cold, drought, and salt stress. Plant Cell 14 Suppl, S165-183.
Yamaguchi, T., and Blumwald, E. (2005). Developing salt-tolerant crop plants: challenges and opportunities. Trends Plant Sci 10, 615-620.
Yang, Y., Fu, Z., Su, Y., Zhang, X., Li, G., Guo, J., Que, Y., and Xu, L. (2014). A cytosolic glucose-6-phosphate dehydrogenase gene, ScG6PDH, plays a positive role in response to various abiotic stresses in sugarcane. 4, 7090.
105
You, J., and Chan, Z. (2015). ROS Regulation During Abiotic Stress Responses in Crop Plants. Front Plant Sci 6, 1092.
Zeevaart, J., and Creelman, R. (1988). Metabolism and physiology of abscisic acid. Annual review of plant physiology and plant molecular biology 39, 439-473.
Zhang, A., Jiang, M., Zhang, J., Tan, M., and Hu, X. (2006a). Mitogen-activated protein kinase is involved in abscisic acid-induced antioxidant defense and acts downstream of reactive oxygen species production in leaves of maize plants. Plant Physiology 141, 475-487.
Zhang, S.Z., Yang, B.P., Feng, C.L., Chen, R.K., Luo, J.P., Cai, W.W., and Liu, F.H. (2006b). Expression of the Grifola frondosa Trehalose Synthase Gene and Improvement of
Drought‐Tolerance in Sugarcane (Saccharum
officinarum L.). Journal of Integrative Plant Biology 48, 453-459.
Zhangsun, D., Luo, S., Chen, R., and Tang, K. (2007). Improved Agrobacterium-mediated genetic transformation of GNA transgenic sugarcane. Biologia 62, 386-393.
Zhu, J.K. (2001). Cell signaling under salt, water and cold stresses. Curr Opin Plant Biol 4, 401-406.
Zhu, J.K. (2002). Salt and drought stress signal transduction in plants. Annu Rev Plant Biol 53, 247-273.
106
Conclusão
O estudo funcional do gene ScatpG, que codifica a subunidade II da ATP sintase
de cloroplasto de cana-de-açúcar, permitiu inferir que os níveis de expressão do gene ScatpG
não é claramente modulados pela seca.
Os dados de expressão de proteínas de cloroplastos de cana-de-açúcar
submetidas ao estresse hídrico, permitiram identificar proteínas induzidas envolvidas no
transporte cíclico de elétrons através do PSI, permitindo inferir seu papel fundamental na
regulação da fotossíntese e na produção de ATP durante o estresse por seca.
Dessa forma, aumentar a capacidade de plantas de cana-de-açúcar a realizar o
transporte cíclico em condições ambientais desfavoráveis é um possível caminho para
produção de plantas com maior tolerância à seca e a outros estresses ambientais
107
Referências
Abbas, S., Ahmad, S., Sabir, S., and Shah, A. (2014). Detection of drought tolerant sugarcane genotypes (Saccharum officinarum) using lipid peroxidation, antioxidant activity, glycine-betaine and proline contents. Journal of soil science and plant nutrition 14, 233-243. Abdeeva, I., Piruzian, E., Abdeev, R., and Bruskin, S. (2012). Transgenic plants as a tool for plant functional genomics (INTECH Open Access Publisher). Ahmad, P., Jaleel, C.A., Salem, M.A., Nabi, G., and Sharma, S. (2010). Roles of enzymatic and nonenzymatic antioxidants in plants during abiotic stress. Critical reviews in biotechnology 30, 161-175. Alexandersson, E., Fraysse, L., Sjövall-Larsen, S., Gustavsson, S., Fellert, M., Karlsson, M., Johanson, U., and Kjellbom, P. (2005). Whole gene family expression and drought stress regulation of aquaporins. Plant molecular biology 59, 469-484. Allen, J.F., de Paula, W.B.M., Puthiyaveetil, S., and Nield, J. (2011). A structural phylogenetic map for chloroplast photosynthesis. Trends Plant Sci 16, 645-655. An, Y., Liu, L., Chen, L., and Wang, L. (2016). ALA Inhibits ABA-induced Stomatal Closure via Reducing H2O2 and Ca2+ Levels in Guard Cells. Frontiers in Plant Science 7. Andersson, U., Heddad, M., and Adamska, I. (2003). Light stress-induced one-helix protein of the chlorophyll a/b-binding family associated with photosystem I. Plant physiology 132, 811-820. Augustine, S.M., Narayan, J.A., Syamaladevi, D.P., Appunu, C., Chakravarthi, M., Ravichandran, V., and Subramonian, N. (2015a). Erianthus arundinaceus HSP70 (EaHSP70) overexpression increases drought and salinity tolerance in sugarcane (Saccharum spp. hybrid). Plant Science 232, 23-34.
Augustine, S.M., Narayan, J.A., Syamaladevi, D.P., Appunu, C., Chakravarthi, M., Ravichandran, V., Tuteja, N., and Subramonian, N. (2015b). Introduction of Pea DNA Helicase 45 into Sugarcane (Saccharum spp. Hybrid) Enhances Cell Membrane Thermostability and Upregulation of Stress-Responsive Genes Leads to Abiotic Stress Tolerance. Molecular Biotechnology 57, 475-488. Augustine, S.M., Narayan, J.A., Syamaladevi, D.P., Appunu, C., Chakravarthi, M., Ravichandran, V., Tuteja, N., and Subramonian, N. (2015c). Overexpression of EaDREB2 and pyramiding of EaDREB2 with the pea DNA helicase gene (PDH45) enhance drought and salinity tolerance in sugarcane (Saccharum spp. hybrid). Plant cell reports 34, 247-263. Barclay, K.D., and McKersie, B.D. (1994). Peroxidation reactions in plant membranes: effects of free fatty acids. Lipids 29, 877-882. Bartels, D., and Sunkar, R. (2005). Drought and salt tolerance in plants. Critical Reviews in Plant Sciences 24, 23-58. Battraw, M.J., and Hall, T.C. (1990). Histochemical analysis of CaMV 35S promoter-β-glucuronidase gene expression in transgenic rice plants. Plant Molecular Biology 15, 527-538. Baxter, A., Mittler, R., and Suzuki, N. (2014). ROS as key players in plant stress signalling. Journal of experimental botany 65, 1229-1240. Benfey, P.N., Ren, L., and Chua, N.-H. (1990). Tissue-specific expression from CaMV 35S enhancer subdomains in early stages of plant development. The EMBO journal 9, 1677. Bhaskara, G.B., Yang, T.-H., and Verslues, P.E. (2015). Dynamic proline metabolism: importance and regulation in water limited environments. Frontiers in plant science 6.
108
Blum, A. (2005). Drought resistance, water-use efficiency, and yield potential—are they compatible, dissonant, or mutually exclusive? Crop and Pasture Science 56, 1159-1168. Boaretto, L.F., Carvalho, G., Borgo, L., Creste, S., Landell, M.G., Mazzafera, P., and Azevedo, R.A. (2014). Water stress reveals differential antioxidant responses of tolerant and non-tolerant sugarcane genotypes. Plant Physiology and Biochemistry 74, 165-175. Bonnett, G.D. (2014). Developmental Stages (Phenology), First edn. Bower, R., and Birch, R.G. (1992). Transgenic sugarcane plants via microprojectile bombardment. The Plant Journal 2, 409-416. Bueno, L.C.S., Mendes, A.N.G., and Carvalho, S.P. (2006). Melhoramento genético de plantas: princípios e procedimentos. (Lavras: UFLA), pp. 319. Bustin, S. (2002). Quantification of mRNA using real-time reverse transcription PCR (RT-PCR): trends and problems. Journal of molecular endocrinology 29, 23-39. Bustin, S.A. (2000). Absolute quantification of mRNA using real-time reverse transcription polymerase chain reaction assays. Journal of molecular endocrinology 25, 169-193. Camargo, S.R. (2007). Identificação de genes e uso de promotores modulados por etanol em cana-de-açúcar. In Genética e Evolução (Campinas: Unicamp). Cha-Um, S., and Kirdmanee, C. (2008). Effect of osmotic stress on proline accumulation, photosynthetic abilities and growth of sugarcane plantlets (Saccharum officinarum L.). Pak J Bot 40, 2541-2552. Chakravarthi, M., Syamaladevi, D.P., Harunipriya, P., Augustine, S.M., and Subramonian, N. (2016). A novel PR10 promoter from Erianthus arundinaceus directs high constitutive transgene expression and is enhanced upon wounding in heterologous plant systems. Molecular biology reports 43, 17-30. Chaves, M.M., Maroco, J.P., and Pereira, J.S. (2003). Understanding plant responses to drought—from genes to the whole plant. Functional plant biology 30, 239-264. Christensen, A.H., and Quail, P.H. (1996). Ubiquitin promoter-based vectors for high-level expression of selectable and/or screenable marker genes in
monocotyledonous plants. Transgenic Res 5, 213-218. Christensen, A.H., Sharrock, R.A., and Quail, P.H. (1992). Maize polyubiquitin genes: structure, thermal perturbation of expression and transcript splicing, and promoter activity following transfer to protoplasts by electroporation. Plant molecular biology 18, 675-689. Cia, M., Guimarães, A., Medici, L., Chabregas, S., and Azevedo, R. (2012). Antioxidant responses to water deficit by
drought‐tolerant and‐sensitive sugarcane
varieties. Annals of Applied Biology 161, 313-324. Cominelli, E., Conti, L., Tonelli, C., and Galbiati, M. (2013). Challenges and perspectives to improve crop drought and salinity tolerance. New biotechnology 30, 355-361. Conab (2013). (Companhia nacional de abastecimento. Acompanhamento de safra brasileira: cana-de-acucar, terceiro levantamento, abril/2013. (Brasilia: Companhia Nacional de Abastecimento.). Conab (2015). (Companhia nacional de abastecimento. Acompanhamento de safra brasileira: cana-de-acucar) (Brasilia: Companhia Nacional de Abastecimento.). Conesa, A., Gotz, S., Garcia-Gomez, J.M., Terol, J., Talon, M., and Robles, M. (2005). Blast2GO: a universal tool for annotation, visualization and analysis in functional genomics research. Bioinformatics 21, 3674-3676. Consortium, G.O. (2010). The Gene Ontology in 2010: extensions and refinements. Nucleic acids research 38, D331-D335. Cruz de Carvalho, M.H. (2008). Drought stress and reactive oxygen species: production, scavenging and signaling. Plant signaling & behavior 3, 156-165. CTC (2002). Centro de tecnologia Canavieira. Curtis, S.E. (1988). Structure, Organization and Expression of Cyanobacterial Atp Synthase Genes. Photosynth Res 18, 223-244. Czechowski, T., Stitt, M., Altmann, T., Udvardi, M.K., and Scheible, W.R. (2005). Genome-wide identification and testing of superior reference genes for transcript normalization in Arabidopsis. Plant Physiology 139, 5-17. D'Hont A., Glaszmann J. C., and Hogarth D. M. (2001). Sugarcane genome analysis with
109
molecular markers: a first decade of research. Proceedings of the International Society of Sugarcane Technologists XXVI Congress Brisbane: The Australian Society of Sugar Cane Technologists, 556–559. Da Graça, J., Rodrigues, F., Farias, J., Oliveira, M.d., Hoffmann-Campo, C., and Zingaretti, S. (2010). Physiological parameters in sugarcane cultivars submitted to water deficit (BRAZILIAN SOCIETY OF PLANT PHYSIOLOGY). Da Silva, A.L.C., and Da Costa, W.A.J.M. (2004). Varietal variation in growth,physiology and yield of sugarcane under two contrasting water regimes (Tropical Agricultural Research), pp. 1-12. da Silva, M.D., Silva, R.L.d.O., Costa Ferreira Neto, J.R., Guimarães, A.C.R., Veiga, D.T., Chabregas, S.M., Burnquist, W.L., Kahl, G., Benko-Iseppon, A.M., and Kido, E.A. (2013). Expression Analysis of Sugarcane Aquaporin Genes under Water Deficit. Journal of Nucleic Acids 2013, 763945. da Silva, P.P., Soares, L., da Costa, J.G., da Silva Viana, L., de Andrade, J.C.F., Gonçalves, E.R., dos Santos, J.M., de Souza Barbosa, G.V., Nascimento, V.X., Todaro, A.R., et al. (2012a). Path analysis for selection of drought tolerant sugarcane genotypes through physiological components. 37, 11-19. da Silva, P.P., Soares, L., da Costa, J.G., Viana, L.d.S., Farias de Andrade, J.C., Goncalves, E.R., dos Santos, J.M., de Souza Barbosa, G.V., Nascimento, V.X., Todaro, A.R., et al. (2012b). Path analysis for selection of drought tolerant sugarcane genotypes through physiological components. Industrial Crops and Products 37, 11-19. Darie, C.C., De Pascalis, L., Mutschler, B., and Haehnel, W. (2006). Studies of the Ndh complex and photosystem II from mesophyll and bundle sheath chloroplasts of the C 4-type plant Zea mays. Journal of plant physiology 163, 800-808. Das, K., and Roychoudhury, A. (2014). Reactive oxygen species (ROS) and response of antioxidants as ROS-scavengers during environmental stress in plants. Frontiers in Environmental Science 2, 53. Delorge, I., Janiak, M., Carpentier, S., and Van Dijck, P. (2014). Fine tuning of trehalose biosynthesis and hydrolysis as novel tools for
the generation of abiotic stress tolerant plants. Frontiers in plant science 5, 147. Dhadi, S.R., Krom, N., and Ramakrishna, W. (2009). Genome-wide comparative analysis of putative bidirectional promoters from rice, Arabidopsis and Populus. Gene 429, 65-73. Dodd, I.C. (2003). Hormonal interactions and stomatal responses. Journal of plant growth regulation 22, 32-46. Domaingue, R. (1995). Family and varietal adaptation of sugarcane to dry conditions and relevante to selection procedures. (Bangkok: ISSCT: Proceedings), pp. 418-435. dos Santos, C.M., and de Almeida Silva, M. (2015). Physiological and biochemical responses of sugarcane to oxidative stress induced by water deficit and paraquat. Acta Physiologiae Plantarum 37, 1-14. dos Santos, C.M., de Almeida Silva, M., Lima, G.P.P., Bortolheiro, F.P.d.A.P., Brunelli, M.C., de Holanda, L.A., and Oliver, R. (2015). Physiological changes associated with antioxidant enzymes in response to sugarcane tolerance to water deficit and rehydration. Sugar Tech 17, 291-304. Du, Y., Kawamitsu, Y., Nose, A., Hiyane, S., Murayama, S., Wasano, K., and Uchida, Y. (1996). Effects of water stress on carbon exchange rate and activities of photosynthetic enzymes in leaves of sugarcane (Saccharum sp). Australian Journal of Plant Physiology 23, 719-726. Dunn, S.D., Kellner, E., and Lill, H. (2001). Specific heterodimer formation by the cytoplasmic domains of the b and b' subunits of cyanobacterial ATP synthase. Biochemistry-Us 40, 187-192. Dutt, M., Dhekney, S.A., Soriano, L., Kandel, R., and Grosser, J.W. (2014). Temporal and spatial control of gene expression in horticultural crops. Horticulture research 1, 14047. Endres, L., Silva, J.V., Ferreira, V.M., and Barbosa, G.V.S. (2010). Photosynthesis and water relations in Brazilian sugarcane (Open Agric. J.), pp. 31-37. FAO (2015). Food and Agriculture Organization statistics. Ferreira, T.H., Gentile, A., Vilela, R.D., Costa, G.G., Dias, L.I., Endres, L., and Menossi, M. (2012). microRNAs associated with drought response in the bioenergy crop sugarcane (Saccharum spp.). PLoS One 7, e46703.
110
Futai, M. (2006). Our research on proton pumping ATPases over three decades: their biochemistry, molecular biology and cell biology. Proceedings of the Japan Academy, Series B 82, 416-438. Gentile, A., Dias, L.I., Mattos, R.S., Ferreira, T.H., and Menossi, M. (2015). MicroRNAs and drought responses in sugarcane. Front Plant Sci 6, 58. Gentile, A., Ferreira, T.H., Mattos, R.S., Dias, L.I., Hoshino, A.A., Carneiro, M.S., Souza, G.M., Calsa, T., Nogueira, R.M., Endres, L., et al. (2013). Effects of drought on the microtranscriptome of field-grown sugarcane plants. Planta 237, 783-798. Gill, S.S., and Tuteja, N. (2010). Reactive oxygen species and antioxidant machinery in abiotic stress tolerance in crop plants. Plant physiology and biochemistry 48, 909-930. Goldschmidt, E.E., and Huber, S.C. (1992). Regulation of photosynthesis by end-product accumulation in leaves of plants storing starch, sucrose, and hexose sugars. Plant physiology 99, 1443-1448. Guan, L.M., Zhao, J., and Scandalios, J.G.
(2000). Cis‐elements and trans‐factors that
regulate expression of the maize Cat1 antioxidant gene in response to ABA and osmotic stress: H2O2 is the likely intermediary signaling molecule for the response. The Plant Journal 22, 87-95. Guimarães, E.R., Mutton, M.A., Mutton, M.J.R., Ferro, M.I.T., Ravaneli, G.C., and Silva, J.A.d. (2008). Free proline accumulation in sugarcane under water restriction and spittlebug infestation. Scientia agricola 65, 628-633. Guo, J., Ling, H., Wu, Q., Xu, L., and Que, Y. (2014). The choice of reference genes for assessing gene expression in sugarcane under salinity and drought stresses. Scientific reports 4. Guo, Y., and Tan, J. (2015). Recent Advances in the Application of Chlorophyll a Fluorescence from Photosystem II. Photochemistry and Photobiology 91, 1-14. Gupta, A.K., and Kaur, N. (2005). Sugar signalling and gene expression in relation to carbohydrate metabolism under abiotic stresses in plants. Journal of biosciences 30, 761-776.
Gupta, P., Raghuvanshi, S., and K TYAGI, A. (2001). Assessment of the Efficiency of Various Gene Promoters via Biolistics in Leaf and Regenerating Seed Callus of Millets, Eleusine coracana and Echinochloa crusgalli. Plant Biotechnology 18, 275-282. Gutierrez, L., Mauriat, M., Guenin, S., Pelloux, J., Lefebvre, J.-F., Louvet, R., Rusterucci, C., Moritz, T., Guerineau, F., Bellini, C., et al. (2008). The lack of a systematic validation of reference genes: a serious pitfall undervalued in reverse transcription-polymerase chain reaction (RT-PCR) analysis in plants. Plant Biotechnology Journal 6, 609-618. Hall, D.O.S., J.M.O.;Bolhàr-Nordenkampf, H.R.; Leegood, R.C.; Long, S.P. Chapman and Hall, London ed. (1993). Photosynthesis and production in a changing environment: a field and laboratory manual. Han, C., and Yang, P. (2015). Studies on the molecular mechanisms of seed germination. Proteomics 15, 1671-1679. Hemaprabha, G., Nagarajan, R., and Alarmelu, S. (2004). Response of sugarcane genotypes to water deficit stress. Sugar Tech 6, 165-168. Herrmann, R.G., Steppuhn, J., Herrmann, G.S., and Nelson, N. (1993). The Nuclear-Encoded Polypeptide Cfo-Ii from Spinach Is a Real, 9th Subunit of Chloroplast Atp Synthase. Febs Lett 326, 192-198. Himmelbach, A., Yang, Y., and Grill, E. (2003). Relay and control of abscisic acid signaling. Curr Opin Plant Biol 6, 470-479. Hirayama, T., and Shinozaki, K. (2010). Research on plant abiotic stress responses in the post-genome era: past, present and future. Plant J 61, 1041-1052. Hodges, D.M., DeLong, J.M., Forney, C.F., and Prange, R.K. (1999). Improving the thiobarbituric acid-reactive-substances assay for estimating lipid peroxidation in plant tissues containing anthocyanin and other interfering compounds. Planta 207, 604-611. Hoshiyasu, S., Kohzuma, K., Yoshida, K., Fujiwara, M., Fukao, Y., Yokota, A., and Akashi, K. (2013). Potential involvement of N-terminal acetylation in the quantitative regulation of the epsilon subunit of chloroplast ATP synthase under drought stress. Biosci Biotechnol Biochem 77, 998-1007.
111
Hu, H., and Xiong, L. (2014). Genetic engineering and breeding of drought-resistant crops. Annu Rev Plant Biol 65, 715-741. Huang, G.-T., Ma, S.-L., Bai, L.-P., Zhang, L., Ma, H., Jia, P., Liu, J., Zhong, M., and Guo, Z.-F. (2012). Signal transduction during cold, salt, and drought stresses in plants. Molecular biology reports 39, 969-987. Inman-Bamber, N. (2004). Sugarcane water stress criteria for irrigation and drying off. Field Crops Research 89, 107-122. Inman-Bamber, N., Bonnett, G., Spillman, M., Hewitt, M., and Jackson, J. (2008). Increasing sucrose accumulation in sugarcane by manipulating leaf extension and photosynthesis with irrigation. Australian Journal of Agricultural Research 59, 13-26. Inman-Bamber, N., Lakshmanan, P., and Park, S. (2012). Sugarcane for water-limited environments: Theoretical assessment of suitable traits. Field Crops Research 134, 95-104. Inman-Bamber, N., and Smith, D. (2005). Water relations in sugarcane and response to water deficits. Field Crops Research 92, 185-202. Ishihara, S., Takabayashi, A., Ido, K., Endo, T., Ifuku, K., and Sato, F. (2007). Distinct functions for the two PsbP-like proteins PPL1 and PPL2 in the chloroplast thylakoid lumen of Arabidopsis. Plant physiology 145, 668-679. Iskandar, H.M., Casu, R.E., Fletcher, A.T., Schmidt, S., Xu, J., Maclean, D.J., Manners, J.M., and Bonnett, G.D. (2011). Identification of drought-response genes and a study of their expression during sucrose accumulation and water deficit in sugarcane culms. Bmc Plant Biology 11. Iskandar, H.M., Simpson, R.S., Casu, R.E., Bonnett, G.D., Maclean, D.J., and Manners, J.M. (2004). Comparison of reference genes for quantitative real-time polymerase chain reaction analysis of gene expression in sugarcane. Plant Molecular Biology Reporter 22, 325-337. Ito, T., and Meyerowitz, E.M. (2000). Overexpression of a gene encoding a cytochrome P450, CYP78A9, induces large and seedless fruit in Arabidopsis. The Plant Cell 12, 1541-1550. Jain, R., Chandra, A., Venugopalan, V.K., and Solomon, S. (2015). Physiological changes and
expression of SOD and P5CS genes in response to water deficit in sugarcane. Sugar Tech 17, 276-282. Jangpromma, N., Kitthaisong, S., Lomthaisong, K., Daduang, S., Jaisil, P., and Thammasirirak, S. (2010). A proteomics analysis of drought stress-responsive proteins as biomarker for drought-tolerant sugarcane cultivars. American Journal of Biochemistry and Biotechnology 6, 89-102. Jangpromma, N., Thammasirirak, S., Jaisil, P., and Songsri, P. (2012). Effects of drought and recovery from drought stress on above ground and root growth, and water use efficiency in sugarcane ( Saccharum officinarum L.). (Aust J Crop Sci). Jensen, P.E., Gilpin, M., Knoetzel, J., and Scheller, H.V. (2000). The PSI-K subunit of photosystem I is involved in the interaction between light-harvesting complex I and the photosystem I reaction center core. Journal of Biological Chemistry 275, 24701-24708. Jiang, M., and Zhang, J. (2001). Effect of abscisic acid on active oxygen species, antioxidative defence system and oxidative damage in leaves of maize seedlings. Plant and Cell Physiology 42, 1265-1273. Jiang, M., and Zhang, J. (2002). Water
stress‐induced abscisic acid accumulation
triggers the increased generation of reactive
oxygen species and up‐regulates the
activities of antioxidant enzymes in maize leaves. Journal of Experimental Botany 53, 2401-2410. Karimi, M., Inze, D., and Depicker, A. (2002). GATEWAY((TM)) vectors for Agrobacterium-mediated plant transformation. Trends Plant Sci 7, 193-195. Kasuga, M., Liu, Q., Miura, S., Yamaguchi-Shinozaki, K., and Shinozaki, K. (1999). Improving plant drought, salt, and freezing tolerance by gene transfer of a single stress-inducible transcription factor. Nature biotechnology 17, 287-291. Kato, Y., and Sakamoto, W. (2014). Phosphorylation of photosystem II core proteins prevents undesirable cleavage of D1
and contributes to the fine‐tuned repair of
photosystem II. The Plant Journal 79, 312-321.
112
Kiirats, O., Cruz, J.A., Edwards, G.E., and Kramer, D.M. (2009). Feedback limitation of photosynthesis at high CO2 acts by modulating the activity of the chloroplast ATP synthase. Functional Plant Biology 36, 893-901. Kizis, D., and Lumbreras, V. (2001). Role of AP2/EREBP transcription factors in gene regulation during abiotic stress. FEBS letters 498, 187-189. Kondou, Y., Higuchi, M., and Matsui, M. (2010). High-throughput characterization of plant gene functions by using gain-of-function technology. Annual review of plant biology 61, 373-393. Kooyers, N.J. (2015). The evolution of drought escape and avoidance in natural herbaceous populations. Plant Science 234, 155-162. Krause, G.H., and Weis, E. (1991). Chlorophyll Fluorescence and Photosynthesis - the Basics. Annu Rev Plant Phys 42, 313-349. Kubicki, A., Funk, E., Westhoff, P., and Steinmüller, K. (1996). Differential expression of plastome-encoded ndh genes in mesophyll and bundle-sheath chloroplasts of the C4 plant Sorghum bicolor indicates that the complex I-homologous NAD (P) H-plastoquinone oxidoreductase is involved in cyclic electron transport. Planta 199, 276-281. Kumar, T., Khan, M.R., Abbas, Z., and Ali, G.M. (2014). Genetic improvement of sugarcane for drought and salinity stress tolerance using Arabidopsis vacuolar pyrophosphatase (AVP1) gene. Molecular biotechnology 56, 199-209. Lakshmanan, P., Geijskes, R.J., Aitken, K.S., Grof, C.L., Bonnett, G.D., and Smith, G.R. (2005). Sugarcane biotechnology: the challenges and opportunities. In Vitro Cellular & Developmental Biology-Plant 41, 345-363. Lakshmanan, P., and Robinson, N. (2014). Stress physiology: Abiotic stresses, First edn. Lapidot, M., and Pilpel, Y. (2006). Genome-wide natural antisense transcription: coupling its regulation to its different regulatory mechanisms. EMBO Reports 7, 1216-1222. Last, D., Brettell, R., Chamberlain, D., Chaudhury, A., Larkin, P., Marsh, E., Peacock, W., and Dennis, E. (1991). pEmu: an improved promoter for gene expression in cereal cells. Theoretical and Applied Genetics 81, 581-588. Lembke, C.G., Nishiyama, M.Y., Sato, P.M., de Andrade, R.F., and Souza, G.M. (2012).
Identification of sense and antisense transcripts regulated by drought in sugarcane. Plant Mol Biol 79, 461-477. Levitt, J. (1972). Responses of plants to environmental stresses, pp. 697. Li, C., Nong, Q., Solanki, M.K., Liang, Q., Xie, J., Liu, X., Li, Y., Wang, W., Yang, L., and Li, Y. (2016). Differential expression profiles and pathways of genes in sugarcane leaf at elongation stage in response to drought stress. Scientific reports 6. Li, C.-N., Srivastava, M.-K., Nong, Q., Yang, L.-T., and Li, Y.-R. (2013). Molecular cloning and characterization of SoNCED, a novel gene encoding 9-cis-epoxycarotenoid dioxygenase from sugarcane (Saccharum officinarum L.). Genes & Genomics 35, 101-109. Li, S., Assmann, S.M., and Albert, R. (2006). Predicting essential components of signal transduction networks: a dynamic model of guard cell abscisic acid signaling. PLoS Biol 4, e312. Liang, X., Zhang, L., Natarajan, S.K., and Becker, D.F. (2013). Proline mechanisms of stress survival. Antioxidants & redox signaling 19, 998-1011. Lichtenthaler, H.a.B., C. (2001). Chlorophylls and carotenoids - Measurement and characterisation by UV-VIS. Current Protocols in Food Analytical Chemistry, F4.3.1- F4.3.8. Ling, H., Wu, Q., Guo, J., Xu, L., and Que, Y. (2014). Comprehensive selection of reference genes for gene expression normalization in sugarcane by real time quantitative RT-PCR. PloS one 9, e97469. Livak, K.J., and Schmittgen, T.D. (2001). Analysis of relative gene expression data using real-time quantitative PCR and the 2(T)(-Delta Delta C) method. Methods 25, 402-408. Lobell, D.B., Schlenker, W., and Costa-Roberts, J. (2011). Climate trends and global crop production since 1980. Science 333, 616-620. Loytynoja, A., and Goldman, N. (2010). webPRANK: a phylogeny-aware multiple sequence aligner with interactive alignment browser. Bmc Bioinformatics 11. Luis, A. (2015). ROS and RNS in plant physiology: an overview. Journal of experimental botany 66, 2827-2837. Luna, C.M., Pastori, G.M., Driscoll, S., Groten, K., Bernard, S., and Foyer, C.H. (2005). Drought controls on H2O2 accumulation,
113
catalase (CAT) activity and CAT gene expression in wheat. Journal of experimental botany 56, 417-423. Machado, R., Ribeiro, R., Marchiori, P., Machado, D., Machado, E., and Landell, M. (2009). Biometric and physiological responses to water deficit in sugarcane at different phenological stages. Pesquisa Agropecuaria Brasileira 44, 1575-1582. Mahajan, S., and Tuteja, N. (2005). Cold, salinity and drought stresses: An overview. Archives of Biochemistry and Biophysics 444, 139-158. Marian, C.O., Krebs, S.L., and Arora, R. (2004). Dehydrin variability among rhododendron species: a 25-kDa dehydrin is conserved and associated with cold acclimation across diverse species. New Phytol 161, 773-780. Masumoto, C., Miyazawa, S.-I., Ohkawa, H., Fukuda, T., Taniguchi, Y., Murayama, S., Kusano, M., Saito, K., Fukayama, H., and Miyao, M. (2010). Phosphoenolpyruvate carboxylase intrinsically located in the chloroplast of rice plays a crucial role in ammonium assimilation. Proceedings of the National Academy of Sciences 107, 5226-5231. Matsumura, H., Yoshida, K., Luo, S., Krüger, D.H., Kahl, G., Schroth, G.P., and Terauchi, R. (2011). High-throughput superSAGE. PCR Protocols, 135-146. Mattiello, L. (2015). BMC Plant Biology. Maurel, C., Verdoucq, L., Luu, D.-T., and Santoni, V. (2008). Plant aquaporins: membrane channels with multiple integrated functions. Annu Rev Plant Biol 59, 595-624. Maxwell, D.P., Falk, S., Trick, C.G., and Huner, N.P.A. (1994). Growth at Low-Temperature Mimics High-Light Acclimation in Chlorella-Vulgaris. Plant Physiology 105, 535-543. Maxwell, K., and Johnson, G.N. (2000). Chlorophyll fluorescence - a practical guide. Journal of Experimental Botany 51, 659-668. McCarty, R.E. (1992). A PLANT BIOCHEMIST'S VIEW OF H+-ATPases AND ATP SYNTHASES. J Exp Biol 172, 431-441. McCarty, R.E., Evron, Y., and Johnson, E.A. (2000). The chloroplast ATP synthase: A rotary enzyme? Annu Rev Plant Phys 51, 83-109. McCormick, A.J., Cramer, M.D., and Watt, D.A. (2008). Regulation of photosynthesis by sugars in sugarcane leaves. Journal of plant physiology 165, 1817-1829.
McElroy, D., Blowers, A.D., Jenes, B., and Wu, R. (1991). Construction of expression vectors
based on the rice actin 1 (Act1) 5′ region for
use in monocot transformation. Molecular and General Genetics MGG 231, 150-160. Medeiros, D.B., da Silva, E.C., Mansur Custodio Nogueira, R.J., Teixeira, M.M., and Buckeridge, M.S. (2013). Physiological limitations in two sugarcane varieties under water suppression and after recovering. Theoretical and Experimental Plant Physiology 25, 213-222. Michl, D., Karnauchov, I., Berghofer, J., Herrmann, R.G., and Klosgen, R.B. (1999). Phylogenetic transfer of organelle genes to the nucleus can lead to new mechanisms of protein integration into membranes. Plant J 17, 31-40.
Miller, G., Suzuki, N., CIFTCI‐YILMAZ, S., and
Mittler, R. (2010). Reactive oxygen species homeostasis and signalling during drought and salinity stresses. Plant, cell & environment 33, 453-467. Mittler, R. (2002). Oxidative stress, antioxidants and stress tolerance. Trends in plant science 7, 405-410. Mittler, R., Vanderauwera, S., Gollery, M., and Van Breusegem, F. (2004). Reactive oxygen gene network of plants. Trends in plant science 9, 490-498. Mittler, R., Vanderauwera, S., Suzuki, N., Miller, G., Tognetti, V.B., Vandepoele, K., Gollery, M., Shulaev, V., and Van Breusegem, F. (2011). ROS signaling: the new wave? Trends in plant science 16, 300-309. Molinari, H.B.C., Marur, C.J., Bespalhok Filho, J.C., Kobayashi, A.K., Pileggi, M., Júnior, R.P.L., Pereira, L.F.P., and Vieira, L.G.E. (2004). Osmotic adjustment in transgenic citrus rootstock Carrizo citrange (Citrus sinensis Osb. x Poncirus trifoliata L. Raf.) overproducing proline. Plant Science 167, 1375-1381. Molinari, H.B.C., Marur, C.J., Daros, E., De Campos, M.K.F., De Carvalho, J.F.R.P., Pereira, L.F.P., and Vieira, L.G.E. (2007). Evaluation of
the stress‐inducible production of proline in
transgenic sugarcane (Saccharum spp.): osmotic adjustment, chlorophyll fluorescence and oxidative stress. Physiologia Plantarum 130, 218-229.
114
Montillet, J.-L., Chamnongpol, S., Rustérucci, C., Dat, J., Van De Cotte, B., Agnel, J.-P., Battesti, C., Inzé, D., Van Breusegem, F., and Triantaphylidès, C. (2005). Fatty acid hydroperoxides and H2O2 in the execution of hypersensitive cell death in tobacco leaves. Plant Physiology 138, 1516-1526. Moore, P.H., Singh, V., and Kumar, V. (1999). PROGRESS AND DEVELOPMENTS IN SUGARCANE BIOTECHNOLOGB! Paper presented at: Proceedings of the XXIII ISSCT Congress, New Delhi, India, 22-26 February, 1999 Volume 2 (Sugar Technologists' Association of India). Moran, J.F., Becana, M., Iturbe-Ormaetxe, I., Frechilla, S., Klucas, R.V., and Aparicio-Tejo, P. (1994). Drought induces oxidative stress in pea plants. Planta 194, 346-352. Moreira, J., Goswami, D., and Zhao, Y. (2007). Bioenergy-successes and barriers. Proceedings of Ises Solar World Congress 2007: Solar Energy and Human Settlement, Vols I-V, 38-45. Motohashi, K., Kondoh, A., Stumpp, M.T., and Hisabori, T. (2001). Comprehensive survey of proteins targeted by chloroplast thioredoxin. P Natl Acad Sci USA 98, 11224-11229. Munekage, Y.N., and Taniguchi, Y.Y. (2016). Promotion of Cyclic Electron Transport Around Photosystem I with the Development of C4 Photosynthesis. Plant and Cell Physiology 57, 897-903. Murashige, T., and Skoog, F. (1962). A Revised Medium for Rapid Growth and Bio Assays with Tobacco Tissue Cultures. Physiol Plantarum 15, 473-497. Nakamura, N., Iwano, M., Havaux, M., Yokota, A., and Munekage, Y.N. (2013). Promotion of cyclic electron transport around photosystem I
during the evolution of NADP–malic
enzyme‐type C4 photosynthesis in the genus
Flaveria. New Phytologist 199, 832-842. Nakazawa, M., Yabe, N., Ichikawa, T., Yamamoto, Y.Y., Yoshizumi, T., Hasunuma, K., and Matsui, M. (2001). DFL1, an
auxin‐responsive GH3 gene homologue,
negatively regulates shoot cell elongation and lateral root formation, and positively regulates the light response of hypocotyl length. The Plant Journal 25, 213-221.
stresses. The Plant Journal 34, 137-148. Neill, S., Barros, R., Bright, J., Desikan, R., Hancock, J., Harrison, J., Morris, P., Ribeiro, D., and Wilson, I. (2008). Nitric oxide, stomatal closure, and abiotic stress. Journal of experimental botany 59, 165-176. Nelson, N. (1994). Energizing porters by proton-motive force. Journal of Experimental Biology 196, 7-13. Nogueira, F.T., De Rosa, V.E., Menossi, M., Ulian, E.C., and Arruda, P. (2003). RNA expression profiles and data mining of sugarcane response to low temperature. Plant Physiol 132, 1811-1824. Ogren, E., and Sjostrom, M. (1990). Estimation of the Effect of Photoinhibition on the Carbon Gain in Leaves of a Willow Canopy. Planta 181, 560-567. Pagariya, M.C., Devarumath, R.M., and Kawar, P.G. (2012). Biochemical characterization and identification of differentially expressed candidate genes in salt stressed sugarcane. Plant science 184, 1-13. Papini-Terzi, F.S., Rocha, F.R., Vencio, R.Z.N., Oliveira, K.C., Felix, J.D., Vicentini, R., Rocha, C.D., Simoes, A.C.Q., Ulian, E.C., Di Mauro, S.M.Z., et al. (2005). Transcription profiling of signal transduction-related genes in sugarcane tissues. DNA Res 12, 27-38. Papini-Terzi, F.S., Rocha, F.R., Vêncio, R.Z., Felix, J.M., Branco, D.S., Waclawovsky, A.J., Del Bem, L.E., Lembke, C.G., Costa, M.D., Nishiyama, M.Y., et al. (2009). Sugarcane genes associated with sucrose content. BMC Genomics 10, 120. Parent, B., Hachez, C., Redondo, E., Simonneau, T., Chaumont, F., and Tardieu, F. (2009). Drought and abscisic acid effects on aquaporin content translate into changes in hydraulic conductivity and leaf growth rate: a trans-scale approach. Plant physiology 149, 2000-2012.
115
Park, S.-H., Yi, N., Kim, Y.S., Jeong, M.-H., Bang, S.-W., Do Choi, Y., and Kim, J.-K. (2010). Analysis of five novel putative constitutive gene promoters in transgenic rice plants. Journal of experimental botany 61, 2459-2467. Patade, V.Y., Suprasanna, P., and Bapat, V.A. (2008). Effects of salt stress in relation to osmotic adjustment on sugarcane (Saccharum officinarum L.) callus cultures. Plant Growth Regulation 55, 169-173. Pei, Z.-M., Murata, Y., Benning, G., Thomine, S., Klüsener, B., Allen, G.J., Grill, E., and Schroeder, J.I. (2000). Calcium channels activated by hydrogen peroxide mediate abscisic acid signalling in guard cells. Nature 406, 731-734. Peleg, Z., and Blumwald, E. (2011). Hormone balance and abiotic stress tolerance in crop plants. Current opinion in plant biology 14, 290-295. Pimentel, C. (2004). A relação da planta com a água. (Rio de Janeiro: Seropédica), pp. 191. Poetsch, A., Berzborn, R.J., Heberle, J., Link, T.A., Dencher, N.A., and Seelert, H. (2007). Biophysics and bioinformatics reveal structural differences of the two peripheral stalk subunits in chloroplast ATP synthase. J Biochem 141, 411-420. Porto, M.S., Pinheiro, M.P.N., Batista, V.G.L., dos Santos, R.C., de Albuquerque Melo Filho, P., and de Lima, L.M. (2014). Plant promoters: an approach of structure and function. Molecular biotechnology 56, 38-49. Pospisil, P. (1997). Mechanisms of non-photochemical chlorophyll fluorescence quenching in higher plants. Photosynthetica 34, 343-355. Rabbani, M.A., Maruyama, K., Abe, H., Khan, M.A., Katsura, K., Ito, Y., Yoshiwara, K., Seki, M., Shinozaki, K., and Yamaguchi-Shinozaki, K. (2003). Monitoring expression profiles of rice genes under cold, drought, and high-salinity stresses and abscisic acid application using cDNA microarray and RNA gel-blot analyses. Plant Physiol 133, 1755-1767. Ramesh, P. (2000). Effect of different levels of drought during the formative phase on growth parameters and its relationship with dry matter accumulation in sugarcane. Journal of Agronomy and Crop Science-Zeitschrift Fur Acker Und Pflanzenbau 185, 83-89.
Ramiro, D.A., Melotto-Passarin, D.M., Barbosa, M.d.A., Santos, F.d., Gomez, S.G.P., Massola Júnior, N.S., Lam, E., and Carrer, H. (2016). Expression of Arabidopsis Bax Inhibitor-1 in transgenic sugarcane confers drought tolerance. . Plant Biotechnol J. Rampino, P., Pataleo, S., Gerardi, C., Mita, G., and Perrotta, C. (2006). Drought stress response in wheat: physiological and molecular analysis of resistant and sensitive genotypes. Plant Cell and Environment 29, 2143-2152. RAZA, G., ALI, K., ASHRAF, M.Y., MANSOOR, S., JAVID, M., and ASAD, S. (2016). Overexpression of an H+-PPase gene from Arabidopsis in sugarcane improvesdrought tolerance, plant growth, and photosynthetic responses. Turkish Journal of Biology 40, 109-119. Reis, R., da Cunha, B., Martins, P., Martins, M., Alekcevetch, J., Chalfun, A., Andrade, A., Ribeiro, A., Qin, F., Mizoi, J., et al. (2014). Induced over-expression of ArDREB2A CA improves drought tolerance in sugarcane. Plant Science 221, 59-68. Ribeiro, R.V., Machado, R.S., Machado, E.C., Machado, D.F.S.P., Magalhaes Filho, J.R., and Landell, M.G.A. (2013). REVEALING DROUGHT-RESISTANCE AND PRODUCTIVE PATTERNS IN SUGARCANE GENOTYPES BY EVALUATING BOTH PHYSIOLOGICAL RESPONSES AND STALK YIELD. Experimental Agriculture 49, 212-224. Rocha, F.R., Papini-Terzi, F.S., Nishiyama, M.Y., Jr., Vencio, R.Z., Vicentini, R., Duarte, R.D., de Rosa, V.E., Jr., Vinagre, F., Barsalobres, C., Medeiros, A.H., et al. (2007a). Signal transduction-related responses to phytohormones and environmental challenges in sugarcane. BMC Genomics 8, 71. Rocha, F.R., Papini-Terzi, F.S., Nishiyama, M.Y., Vêncio, R.Z., Vicentini, R., Duarte, R.D., de Rosa, V.E., Vinagre, F., Barsalobres, C., Medeiros, A.H., et al. (2007b). Signal transduction-related responses to phytohormones and environmental challenges in sugarcane. BMC Genomics 8, 71. Rodrigues, F.A., Da Graça, J.P., De Laia, M.L., Nhani-Jr, A., Galbiati, J.A., Ferro, M.I.T., FERRO, J.A., and Zingaretti, S.M. (2011). Sugarcane genes differentially expressed during water deficit. Biologia Plantarum, 43-53.
116
Rodrigues, F.A., de Laia, M.L., and Zingaretti, S.M. (2009). Analysis of gene expression profiles under water stress in tolerant and sensitive sugarcane plants. Plant Science 176, 286-302. Rodrigues, J.D. (1995). Fisiologia da cana-de-açúcar (Botucatu: Unesp). Roose, J.L., Wegener, K.M., and Pakrasi, H.B. (2007). The extrinsic proteins of photosystem II. Photosynthesis Research 92, 369-387. Rott, M., Martins, N.F., Thiele, W., Lein, W., Bock, R., Kramer, D.M., and Schottler, M.A. (2011). ATP synthase repression in tobacco restricts photosynthetic electron transport, CO2 assimilation, and plant growth by overacidification of the thylakoid lumen. Plant Cell 23, 304-321. Rutherford, R. (1989). The assessment of proline accumulation as a mechanism of drought resistance in sugarcane. Paper presented at: Proceeding of the South African Sugar Technologists’ Association (Citeseer). Sales, C., Marchiori, P., Machado, R., Fontenele, A., Machado, E., Silveira, J., and Ribeiro, R. (2015). Photosynthetic and antioxidant responses to drought during sugarcane ripening. Photosynthetica 53, 547-554. Sales, C.R.G., Ribeiro, R.V., Machado, D.F.S.P., Machado, R.S., Dovis, V.L., and Lagôa, A.M.M.A. (2012). Gas exchange and carbohydrate balance in sugarcane plants under root stressful conditions. Bragantia 71, 319-327. Scandalios, J.G. (1993). Oxygen Stress and Superoxide Dismutases. Plant Physiology 101, 7-12. Schlögl, P.S., Nogueira, F.T.S., Drummond, R., Felix, J.M., De Rosa Jr, V.E., Vicentini, R., Leite, A., Ulian, E.C., and Menossi, M. (2008). Identification of new ABA-and MEJA-activated sugarcane bZIP genes by data mining in the SUCEST database. Plant cell reports 27, 335-345. Schottler, M.A., Toth, S.Z., Boulouis, A., and Kahlau, S. (2015). Photosynthetic complex stoichiometry dynamics in higher plants: biogenesis, function, and turnover of ATP synthase and the cytochrome b(6)f complex. Journal of Experimental Botany 66, 2373-2400.
Seidler, A. (1996). The extrinsic polypeptides of photosystem II. Biochimica et Biophysica Acta (BBA)-Bioenergetics 1277, 35-60. Seki, M., Ishida, J., Narusaka, M., Fujita, M., Nanjo, T., Umezawa, T., Kamiya, A., Nakajima, M., Enju, A., Sakurai, T., et al. (2002). Monitoring the expression pattern of around 7,000 Arabidopsis genes under ABA treatments using a full-length cDNA microarray. Funct Integr Genomics 2, 282-291. Sharma, P., Jha, A.B., Dubey, R.S., and Pessarakli, M. (2012). Reactive oxygen species, oxidative damage, and antioxidative defense mechanism in plants under stressful conditions. Journal of Botany 2012. Shinozaki, K., and Yamaguchi-Shinozaki, K. (1997). Gene expression and signal transduction in water-stress response. Plant physiology 115, 327. Shinozaki, K., and Yamaguchi-Shinozaki, K. (2007). Gene networks involved in drought stress response and tolerance. Journal of experimental botany 58, 221-227. Shiraya, T., Kaneko, K., and Mitsui, T. (2014). Quantitative proteomic analysis of intact plastids. Methods Mol Biol 1072, 469-480. Shrawat, A.K., and Lörz, H. (2006).
Agrobacterium‐mediated transformation of
cereals: a promising approach crossing barriers. Plant biotechnology journal 4, 575-603. Shulaev, V., and Oliver, D.J. (2006). Metabolic and proteomic markers for oxidative stress. New tools for reactive oxygen species research. Plant Physiology 141, 367-372. Silva, M., Jifon, J., Da Silva, J., and Sharma, V. (2007). Use of physiological parameters as fast tools to screen for drought tolerance in sugarcane. (Braz. J. Plant Physiol.), pp. 193-201. Silva, M.d.A., Goncalves da Silva, J.A., Enciso, J., Sharma, V., and Jifon, J. (2008). Yield components as indicators of drought tolerance of sugarcane. Scientia Agricola 65, 620-627. Silva, M.D.A., Jifon, J.L., Da Silva, J.A.G., Dos Santos, C.M., and Sharma, V. (2014a). Relationships between physiological traits and productivity of sugarcane in response to water deficit. Journal of Agricultural Science 152, 104-118.
117
Silva, M.d.A., Jifon, J.L., dos Santos, C.M., Jadoski, C.J., and da Silva, J.A.G. (2013). Photosynthetic Capacity and Water Use Efficiency in Sugarcane Genotypes Subject to Water Deficit During Early Growth Phase. Brazilian Archives of Biology and Technology 56, 735-748. Silva, R.L.d.O., Silva, M.D., Ferreira Neto, J.R.C., Nardi, C.H.d., Chabregas, S.M., Burnquist, W.L., Kahl, G., Benko-Iseppon, A.M., and Kido, E.A. (2014b). Validation of novel reference genes for reverse transcription quantitative real-time PCR in drought-stressed sugarcane. The Scientific World Journal 2014. Singh, K., Foley, R.C., and Oñate-Sánchez, L. (2002). Transcription factors in plant defense and stress responses. Curr Opin Plant Biol 5, 430-436. Singh, R., Kumar, P., Tiwari, N., Rastogi, J., and Singh, S. (2013). Current status of sugarcane transgenic: an overview. Advancements in Genetic Engineering 2013. Skirycz, A., Vandenbroucke, K., Clauw, P., Maleux, K., De Meyer, B., Dhondt, S., Pucci, A., Gonzalez, N., Hoeberichts, F., and Tognetti, V.B. (2011). Survival and growth of Arabidopsis plants given limited water are not equal. Nature biotechnology 29, 212-214. Skorzynska-Polit, E. (2007). Lipid peroxidation in plant cells, its physiological role and changes under heavy metal stress. Acta Societatis Botanicorum Poloniae 76. Smit, M., and Singels, A. (2006). The response of sugarcane canopy development to water stress. Field Crops Research 98, 91-97. Smith, D., Inman-Bamber, N., and Thorburn, P. (2005). Growth and function of the sugarcane root system. Field Crops Research 92, 169-183. Soares, R.A.B., Oliveira, P.F.M., Cardoso, H.R., Vasconcelos, A.C.M., Landell, M.G.A., and Rosenfeld, U. (2004). Efeito da irrigação sobre o desenvolvimento e a produtividade de duas variedades de cana-de-açúcar colhidas em início de safra. (STAB Açúcar, Álcool e Subprodutos), pp. 38-41. Somers, D.A., and Makarevitch, I. (2004). Transgene integration in plants: poking or patching holes in promiscuous genomes? Current opinion in Biotechnology 15, 126-131.
Songsri, P., Jogloy, S., Vorasoot, N., Akkasaeng, C., Patanothai, A., and Holbrook, C.C. (2008). Root distribution of drought-resistant peanut genotypes in response to drought. Journal of Agronomy and Crop Science 194, 92-103. Souza, C.B. (2012). Biotecnologia de cana-de-açúcar (Saccharum spp.) para tolerância a estresse hídrico. Sparkes, I.A., Runions, J., Kearns, A., and Hawes, C. (2006). Rapid, transient expression of fluorescent fusion proteins in tobacco plants and generation of stably transformed plants. Nat Protoc 1, 2019-2025. Spiteller, G. (2003). The relationship between changes in the cell wall, lipid peroxidation, proliferation, senescence and cell death. Physiologia Plantarum 119, 5-18. Stevenson, G.C. (1965). Genetic and Breeding of Sugarcane (Green and Co. London.). Su, Y., Guo, J., Ling, H., Chen, S., Wang, S., Xu, L., Allan, A.C., and Que, Y. (2014). Isolation of a novel peroxisomal catalase gene from sugarcane, which is responsive to biotic and abiotic stresses. PloS one 9, e84426. Sugiharto, B., Sakakibara, H., and Sugiyama, T. (1997). Differential expression of two genes for sucrose-phosphate synthase in sugarcane: molecular cloning of the cDNAs and comparative analysis of gene expression. Plant and cell physiology 38, 961-965. Taiz, L., and Zeiger, E. (2006). Plant physiology, 4th edn (Massachusetts: Sinauer Associates, Inc. Publishers). Takabayashi, A., Kishine, M., Asada, K., Endo, T., and Sato, F. (2005). Differential use of two cyclic electron flows around photosystem I for driving CO2-concentration mechanism in C4 photosynthesis. Proceedings of the National Academy of Sciences of the United States of America 102, 16898-16903. Tamura, K., Peterson, D., Peterson, N., Stecher, G., Nei, M., and Kumar, S. (2011). MEGA5: Molecular Evolutionary Genetics Analysis Using Maximum Likelihood, Evolutionary Distance, and Maximum Parsimony Methods. Mol Biol Evol 28, 2731-2739. Tanaka, Y., Sano, T., Tamaoki, M., Nakajima, N., Kondo, N., and Hasezawa, S. (2005). Ethylene inhibits abscisic acid-induced stomatal closure in Arabidopsis. Plant Physiology 138, 2337-2343.
118
Tardieu, F. (2011). Any trait or trait-related allele can confer drought tolerance: just design the right drought scenario. Journal of experimental botany, err269. Tardieu, F., Bruckler, L., and Lafolie, F. (1992). Root clumping may affect the root water potential and the resistance to soil-root water transport. Plant and Soil 140, 291-301. Tezara, W., Mitchell, V.J., Driscoll, S.D., and Lawlor, D.W. (1999). Water stress inhibits plant photosynthesis by decreasing coupling factor and ATP. Nature 401, 914-917. Thiebaut, F., Grativol, C., Tanurdzic, M., Carnavale-Bottino, M., Vieira, T., Motta, M.R., Rojas, C., Vincentini, R., Chabregas, S.M., Hemerly, A.S., et al. (2014). Differential sRNA regulation in leaves and roots of sugarcane under water depletion. PLoS One 9, e93822. Thomas, H., and Howarth, C.J. (2000). Five ways to stay green. Journal of experimental botany 51, 329-337. Trujillo, L., Sotolongo, M., Menendez, C., Ochogavia, M., Coll, Y., Hernandez, I., Borras-Hidalgo, O., Thomma, B., Vera, P., and Hernandez, L. (2008). SodERF3, a novel sugarcane ethylene responsive factor (ERF), enhances salt and drought tolerance when overexpressed in tobacco plants. Plant and Cell Physiology 49, 512-525. Umezawa, T., Nakashima, K., Miyakawa, T., Kuromori, T., Tanokura, M., Shinozaki, K., and Yamaguchi-Shinozaki, K. (2010). Molecular basis of the core regulatory network in ABA responses: sensing, signaling and transport. Plant and cell physiology 51, 1821-1839. Vargas, L., Santa Brigida, A.B., Mota Filho, J.P., de Carvalho, T.G., Rojas, C.A., Vaneechoutte, D., Van Bel, M., Farrinelli, L., Ferreira, P.C.G., Vandepoele, K., et al. (2014). Drought Tolerance Conferred to Sugarcane by Association with Gluconacetobacter diazotrophicus: A Transcriptomic View of Hormone Pathways. Plos One 9. Venekamp, J., Grashoff, C., and Koot, J. (1987). An analysis of conditions determining decline in water potential and concurrent proline accumulation in leaves of four cultivars of Vicia faba L. Journal of Agronomy and Crop Science 158, 304-316. Verbruggen, N., and Hermans, C. (2008). Proline accumulation in plants: a review. Amino acids 35, 753-759.
Vettore, A.L., da Silva, F.R., Kemper, E.L., Souza, G.M., da Silva, A.M., Ferro, M.I., Henrique-Silva, F., Giglioti, E.A., Lemos, M.V., Coutinho, L.L., et al. (2003). Analysis and functional annotation of an expressed sequence tag collection for tropical crop sugarcane. Genome Res 13, 2725-2735. von Caemmerer, S., and Evans, J.R. (2010). Enhancing C3 photosynthesis. Plant Physiology 154, 589-592. Wahid, A., and Close, T.J. (2007). Expression of dehydrins under heat stress and their relationship with water relations of sugarcane leaves. Biologia Plantarum 51, 104-109. Walter, A., Galdos, M., Scarpare, F., Seabra, J., Leal, M., Cunha, M., and Oliveira, C. (2013). Brazilian sugarcane ethanol: developments so far and challenges for the future. (Wires Energy Environment). Wang, H., Shao, H., and Tang, X. (2016). Recent Advances in Utilizing Transcription Factors to Improve Plant Abiotic Stress Tolerance by Transgenic Technology. Front Plant Sci 7, 67. Wang, H., Siopongco, J., Wade, L.J., and Yamauchi, A. (2009). Fractal analysis on root systems of rice plants in response to drought stress. Environmental and Experimental Botany 65, 338-344.
Wang, P., and Song, C.P. (2008). Guard‐cell
signalling for hydrogen peroxide and abscisic acid. New Phytologist 178, 703-718. Wang, W., Vinocur, B., and Altman, A. (2003). Plant responses to drought, salinity and extreme temperatures: towards genetic engineering for stress tolerance. Planta 218, 1-14. Watanabe, N., and Lam, E. (2008). BAX inhibitor-1 modulates endoplasmic reticulum stress-mediated programmed cell death in Arabidopsis. Journal of Biological Chemistry 283, 3200-3210. Watson, L., Clifford, H.T., and Dallwitz, M.J. (1985). The classification of Poaceae, sub-family and supertribes. Aust J Bot 33, 433–484. Weeks, J.T., Anderson, O.D., and Blechl, A.E. (1993). Rapid production of multiple independent lines of fertile transgenic wheat (Triticum aestivum). Plant Physiology 102, 1077-1084.
119
Wei, H., Wang, M.L., Moore, P.H., and Albert, H.H. (2003). Comparative expression analysis of two sugarcane polyubiquitin promoters and flanking sequences in transgenic plants. J Plant Physiol 160, 1241-1251. Whelan, S., and Goldman, N. (2001). A general empirical model of protein evolution derived from multiple protein families using a maximum-likelihood approach. Molecular biology and evolution 18, 691-699. Wilkinson, S., and Davies, W.J. (2002).
ABA‐based chemical signalling: the
co‐ordination of responses to stress in
plants. Plant, cell & environment 25, 195-210. Wilkinson, S., and Davies, W.J. (2010). Drought, ozone, ABA and ethylene: new insights from cell to plant to community. Plant, Cell & Environment 33. Wu, Y., Zhou, H., Que, Y.-X., Chen, R.-K., and Zhang, M.-Q. (2008). Cloning and identification of promoter Prd29A and its application in sugarcane drought resistance. Sugar Tech 10, 36-41. Xiong, L., Schumaker, K.S., and Zhu, J.K. (2002). Cell signaling during cold, drought, and salt stress. Plant Cell 14 Suppl, S165-183. Yamaguchi, T., and Blumwald, E. (2005). Developing salt-tolerant crop plants: challenges and opportunities. Trends Plant Sci 10, 615-620. Yamori, W. (2013). Improving photosynthesis to increase food and fuel production by biotechnological strategies in crops. Journal of Plant Biochemistry & Physiology 2013. Yamori, W., and Shikanai, T. (2016). Physiological functions of cyclic electron transport around photosystem I in sustaining photosynthesis and plant growth. Annual review of plant biology 67, 81-106. Yamori, W., Takahashi, S., Makino, A., Price, G.D., Badger, M.R., and von Caemmerer, S. (2011). The roles of ATP synthase and the cytochrome b6/f complexes in limiting chloroplast electron transport and determining photosynthetic capacity. Plant Physiol 155, 956-962. Yang, Y., Fu, Z., Su, Y., Zhang, X., Li, G., Guo, J., Que, Y., and Xu, L. (2014). A cytosolic glucose-6-phosphate dehydrogenase gene, ScG6PDH, plays a positive role in response to various abiotic stresses in sugarcane. 4, 7090.
You, J., and Chan, Z. (2015). ROS Regulation During Abiotic Stress Responses in Crop Plants. Front Plant Sci 6, 1092. Zeevaart, J., and Creelman, R. (1988). Metabolism and physiology of abscisic acid. Annual review of plant physiology and plant molecular biology 39, 439-473. Zhang, A., Jiang, M., Zhang, J., Tan, M., and Hu, X. (2006a). Mitogen-activated protein kinase is involved in abscisic acid-induced antioxidant defense and acts downstream of reactive oxygen species production in leaves of maize plants. Plant Physiology 141, 475-487. Zhang, S.Z., Yang, B.P., Feng, C.L., Chen, R.K., Luo, J.P., Cai, W.W., and Liu, F.H. (2006b). Expression of the Grifola frondosa Trehalose Synthase Gene and Improvement of
Drought‐Tolerance in Sugarcane (Saccharum
officinarum L.). Journal of Integrative Plant Biology 48, 453-459. Zhangsun, D., Luo, S., Chen, R., and Tang, K. (2007). Improved Agrobacterium-mediated genetic transformation of GNA transgenic sugarcane. Biologia 62, 386-393. Zhao, Q., Chen, S., and Dai, S. (2013). C4 photosynthetic machinery: insights from maize chloroplast proteomics. Frontiers in plant science 4, 85. Zhou, S.S., Li, M.J., Guan, Q.M., Liu, F.L., Zhang, S., Chen, W., Yin, L.H., Qin, Y., and Ma, F.W. (2015). Physiological and proteome analysis suggest critical roles for the photosynthetic system for high water-use efficiency under drought stress in Malus. Plant Sci 236, 44-60. Zhu, J.K. (2001). Cell signaling under salt, water and cold stresses. Curr Opin Plant Biol 4, 401-406. Zhu, J.K. (2002). Salt and drought stress signal transduction in plants. Annu Rev Plant Biol 53, 247-273. Zybailov, B., Mosley, A.L., Sardiu, M.E., Coleman, M.K., Florens, L., and Washburn, M.P. (2006). Statistical Analysis of Membrane Proteome Expression Changes in Saccharomyces c erevisiae. Journal of proteome research 5, 2339-2347.
120
Anexos
Anexo I: Termo referente a Bioética e/ou Biossegurança