UNIVERSITÀ DEGLI STUDI DI MILANO SCUOLA DI DOTTORATO in MEDICINA MOLECOLARE DIPARTIMENTO di FISIOPATOLOGIA MEDICO-CHIRURGICA E DEI TRAPIANTI CURRICULUM di Genomica, Proteomica e Tecnologie correlate CICLO XXIV TESI DI DOTTORATO DI RICERCA ANEMIA OF INFLAMMATION: investigation on hepcidin in acutely ill patients and their clinical outcome MED-09 DOTTORANDO Maria D.R. CARRABBA Matricola R08088 TUTOR prof. Maria Domenica CAPPELLINI CO-TUTOR prof. Giovanna FABIO COORDINATORE DEL DOTTORATO prof. Mario CLERICI A.A. 2011 - 2012
Transcript
UNIVERSITÀ DEGLI STUDI DI MILANO
SCUOLA DI DOTTORATO in MEDICINA MOLECOLARE
DIPARTIMENTO di FISIOPATOLOGIA MEDICO-CHIRURGICA E DEI TRAPIANTI
CURRICULUM di Genomica, Proteomica e Tecnologie correlate CICLO XXIV
TESI DI DOTTORATO DI RICERCA
ANEMIA OF INFLAMMATION: investigation on hepcidin in acutely ill patients and their clinical outcome
MED-09
DOTTORANDO Maria D.R. CARRABBA Matricola R08088
TUTOR prof. Maria Domenica CAPPELLINI CO-TUTOR prof. Giovanna FABIO COORDINATORE DEL DOTTORATO prof. Mario CLERICI
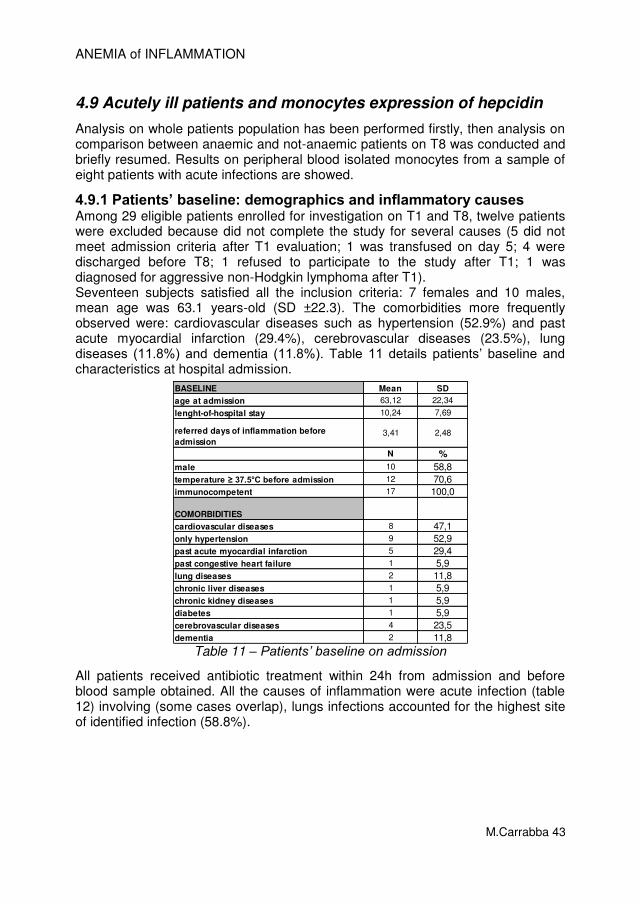
A.A. 2011 - 2012
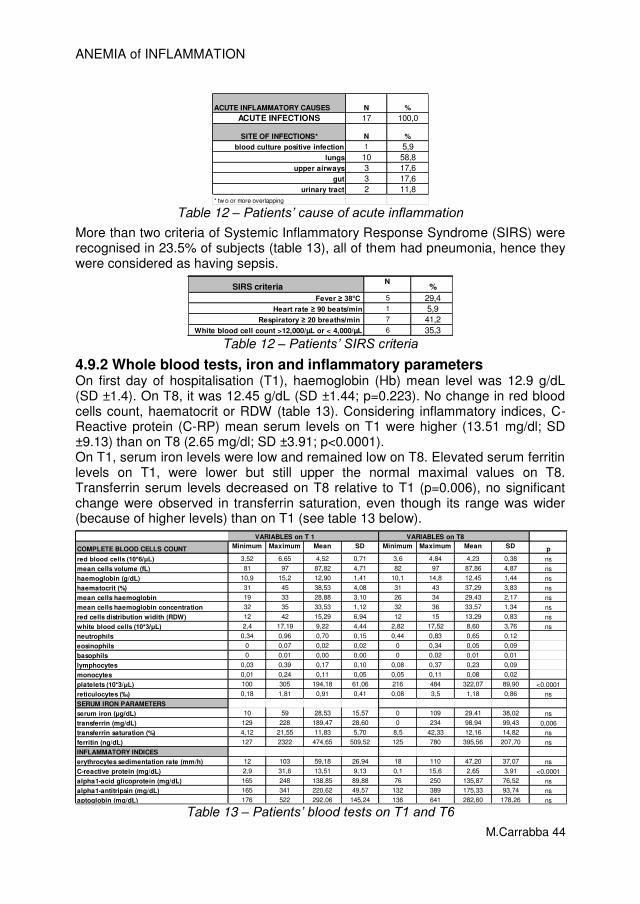
ANEMIA of INFLAMMATION
Anemia of inflammation I
INDEX
. Abbreviations .................................................................................. V
. Italian Summary ............................................................................. VII
. English Summary ......................................................................... VIII
1. INTRODUCTION
1.1 Hepcidin 1.1.1 Hepcidin Synthesis and Structure ............................................ 1
ABBREVIATIONS Acquired immunodeficiency syndrome (AIDS) Alanine aminotransferase (ALT) Alpha-1-acid glycoprotein (AAG) Alpha-1-antitripsin (A1AT) Anaemia of chronic disease (ACD) Anaemia of inflammation (AI) Antibody (Ab) Area under the curve (AUC) Aspartate aminotransferase (AST) Basophils (B) Blood red cells count (RBC) Bone morphogenic protein-6 (BMP-6) Bovine serum albumin (BSA) Chronic obstructive pulmonary disease (COPD) Cluster differentiation (CD) C-reactive protein (C-RP) Divalent metal transporter 1 (DMT1) Enzyme immunoassay (EIA) Enzyme-linked immunosorbent assay (ELISA) Eosinophils (E) Erythrocytes sedimentation rate (ESR) Erythropoietin (EPO) Ethylenediaminetetraacetic acid (EDTA) Ferroportin (Fpn) Fluorescein-isothiocyanate (FITC) Forward-scatter (FSC-H) Gamma-glutamyltransferase (GGT) Gamma-Interferon (けIFN) Glycoprotein (gp) Growth differentiation factor-15 (GDF-15) Haematocrit (Hct) Haemoglobin (Hb) Haptoglobin (Hp) Hemochromatosis (HFE) Hemojuvelin (HJV) Hemoxygenase-1 (HOX1) Human hepcidin (HEPC) Human hepcidin gene (HAMP) Hypoxia-inducible transcription factor (HIF) Intensive care unit (ICU) Interleukin-1a (IL-1a) Interleukin-1beta (IL-1く) Interleukin-4 (IL-4) Interleukin-6 (IL-6) Interleukin-10 (IL-10)
ANEMIA of INFLAMMATION
Anemia of inflammation VI
Interleukin-13 (IL-13) Iron deficiency anaemia (IDA) Iron-refractory iron deficiency anaemia (IRIDA) Janus kinase 2 (JAK2) Lipopolysaccharide (LPS) Lymphocytes (L) Mean cell haemoglobin (MCH) Mean cell haemoglobin concentration (MCHC) Mean cell volume (MCV) Mean of fluorescence intensity (MFI) Messenger ribonucleic acid (mRNA) Monoclonal antibodies (mAbs) Monocytes (M) Neutrophils (N) Nuclear factor-kB (NF-kB) Peridinin-chlorophyll-protein (PerCP) Peripheral blood lymphocytes (PBLs) Peripheral blood mononuclear cells (PBMC) Phosphate buffered saline (PBS) Phycoerythrin (PE) Platelets count (Plts) Quantitative real-time polymerase chain reaction (qRT-PCR) Receiver operating characteristic (ROC) Red blood cells (RBC) Red cell distribution width (RDW) Ret-HgB: reticulocyte haemoglobin content. Rheumatoid arthritis (RA) Saturation of transferrin (ST%) Serum ferritin (sFt) Serum iron (Fe) Side-scatter (SSC-H) Signal transducer and activator of transcription 3 (STAT3) Small interfering ribonucleic acid (siRNA) Soluble transferrin receptor (sTfR) Stem cell transplantation (SCT) Substance mothers against decapentaplegic homolog (SMAD) Surface-Enhanced Laser Desorption/Ionization Time-Of-Flight Mass Spectrometry (SELDI-TOF MS) Systemic inflammatory response syndrome (SIRS) Transferrin (Tf) Transmembrane protease serine 6 (TMPRSS6) Tumor necrosis factor-alpha (TNF-alpha) Twisted gastrulation protein homolog-1 (TWSG1). White blood cells count (WBC) World Health Organization (WHO)
ANEMIA of INFLAMMATION
Anemia of inflammation VII
SOMMARIO L’anemia da infiammazione è un’anemia normocitica e normocromica, associata ad un alterato metabolismo del ferro, a una eritropoiesi inefficace e a una ridotta sopravvivenza dei globuli rossi. L’epcidina è un ormone, la cui secrezione è indotta da interleuchina-6, precedentemente identificato come peptide antimicrobico. Attualmente l’epcidina è riconosciuta sia come il principale regolatore dell’omeostasi de ferro nei mammiferi, dove ne controlla il metabolismo, sia come modulatore chiave dell’anemia da infiammazione. L’epcidina viene secreta in circolo dagli epatociti e in quota minore viene prodotta anche da macrofagi, linfociti ed adipociti. Questo studio prospettico è stato condotto in 60 pazienti ospedalizzati per stati infiammatori acuti (95% affetti da infezioni acute), dei quali è stato ampiamente caratterizzato il profilo infiammatorio, lo stato del ferro e l’eritropoiesi. Sono state ottenute in vivo le medesime condizioni infiammatorie realizzate nei modelli di endotossiemia in vitro descritti da Kemna ed al. e da Theurl ed al. Inoltre, i livelli di epcidina, emoglobina e dell’assetto del ferro osservate nel nostro studio sono molto simili ai dati descritti da van Eijk ed al. in pazienti con sepsi severa ospedalizzati in reparti di terapia intensiva. Infatti, anche nel nostro studio, lo stato di infiammazione acuta, definito da elevati livelli serici di proteina C-reattiva e interleuchina-6, era associato ad elevate concentrazioni di epcidina serica, bassa sideremia, elevata saturazione della transferrina e livelli molto alti di ferritina serica. Abbiamo osservato che la persistenza di livelli elevati di epcidina serica era associata a una riduzione dei livelli di emoglobina nel corso della prima settimana di ospedalizzazione. Nell’arco della prima settimana, l’eritropoiesi è risultata essere inefficace, nonostante i livelli di eritropoietina serica fossero molto elevati soprattutto nei pazienti già anemici all’ingresso (N=β6). Inoltre questi pazienti presentavano anche elevati livelli di GDF-15 ed epcidina. I pazienti che avevano normali valori di emoglobina all’inizio dell’ospedalizzazione (N=γ1) hanno sviluppato anemia nel corso della prima settimana. Analizzando i loro valori di epcidina, abbiamo individuato che una concentrazione di epcidina di 23 nM/L era un cut-off in grado di predire l’evenienza di anemia dopo una settimana con una sensibilità del 100% e una specificità del 90%. Come già descritto in altri studi, abbiamo dimostrato l’espressione di mRNA dell’epcidina da parte dei monociti circolanti in questi pazienti con infiammazione acuta. In particolare abbiamo osservato che dopo una settimana di persistenza dell’infiammazione, i livelli più elevati di mRNA dell’epcidina erano espressi nei monociti circolanti dei pazienti che avevano uno stato infiammatorio più intenso, così come era più evidente una correlazione negativa tra i livelli di mRNA dell’epcidina (espresso dai monociti) e i livelli di ferritina serica. L’analisi nei monociti circolanti del recettore funzionale dell’interleuchina-6 (CD126 and gp130) ha mostrato una correlazione negativa con l’espressione di mRNA dell’epcidina e una correlazione positiva con i livelli di ferritina serica. La conoscenza dei meccanismi molecolari che sottendono l’instaurarsi dell’anemia da infiammazione e il ruolo dell’epcidina ha fornito nuovi strumenti diagnostici che permettono una migliore diagnosi delle cause di anemia e una terapia mirata.
ANEMIA of INFLAMMATION
Anemia of inflammation VIII
SUMMARY The anaemia of inflammation is a normochromic, normocytic anaemia, associated with abnormal iron utilization, erythropoietin hyporesponsiveness, and decreased red blood cells (RBC) survival. It is a very common problem in hospitalized patients for acute inflammatory diseases and develops within few days from the onset of illness. Hepcidin is an interleukin-6 induced hormone previously identified as an antimicrobial peptide. Now it is recognized as the master regulator of iron homeostasis in mammals allowing iron adaptation according to the body iron needs and as the key modulator of inflammation-associated anaemia. Hepcidin is found in the circulation, it is secreted mainly by hepatocytes and to a lesser extent by macrophages, T-lymphocytes and adipocytes. In 60 acutely ill patients (95% affected by infections), the degree of inflammation, indicated by IL-6 and C-RP levels, is associated with elevated concentrations of hepcidin, low iron serum levels, high transferrin saturation and very high ferritin serum levels. Moreover, persistently increased levels of hepcidin-25 on T1 and on T6 are associated with a decrease in haemoglobin during hospitalization. Patients (N=26) anaemic on T1 were still anaemic after one week. Erythropoiesis was still blunted in these patients, despite higher erythropoietin serum levels than not-anaemic patients. The high levels of GDF-15 and hepcidin could have a role in the ineffective erythropoiesis. We observed that acute ill patients (N=31) admitted with normal haemoglobin levels develop anaemia after the first week of hospitalization. Analysing hepcidin levels of this subset of patients, we found that a cut-off level of hepcidin concentration of 23 nM/L was able to predict anaemia occurrence after one week with 100% of sensitivity and 90% of specificity. The inflammatory cytokines pattern and its consequence on hepcidin and iron observed in vivo in this study resembles the one described in experimental models of endotoxemia showed by Kemna et al. and by Theurl et al. Also hepcidin serum levels, haemoglobin and iron parameters are very similar to the ones found by van Eijk et al. in their investigation in septic patients admitted to intensive care units As described in previous studies, we also demonstrated expression of hepcidin mRNA in circulating monocytes of these acutely ill patients. We found that the higher was the inflammation on admission, the higher was hepcidin mRNA expression in circulating monocytes after one week. Moreover we found negative correlation between mRNA levels of monocytes-derived hepcidin and serum ferritin, especially after one week of inflammation persistence. Analysis of interleukin-6 functional receptor (CD126 and gp130) on circulating monocytes showed a negative correlation with monocytes-derived hepcidin mRNA, and positive correlation with serum ferritin levels. These insights in anaemia of inflammation molecular mechanisms will help clinicians to better identify anaemia causes and adequately restore haemoglobin concentration with target therapies, reducing health-care requirements and healthcare costs, in-hospital stay and, finally, ameliorate health of patients.
ANEMIA of INFLAMMATION
M.Carrabba 1
1. INTRODUCTION The anaemia of inflammation (AI) is a very common problem in hospitalized patients for acute inflammatory diseases. It is a normochromic normocytic anaemia associated with abnormal iron utilization, erythropoietin hyporesponsiveness and decreased red blood cells survival that develops within few days from the onset of illness [1,2]. Approximately two-thirds of critically-ill patients present with a haemoglobin concentration less than 12 g/dl on admission in the intensive care unit (ICU), and 97% become anaemic by day 8 [3]. Anaemia is only partially corrected during hospital. The prevalence of anaemia in patients being discharged after acute inflammation illness has been observed to be very high [4]. Anaemia may also be prolonged after the hospital stay. It has been observed that the median time to recovery of anaemia is 11 weeks and one study reported that more than half patients discharged by intensive care units are still anaemic after six months [5]. Anaemia is associated with worse outcomes (such as increased length of stay and increased mortality). Indeed, deleterious effects of anaemia include increased risk of cardiac related morbidity and mortality in critically ill and older patients [6].
The striking feature of AI is low serum iron (hypoferremia) in the presence of considerable amounts of iron in bone marrow macrophages, but these stores are still restricted iron available for erythropoiesis. Treatment of this form of anaemia can be a clinical challenge, since the inflammatory process interferes both with the delivery of iron to the bone marrow and with the action of erythropoietin (EPO) at its target sites in the bone marrow [7].
Iron and immunity are closely linked. It has been suspected for some time that AI may be a side-effect of the host defence response to infection [8]. Indeed, many of the genes/proteins involved in iron homeostasis play a vital role in controlling iron fluxes such that bacteria are prevented from utilising iron for growth. Many studies in vitro and in animal models have recently elucidated the links of anaemia with inflammation and how the innate immunity effectively restricts iron availability to microbial invaders [9]. The regulation of hepcidin synthesis by cytokines (chiefly inteleukin-6) is the key link between host defence and iron metabolism, and an important component in the pathogenesis of AI. It has been observed that the cells of innate immune system, monocytes, macrophages and lymphocytes, are able to combat bacterial insults by carefully controlling their iron fluxes, which are mediated by hepcidin and ferroportin [10].
1.1 Hepcidin
1.1.1 Hepcidin Synthesis and Structure
Human hepcidin is a 25–amino acid peptide hormone first identified in human urine and plasma by three separate groups investigating either novel anti-microbial peptides or iron regulation [11-13]. It was named hepcidin (HEPC) because its mRNA was highly expressed in the liver and the peptide showed weak microbicidal activity in vitro [14,15]. Genetic
ANEMIA of INFLAMMATION
M.Carrabba 2
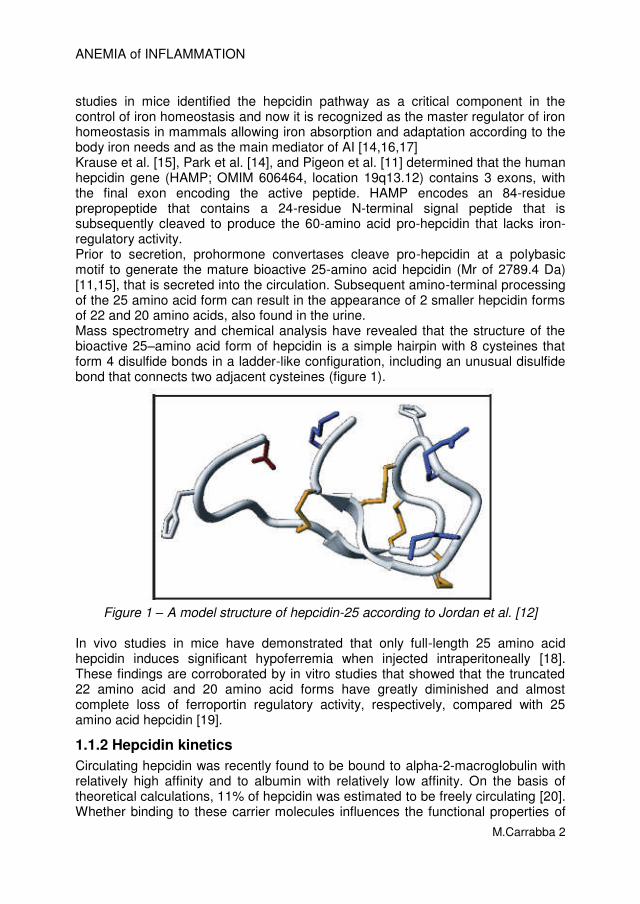
studies in mice identified the hepcidin pathway as a critical component in the control of iron homeostasis and now it is recognized as the master regulator of iron homeostasis in mammals allowing iron absorption and adaptation according to the body iron needs and as the main mediator of AI [14,16,17] Krause et al. [15], Park et al. [14], and Pigeon et al. [11] determined that the human hepcidin gene (HAMP; OMIM 606464, location 19q13.12) contains 3 exons, with the final exon encoding the active peptide. HAMP encodes an 84-residue prepropeptide that contains a 24-residue N-terminal signal peptide that is subsequently cleaved to produce the 60-amino acid pro-hepcidin that lacks iron-regulatory activity. Prior to secretion, prohormone convertases cleave pro-hepcidin at a polybasic motif to generate the mature bioactive 25-amino acid hepcidin (Mr of 2789.4 Da) [11,15], that is secreted into the circulation. Subsequent amino-terminal processing of the 25 amino acid form can result in the appearance of 2 smaller hepcidin forms of 22 and 20 amino acids, also found in the urine. Mass spectrometry and chemical analysis have revealed that the structure of the bioactive 25–amino acid form of hepcidin is a simple hairpin with 8 cysteines that form 4 disulfide bonds in a ladder-like configuration, including an unusual disulfide bond that connects two adjacent cysteines (figure 1).
Figure 1 – A model structure of hepcidin-25 according to Jordan et al. [12]
In vivo studies in mice have demonstrated that only full-length 25 amino acid hepcidin induces significant hypoferremia when injected intraperitoneally [18]. These findings are corroborated by in vitro studies that showed that the truncated 22 amino acid and 20 amino acid forms have greatly diminished and almost complete loss of ferroportin regulatory activity, respectively, compared with 25 amino acid hepcidin [19].
1.1.2 Hepcidin kinetics
Circulating hepcidin was recently found to be bound to alpha-2-macroglobulin with relatively high affinity and to albumin with relatively low affinity. On the basis of theoretical calculations, 11% of hepcidin was estimated to be freely circulating [20]. Whether binding to these carrier molecules influences the functional properties of
hepcidin is uncertain. Hepcidin clearance is assumed to occur via cellular co-degradation with ferroportin at its sites of action (see below), and via excretion by the kidneys.
1.1.3 Hepcidin, iron and inflammation
The involvement of hepcidin in iron metabolism was suggested by the observation that hepcidin synthesis is induced by dietary iron [11]. The specific role of hepcidin was then examined by assessing the effects of its deficiency or excess in transgenic mouse models. These studies indicate that hepcidin inhibits intestinal iron absorption [21,22], placental iron transport [21], and release of recycled iron from macrophages [22], effectively decreasing the liver iron to maturing erythrocytes in the bone marrow (figures 2 and 3).
Figure 2 – The role of hepcidin in iron metabolism. (From Nemeth E. et Ganz T. [23])
In humans, iron is an essential component of haemoglobin and myoglobin and of many enzymes involved in redox reactions and energy metabolism. Iron is strictly conserved, in large part by recycling the iron (about 20 mg/day) from haemoglobin of senescent erythrocytes. Most of the iron in plasma is destined for erythropoiesis in the bone marrow and hepcidin controls this iron flows through its receptor, ferroportin (figure 3) [24].
ANEMIA of INFLAMMATION
M.Carrabba 4
Figure 3 – Hepcidin interaction with ferroportin controls the main iron flows into plasma. Iron flows and reservoirs are in blue, iron in haemoglobin in red, and
hepcidin and its effect in orange.RBC: red blood cells; Fpn: ferroportin. (From Ganz T. [24])
In humans, homozygous frameshift or nonsense mutations in hepcidin gene have been found in subjects affected by severe juvenile hemochromatosis [25]. Hepcidin production was also diminished in another form of juvenile hemochromatosis due to mutations in the hemojuvelin gene [26] and in the most common form of hemochromatosis, that caused by mutations in the HFE gene [27,28]. Autonomous overexpression of hepcidin mRNA expression was seen in large hepatic adenomas associated with iron-refractory anaemia [29] or mutations in a protein, transmembrane protease serine 6 (TMPRSS6) that leads to constitutive hepcidin over-expression develop a microcytic anaemia characterized by functional or actual iron deficiency associated with resistance to iron therapy called iron-refractory iron deficiency anaemia (IRIDA) [30].
It is now noteworthy that hepcidin levels are reliably elevated in patients with AI compared to normal values. Inflammation has a potent effect on iron homeostasis, reducing intestinal iron absorption, sequestering iron in macrophages, and thereby decreasing serum iron levels. In favor of the role of hepcidin in inflammatory hypoferremia, Nemeth et al stimulated in vitro fresh human hepatocytes with a panel of cytokines and showed strong induction of hepcidin mRNA by interleukin-6 (IL-6), but not interleukin-1a (IL-1a) or tumor necrosis factor-alpha (TNF-alpha), indicating that IL-6 is the mediator of hepcidin induction by inflammation and hepcidin is a type II acute-phase response [28]. Moreover, urinary hepcidin level rose within hours of IL-6 or lipopolysaccharide (LPS) infusion into human volunteers, on the average 7-fold, and hypoferremia coincided with the rise of hepcidin. The maximal reduction in serum iron was evident some 2-4 h post-
ANEMIA of INFLAMMATION
M.Carrabba 5
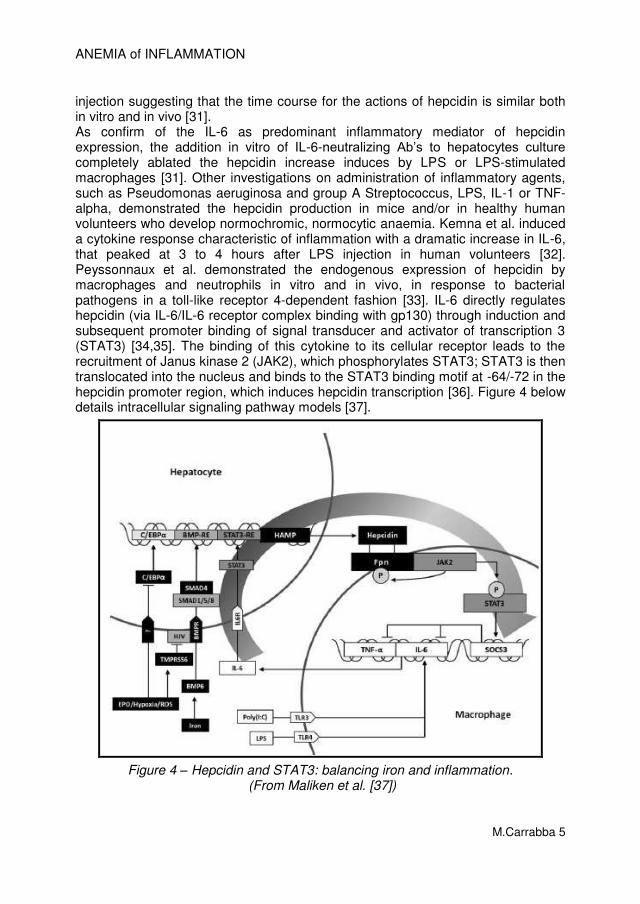
injection suggesting that the time course for the actions of hepcidin is similar both in vitro and in vivo [31]. As confirm of the IL-6 as predominant inflammatory mediator of hepcidin expression, the addition in vitro of IL-6-neutralizing Ab’s to hepatocytes culture completely ablated the hepcidin increase induces by LPS or LPS-stimulated macrophages [31]. Other investigations on administration of inflammatory agents, such as Pseudomonas aeruginosa and group A Streptococcus, LPS, IL-1 or TNF-alpha, demonstrated the hepcidin production in mice and/or in healthy human volunteers who develop normochromic, normocytic anaemia. Kemna et al. induced a cytokine response characteristic of inflammation with a dramatic increase in IL-6, that peaked at 3 to 4 hours after LPS injection in human volunteers [32]. Peyssonnaux et al. demonstrated the endogenous expression of hepcidin by macrophages and neutrophils in vitro and in vivo, in response to bacterial pathogens in a toll-like receptor 4-dependent fashion [33]. IL-6 directly regulates hepcidin (via IL-6/IL-6 receptor complex binding with gp130) through induction and subsequent promoter binding of signal transducer and activator of transcription 3 (STAT3) [34,35]. The binding of this cytokine to its cellular receptor leads to the recruitment of Janus kinase 2 (JAK2), which phosphorylates STAT3; STAT3 is then translocated into the nucleus and binds to the STAT3 binding motif at -64/-72 in the hepcidin promoter region, which induces hepcidin transcription [36]. Figure 4 below details intracellular signaling pathway models [37].
Figure 4 – Hepcidin and STAT3: balancing iron and inflammation. (From Maliken et al. [37])
ANEMIA of INFLAMMATION
M.Carrabba 6
Hepcidin exerts its activity by binding to the iron exporter ferroportin and causing its degradation. As ferroportin is the major entryway for iron into plasma, decrease in ferroportin reduces the extracellular iron available for erythropoiesis within hours and iron concentrations rapidly drop [18]. Hepcidin acts by inhibiting iron flows into plasma from macrophages involved in recycling of senescent erythrocytes, from duodenal enterocytes engaged in the absorption of dietary iron, and from hepatocytes that store iron [23]. Figure 5 details hepcidin fine tuning of the cells involved in systemic iron regulation [38].
Figure 5 – Regulation of Systemic Iron Homeostasis. Cells involved in systemic iron regulation are shown. In iron overload (left), high hepcidin levels inhibit
ferroportin-mediated iron export by triggering internalization and degradation of the complex to reduce transferrin saturation. Hepcidin expression is high. In iron
deficiency (right), iron is released by ferroportin into the circulation. Haemoglobin-derived heme is catabolized in macrophages by hemoxygenase-1 (HOX1).
Hepcidin expression is low.(From Hentze et al. [38])
1.1.4 Hepcidin and peripheral blood leukocytes
Several studies have demonstrated hepcidin expression by cells other than hepatocytes, although at much lower levels by comparison [33,39-45]. The hepcidin produced by these cells may exert local effects in these tissues more than systemic influences. The amount of hepcidin found in the circulation is secreted mainly by hepatocytes, and to a lesser extent by macrophages, T-lymphocytes and adipocytes. Theurl et al. [46,47] showed that human monocytes hepcidin mRNA expression is induced within 3 hours after stimulation with LPS or IL-6. Hepcidin binding to its receptor ferroportin reduces iron availability, because induces hypoferremia, low serum iron-binding capacity and normal to elevated ferritin, thus controlling microbial growth. Pinto et al. [48] investigated the role of hepcidin in lymphocyte biology. They characterized the expression of hepcidin in human peripheral blood
ANEMIA of INFLAMMATION
M.Carrabba 7
lymphocytes (PBLs) and found that it increases after T-lymphocyte activation in vitro. Wu et al. [49] recently explored the expression and signaling mechanism regulating hepcidin mRNA expression in peripheral blood leukocytes. Ex vivo studies found that hepcidin mRNA expression in peripheral blood leukocytes induced by LPS depends on NF-kB, and TNF-a may be a key mediator in this procedure.
1.1.5 Regulation of hepcidin
Several physiologic and pathologic processes regulate the synthesis of hepcidin [38]. Situations in which demand for circulating iron is increased (particularly erythropoietic activity) elicit a decrease in hepatocellular hepcidin synthesis. On the other hand, infection and inflammation cause an increase in hepcidin synthesis. Figure 6 illustrates systemic and hepatic cellular regulatory mechanisms [50].
Figure 6 – On the left: Iron (Fe) sufficiency and inflammation enhance hepcidin production in the liver. On the right: Signaling pathways for hepatic hepcidin
transcription. (From Coyne DW. [50]) The functional signaling routes by which (a) iron status, (b) erythropoietic activity, (c) hypoxia, and (d) inflammation affect hepcidin expression are increasingly being investigated. These routes comprise 4 highly interconnected regulatory pathways (Figure 7).
1.1.5.1 Regulation by erythropoietic signals Increased erythropoietic activity is a potent suppressor of hepcidin production. A single injection of erythropoietin in humans caused a dramatic decrease in serum hepcidin within 24 hours [51], and a mouse model showed a dose-dependent decrease in hepcidin mRNA after erythropoietin administration [52]. However, the signal that communicates the level of erythropoiesis to the liver to signal hepcidin suppression is not clear yet. Over-expression of serum transferrin receptor (sTFR1), which correlates well with erythroid mass and is responsive to iron deficiency, does not appear to alter iron metabolism in mice [53]. The hypothesis that erythropoietin (EPO) acts directly on hepatocyte receptors in cell culture [54] could not be confirmed in animal models for anaemia, which showed that decreased hepcidin expression depends on erythropoiesis and is not directly mediated by EPO [55,56].
ANEMIA of INFLAMMATION
M.Carrabba 8
Recent observations suggest that the erythropoietic signal may include 1 or more proteins released at sites of active erythropoiesis, i.e., growth differentiation factor-15 (GDF-15) and twisted gastrulation protein homolog-1 (TWSG1). These molecules, like bone morphogenetic proteins (BMP) are members of the transforming growth factor-family and thus possibly act through effects on the BMP/SMAD (mothers against decapentaplegic homolog – Drosophila) pathway [57,58]. Tanno et al. [59] and colleagues recently demonstrated that GDF-15 is up-regulated in thalassemic serum and can suppress hepcidin expression in vitro. Neither of these factors, however, appears to be required to mediate the decrease in hepcidin observed with EPO administration. It is likely that additional erythropoietic factors downregulating hepcidin expression suppression in vivo remain to be identified.
1.1.5.2 Regulation by hypoxia Decreased hepcidin expression has been reported in response to hypoxia in vivo [31,60]. This effect might be attributable in part to the effect of hypoxia on EPO expression and then to an erythropoietic activity that has a possible direct interaction with hepatocyte receptors [54]. Alterations of the hypoxia-inducible transcription factor (HIF) pathway in vivo can affect hepcidin expression [61] but whether HIF regulates hepcidin transcription directly or mostly indirectly is still unresolved. The main effect of hypoxia on iron homeostasis is to increase erythropoietin production in the kidney, which would lead to proliferation of erythroblasts and suppression of hepcidin by putative erythroid factors [62].
1.1.5.3 Regulation by inflammation Hepcidin synthesis is rapidly increased by infection and inflammation, causing retention of iron in macrophages and decreased iron absorption [63]. The resulting hypoferremia is presumably a component of innate immune responses that deprive invading microbes of iron and other essential nutrients. Serum hepcidin was found to be greatly increased in patients with inflammation defined as a value of C-reactive protein >10 mg/dL, sepsis, burns, inflammatory bowel disease, and multiple myeloma [64-66]. As previously detailed, among the inflammatory mediators regulating hepcidin, IL-6 was shown to be a prominent inducer in vitro and in vivo, and it stimulates hepcidin transcription through a STAT-3 dependent mechanism (see above). In a proof-of-principle study, Sasu et al. neutralized hepcidin by a monoclonal antibody in the Brucella abortus mouse model of AI and found it to restore responsiveness to EPO [67]. The results of this study suggest that administration of anti-hepcidin therapies alone or in combination with erythropoiesis-stimulating agents may improve patients’ erythropoietic response and allow the use of lower EPO doses to avoid the potential detrimental effects of high EPO concentrations. Anti–IL-6 antibody was shown to suppress IL-6–induced hepcidin production in Castleman disease, and to improved anaemia in arthritic monkeys [68,69].
ANEMIA of INFLAMMATION
M.Carrabba 9
Figure 7 – Molecular and functional pathways of hepatocyte hepcidin synthesis. (From Kroot et al. [70])
1.1.6 Hepcidin-modulating agents
Hepcidin-targeted therapies may improve treatment options for patients suffering from iron disorders and eventually also AI. Although no specific hepcidin-modulating therapies are available, several compounds are under development as hepcidin agonists or antagonists [62,71,72]. Hepcidin agonists could be useful to prevent iron overload attributed to hepcidin deficiency, such as hereditary hemochromatosis, and especially く-thalassemias and other iron-loading anaemias, and possibly some acquired forms of nonhemochromatotic iron-overload diseases. Hepcidin antagonists, on the other hand, might be expected to benefit patients with diseases of hepcidin excess manifested as iron-restricted anaemia and systemic iron deficiency, such as iron-refractory iron-deficiency anaemia, anaemia of chronic diseases (rheumatic diseases, inflammatory bowel diseases, autoimmune diseases), chronic kidney disease, multiple myeloma and other cancers, obesity-related iron deficiency, and cardiovascular disease. Preclinical studies to assess the efficacy of hepcidin-related therapies and large clinical trials addressing safety and long-term efficacy are needed to clarify the risks and benefits of hepcidin-targeted treatments.
1.2 The anaemia of inflammation
1.2.1 Definition of anaemia of inflammation
The common features of AI [73] is a normocytic, normochromic anaemia, that can become microcytic and hypochromic as the disease progresses. Reticulocytosis is not usually observed. Low serum iron concentration is a hallmark of the clinical
ANEMIA of INFLAMMATION
M.Carrabba 10
presentation of AI and because it is present in iron deficiency, distinguish the two forms or the combination of both is of pivotal importance for the correct targeted therapy. The serum iron concentration and transferrin saturation are low, while macrophage iron stores remain replete. The variability in clinical expression of AI may be related to the duration or severity of the inflammation or to differential expression of various pro-inflammatory cytokines that direct the inflammatory response. Indeed, the variation in the “cytokine profile” across disease states may lead to variations in the mechanisms that restrict erythropoiesis or promote turnover of erythrocytes and therefore affect the presentation of AI. Table 1 shows blood serum iron parameters and they different pattern in the condition of AI, in the condition of iron deficiency and in the combined anaemia of iron deficiency and of inflammation.
Table 1 – blood serum iron parameters, hepcidin and C-RP patterns. (Modified from Lasocki et al. [2])
1.2.2 “Tools” for diagnosis of anaemia of inflammation
Sensitive and specific clinical assays are essential for the diagnosis of AI and for the optimal clinical management.
1.2.2.1 Whole blood count The World Health Organization defines anaemia as haemoglobin less than 13 g/dL in men less than 12 g/dL in women [74]. In AI, mean cell volume (MCV) and mean cell haemoglobin (MCH) are normal, but can drop as the disease persists. Red cell distribution width (RDW) indicates erythrocyte heterogeneity. A recent study suggests that increased RDW in heart failure is related to inflammatory
ANEMIA of INFLAMMATION
M.Carrabba 11
stress and impaired iron mobilization [75] indicating that it might also be useful in the diagnosis of AI. The presence of acute inflammation is often caused by occurrence of an infection and elevated neutrophils, monocytes, and platelets indicate inflammation.
1.2.2.2 Serum inflammation markers The detection of C-reactive protein (C-RP) has improved and is routinely used in clinical management of inflammation, but remains a fairly nonspecific measure of inflammation. Recently the availability of pro-inflammatory cytokines kits for clinical use has been introduces into clinics, eventually helping to discriminate between the mechanisms that drive AI.
1.2.2.3 Serum iron parameters Serum iron and transferrin (Tf) saturation are decreased in AI, indicating that the iron supply to the erythron is limited. Confirmation of sufficient iron stores can be difficult. Serum ferritin (sFt) is generally considered a marker of iron stores. Generally, when serum ferritin is below 30 ng/mL in an anaemic patient, iron deficiency can be diagnosed [1]. However, in many patients, a combination of iron deficiency and AI may exist. Serum ferritin is induced in response to inflammation. Thus, in the context of AI, it is a poor marker of available iron. Serum ferritin has been used in conjunction with the serum transferrin receptor (sTfR) to determine the sTfr/log sFt ratio. sTfR is produced when erythroid precursors have produced sufficient haemoglobin and shed the receptor. As iron availability to the erythron decreases, or as erythroid capacity increases, sTfR in the plasma increases. Despite iron restriction in the context of AI, sTfR is not elevated, but remains in the normal range due to downregulation by pro-inflammatory cytokines [76]. The sTfR/log sFt ratio can discriminate between iron-deficiency anaemia and AI. sTfR/log sFt >1.5 is most consistent with iron deficiency, but sTfR/log sFt <0.8 best defines iron deficiency with inflammation [77]. This diagnostic determination is currently limited in availability and is underutilized in clinical practice.
1.2.2.4 Serum hepcidin Recently, several hepcidin assays have become available [64,70], but currently, there are no established standards or cut-offs for hepcidin based diagnoses [78]. Hepcidin levels must be interpreted in the context of the physiology of the individual. One might argue that an anaemic adult with hepcidin concentrations in the normal range has inappropriately elevated hepcidin, because it should be low in response to hypoxia. Several investigators have suggested methods to normalize hepcidin values based on other biomarkers such as sTfR, serum iron, or serum ferritin. However, because reliable methods for measures of hepcidin have only recently become available, more work must be done to assess hepcidin levels in various disease states before appropriate diagnostic guidelines can be developed.
1.2.2.5 Establishment of algorithms to identify anaemia of inflammation and its differential diagnosis
The aim of identify pure AI from combined disorders of iron-deficiency anaemia or other iron-restricted/iron-deficiency anaemias is to appropriate therapy and management. The algorithm would be helpful to indicate when iron supplementation or erythropoietin treatment may be beneficial but more importantly
ANEMIA of INFLAMMATION
M.Carrabba 12
to identify patients with a limited potential for response to these established therapies. For patient stratification, a scheme proposed by Weiss and Goodnough [1] was explored and expanded by Sasu et al. [79] and showed in figure 8. The Authors found that in their population, using either of these stratification schemes, hepcidin concentrations strongly correlated with AI. Less hepcidin elevation was seen in patients judged to have mixed anaemia (both inflammation and iron deficiency) despite the fact that these patients had detectable CRP levels. Many factors may explain this discrepancy, such as differences in the half-lives of CRP and hepcidin (the half-life of CRP is 19 h, whereas the half-life of hepcidin may be much shorter [18]). Another intriguing explanation is the possibility that iron deficiency in these patients may be the counter-balancing of inflammation-induced hepcidin production [38].
Figure 8 – Proposed algorithms for anaemic patients (Hb less than 10 g/dL)
stratification and categorization. (From Sasu et al. [79])
Van Santen et al. [80] proposed an algorithm to discriminate iron-deficiency anaemia in patients affected by rheumatoid arthritis (RA), hence with chronic inflammatory status. Their classification scheme precludes direct comparison of hepcidin or haemoglobin content parameters with any of the conventional parameters used for detection of true iron deficiency in RA patients. Hepcidin cut-off s proposed have been validated in their cross sectional study, but the number of patients and the characteristics of patients are the main limitations. They concluded that rheumatologist should add hepcidin and reticulocytes-haemoglobin content parameters to the routinely clinical measurements in order to detect iron deficiency in RA patients with inflammation and anaemia (figure 9).
ANEMIA of INFLAMMATION
M.Carrabba 13
Figure 9 – Proposed algorithms by van Santen et al. [80])
IDA: iron deficiency anaemia; ACD: anaemia of chronic disease; C-RP: C-reactive protein; ESR: erythrocytes sedimentation rate;
Ret-HgB: reticulocyte haemoglobin content.
1.3 The in vivo “model” of endotoxemia
1.3.1 Patients hospitalized out of acute inflammatory diseases
Since the first published investigation by Kemna et al [32] that showed the temporal associations between plasma cytokines, hepcidin levels, and serum iron parameters in 10 healthy human individuals after LPS injection, many ex-vivo experiments on cells cultures and animal models of induced acute infections by several pathogens have been described. To date, few studies have been conducted in the setting of acutely ill adult patients. Excluding injury, trauma or cancer patients, only van Eijk et al. [81] investigated the development of anaemia during acute systemic inflammation especially evoked by sepsis in the acute care units setting. They found that hepcidin-25 is increased during human sepsis and in septic patients the degree of inflammation, indicated by IL-6 levels and number of systemic inflammatory response syndrome (SIRS) criteria present, is associated with the elevated concentrations of hepcidin. Furthermore he showed that persistently increased levels of hepcidin-25 at day 2 and 3 after admission are associated with a decrease in haemoglobin during hospitalization [81]. Other Authors recently [2,3,82] reviewed the issue of anaemia in critically ill patients in order to elucidate the linking between hepcidin-inflammation-anaemia and to propose clinical management based on pathogenetic mechanism. Human data concerning the effect of hepcidin release on the development of anaemia during acute inflammation in non-intensive care setting are still lacking.
ANEMIA of INFLAMMATION
M.Carrabba 14
2. STUDY AIM
2.1 Rationale
This study has been planned to verify in a clinical setting the in vivo experimental endotoxemia model investigated in human healthy subjects, in animals or ex vivo in several cellular models [31,32,47-49]. The first investigation by Kemna et al in 2005 was conduct on 10 human healthy subjects injected with LPS, a more upstream inflammation activator, to study the temporal associations between plasma cytokines, hepcidin levels, and serum iron parameters. IL-6 was dramatically induced within 3 hours after injection, and urinary hepcidin peaked within 6 hours, followed by a significant decrease in serum iron[32]. These in vivo human results confirmed the importance of the IL-6–hepcidin axis in the development of hypoferremia in inflammation and highlight the rapid responsiveness of this iron regulatory system. In 2008, Theurl et al. [47] showed that the small amounts of hepcidin produced by inflammatory monocytes/macrophages exerted autocrine regulation toward cellular iron metabolism. They found that monocyte hepcidin mRNA expression was significantly induced within 3 hours after stimulation with LPS or IL-6, and hepcidin mRNA expression was significantly higher in monocytes of patients with anaemia of chronic diseases (ACD) than in controls. In ACD patients, monocyte hepcidin mRNA levels significantly correlated to serum IL-6 concentrations, and increased monocyte hepcidin mRNA levels were associated with decreased expression of the iron exporter ferroportin and iron retention in these cells. Transfection of monocytes with siRNA directed against hepcidin almost fully reversed this LPS-mediated effect, confirming the hepcidin autocrine activity on monocytes. In the following years few studies have been conducted in the setting of acutely ill patients admitted to intensive care units. In this setting, patients are affected by acute and severe inflammation and often by sepsis. These patients had very high levels of hepcidin at admission, and mostly normalized after three days of therapies. The 13% of patients needed at least one blood transfusion during the first 2 weeks of admission, not related to active bleeding [81]. The present research project proposed to investigate the associations between different plasma cytokines, iron parameters, serum hepcidin, monocytes-derived hepcidin and the development of AI in the setting of acutely ill patients hospitalized for acute inflammatory diseases.
2.2 Aims
This study aim is to develop effective strategies to detect and manage anaemia of inflammation (AI), through three main points:
a) To evaluate hepcidin impact on anaemia in vivo through the model of acute inflammatory conditions in hospitalized patients
b) To explore the molecular regulatory signalling network and timing of AI in circulating monocytes
c) To identify AI-specific biomarkers, their diagnostic and prognostic useful and, eventually, targets for therapy.
ANEMIA of INFLAMMATION
M.Carrabba 15
Furthermore, the study could evaluate the true impact of AI and the outcome of patients hospitalized for acute inflammatory conditions and the possible effects on hepcidin serum levels of some drugs frequently prescribed in the general population (e.g. statins, macrolides, heparins, et al.).
2.3 strategy
To analyse the time-course of inflammation, anaemia and hepcidin we tested patients on first and sixth day of admission. Although different from the experimental induced endotoxemia models, where it is well known the exact time of inflammation onset, this approach let us to standardized samples and findings, as well as the fact that all the analysis were conduct paired between 1
st and 6
th days
for each patients. In a preliminary pilot study we tested different times and found that 6 days could be enough to capture the beginning of anaemia onset and inflammation recovery. We also addressed this “one-week approach” in order to not excessively cause patients’ blood loss by venepuncture. In a further group of patients, in addition to whole blood tests, biochemical and cytokines profiling, we investigated on first and eighth day of admission the monocytes-derived mRNA hepcidin. We chose an 8-days course approach out of hospital central laboratory reasons and to better evaluate recovery from inflammation. At admission, patients were characterized for site and type of infection, they were also stratified for severity of inflammatory responses and categorized for being anaemic or not-anaemic. Comparisons between patients were conduct according to the mentioned clinical stratifications.
ANEMIA of INFLAMMATION
M.Carrabba 16
3. PATIENTS, MATERIALS AND METHODS 3.1 Study setting and design
This monocentric study has been conduct in Fondazione IRCCS Cà Granda Ospedale Maggiore Policlinico, a tertiary care university hospital in Milan and in its university research laboratories of the Università degli Studi of Milan, Italy. The study was approved by the Fondazione IRCCS Cà Granda Ethical Committee. Informed consent for obtaining additional peripheral blood samples for scientific purposes during routine blood drawing was obtained before the procedure from each subject in accordance with the Declaration of Helsinki. This study has been designed by G. Fabio, who is also the PI, and it has been registered in ClinicalTrial.gov (identification number NCT01589874). The study draw to consider each patient admitted to the Internal Medicine Department 1-A from Emergency Department because of acute inflammatory disease. The impact of inflammation on hepcidin production, iron metabolism and erythropoiesis have been investigated in vivo by evaluation on the first day of admission (T1) and on the sixth day of hospitalization (T6) of complete blood haematological test, serum inflammation markers, serum iron parameters, inflammation cytokines profiles, erythropoiesis signals and hepcidin concentration. In a subsets of patients the hepcidin mRNA production was investigated on patients’ blood peripheral circulating monocytes in order to better clarify the impact of monocytes activated hepcidin production in the setting of anaemia of acute inflammatory diseases. In this patients subgroup the investigation has been conduct on first day (T1) and on eighth day (T8) of admission.
3.2 Patients
All the consecutive adult patients hospitalized at the Internal Medicine Department 1-A with diagnosis of acute inflammatory condition were enrolled if they satisfied the following inclusion criteria: serum C-Reactive Protein (C-RP) level > 3mg/dL and creatinine level < 2mg/dL (creatinine clearance >30%). Were excluded all the patients affected by any haematological diseases, cancer under chemotherapy, AIDS, liver cirrhosis, genetic hemocromatosis, immunosuppressive therapy, chronic erythropoietin therapy or blood transfusion in the past 30-days or during the enrolment time. The cause of inflammation were investigated and bleeding ruled out. The choice of diagnostic work up and therapy will be entirely dependent on the physician treating the patient and the enrolment in this study interfered in no case with the diagnostic and therapeutic management of the patient. All patients' data since admission until discharge were collected in an electronic database and analysed:
- blood test analysis (collected by venepuncture at the same time for all analysis)
- clinical parameters recorded at admission (arterial blood pressure, heart rate, body temperature, respiratory rate)
- microbiological findings of samples collected at admission - instrumental examination for ruling out blood losses - diagnosis at discharge
3.3 Laboratory measurements
3.3.1 Biochemical assays
Patients’ blood samples were drawn on a routine basis and were measured using routine standard laboratory assays by automated analysers in the Hospital Central Laboratory according to ISO 9001 standard laboratory procedures. For each patient on the first day of admission (T1) was analysed: - complete routine haematology parameters: haemoglobin (Hb), blood red cells count (RBC), haematocrit (Hct), mean cell volume (MCV), mean cell haemoglobin (MHC), mean cell haemoglobin concentration (MCHC), white blood cells count (WBC), Arneth’s leukocyte formula (neutrophils (N), eosinophils (E), basophils (B), lymphocytes (L), monocytes (M)), platelets count (Plts) - serum inflammatory markers: C-reactive protein (C-RP), erythrocytes sedimentation rate (ESR), alpha-1-acid glycoprotein (AAG), haptoglobin (Hp), alpha-1-antitripsin (A1AT) - serum iron parameters: serum iron (Fe), ferritin, transferrin (Tf) - serum liver function tests: alanine aminotransferase (ALT) and aspartate aminotransferase (AST), gamma-glutamyltransferase (GGT), bilirubinemia (total and direct), cholinesterase, albumin, alkaline phosphatase, coagulation parameters (PT, PTT) - serum kidney function tests: creatinine, uraemia, sodium - serum levels of folate and B12 vitamin - arterial blood gas analysis: pH, partial pressures of oxygen (PaO2), carbon dioxide (PaCO2), bicarbonate (HCO3-) and oxygen saturation (SaO2)
For each patient on day sixth of admission (T6) was analysed: - complete routine haematology parameters - serum inflammatory markers - serum iron parameters - serum kidney function tests: creatinine, uraemia, sodium - oxygen saturation (SaO2)
3.3.2 Serum cytokines profiling and serum erythropoietic signals
Blood samples were obtained early in the morning after overnight fasting, on both first (T1) and sixth (T6) day of hospitalization. Patients’ whole blood was collected into serum isolation tubes at the same time of routinely samples and centrifuged at least 2 hours later. Serum was stored at −80°C in aliquots to avoid multiple freeze-thaw cycles. Then samples were processed and the following analytics determined using commercially available enzyme-linked immunosorbent assay (ELISA) kits according to manufacturer's indications:
ANEMIA of INFLAMMATION
M.Carrabba 18
a) serum levels of soluble transferrin receptor (sTfR): BioVendor Laboratorni medicina Modrice- Czech Republic
b) serum endogenous erythropoietin (EPO): IBL Hamburg-Germany c) growth differentiation factor-15 (GDF15): DuoSet ELISA R&D Systems,
Minneapolis, MN USA d) serum cytokines:
o Interleukin 1beta (IL-1く): IBL Hamburg-Germany o Interleukin 6 (IL-6): Milenia Biotec GmbH Gieben-Germany o Interleukin 4 (IL-4): IBL Hamburg-Germany o Interleukin 10 (IL-10): IBL Hamburg-Germany o Interleukin 13 (IL-13): IBL Hamburg-Germany o Gamma-Interferon (けIFN): IBL Hamburg-Germany o Tumor Necrosis Factor-alpha (TNF-g): Milenia Biotec GmbH
Gieben-Germany
3.3.3 Hepcidin and pro-hepcidin measurements
3.3.3.1 Time-Of-Flight Mass Spectrometry quantitative hepcidin assays Serum hepcidin was measured by Surface-Enhanced Laser Desorption/Ionization Time-Of-Flight Mass Spectrometry (SELDI-TOF MS), using a synthetic hepcidin analogue (Hepdicin-24, Peptides International, Louisville, KY) as an internal standard, as previously described [83], with recent technical advances [84].
Figure 10 – SELDI-TOF MF profile of hepcidin-25 is indicated by arrows, The isoforms hepcidin-20 and hepcidin-24 are also indicated
(Modified from Campostrini et al. [84]) 3.3.3.2 Immunochemical hepcidin assays Of the currently available commercial immunochemical research kits for serum hepcidin, bioactive hepcidin kit of DRG Instruments (purchased October 2009; DRG Marburg-Germany) has been used to test serum patients’ samples, according to manufacturer's indications.
3.3.3.3 Immunochemical pro-hepcidin assays According to manufacturer’s indications, the commercial kit of Hepcidin Prohormone ELISA (DRG Marburg-Germany) has been used to test serum patients’ samples.
3.3.4 Interleukin-6 Receptor expression on monocytes
Aliquots of patients’ whole venous blood collected into EDTA-tubes were immediately addressed for IL-6 receptor quantification by flow cytometry. Expression of gp130 and CD126 on membrane of cells CD14+ were evaluated.
3.3.4.1 Monoclonal Antibodies The following monoclonal antibodies (mAbs) were used for detection of cell surface markers:
IL-6Rg chain: anti-human phycoerythrin (PE) labeled mAb CD126 (Becton Dickinson, San Jose, CA).
IL-6Rく chain: anti-human fluorescein-isothiocyanate (FITC) labeled mAb gp130 (Diaclone, Besancon, France). In the second protocol for T1-T8 analysis, membrane gp130 expression was analysed with mAbs FITC-labeled by Thermo Scientific (Waltham, MA, USA), obtained by the same cells of the previous one and with the same isotype: clone B-R3, mouse, isotype IgG2a.
3.3.4.2 Immunophenotyping Samples of 50 たl of whole blood were distributed into test tubes and incubated with or without the selected monoclonal antibodies. Erythrocytes and platelets were selectively lysed by 2mL of BD FACSLysis (Becton Dickinson), then centrifuged at 1500rpm for 10min at 4°C, one step wash with buffer Ca2+ and Mg2+ free phosphate buffered saline (PBS) and finally suspended in 0.5 ml cold phosphate buffered saline and promptly analysed.
3.3.4.3 Flow cytometric analysis Three-color flow cytometric analysis was performed on on a FACSCAN cytofluorometer (Becton Dickinson, San Jose, CA). Data were acquired using CELL-Quest software (Becton Dickinson) on Mac OS 9.2. Analysis gate was set according to side-scatter (SSC-H) versus forward-scatter (FSC-H) acquiring 1 500 total events in the gate of monocytes. CD126, gp130 and CD14+ values are expressed as percentage of positive cells, mean fluorescence intensity (MFI) and geometrical means have been used for comparison.
3.3.5 Isolation of peripheral blood monocytes
Whole blood from patients was sampled into EDTA-containing tubes on first day (T1) and eighth day (T8) of admission. Circulating monocytes CD14+ were negative isolated from whole blood samples by Dynal
® Untouched™ Human
Monocytes Negative Isolation Kit (Invitrogen™ Dynal® Invitrogen bead separations, Oslo, Norway). Isolation of peripheral blood mononuclear cells (PBMC) was carried out according to recommended sample preparation protocol (low platelets numbers).
3.3.5.1 Reagents - Density Gradient, Lymphoprep™ for MNC preparation (Ficoll-Paque™). - Depletion Dynabeads: Ca
2+ and Mg
2+ free phosphate buffered saline (PBS), pH
7.4, containing 0.1% bovine serum albumin (BSA) and 0.02% sodium azide (NaN3). - Dynal® Monocytes Isolation Kit (Invitrogen™ Dynal®, Oslo, Norway) Antibody Mix containing mouse IgG antibodies for CD2, CD17, CD16 (specific for CD16a and CD16b), CD19, CD56 and CD235a (Glycophorin A).
3.3.5.2 Methods Briefly, 14 ml EDTA-anticoagulation blood diluted 1:3 in isolation Ca
2+ and Mg
2+
free phosphate buffered saline (PBS) as underplayed over density gradient (Ficoll-Paque™), centrifuged at ββ00rpm for γ0min at β0°C. The PBMC layer was removed and washed twice with PBS supplemented with 0.1% BSA. Then, PBMC were incubated with the blocking reagent and antibody mix for 20min at 2-8°C, washed and incubated with beads (previously prepared) for 15min at 2-8°C. Hence the tube with PBMC and beads placed in the magnet for 3 min. Supernatants containing negative isolated CD14+ cells (untouched human monocytes) have been washed and aliquots of 500 x10
5 cell/µL stored at -80°C with QIAzol®.
3.3.6 RNA isolation and quantitative real-time polymerase chain reaction (qRT-PCR)
Determination of hepcidin (HAMP) mRNA expression in circulating monocytes CD14+ has been obtained after monocytes isolation (see above). Total cellular RNAs have been extracted from monocytes using a guanidinium-isothiocyanate-phenol-chloroform-based procedure [85]. One たl of extracted RNA has been analysed for concentration and purity on a NanoDrop ND-1000 (Thermo Scientific) spectrophotometer.
3.3.6.1 HAMP mRNA RT-PCR HAMP mRNA expression was evaluated by quantitative real-time PCR analysis using TaqMan technology. 0.γ5 たg of total RNA was reverse transcribed using the high-capacity cDNA archive kit according to the manufacturer's protocol (Applied Biosystems, Life Technologies Corporation) on Eppendorf Mastercycler Gradient (Eppendorf, Hamburg, Germany). Real time PCR (RT-PCR) was performed on ABI PRISM 7500 Real Time PCR System.Both beta-actin has been used as internal control gene. The assay ID of the target and endogenous genes was: く-actin: Hs99999903_m1. Hepcidin (HAMP) used primers and probes are: Forward Primer: 5’-GGCTCTGTTTTCCCACAACAG-γ’; Reverse Primer: 5’-AGCCGCAGCAGAAAATGC-γ’; HAMP-MGB-FAM-probe: 5’-CAGCTGGATGCCCAT-γ’. (Cod 4331182 – HAMP: HS00221783-m1) All experiments involving qRT-PCR were performed in duplicate, with two to three replicates each. The results of qRT-PCR were analyzed using SDS Software (Applied Biosystems, Life Technologies Corporation) that uses the 2
−〉〉Ct method
according to the formula 〉〉Ct=(CtMUT−CtENDO)−(CtCTRL−CtENDO). The formula was modified in order to calculate the fold of change between T1 and T8 as follows: 〉〉Ct=(CtT1−CtENDO)−(CtT8−CtENDO) [86].
3.4 Formulas
3.4.1 Transferrin saturation
The saturation of transferrin (ST%) with iron is an indicator of body iron stores, but also reflects the balance between reticuloendothelial iron release and bone marrow
ANEMIA of INFLAMMATION
M.Carrabba 21
uptake. Under normal conditions, about 30% of the transferrin (Tf) iron-binding sites are saturated. In humans, ST < 15% indicate iron deficiency, whereas ST > 45% are consistent with iron overload [38]. The saturation of transferrin with iron = Fe / (Tf x 1.25) x 100 where Fe is serum iron levels (mg/dL), Tf is transferrin expressed in mg/dL.
3.4.2 Ratio of soluble transferrin receptor to log ferritin
A determination of the levels of sTfR can be helpful for differentiation between patients with anemia of chronic disease alone (with either normal or high ferritin levels and low levels of sTfR) and patients with anemia of chronic disease with accompanying iron deficiency (with low ferritin levels and high levels of sTfR). A ratio of less than 1 suggests anemia of chronic disease, whereas a ratio of more than 2 suggests absolute iron deficiency coexisting with anemia of chronic disease (see table 1).
Ratio of soluble transferrin receptor to log ferritin = sTfR / logferritin
where sTfR is soluble transferrin receptor expressed in mcg/L and ferritin in mg/L
3.5 Statistical Analysis
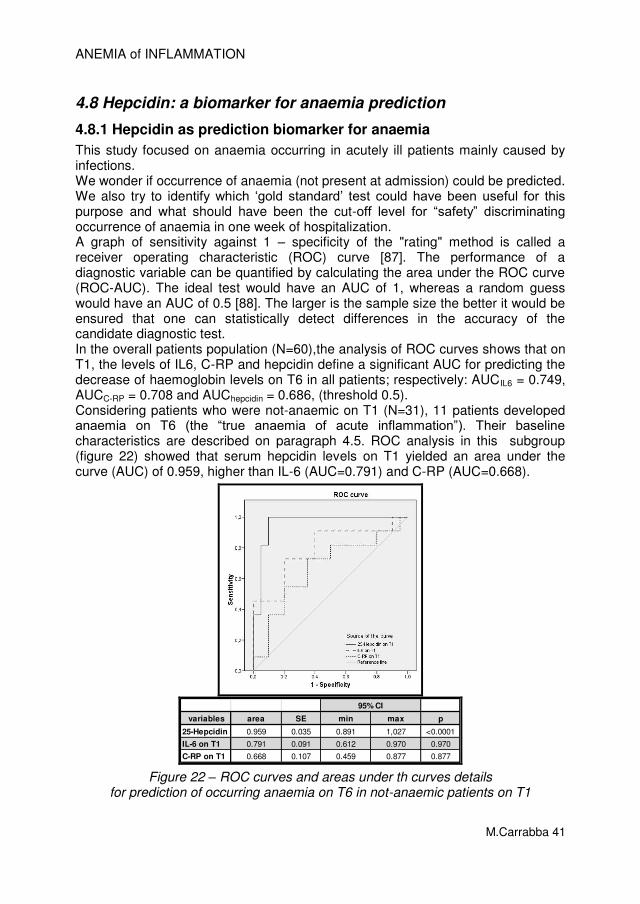
Descriptive statistics were computed resorting to the Statistical Package for Social Sciences, version 17 (SPSS, Chicago, IL, USA). Data are expressed as mean ± standard deviation of the mean for continuous variables and as numbers (percentages) for categorical variables. Paired observations over time were tested with paired t-test or Wilcoxon matched-pairs test and unpaired observations with t-test or a Mann-Whitney test if needed. As many of the continuous variables of interest, including cytokines, ferritin, GDF-15, and EPO, showed a non-Gaussian distribution, their values were log-transformed and plotted for the correlation analysis. Correlations between quantitative variables were assessed using Pearson's coefficient or Spearman’s one if needed. Analysis were firstly performed on whole patients population, then on comparison between subsets of patients according to differences in haemoglobin, inflammatory status or clinical stratification. In this thesis are shown data of patients who were: a) anaemic and not-anaemic on T1; b) with and without more than two SIRS criteria. Comparison have been performed between the two subgroups with unpaired tests and inside each subgroup with paired tests. In patients who were not-anaemic on T1, the discriminatory power of hepcidin, C-RP and IL-6 variable to predict anaemia on T6 was assessed by calculating the area under (AUC) each receiver operating characteristic (ROC) curve [87]. To determine the accuracy of hepcidin in predicting anaemia on T6, we estimated the sensitivity, specificity, positive and negative predictive values, and likelihood ratios for each possible cut-off. The Youden’s index, defined as (sensitivity + specificity) −1, was calculated at each cut-off. The cut-off point which showed the highest Youden’s index was considered the optimal cut-off value [88]. The two tailed significance level of all the analyses was set at p < 0.05.
ANEMIA of INFLAMMATION
M.Carrabba 22
4. RESULTS Results are presented in detached paragraphs to better show any relation between hepcidin, haemoglobin, iron, erythropoiesis and inflammation. Firstly, analysis was performed on overall patients population (N=60) for baseline characteristics and comparison between T1 versus T6 findings. Then, main findings about links between hepcidin and inflammation, hepcidin and iron, hepcidin and erythropoiesis are shown (paragraph 4.1 to 4.5). Secondly, analysis was performed after that patients had been subdivided according to having sepsis (paragraph 4.6) and having anaemia (paragraph 4.7) at admission. Results on the compared analysis of patients with and without sepsis are briefly summarised. Findings on the comparison between patients anaemic and non-anaemic at admission are extensively detailed. The analysis focused on differences between subgroups features on T1 and on T6, and on the modification between T1 and T6 findings in the same subgroup. Corollary of this analysis was the identification of hepcidin cut-off level for prediction of anaemia occurrence on T6 (paragraph 4.8). On paragraph 4.9 findings from the subset of patients analysed on 1
st and 8
th day
after admission and their peripheral blood isolated monocytes are described. Monocytes-derived hepcidin mRNA and its link with inflammation and iron parameters is showed.
4.1 Patients’ baseline: demographics and inflammatory causes
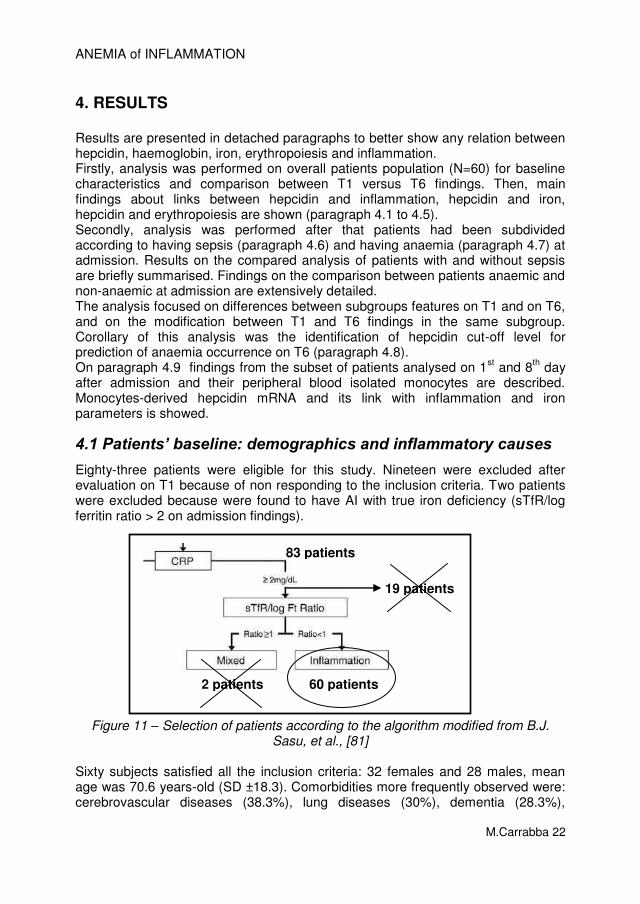
Eighty-three patients were eligible for this study. Nineteen were excluded after evaluation on T1 because of non responding to the inclusion criteria. Two patients were excluded because were found to have AI with true iron deficiency (sTfR/log ferritin ratio > 2 on admission findings).
Figure 11 – Selection of patients according to the algorithm modified from B.J. Sasu, et al., [81]
Sixty subjects satisfied all the inclusion criteria: 32 females and 28 males, mean age was 70.6 years-old (SD ±18.3). Comorbidities more frequently observed were: cerebrovascular diseases (38.3%), lung diseases (30%), dementia (28.3%),
83 patients
19 patients
60 patients 2 patients
ANEMIA of INFLAMMATION
M.Carrabba 23
diabetes (20%), cardiovascular diseases such as previous myocardial infarction (18.3%), previous congestive heart failure (11.7%), congestive heart failure at admission (10%). Table β details patients’ baseline and characteristics at hospital admission.
BASELINE Mean SD
age at admission 70,62 18,30
lenght-of-hospital stay 14,17 8,83
referred days of inflammation before admission 6,12 7,70
N %
male 28 46,7temperature ≥ 37.5°C before admission 29 55,8
hospitalization in the previous 6 months 14 23,3iron therapy in the previous 30 days 2 3,4
alcohol abuse 3 5,1immunocompetent 55 91,7
COMORBIDITIESStd.
Deviation
autoimmune disease 3 5,0cancer 9 15,0
methastatic cancer 2 5,6cardiovascular diseases 31 51,7
only hypertension 21 35,0past acute myocardial infarction 11 18,3
past congestive heart failure 7 11,7congestive heasrt failure at admission 6 10,0
lung diseases 18 30,0chronic liver diseases 4 6,7
chronic kidney diseases 6 10,0diabetes 12 20,0
cerebrovascular diseases 23 38,3dementia 17 28,3
Table 2 – Patients’ baseline characteristics and comorbidities
All patients received antibiotic treatment within 24h from admission and before blood sample obtained. More representative causes of acute inflammation were (some causes overlap): pneumonia (45%), urinary tract infection (21.7%), exacerbation of COPD (11.7%), bacteraemia (10%), Cancer never treated (6.7%). More than two criteria of Systemic Inflammatory Response Syndrome (SIRS) were recognised in 55% (N=33) of subjects (table 3). Sepsis is diagnosed when a patient meets SIRS criteria and has a documented or suspected source of infection. Hence, 51.7% (N=31) patients could be considered as having sepsis.
Table 3 – Patients’ characterization according to SIRS criteria
ANEMIA of INFLAMMATION
M.Carrabba 24
The main cause of acute inflammation was acute infections. Identified sites of infections were: lungs (63.3%), urinary tract (21.7%), skin (10%), gut (3.3%) as table 4 shows. Microbiologic investigations were performed in 58 of 60 patients. Aetiology was identified in 41.4% of cases: E. Coli accounts for 29.2%, Enterococcus spp. for 20.8%, Staphylococcus aureus for 12.5%.
ACUTE INFLAMMATORY CAUSES N %
CANCER 4* 6,7
AUTOIMMUNE DISEASE 1 1,7
ACUTE INFECTIONS 57 95,0
SITE OF INFECTIONS° N %
blood culture positive infection 6 10,0
lungs 38 63,3
urinary tract 13 21,7
skin/bone 6 10,0
gut 2 3,3
* 2 overlap with infections
° two or more overlapping
Table 4 – Causes of acute inflammation on admission identified during hospitalization
4.2 Patients’ baseline: blood tests and serum cytokines
4.2.1 Whole blood tests, iron and inflammatory parameters
On first day of hospitalisation (T1), haemoglobin (Hb) mean level was 12.4g/dL (SD ±1.6). On T6, it was 11.9 g/dL (SD ±1.5; p<0.001). Also red blood cells count and haematocrit showed the same trend in the comparison between T1 and T6 (table 5). On T6, 37 patients were found to be anaemic (overall mean Hb level 11.6 g/dl; SD ±1.3) according to WHO definition [74]. Considering inflammatory indices, C-Reactive protein (C-RP) mean serum levels on T1 were higher (13.3 mg/dl; SD ±1.3) than on T6 (5.3 mg/dl; SD ±5.0; p<0.0001). Alpha1-glicoprotein showed the same trend and erythrocytes sedimentation rate decreased not significantly because usually it takes more than 6-days to return to normal levels. The mean of white blood cells count on T1 was abnormal as it is in case of acute inflammation and returned to normal levels on T6 (T1: 10.18 10*3cells/µL; SD ±4.40 versus T6: 8.69 10*3cells/µL; SD ±3.89; p=0.003). Also platelets count had the same T1-T6 trend (p<0.0001), as table 5 shows. On T1, the mean serum iron levels of all the 60 patients were low (31.6mcg/dL; SD ±19.2) and normalised on T6 (46mcg/dL; SD ±24.9; T6vsT1p<0.001). Elevated serum ferritin levels on T1, were still elevated on T6. All the serum iron parameters and inflammatory indices on T1 are showed on table 5. They were consistent with the definition of AI widely described in literature. During the 6-days course, none of the patients developed iron deficiency anaemia based on sTfR-ratio findings on T6 (T1 mean ratio 0.64; SD ±0.30; T6 mean ratio
ANEMIA of INFLAMMATION
M.Carrabba 25
0.53 SD ±0.33). In particular, the sTfR-ratio mean findings < 0.7 on T1 and on T6 confirmed that any case of iron-deficiency have been excluded and confirmed that all patients had “pure” acute inflammation.
VARIABLES on T 1 VARIABLES on T 6
COMPLETE BLOOD CELLS COUNT N Min. Max. Mean SD Min. Max. Mean SD p
Table 5 – Complete blood cells count, serum iron parameters and serum inflammation markers on T1 and T6
4.2.2 Serum cytokines profiling
Table 6 shows serum cytokines profiling on T1 and T6 and comparison. Among pro-inflammatory cytokines, IL-6 was the highest on T1 (69.58 pg/mL; SD ±60.28), as expected in acute inflammation, and significantly decreased on T6 (45.93 pg/mL; SD ±30.07; p=0.002), after that antibiotics treatment solved infection. IL-1, alpha-TNF and IL-1γ didn’t show significant changes between T1 and T6 in the overall patients. Anti-inflammatory cytokines levels didn’t change between T1 and T6, except than mean levels of gamma-IFN that decreased on T6 (p=0.028). This findings seems to correlate better to erythropoietin increase than to IL6 decrease. Gamma-IFN, as described elsewhere [89], seems to have a negative role in regulating erythropoietin activity, indeed erythropoietin had higher levels on T6 (31.04 pg/mL; SD ±19.78) than on T1 (25.16 pg/mL; SD ±21.00; p=0.017).
ANEMIA of INFLAMMATION
M.Carrabba 26
CYTOKINES VARIABLES on T 1 VARIABLES on T 6Pro-inflammatory N Min. Max. Mean SD Min. Max. Mean SD p
Table 6 – Serum cytokines profiling on T1 and T6, erythropoietic factors and serum hepcidin levels
4.2.3 Hepcidin and pro-Hepcidin
4.2.3.1 Hepcidin The quantification of hepcidin has been found to be complicated by its tendency to aggregate [90] and to stick to laboratory plastics, necessitating implementation of robust laboratory procedures. Reliable assays to measure hepcidin in blood and urine by use of immunochemical and mass spectrometry methods have been developed. We found that serum 25-hepcidin mean levels in all 60 patients measured by SELDI-TOF MS on T1 (23.04 nM/L; SD ±15.46) were higher than on T6 (12.35 nM/L; SD ±9.84; p<0.0001) and the comparison between T1 and T6 serum values were significantly different (p<0.0001). The 25-hepcidin serum mean levels on both T1 and T6 are over the cut-off established by van Santen et al. in RA patients with anaemia of chronic inflammation [80]. Moreover we found that our results are very close with the findings obtained by van Eijk et al. in patients with sepsis [81], even though we did not found correlation between the number of SIRS criteria met and the hepcidin levels (see paragraph 4.6).
4.2.3.2 Reference interval for serum 25-hepcidin The hepcidin values obtained in the patients on T1 could be considered high, if compared with a group of 54 healthy individuals (61.1% males) with rigorous definition of normal iron status [83,91], whose serum hepcidin-25 mean levels was 4.20 nM/L (range 3.53-5.00) measured with MS in the same laboratory performing this study (see chapter 3.3.3.1, Campostrini et al [84]). However, considerable inter-individual variation in hepcidin concentrations have been found also in healthy controls and, like other hormones, it should be interpreted in the context of other indices of iron metabolism. To date, differences in hepcidin concentrations between the sexes have not been consistently found [70].
ANEMIA of INFLAMMATION
M.Carrabba 27
4.2.3.3 Comparison between serum 25-hepcidin detection by SELDI-TOF MS versus EIA methods Measurement by bioactive hepcidin kit of DRG Instruments (purchased October 2009) on a sample of 30 patients also showed that serum T1 mean levels (8.40 ng/mL; SD ±2.16) were higher than T6 mean levels (5.53 ng/mL; SD ±2.55; p<0.0001). However, we found negative correlation between serum hepcidin values obtained by MS and by EIA methods on T1 (r = -0,475: p=0.007) and there was no correlation at all between the values on T6 (R = -0.210, p=0.265) and the inverted correlation trend was confirmed (see figure 11). Moreover, no significant correlations were found for both serum hepcidin levels on T1 and on T6 detected with EIA and the respective serum levels of IL-6. Furthermore on T1 there was an inverted correlation that is the opposite of the findings on serum 25-hepcidin detected with SELDI-TOF MS. Indeed, a positive correlation between hepcidin and IL-6 should be found, as previously described (see chapter 1), and it was found only with the serum 25-hepcidin measured with MS (see next paragraphs). Because of the discrepancy between the two dosages and the lack in correlation with IL-6 serum levels we abandoned EIA method and considered only hepcidin-25 serum levels obtained by SELDI-TOF MS.
Figure 11 – Correlation between serum 25-hepcidin detected by SELDI-TOF MS (Y axis) and EIA (X axis).
Other investigators found similar discrepancy in the comparison of different commercial immunochemical research kits for serum hepcidin methods to the DRG Instruments EIA [70]. One cause could be the difficulty in generating specific anti-hepcidin antibodies because of the small and compact structure of hepcidin, which leaves scarce antigenic epitopes (figure 1), associated with the high degree of conservation of hepcidin among a wide range of species, which diminishes the elicitation of an immune response. Recently, substantial progress has been made in the methodologies in order to obtain reliable hepcidin assays, also with ELISA methods [70,92].
ANEMIA of INFLAMMATION
M.Carrabba 28
4.2.3.4 Pro-hepcidin Pro-hepcidin mean serum levels had no change on T1 and on T6 (sample of 30 patients). Pro-hepcidin serum levels were unrelated to patients’ haemoglobin, iron or inflammatory status and cytokines patterns. Because of these results, the relationship between hepcidin-25 serum concentration measured using a SELDI-TOF MS method and pro-hepcidin measured by the DRG ELISA was explored. Only correlation between on T1 was significant (r = 0.415, p=0.028). No other correlations were observed between their concentrations in agreement with analysis in other patients’ populations (γβ,79,9γ).
Figure 12 – Correlation between serum 25-hepcidin (detected by MS) and serum pro-hepcidin (EIA).
Sasu et al. [79] largely investigated the causes of these incongruent results between serum levels of pro-hepcidin measured by DRG kit and hepcidin-25 serum levels. They hypothesised that pro-hepcidin was degraded or masked in the presence of serum. An experiment using antibody against mature hepcidin capable of detecting both hepcidin and pro-hepcidin by Western blot revealed that the presence of 10% of serum led to degradation of pro-hepcidin to form hepcidin. The Authors suggest that the unstable nature of pro-hepcidin in the serum could be probably due to the enzymatic activity of a serum protein that has not yet been identified. Pro-hepcidin proved to be an unstable analyte in serum, then storage and handling of samples could cause significant variability in its analysis. Therefore, also out of the poor results in the first sample of 30 patients, we decided not to test it further in this study.
ANEMIA of INFLAMMATION
M.Carrabba 29
4.3 Serum hepcidin and serum cytokines
IL-6 was highest on T1 (69.58 pg/ml; SD ±60.28), and decreased on T6 (45.93 pg/ml; SD ±30.07; p=0.002). A similar pattern was observed for hepcidin levels, being highest on T1 (23.04 nM/L; SD ±15.46) and declining to 12.35 nM/L (SD ±9.84; p<0.0001) on T6. IL-6 levels correlated significantly with hepcidin levels on T1 and on T6 (r = 0.26, p = 0.05; r = 0.45, p< 0.0001, respectively). Figure 13 shows the plots of the relationships on T1 between hepcidin-25 serum levels and IL-6 (upper left), IL-10 (upper right), alpha-TNF (lower left) and gamma-IFN (lower right). Correlation trend line and R-square values are also showed. As previously described in cellular model ex vivo [28], hepcidin-25 serum levels increase according to IL-6 serum levels increase but not with alpha-TNF and gamma-IFN variations.
Figure 13 – On T1 correlation between serum 25-hepcidin and IL-6, IL-10, alpha-TNF and gamma-TNF
Figure 14 shows the correlation plots on T6 between hepcidin-25 serum levels and IL-6 (upper left), IL-10 (upper right), alpha-TNF (lower left) and gamma-IFN (lower right). On both T1 and T6 correlation trend between these cytokines and hepcidin is the same of the ones observed on T1.
ANEMIA of INFLAMMATION
M.Carrabba 30
Figure 14 – On T6 correlation between serum 25-hepcidin and IL-6, IL-10, alpha-TNF and gamma-TNF
4.4 Serum hepcidin, haemoglobin, iron, erythropoiesis and inflammation
4.4.1 Hepcidin, haemoglobin and ferritin
In the overall 60 patients, the relationship between serum hepcidin-25 levels and haemoglobin levels on both T1 and T6 showed that the higher was the hepcidin the lowest the haemoglobin, even though there was no statistical significance because of the dispersion of the data (figure 15, upper plots). We investigated also if the amount of hepcidin on T1, when the inflammation was higher, had an influence on haemoglobin levels on T6 (figure 15, lower left). We found that the correlation was markedly negative, but not statistical significant (r= -0.256; p=0.051). However, hepcidin levels on T1 did not correlate with the percentage of decrease of haemoglobin in the six-day course of observation (r = -0.079; p=0.553).
ANEMIA of INFLAMMATION
M.Carrabba 31
Figure 15 – Correlation between serum 25-hepcidin and haemoglobin levels on T1 and T6
As expected, on both T1 and T6 hepcidin serum levels positive correlated with ferritin serum levels (figure 16), especially on T6 (correlation with serum log ferritin on T6 r=0.522; p<0.001). Serum ferritin is primarily produced by macrophages [94] and it could be hypotised that the persistence of inflammation increased macrophages activation and iron stores (under hepcidin influence), hence higher ferritin levels associated with high hepcidin levels were more evident on T6 evaluation.
Figure 16 – Correlation between serum 25-hepcidin and serum ferritin (log)
on T1 and on T6
ANEMIA of INFLAMMATION
M.Carrabba 32
4.4.2 Hepcidin, haemoglobin and erythropoietin
Erythropoietin (EPO) had an inverse correlation with haemoglobin levels on both T1 and T6 (figure 17, plots C and D), and the negative correlation was more significant between EPO levels on T1 with haemoglobin levels on T6 (r=-0.532; p<0.0001) showed in figure 17 (plot E). The relationship between EPO and Hb showed that patients anaemic on T1 and still anaemic on T6 manteined high EPO levels. Eventhough these patients’ Hb levels were still low on T6, it may be hypothesised that they had an increased erythropoietic activity out of the positive correlations between: EPO and percentage of retyculocytes on both T1 (r=0,489; p<0.001) and T6 (r=0.367; p=0.004); EPO on T1 and percentage of retyculocytes on T6 (r=0.539; p<0.0001); EPO and RDW on T6 (r=0.304; p=0.018). Also sTfR on T6 had positive correlation with EPO on T6 (r=0.263; p=0.042), as well as EPO and alpha1-antitripsin on T6 (r=0.386; p=0.002), confirming this hypothesis. No significant correlations were found between EPO and hepcidin, even though on T1, high values of EPO have been observed in patients with high values of hepcidin, that could be explained as a suppressor signal as high values of EPO persist on T6 while hepcidin values becamed lower (figure 17, plots A and B).
Figure 17 – Correlation between serum 25-hepcidin, haemoglobin
and serum EPO (log) on T1 and on T6
A B
C D
E F
ANEMIA of INFLAMMATION
M.Carrabba 33
4.4.3 Hepcidin, erythropoietin and GDF-15
The role of GDF-15 as possible inhibitor of hepcidin in patients without haematological diseases has been debated [95]. The relationships between their serum levels were also explored. We found a positive correlation between hepcidin values on both T1 and T6 (figure 18, upper plots). Also EPO and GDF-15 correlated positively both on T1 and T6. Data by Ramirez et al in 2009 [96] supported the concept that apoptotic erythroblasts produce GDF15, and that GDF15 contributes to extra-erythroid tissue iron loading due to ineffective erythropoiesis. Our results suggest that GDF15 is a marker of ineffective erythropoiesis which occur also in the AI of acute ill patients setting. Kanda et al. in 2008 performed an in vivo physiological study of the relationship between GDF15, serum hepcidin, and erythropoiesis in the clinical setting of stem cell transplantation (SCT) [97]. After SCT, after recovery, serum hepcidin levels showed a significant inverse correlation with markers of erythropoietic activity, such as the sTfR and the reticulocyte counts, but not GDF15 levels. Our patients’ bone marrow was under erythropoietic pressure (not yet effective), therefore, our findings seems to corroborate the hypothesis that the persistence of GDF-15 high levels contributes to hepcidin suppression in the pathological setting of ineffective erythropoiesis as originally proposed [59].
Figure 18 – Correlation between serum 25-hepcidin, GDF-15 (log) and serum EPO (log) on T1 and on T6
ANEMIA of INFLAMMATION
M.Carrabba 34
4.4.4 Hepcidin and serum inflammatory markers
Correlation between hepcidin serum levels was strengthened on T6 than on T1 (figure 19). Correlation between C-RP and hepcidin on T6 were high significant (r=0.495; p<0.0001), as expected. C-RP levels on T6 dropt down to low levels, while the other three inflammation markers (ESR, alpha-1 acid glycoprotein, haptoglobin) remained high with a width distribution, although the positive correlation trend was maintained.
Figure 19 – Correlation between serum 25-hepcidin and serum inflammation markers on T1 and on T6
ANEMIA of INFLAMMATION
M.Carrabba 35
4.5 Patients’ outcomes on T6 Considering the outcome on T6 of the patients population analysed in this study, we found that:
a- 26 patients anaemic on T1 were still anaemic on T6 (group A) b- 20 patients not anaemic on T1 were still not anaemic on T6 (group B) c- 11 patients not anaemic on T1 became anaemic on T6 (group C) d- 3 patients on T1 improved and recovered anaemia on T6 (group D)
No patients died during the six-days course of the study nor during all the hospital long-of-stay. Considering the demographic an clinical characteristics on admission of the patients in group A, their mean age was 75.9 years (SD ±11.3), they met a median of 2 SIRS criteria. The underlying causes of acute inflammation recognised during hospitalization were septicaemia (N=2), pneumonia (N=15), urinary tract infection (N=7), cancer new diagnosed (N=3) and autoimmune disease new diagnosed (N=1). The group B findings were slightly different. Mean age 61.5 years old (SD ±24.4), the median of SIRS criteria met was 1, the underlying causes of acute inflammation recognised during hospitalization were septicaemia (N=1), pneumonia (N=6), urinary tract infection (N=2), other unknown cause of acute infection (solved on discharge). The group C patients mean age was 76.3 (SD ±8.2). SIRS mean criteria met was 1.6. Ten patients were affected by acute infections: pneumonia and septicaemia (N=1), pneumonia (N=2), pneumonia and urinary tract infection (N=3), urinary tract infection (N=1), gut infection (N=2). One patients was diagnosed for pleural effusion without bacterial infection nor cancer evidence, although he had a previous history of prostatic cancer. The latter group had mild acute inflammatory diseases, according to the number of SIRS criteria met.
ANEMIA of INFLAMMATION
M.Carrabba 36
4.6 Patients and acute inflammation
Considering features at admission, patients were stratified according to SIRS criteria and causes of inflammation. Patients who met at least 2 SIRS criteria with an identified cause or site of infection were diagnosed for sepsis.
Among the 60 patients enrolled, 31 patients were found to have sepsis. The comparison of patients with and without sepsis showed significant differences just for IL-6, C-RP, white blood cells count and RDW. Haemoglobin mean levels did not differed nor on T1 (sepsis: 12.2 g/dL; SD ±1.5; non-sepsis: 12.6 g/dL; SD ±1.6) neither on T6 (sepsis: 11.7 g/dL; SD ±1.6; non-sepsis: 12.2 g/dL; SD ±1.5). Also hepcidin mean levels on T1 were not different between the two groups (sepsis: 23.0 nM/L; SD ±15.9; non-sepsis: 22.8 nM/L; SD ±16.5). Although differences in the intensity of the inflammatory response, and consequently in SIRS criteria, the two subgroups did not show significant differences for any other parameters. These findings corroborate the fact that we investigated a homogeneous population, restrictively selected at admission. Indeed all the patients except 5 had an acute infection underlying their acute inflammation; hence the similarity between the two subgroups could be explained out of the bias on admission selection.
Unlike Eijk et al. [81], we did not found any clear relationship between the mean levels of serum hepcidin and the number of SIRS criteria nor in the whole patients population, neither in the sepsis subgroups (figure 20 below). Probably, the low number of patients in the sepsis subgroup (and especially with more than 3 criteria) could be one of the explanations of the lack of increasing hepcidin levels according to SIRS criteria met.
Figure 20 – Hepcidin levels distribution according to SIRS criteria met in the whole patients population (on the left) and in the sepsis subgroups (on the right)
ANEMIA of INFLAMMATION
M.Carrabba 37
4.7 Acute inflammation and anaemia
4.7.1 Anaemic and not-anaemic patients at admission
On T6, 37 patients were found to be anaemic (overall mean Hb level 11.6 g/dl; SD ±1.3) according to the WHO criteria (Hb ≤ 1β g/dL for female and ≤ 1γ for male) [74] . Analysing data in order to found similarities and subsets of patients, we firstly focused on Hb levels. On the basis of Hb levels on T1, two groups of 29 and 31 patients each (named “anaemic” and “not-anaemic” respectively) have been identified. The group of patients defined as “anaemic” on T1 (Hb 11.1 g/dL; SD ±0.95) did not have changes in Hb mean levels on T6 (Hb 10.9 g/dL; SD ±1.14). In the 31 patients defined as “not-anaemic”, Hb mean level on T1 was 1γ.6 g/dL (SD ±0.94) and a 0.7mg/dL decreased on T6 was observed (p<0.0001). Hepcidin mean level (as well as IL-6 levels) was higher in the anaemic group on T1 than in the not anaemic, and in both groups it decreases on T6.
ON T1
COMPLETE BLOOD CELLS COUNT N Minimum Maximum Mean SD N Minimum Maximum Mean SD p
Table 7 – Comparison between anaemic and not-anameic patients’ findings on T1
As shown on table 7, on T1 the two groups were not different for serum iron parameters nor for serum inflammation markers, except ESR, which was higher in the anaemic group. On the contrary on T6 (table 8), the two groups had slight differences for both iron and inflammation parameters. In particular, anaemic patients were found to have still higher long-standing inflammation markers (as ESR and alpha1-acid glycoprotein) while C-RP tapered down, meaning that other mechanisms concurred to the maintenance of inflammation.
ANEMIA of INFLAMMATION
M.Carrabba 38
ON T6
COMPLETE BLOOD CELLS COUNT N Minimum Maximum Mean SD N Minimum Maximum Mean SD p
Table 8 – Comparison between anaemic and not-anaemic patients’ findings on T6
Cytokines profiling of the two groups on T1 and T6 is showed and compared in table 9 and 10. No differences between the two groups in the comparison of pro and anti-inflammatory cytokines on both T1 and T2 were found. However, EPO was high on T1 in the anaemic group and still remained high on T6. No differences were observed in the comparison of hepcidin mean serum levels.
CYTOKINES ON T1
Pro-inflammatory N Minimum Maximum Mean SD N Minimum Maximum Mean SD p
Table 10 – Comparison between anaemic and not-anameic patients’ cytokines profiling on T6
ANEMIA of INFLAMMATION
M.Carrabba 39
Comparison inside the subgroups of patients between findings on T1 and on T6 is represented in figure 21. In the anaemic group there was no significant differences for haemoglobin mean levels that remained low also on T6. Also both the erythropoietic modulating agents EPO and GDF-15 had no significant differences in the mean levels on T1-T6 comparison. Despite the not significant modification of IL-6 values, C-RP serum levels were very low on T6 compared to the levels on T1 (p<0.001). Hepcidin serum levels agreed more with C-RP serum levels than with IL-6, and they significantly reduced on T6 (p=0.002). As consequence, serum iron levels increased on T6 and were higher than on T1 (p=0.007) as well as transferrin saturation (p=0.014). Even though serum ferritin levels greatly reduced on T6, the comparison of mean levels was no significant. In the not-anaemic group, both C-RP and IL-6 consensually decreased on T6 and were much lower than on T1 (p<0.001 and p=0.002, respectively) as well as hepcidin serum levels (p<0.001). Serum iron levels and transferrin saturation significantly increased on T6 (p<0.001 and p<0.001, respectively). No substantial changes were observed in ferritin levels. On the contrary, haemoglobin levels decreased on T6, as well as haematocrit and red blood cells count (no change in RDW, MCH or MCHC). The mean levels were lower on T6 than on T1 (p<0.001), and 11 patients became anaemic.
ANEMIA of INFLAMMATION
M.Carrabba 40
Figure 21 – Comparison between T1 and T6 in anaemic and not-anameic patients
ANEMIA of INFLAMMATION
M.Carrabba 41
4.8 Hepcidin: a biomarker for anaemia prediction
4.8.1 Hepcidin as prediction biomarker for anaemia
This study focused on anaemia occurring in acutely ill patients mainly caused by infections. We wonder if occurrence of anaemia (not present at admission) could be predicted. We also try to identify which ‘gold standard’ test could have been useful for this purpose and what should have been the cut-off level for “safety” discriminating occurrence of anaemia in one week of hospitalization. A graph of sensitivity against 1 – specificity of the "rating" method is called a receiver operating characteristic (ROC) curve [87]. The performance of a diagnostic variable can be quantified by calculating the area under the ROC curve (ROC-AUC). The ideal test would have an AUC of 1, whereas a random guess would have an AUC of 0.5 [88]. The larger is the sample size the better it would be ensured that one can statistically detect differences in the accuracy of the candidate diagnostic test. In the overall patients population (N=60),the analysis of ROC curves shows that on T1, the levels of IL6, C-RP and hepcidin define a significant AUC for predicting the decrease of haemoglobin levels on T6 in all patients; respectively: AUCIL6 = 0.749, AUCC-RP = 0.708 and AUChepcidin = 0.686, (threshold 0.5). Considering patients who were not-anaemic on T1 (N=31), 11 patients developed anaemia on T6 (the “true anaemia of acute inflammation”). Their baseline characteristics are described on paragraph 4.5. ROC analysis in this subgroup (figure 22) showed that serum hepcidin levels on T1 yielded an area under the curve (AUC) of 0.959, higher than IL-6 (AUC=0.791) and C-RP (AUC=0.668).
variables area SE min max p
25-Hepcidin 0.959 0.035 0.891 1,027 <0.0001
IL-6 on T1 0.791 0.091 0.612 0.970 0.970
C-RP on T1 0.668 0.107 0.459 0.877 0.877
95% CI
Figure 22 – ROC curves and areas under th curves details for prediction of occurring anaemia on T6 in not-anaemic patients on T1
ANEMIA of INFLAMMATION
M.Carrabba 42
When a concentration threshold of serum hepcidin levels ≥ βγ nM/L was considered, hepcidin yielded 100% sensitivity and 90% specificity for predicting the occurrence of anaemia on T6 (in those patients not-anaemic at admission). This cut-off value got a Younden’s index of 0.9 (maximum value can attain is 1, when the test is perfect, and the minimum value is 0, when the test has no diagnostic value) [88].
If a concentration of 5 nM/L of serum 25-hepcidin could be considered the upper normal levels in healthy controls [84,91] and 7.6 nM/L the cut-off limit for discriminating anaemia of chronic disease in AR patients [80], hepcidin concentration of 23 nM/L could be the optimal cut-off to identify subjects with acute inflammation (C-RP at least 3 mg/dL) who have an elevated probability to became anaemic after at least one week of illness if they are not anaemic at the beginning of inflammation.
Figure 23 – Anaemic and not-anaemic patients on T6 and distribution according to hepcidin levels on T1.
Hepcidin serum level cut-off of 23 nM/L, identified by ROC curve analysis for predction of anaemia, correctly identified 23 out of 37 patients anaemic on T6
In the overall patients population (N=60), the proposed hepcidin cut-off level of 23 nM/L on T1 correctly identified 23 of the 37 anaemic patients on T6. It failed only in identifying 5 out of 23 not-anaemic patients on T6 (figure 23). Notably, this cut-off levels was identified in the group of not-anaemic patients on T1 who developed anaemia on T6, hence we think that it should be advised only in patients without anaemia at admission. Further evaluation in wider population with acute inflammation/infections is needed in order to validate this proposed discriminatory value for developing anaemia after one-week course, despite promptly antibiotic and anti-inflammatory therapies.
ANEMIA of INFLAMMATION
M.Carrabba 43
4.9 Acutely ill patients and monocytes expression of hepcidin
Analysis on whole patients population has been performed firstly, then analysis on comparison between anaemic and not-anaemic patients on T8 was conducted and briefly resumed. Results on peripheral blood isolated monocytes from a sample of eight patients with acute infections are showed.
4.9.1 Patients’ baseline: demographics and inflammatory causes Among 29 eligible patients enrolled for investigation on T1 and T8, twelve patients were excluded because did not complete the study for several causes (5 did not meet admission criteria after T1 evaluation; 1 was transfused on day 5; 4 were discharged before T8; 1 refused to participate to the study after T1; 1 was diagnosed for aggressive non-Hodgkin lymphoma after T1). Seventeen subjects satisfied all the inclusion criteria: 7 females and 10 males, mean age was 63.1 years-old (SD ±22.3). The comorbidities more frequently observed were: cardiovascular diseases such as hypertension (52.9%) and past acute myocardial infarction (29.4%), cerebrovascular diseases (23.5%), lung diseases (11.8%) and dementia (11.8%). Table 11 details patients’ baseline and characteristics at hospital admission.
BASELINE Mean SD
age at admission 63,12 22,34
lenght-of-hospital stay 10,24 7,69
referred days of inflammation before
admission3,41 2,48
N %
male 10 58,8
temperature ≥ 37.5°C before admission 12 70,6
immunocompetent 17 100,0
COMORBIDITIES
Std.
Deviation
cardiovascular diseases 8 47,1
only hypertension 9 52,9
past acute myocardial infarction 5 29,4
past congestive heart failure 1 5,9
lung diseases 2 11,8
chronic liver diseases 1 5,9
chronic kidney diseases 1 5,9
diabetes 1 5,9
cerebrovascular diseases 4 23,5
dementia 2 11,8 Table 11 – Patients’ baseline on admission
All patients received antibiotic treatment within 24h from admission and before blood sample obtained. All the causes of inflammation were acute infection (table 12) involving (some cases overlap), lungs infections accounted for the highest site of identified infection (58.8%).
ANEMIA of INFLAMMATION
M.Carrabba 44
ACUTE INFLAMMATORY CAUSES N %
ACUTE INFECTIONS 17 100,0
SITE OF INFECTIONS* N %
blood culture positive infection 1 5,9
lungs 10 58,8
upper airways 3 17,6
gut 3 17,6
urinary tract 2 11,8
* tw o or more overlapping Table 12 – Patients’ cause of acute inflammation
More than two criteria of Systemic Inflammatory Response Syndrome (SIRS) were recognised in 23.5% of subjects (table 13), all of them had pneumonia, hence they were considered as having sepsis.
SIRS criteriaN
%
Fever ≥ 38°C 5 29,4
Heart rate ≥ 90 beats/min 1 5,9
Respiratory ≥ 20 breaths/min 7 41,2
White blood cell count >12,000/µL or < 4,000/µL 6 35,3 Table 12 – Patients’ SIRS criteria
4.9.2 Whole blood tests, iron and inflammatory parameters On first day of hospitalisation (T1), haemoglobin (Hb) mean level was 12.9 g/dL (SD ±1.4). On T8, it was 12.45 g/dL (SD ±1.44; p=0.223). No change in red blood cells count, haematocrit or RDW (table 13). Considering inflammatory indices, C-Reactive protein (C-RP) mean serum levels on T1 were higher (13.51 mg/dl; SD ±9.13) than on T8 (2.65 mg/dl; SD ±3.91; p<0.0001). On T1, serum iron levels were low and remained low on T8. Elevated serum ferritin levels on T1, were lower but still upper the normal maximal values on T8. Transferrin serum levels decreased on T8 relative to T1 (p=0.006), no significant change were observed in transferrin saturation, even though its range was wider (because of higher levels) than on T1 (see table 13 below).
VARIABLES on T 1 VARIABLES on T8
COMPLETE BLOOD CELLS COUNT Minimum Maximum Mean SD Minimum Maximum Mean SD p
As previously showed in paragraph 4.7.1, the17 patients were subdivided in two subgroups according to haemoglobin levels on T1. Figure 24 shows key results. Except than for haemoglobin (and haematocrit) levels, comparison of the means on T1 and T8 between the two subgroups showed no significant differences. On T1, seven patients were anaemic (mean Hb level 11.63 g/dL, SD ±0.78) and 10 not-anaemic (mean Hb level 13.79 g/dL, SD ±0.98; p<0.001). On T8, there were no differences between the two subgroups in mean Hb levels (anaemic 11.68 g/dL, SD ±1.72, not-anaemic 13.03 g/dL, SD ±0.93, respectively). Considering the outcome of the 10 patients not-anaemic on T1, 2 became anaemic on T8, while among the 7 anaemic patients on T1, 5 remained anaemic on T8. C-RP mean levels on T1 (anaemic 12.90 mg/dL, SD ±9.21, not-anaemic 13.93 mg/dL, SD ±9.54) dropt down to very low levels on T8 (anaemic 2.20 mg/dL, SD ±1.86, not-anaemic 3.04 mg/dL, SD ±5.22) in all patients of both groups (9 had normal levels), except than in one anaemic patient (on T1 2,9 mg/dl, on T8 3,6 mg/dL). Consensually ESR mean levels were lower on T8 that on T1, but they took longer to return to basal levels, as expected. Patients anaemic on T1 were found to have higher levels than patients not-anaemic. This finding is consistent with the hypothesis that patients with longstanding inflammation, without therapy, developed more frequently anaemia. Considering iron parameters on T1 and on T8, no significant differences were observed between mean levels of serum iron on T1 (anaemic 24.00 µg/dL, SD ±13.70, not-anaemic 31.70 µg/dL, SD ±16.70) and on T8 (anaemic 21.57 µg/dL, SD ±39.81, not-anaemic 34.90 µg/dL, SD ±37.85), transferrin saturation on T1 (anaemic 9.87%, SD ±5.24, not-anaemic 13.19%, SD ±5.87) and on T8 (anaemic 9.35%, SD ±15.56, not-anaemic 14.13%, SD ±14.79), and serum ferritin levels on T1 (anaemic 578.29 ng/dL, SD ±780.48, not-anaemic 402.10 ng/dL, SD ±203.04) and on T8 (anaemic 496.67 ng/dL, SD ±250.82, not-anaemic 345.00 ng/dL, SD ±186.15). Also comparisons of T1 versus T8 finding into the same subgroup were not significant different. In conclusion, in this patients population of 17 subjects, comparison of findings on T1 and T8 between anaemic and not-anaemic was congruent and showed comparable results of the analysis performed on the wider sample size population showed on paragraph 4.7.1.
ANEMIA of INFLAMMATION
M.Carrabba 46
Figure 24 – comparison between anaemic and not-anaemic patients on T1. The two subgroups key results of Hb, C-RP, ERS, serum iron, transferrin saturation and ferritin levels are shown in box-plot with mean and percentages (25% - 75%).
ANEMIA of INFLAMMATION
M.Carrabba 47
4.9.4 Acutely ill patients and circulating monocytes expression of hepcidin
4.9.4.1 Monocytes-derived mRNA levels of hepcidin on T1 and on T8 A representative sample size consistent of 8 patients was considered. Mean age was 66.5 years (SD ±20.17; range 28 - 88yrs). Underlying causes of acute infection and hospitalization were: pneumonia (N=3), upper airways infection (N=2), gut infection (N=2), prostatitis as urinary tract infection (N=1). The mRNA levels of hepcidin (HAMP mRNA) and of く-actin in patients’ peripheral blood negative isolated monocytes were determined on both T1 and T8. Circulating monocytes were negative isolated (see methods on paragraph 3.3.5) in order to not activate the cells further. The く-actin mRNA levels in monocytes have been described as good housekeeping control for HAMP mRNA analysis [47], and were therefore used to standardize hepcidin mRNA levels to compensate for potential variations of total RNA used in individual assays. The mean of relative mRNA levels of hepcidin (x10
5) on T1 was 7.37 (95% CI: 0.81-13.93), higher than that found on T8: 5.32
(95% CI: 0.42-10.21), see figure 25.
Figure 25 – Hepcidin mRNA levels on T1 and T8 (relative to く-actin mRNA x105).
Correlation between serum C-RP levels and levels of patients’ circulating monocytes-derived HAMP mRNA were performed. No significant correlation was found on T1 nor on T8 (figure 26). Otherwise, a positive trend was found between C-RP serum levels on T1 and monocytes-derived HAMP mRNA on T8 (figure 26). It could be hypothesised that the impact of inflammation on significant induction of HAMP transcription by peripheral blood monocytes takes longer to be observed in vivo than in the in vitro endotoxemia models [47,49,98,99,100]. The lack in the measurement of hepcidin produced by circulating monocytes is one of the main limit of this study, together to the low sample size.
ANEMIA of INFLAMMATION
M.Carrabba 48
Figure 26 – Correlation between hepcidin mRNA levels on T1 and T8 (relative to く-actin mRNA x10
5) and C-RP serum levels on T1 andT8, respectively. On the left,
correlation between hepcidin mRNA levels on T8 and serum C-RP levels on T1.
4.9.4.2 Monocytes-derived mRNA levels of hepcidin and ferritin serum levels We found no correlation between serum iron levels and circulating monocytes-derived HAMP mRNA, nor on T1 neither on T8. Monocytes-derived HAMP mRNA had a negative correlation between HAMP mRNA levels on T8 and serum ferritin levels on T8 (r=-0.946, p=0.054) as shown in figure 27, while no correlation was found on T1 (figure 27, right). The role of circulating monocytes-derived hepcidin is still not clarified [101,102]. Our finding could suggest that autocrine hepcidin production by monocytes increases iron retention, but we could not explain why it happens only after 8-days course of documented acute inflammation.
Figure 27 – Correlation between hepcidin mRNA levels
on T1 and T8 (relative to く- actin mRNA x105) and serum ferritin levels (log)
on t1 and on T8, respectively. Significant correlation on T8 between HAMP mRNA and serum ferritin log levels is shown (r=-0.953, p=0.047).
The lack of correlation observed on T1 is similar to the finding by Wu et al. [49], but unfortunately, Authors tested their patients only once, at the sepsis onset. Findings by Theurl et al. [47] could not be considered for comparison, mainly because they investigated anaemic patients without any timing of the inflammation onset. Moreover, their patients population was affected by inhomogeneous causes of inflammation. On the other hand, both these Authors argued on the lack of correlation between monocyte-derived HAMP mRNA and serum ferritin levels in their studies [101]. Indeed, nor Theurl et al. [47] neither Wu et al. [49] found any correlation between circulating ferritin levels were with HAMP mRNA levels determined in monocytes of patients with anaemia of chronic disease [47] and severe sepsis [49]. They tried to
ANEMIA of INFLAMMATION
M.Carrabba 49
impute the lack in correlation to the fact that serum ferritin levels under inflammatory conditions are related to iron overload, regulatory effects of cytokines on ferritin expression, and cellular apoptosis. Unlike hepcidin expression in the liver, HAMP cannot be induced in monocytes or macrophages upon iron challenge [33,47], and in their opinion, this partly explains the lack of correlation. Wu et al. [49], commented that the lack of correlation between monocytes HAMP mRNA and serum ferritin would be ascribed to a different role of hepcidin produced by leukocytes in sepsis from that produced by hepatic cells.
4.9.4.3 Circulating monocytes IL-6 receptor, monocytes-derived mRNA levels of hepcidin and ferritin serum levels
In 20 of the 60 patients with acute inflammation investigated on T1 and T6 (see paragraphs 4.1 and the following), the expression of IL-6 receptor (IL-6R) on the membranes of circulating monocytes was evaluated by flowcytometric analysis. The functional IL-6R complex consists of IL-6R (CD126) and gp130. CD 126 is constitutionally expressed on cells membranes and by itself does not induce signal transduction. IL-6/CD126 complex induces the formation of a gp130/gp130 homodimer, which results in transmembrane signalling [103]. On T1, the mean expression of CD126 was 42.31 MFI (SE ±1.28), on T6 it was 40.80 MFI (SE ±1.79), no differences were observed. On T1, gp130 mean expression was 10.78 MFI (SE ±0.65), on T6 it was 11.36 MFI (SE ±0.45), no differences were observed (see figure 28, left). Our data are similar to those of Marsik et al. [103], who investigated the enhanced expression of gp130 in endotoxemia induced by LPS A positive correlation between gp130 expression on T6 and serum ferritin log levels on T6 was found (r=0.523, p=0.018; figure 28, right). No significant correlations were found on T1 levels. This finding could suggest that when inflammatory network is well established (on T8) and circulating monocytes are highly activated, the lower is the expression of gp130 (signalling transduction activated), the higher is the monocytes iron-retention by induction of HAMP transcription, as expected.
Figure 28 – CD126 and gp130 expression on T1 and T6, on the left. Correlation
between gp130 on T6 and serum ferritin levels on T6 (log), on the right.
In the 8 patients, whose HAMP mRNA derived by the circulating monocytes was analysed, IL-6 receptor expression on T1 and on T8 resembled the one observed in the 20 patients described above. No differences were observed on T1 and on T8 between the circulating monocytes membranes expression of both gp130 (12.13
ANEMIA of INFLAMMATION
M.Carrabba 50
MFI, SE ±1.32; 13.23 MFI, SE ±0.44; respectively) and CD 126 (34.27 MFI, SE ±5.80; 48.22 MFI, SE ±2.08; respectively), as shown in figure 29 (left). The negative correlation between gp130 expression on T8 and serum ferritin levels on T8 were confirmed (r=-1.00, p=0.01). On T8, a negative correlation also between HAMP mRNA and gp130 expression was found, as shown in figure 29 (right). These findings on T8 show that the lower is gp130, the highest is monocytes derived HAMP mRNA and, consequently, the lower is serum ferritin levels (figure 27, right). It could be hypothesised that induction of HAMP mRNA expression in circulating monocytes partially depends on gp130 signalling pathways. More data are needed, especially serum cytokines levels profiling of IL-6 and TNF-alpha.
Figure 29 – CD126 and gp130 expression on T1 and T8, on the left. Correlation between gp130 on T8 and circulating monocyte HAMP mRNA levels on T8 (related to く-actin, x10
5), on the right.
4.9.4.4 Circulating monocytes-derived mRNA levels: T1 and T8 modification Paired comparison between peripheral monocytes HAMP mRNA levels on T1 and on T8 were performed in 6 patients. All the patients lost haemoglobin on T8 (figure 30, left). Five patients had also a decrease in C-RP levels more than 70% (figure 30, right). The two patients with gut infection were excluded, as well the youngest and the oldest patient (28 years-old and 88 years-old, respectively).
Figure 30 – Percentage of haemoglobin loss on T8 relative to T1 (left).
Percentage of decrease in C-RP levels on T8 relative to T1 (right).
ANEMIA of INFLAMMATION
M.Carrabba 51
The relative mRNA levels of hepcidin (x105) derived by circulating monocytes on
T1 were 9.26 (95% CI: 0.55-17.97), higher than those found on T8 5.89 (95% CI: -1.22-13.00), see figure 31 (left).
0,00
5,00
10,00
15,00
20,00
25,00
84 85 89 99 100 101
HA
MP
mR
NA
(re
lati
ve
to
é-a
ctin
) ×
10
5
Patients ID
monocytes HAMP mRNA expression
T1
T8
Figure 30 – Hepcidin mRNA mean levels on T1 and T8 (relative to く-actin mRNA x10
5), on the left. Paired hepcidin mRNA levels on T1 and T8, on the right.
All the patients, except one, showed a decrease in HAMP mRNA levels on T8 related to T1 (figure 30, right). The fold change in HAMP mRNA T8 expression compared to T1 is detailed in figure 31 (left).
0,00
0,50
1,00
1,50
2,00
2,50
3,00
3,50
4,00
4,50
84 85 89 99 100 101
Fo
ld c
ha
ng
e T
8/
T1
Patients ID
Fold change in expression of HAMP
-12,00
-10,00
-8,00
-6,00
-4,00
-2,00
0,00
84 85 89 99 100 101
Fo
ld r
ed
uce
de
d e
xp
ress
ion
Patients ID
T8 HAMP mRNA expression vs T1
Figure 31 – Hepcidin mRNA fold change in T8 relative to T1 levels (normalised to く-actin mRNA x10
5), on the left. Hepcidin mRNA fold decrease expression on T8
relative toT1 levels (normalised to く-actin mRNA x105), on the right.
In figure 31 (right) is showed the reduction in circulating monocytes HAMP mRNA levels after 8-days course of acute inflammation and therapies. As expected, antibiotics and anti-inflammatory levels reduced also HAMP expression in those patients who had a decrease in C-RP serum levels. However, no correlations were found between this fold of reduced expression with the degree of loss in haemoglobin levels nor with the decrease of C-RP serum levels. Neither the change in ferritin serum levels nor in iron serum levels showed correlation. To our knowledge, this is the first study that investigated circulating monocytes-derived HAMP mRNA on admission and few days after (8 days). Other patients are under evaluation in order to better explore this issue in a wider population.
ANEMIA of INFLAMMATION
M.Carrabba 52
5. CONCLUSIONS In this prospective investigation on patients hospitalised for acute inflammation the close link between immunity and iron is evaluated and demonstrated. Hepcidin-25 is increased during acute inflammation. The inflammatory cytokines pattern observed in vivo in this study resembles the one described in experimental models of endotoxemia showed by Kemna et al. [32] and by Theurl et al.[47]. Hepcidin serum levels, haemoglobin and iron parameters are very similar to the ones found by van Eijk et al. in their investigation in septic patients admitted to ICU [81]. We found that in 60 acutely ill patients (95% affected by infections), the degree of inflammation, indicated by IL-6 and C-RP levels, is associated with elevated concentrations of hepcidin, low iron serum levels, high transferrin saturation and very high ferritin serum levels. Moreover, persistently increased levels of hepcidin-25 on T1 and on T6 are associated with a decrease in haemoglobin during hospitalization. Patients (N=26) anaemic on T1 were still anaemic after one week. Erythropoiesis was still blunted in these patients, despite higher erythropoietin serum levels than not-anaemic patients. The high levels of GDF-15 and hepcidin could have a role in the ineffective erythropoiesis. We observed acute ill patients (N=31) admitted with normal haemoglobin levels develop anaemia after the first week of hospitalization. Analysing this subset of patients’ hepcidin levels, we found that a cut-off level of hepcidin concentration of 23 nM/L was able to predict anaemia occurrence after one week with 100% of sensitivity and 90% of specificity. As was previously described [47,49], we also demonstrated expression of hepcidin mRNA in the circulating monocytes of the acutely ill patients. We found that its expression seems to be delayed in vivo by the persistence of inflammation during the first week of hospitalization. Indeed, we found that the higher was the inflammation on T1, the higher was hepcidin mRNA expression in circulating monocytes on T8. Moreover we found negative correlation between mRNA levels of monocytes-derived hepcidin and serum ferritin, especially on T8. Analysis of IL-6 functional receptor (CD126 and gp130) on circulating monocytes showed a negative correlation with monocytes-derived hepcidin mRNA, and positive correlation with serum ferritin levels. These findings could suggest that gp130 expressed on monocytes membrane might have a role in the signalling for hepcidin mRNA transcription and, consequently, iron retention. The new light in the corner of the mechanisms behind anaemia of acute inflammation, led to reconsider old therapies and explore new approaches. Transfusion is the oldest (and expensive) way of increasing haemoglobin, but its adverse effects are many, and it is not clear that the desired benefits of increased oxygen delivery and consumption at the cellular level actually occur. Erythropoietin therapy is effective (and expensive), but it takes time to augment erythropoiesis and is limited by contraindications and side effects. And perhaps, there are likely to be unintended consequences we have not yet discovered. Moreover, to date, there is no recommendation for the use of erythropoietin in critically ill patients, even though anaemic.
ANEMIA of INFLAMMATION
M.Carrabba 53
However, in anaemia of chronic kidney disease, it is well recognized that response to erythropoietin is greatly enhanced by intravenous iron. But iron may also be proposed to correct iron deficiency, even in the presence of inflammation, as it is now proposed to treat anaemia caused by cancer [1]. Iron may be given either by enteral or intravenous way. Recently, a hepcidin/ferritin driven approach has been proposed [104]. If iron is administrated by the enteral routes, its absorption may be reduced (secondary to the hepcidin-linked decrease in ferroportin in duodenal cells). On the other hand, in anaemia of inflammation there is a functional iron-deficiency, hence, the use of large amounts of iron, exceeding the transferrin iron-binding capacity, may promote free iron, which is known to induce oxidant stress [38]. Moreover, the link between iron and infection seems to suggest that there is an association between hyperferritinemia and the likelihood of infection [9], which could be harmful in the setting of anaemia by acute infection. Novel therapeutics, such as suppressing the inflammatory response, all deserve careful study for their potential benefits and careful observation for unintended side effects. Indeed, to block the inflammatory response via antibodies to cytokines, other acute phase reactants, or their receptors, is one of the new strategy for anaemia of inflammation. It has been demonstrated that IL-6 antibodies block the effect of LPS on hepatocytes in vitro and in mouse-model [72]. Anti-hepcidin antibodies could also block the suppressive effect on iron regulation [67]. Therefore, as hepcidin has antimicrobial properties, it may play a not yet discovered role in the fight against infection. Hence, further investigation are mandatory to prove these targets effectiveness and safety on human subjects. In conclusion, this analysis on acutely ill patients, its exhaustive characterization of the erythropoietic, inflammatory and iron-profile confirmed in vivo what many recently studies proved in vitro. We shows that the inflammation that occurs in acute illness can contribute to the development of anaemia by fine tuning of mechanisms that involves either cytokines, hepcidin, iron and erythropoiesis. Hepcidin derived by circulating monocytes has a not yet clarified role either for autocrine and for endocrine effects. Moreover, signalling-inducing hepcidin expression in human peripheral monocytes (and leukocytes) has been not yet completely understood. The comprehension of (liver-derived) hepcidin regulatory mechanisms have changed approach to the differential diagnosis [70,80] and treatment of anaemia [3]. However, before hepcidin measurements can be used in routine clinical practice, efforts will be required to harmonize the different assays, to define clinical decision limits, and to increase assay availability for clinical laboratories. The major benefit of understanding iron regulation in acute inflammation will be a relevant effect on decreasing healthcare requirements and substantially in-hospital stay, diagnostic investigations and, finally, healthcare costs. The knowledge of these mechanisms should guide the clinical management of the anaemia of acute inflammation, whose treatment is still really challenging.
ANEMIA of INFLAMMATION
M.Carrabba 54
REFERENCES
1. Weiss G., Goodnough L.T., “Anemia of chronic disease”, New England Journal of Medicine, Vol 352, 2005; pp. 1011-1023.
2. Lasocki S., Longrois D., Montravers P., Beaumont C., “Hepcidin and anemia of the critically ill patient”, Anesthesiology, Vol 114, β011, pp. 688-94.
3. Hayden S.J., Albert T.J., Watkins T.R., Swenson E.R., “Anemia in critical illness: insights into etiology, consequences, and management”, Am J Respir Crit Care Med, Vol 185, no. 10, 2012, pp. 1049-1057.
4. Walsh T.S., Lee R.J., Maciver C.R., et al., “Anemia during and at discharge from intensive care: the impact of restrictive blood transfusion practice”, Intensive Care Med, Vol 32, 2006, pp.100-109.
5. Bateman A.P., McArdle F., Walsh T.S., “Time course of anemia during six months follow up following intensive care discharge and factors associated with impaired recovery of erythropoiesis”, Crit Care Med, Vol γ7, β009, pp. 1906-1912.
6. Eisenstaedt R.S. “The prevalence of anemia in primary care”, Postgrad Medicine, Vol 116, no. S5, 2004, pp. 7-11.
7. Goodnough L.T., Nemeth E., Ganz T., “Detection, evaluation and management of iron-restricted erythropoiesis”, Blood, Vol 116, no. βγ, β010, 4754-4761.
8. Jurado R.L. “Iron, infections, and anemia of inflammation”, Clinical Infectious Disease, Vol 25, 1997, pp. 888-895.
9. Ganz T., “Iron in innate immunity: starve the invaders”, Current Opinion in Immunology, Vol 21, 2009, pp. 63-67.
10. Ganz T., “Hepcidin — a regulator of intestinal iron absorption and iron recycling by macrophages”, Best Practice & Research Clinical Haematology, Vol 18, no. 2, 2005, pp. 171-182.
11. Pigeon C., Ilyin G., Courselaud B., et al., “A new mouse liver specific gene, encoding a protein homologous to human antimicrobial peptide hepcidin, is overexpressed during iron overload”, J Biol Chem, Vol β76, β001, pp. 7811-7819.
12. Jordan J.B., Poppe L., Haniu M., et al., “Hepcidin revisited, disulfide connectivity, dynamics, and structure”, J Biol Chem, Vol 284, 2009, pp. 24155-24167.
13. Farnaud S., Patel A., Evans R.W., “Modelling of a metal-containing hepcidin”, Biometals, Vol 19, 2006, pp. 527-533.
14. Park C.H., Valore E.V., Waring A.J., Ganz T., “Hepcidin, a urinary antimicrobial peptide synthesized in the liver”, J Biol Chem, Vol 276, no. 11, 2001, pp. 7806-7810.
15. Krause A., Neitz S., Magert H.J., et al., “LEAP-1, a novel highly disulfide-bonded human peptide, exhibits antimicrobial activity”, FEBS Letter, Vol 480, 2000, pp. 147-150.
ANEMIA of INFLAMMATION
M.Carrabba 55
16. Valore E.V., Ganz T., “Posttranslational processing of hepcidin in human hepatocytes is mediated by the prohormone convertase furin”, Blood Cells Mol Dis, Vol 40, 2008, pp.132-138.
17. Kemna E.H., Tjalsma H., Podust V.N., Swinkels D.W., “Mass spectrometry-based hepcidin measurements in serum and urine: analytical aspects and clinical implications”, Clin Chem, Vol 53, 2007, pp. 620-628.
18. Rivera S., Nemeth E., Gabayan V., Lopez M.A., Farshidi D., Ganz T., “Synthetic hepcidin causes rapid dose-dependent hypoferremia and is concentrated in ferroportin-containing organs”, Blood, Vol 106, 2005, pp. 2196-2199.
19. Nemeth E., Preza G.C., Jung C.L., Kaplan J., Waring A.J., Ganz T., “The N-terminus of hepcidin is essential for its interaction with ferroportin: structure-function study”, Blood, Vol 107, 2006, pp. 328-333.
20. Peslova G., Petrak J., Kuzelova K., et al., “Hepcidin, the hormone of iron metabolism, is bound specifically to alpha-2-macroglobulin in blood”, Blood, Vol 113, 2009, pp. 6225-6236.
21. Nicolas G., Bennoun M., Porteu A., et al., “Severe iron deficiency anemia in transgenic mice expressing liver hepcidin”, Proceedings of the National Academy of Sciences, Vol 99, 2002, pp. 4596-4601.
22. Nicolas G., Bennoun M., Devaux I., Beaumont C., Grandchamp B., Kahn A., Vaulont S., “Lack of hepcidin gene expression and severe tissue iron overload in upstream stimulatory factor β (USFβ) knockout mice”, Proceedings of the National Academy of Sciences, Vol 98, 2001, pp. 8780-8785.
23. Nemeth E., Ganz T., “The role of hepcidin in iron metabolism”, Acta Haematologica, Vol 122, no. 2-3, 2009, pp. 78-86.
24. Ganz T., “Hepcidin and iron, regulation 10 years later”, Blood, Vol 117, no. 17, 2011, pp. 4425-4433.
25. Roetto A., Papanikolaou G., Politou M., et al., “Mutant antimicrobial peptide hepcidin is associated with severe juvenile hemochromatosis”, Nat Genet, Vol 33, 2003, pp. 21-22.
26. Papanikolaou G., Samuels M.E., Ludwig E.H., et al., “Mutations in HFEβ cause iron overload in chromosome 1q-linked juvenile hemochromatosis”, Nat Genet, Vol 36, 2004, pp. 77-82.
27. Bridle K.R., Frazer D.M., Wilkins S.J., et al., ”Disrupted hepcidin regulation in HFE-associated haemochromatosis and the liver as a regulator of body iron homoeostasis”, Lancet, Vol 361, 2003, pp. 669-673.
28. Nemeth E., Valore E.V., Territo M., et al., “Hepcidin, a putative mediator of anemia of inflammation, is a type II acute-phase protein”, Blood, Vol 101, 2003 pp. 2461-2463.
29. Weinstein D.A., Roy C.N., Fleming M.D., et al., ”Inappropriate expression of hepcidin is associated with iron refractory anemia: implications for the anemia of chronic disease”, Blood, Vol 100, no. 10, 2002, pp. 3776-3781.
30. Finberg K.E., Heeney M.M., Campagna D.R., et al., “Mutations in TMPRSS6 cause iron-refractory iron deficiency anemia (IRIDA)”, Nat Genet, Vol 40, 2008, pp. 569-571.
31. Nemeth E., Rivera S., Gabayan V., et al., “IL-6 mediates hypoferremia of inflammation by inducing the synthesis of the iron regulatory hormone hepcidin”, J Clin Invest, Vol 113, no. 9, 2004, pp. 1271-1276.
32. Kemna E., Pickkers P., Nemeth E., van der Hoeven H., Swinkels D., “Time-course analysis of hepcidin, serum iron, and plasma cytokine levels in humans injected with LPS”, Blood, Vol 106, no. 5, 2005, pp. 1864-1866.
33. Peyssonnaux C., Zinkernagel A.S., Datta V., Lauth X., Johnson R.S., Nizet V., “TLR4-dependent hepcidin expression by myeloid cells in response to bacterial pathogens”, Blood, Vol 107, 2006, pp. 3727-3732.
34. Verga Falzacappa M.V., Vujic S.M., Kessler R., et al., “STATγ mediates hepatic hepcidin expression and its inflammatory stimulation”, Blood, Vol 109, no. 1, 2007, pp. 353-358.
35. Pietrangelo A., Dierssen U., Valli L., et al., “STATγ is required for IL-6-gp130-dependent activation of hepcidin in vivo”, Gastroenterology, Vol 132, no. 1, 2007, pp. 294-300.
36. Wrighting D.M., Andrews N.C., “Interleukin-6 induces hepcidin expression through STATγ”, Blood, Vol 108, 2006, pp. 3204-3209.
37. Maliken B.D., Nelson J.E., Kowdley K.V., ”The hepcidin circuits act: balancing iron and inflammation”, Hepatology, Vol 53, no. 5, 2011, pp. 1764-1766.
38. Hentze M.W., Muckenthaler M.U., Galy B., Camaschella C., “Two to tango: regulation of Mammalian iron metabolism”, Cell, Vol 142, 2010, pp. 24-38.
39. Bekri S., Gual P., Anty R., et al., “Increased adipose tissue expression of hepcidin in severe obesity is independent from diabetes and NASH”, Gastroenterology, Vol 131, 2006, pp. 788-796.
40. Nguyen N.B., Callaghan K.D., Ghio A.J., Haile D.J., Yang F., “Hepcidin expression and iron transport in alveolar macrophages”, Am J Physiol Lung Cell Mol Physiol, Vol 291, no. 3, 2006, pp. L417-425.
41. Merle U., Fein E., Gehrke S.G., Stremmel W., Kulaksiz H. “The iron regulatory peptide hepcidin is expressed in the heart and regulated by hypoxia and inflammation”, Endocrinology, Vol 148, 2007, pp. 2663-2668.
42. Kulaksiz H., Fein E., Redecker P., Stremmel W., Adler G., Cetin Y., “Pancreatic beta-cells express hepcidin, an iron-uptake regulatory peptide”, J Endocrinol, Vol 197, 2008 pp. 241-249.
43. Kulaksiz H., Theilig F., Bachmann S., et al., “The iron-regulatory peptide hormone hepcidin: expression and cellular localization in the mammalian kidney”, J Endocrinol, Vol 184, 2005, pp. 361-370.
44. Gnana-Prakasam J.P., Martin P.M., Mysona B.A., Roon P., Smith S.B., Ganapathy V., “Hepcidin expression in mouse retina and its regulation via lipopolysaccharide/Toll-like receptor-4 pathway independent of Hfe”, Biochem J, Vol 411, 2008, pp. 79-88.
ANEMIA of INFLAMMATION
M.Carrabba 57
45. Isoda M., Hanawa H., Watanabe R., et al., “Expression of the peptide hormone hepcidin increases in cardiomyocytes under myocarditis and myocardial infarction”, J Nutr Biochem, Vol 21, 2010, pp. 749-756.
46. Theurl I., Mattle V., Seifert M., Mariani M., Marth C., Weiss G., “Dysregulated monocyte iron homeostasis and erythropoietin formation in patients with anemia of chronic disease”, Blood, Vol 107, 2006, pp. 4142-4148.
47. Theurl I., Theurl M., Seifert M., et al., “Autocrine formation of hepcidin induces iron retention in human monocytes”, Blood, Vol 111, 2008, pp. 2392-2399.
48. Pinto J.P., Dias V., Zoller H., Porto G., Carmo H., Carvalho F. and de Sousa M., “Hepcidin messenger RNA expression in human lymphocytes”, Immunology, Vol 130, no. 2, 2010, pp. 217-230.
49. Wu S.J., Zhang K., Lv C., et al., “Nuclear factor-kB mediated lipopolysaccharide-induced mRNA expression of hepcidin in human peripheral blood leukocytes”, Innate Immunity, Vol 18, no. 2, 2012, pp. 318-324.
50. Coyne D.W., Hepcidin: clinical utility as a diagnostic tool and therapeutic target”, Kidney International, Vol 80, no. 3, 2011, pp. 240-244.
51. Ashby D.R., Gale D.P., Busbridge M., et al., “Erythropoietin administration in humans causes a marked and prolonged reduction in circulating hepcidin”, Haematologica, Vol 95, no. 3, 2010, pp. 505-508
52. Huang H., Constante M., Layoun A., Santos M.M., “Contribution of STAT3 and SMAD4 pathways to the regulation of hepcidin by opposing stimuli”, Blood, Vol 113, no. 15, 2009, pp. 3593-3599.
53. Flanagan J.M., Peng H., Wang L., et al. “Soluble transferrin receptor-1 levels in mice do not affect iron absorption”, Acta Haematol, Vol 116, 2006, pp. 249-254.
54. Pinto J.P., Ribeiro S., Pontes H., Thowfeequ S., Tosh D., Carvalho F., Porto G., “Erythropoietin mediates hepcidin expression in hepatocytes through EPOR signaling and regulation of C/EBPalpha”, Blood, Vol 111, 2008, pp. 5727-5733
55. Vokurka M., Krijt J., Sulc K., Necas E., “Hepcidin mRNA levels in mouse liver respond to inhibition of erythropoiesis”, Physiol Res, Vol 55, 2006, pp. 667-674.
56. Pak M., Lopez M.A., Gabayan V., Ganz T., Rivera S., “Suppression of hepcidin during anemia requires erythropoietic activity”, Blood, Vol 108, 2006, pp. 3730-3735.
57. Tanno T., Porayette P., Sripichai O., et al., “Identification of TWSG1 as a second novel erythroid regulator of hepcidin expression in murine and human cells”, Blood, Vol 114, 2009, pp. 181-186.
58. Chou S.T., Weiss M.J., “Diseased red blood cells topple iron balance”, Nat Med, Vol 13, 2007, pp. 1020-1021.
59. Tanno T., Bhanu N.V., Oneal P.A., et al., “High levels of GDF15 in thalassemia suppress expression of the iron regulatory protein hepcidin”, Nat Med, Vol 13, 2007, pp. 1096-1101.
60. Nicolas G., Chauvet C., Viatte L., et al., ”The gene encoding the iron regulatory peptide hepcidin is regulated by anemia, hypoxia, and inflammation”, J Clin Invest, Vol 110, 2002, pp. 1037-1044.
61. Peyssonnaux C., Zinkernagel A.S., Schuepbach R.A., et al., “Regulation of iron homeostasis by the hypoxia-inducible transcription factors (HIFs)”, J Clin Invest, Vol 117, no. 7, 2007, pp. 1926-1932.
62. Nemeth E., “Targeting the hepcidin-ferroportin axis in the diagnosis and treatment of anemias”, Adv Hematol, Vol 2010, 2010, pp. 750643.
63. Ganz T., “Molecular pathogenesis of anemia of chronic disease”, Pediatric Blood and Cancer, Vol 46, no. 5, 2006, pp. 554-557.
64. Ganz T., Olbina G., Girelli D., Nemeth E., and Westerman M., “Immunoassay for human serum hepcidin”, Blood, Vol 112, no. 10, 2008, pp. 4292–4297.
65. Semrin G., Fishman D.S., Bousvaros A., et al., “Impaired intestinal iron absorption in Crohn’s disease correlates with disease activity and markers of inflammation”, Inflammatory Bowel Diseases, Vol 12, no. 12, 2006, pp. 1101–1106.
66. Sharma S., Nemeth E., Chen Y.H., et al., “Involvement of hepcidin in the anemia of multiple myeloma”, Clinical Cancer Research, Vol 14, no. 11, 2008, pp. 3262–3267.
67. Sasu B.J., Cooke K.S., Arvedson T.L., et al., “Antihepcidin antibody treatment modulates iron metabolism and is effective in a mouse model of inflammation induced anemia”, Blood, Vol 115, 2010, pp. 3616-3624.
68. Song S.N., Tomosugi N., Kawabata H., Ishikawa T., Nishikawa T., Yoshizaki K., “Down-regulation of hepcidin resulting from long-term treatment with an anti-IL-6 receptor antibody (tocilizumab) improves anemia of inflammation in multicentric Castleman disease”, Blood, Vol 116, 2010, pp. 3627-3634.
69. Hashizume M., Uchiyama Y., Horai N., Tomosugi N., Mihara M., “Tocilizumab, a humanized antiinterleukin-6 receptor antibody, improved anemia in monkey arthritis by suppressing IL-6- induced hepcidin production”, Rheumatol Int, Vol 30, 2010, pp. 917-923.
70. Kroot J.J., Tjalsma H., Fleming R.E., Swinkels D.W., “Hepcidin in human iron disorders: diagnostic implications”, Clinical Chemistry, Vol 57, no. 12, 2011, pp. 1650-1669.
71. Pietrangelo A., “Hepcidin in human iron disorders: therapeutic implications”, J Hepatol, Vol 54, 2011, pp. 173-181.
72. Nemeth E., “Hepcidin biology and therapeutic applications”, Expert Rev Hematol, Vol 3, 2010, pp. 153-155.
73. Roy C.N., “Anemia of Inflammation”, Hematology Am Soc Hematol Educ Program, Vol 2010, 2010, pp. 276-280.
74. Blanc B., Finch C.A., Hallberg L., et al., “Nutritional anaemias. Report of a WHO Scientific Group”, WHO Tech Rep Ser, Vol 405, 1968, pp. 1-40.
75. Allen L.A., Felker G.M., Mehra M.R., et al., “Validation and potential mechanisms of red cell distribution width as a prognostic marker in heart failure”, J Card Fail, Vol 16, 2010, pp. 230-238.
76. Skikne B.S., “Serum transferrin receptor”, Am J Hematol, Vol 83, 2008, pp. 872-875.
77. Brugnara C., “Iron deficiency and erythropoiesis: new diagnostic approaches”, Clin Chem, Vol 49, 2003, pp. 1573-1578.
78. Kroot J.J., Kemna E.H., Bansal S.S., et al., “Results of the first international round robin for the quantification of urinary and plasma hepcidin assays: need for standardization”, Haematologica, Vol 94, 2009, pp. 1748-1752.
79. Sasu B.J., Li H., Rose M.J., Arvedson T.L., Doellgast G., Molineux G., “Serum hepcidin but not prohepcidin may be an effective marker for anemia of inflammation (AI)”, Blood Cells Mol. Diseases, Vol 45, no. 3, 2010, pp. 238-245.
80. van Santen S., van Dongen-Lases E.C., de Vegt F., Laarakkers C.M.M., van Riel P.L.C.M., van Ede A.E. and Swinkels D.W., “Hepcidin and hemoglobin content parameters in the diagnosis of iron deficiency in rheumatoid arthritis patients with anemia”, Arthritits & Rheumatism, Vol 63, no. 12, 2011, pp. 3672-3680.
81. van Eijk L., Kroot J.J.C., Tromp M., van der Hoeven J.G., Swinkels D.W., Pickkers P., “Inflammation-induced hepcidin-25 is associated with the development of anemia in septic patients: an observational study”, Critical Care, Vol 15, 2011, pp. R9.
82. Heming N., Montravers P., Lasocki S., “Iron deficiency in critically ill patients: highlighting the role of hepcidin”, Crit care, Vol 15, no. 2, 2011, pp. 210-217.
83. Swinkels D.W., Girelli D., Laarakkers C., Kroot J., Campostrini N, et al., “Advances in quantitative hepcidin measurements by time-of-flight mass spectrometry”, PLoS One, Vol 3, 2008, pp. e2706.
84. Campostrini N., Castagna A., Zaninotto F. et al., “Evaluation of hepcidin isoforms in hemodialysis patients by a proteomic approach based on SELDI-TOF-MS”, J Biomed Biotechnol, Vol 2010, 2010, pp. 329646.
86. Schmittgen T.D. & Livak K.J., “Analyszing real-time PCR data by the comparative CT method”, Nature Protocols, Vol 3, no. 6, 2008, pp. 1101-1108.
87. Hanley J.A., McNeil B.J., “The meaning and use of the area under a receiver operating characteristic (ROC) curve”, Radiology, Vol 143, 1982, pp. 29-36.
89. Jelkmann W., “Proinflammatory cytokines lowering erythropoietin production”, Journal of Interferon and Cytokine Research, Vol 18, 1998, pp. 555-559.
90. Hunter H.N., Fulton D.B., Ganz T., Vogel H.J., ”The solution structure of human hepcidin, a peptide hormone with antimicrobial activity that is involved in iron uptake and hereditary hemochromatosis”, J Biol Chem, Vol 277, 2002, pp. 37597-37603.
91. Bozzini C., Campostrini N., Trombini P., Nemeth E., et al., “Measurement of urinary hepcidin levels by SELDI-TOF-MS in HFE hemochromatosis”, Blood Cells Mol Dis, Vol 40, 2008, pp. 347-352.
92. Butterfield A.M., Luan P., Witcher D.R., Manetta J., Murphy A.T., Wroblewski V.J., Konrad R.J., “A dual monoclonal sandwich ELISA specific for hepcidin-β5”, Clin Chem, Vol 56, 2010, pp. 1725-1732.
93. Kato A., Tsuji T., Luo J., Sakao Y., Yasuda H., Hishida A., “Association of prohepcidin and hepcidin-25 with erythropoietin response and ferritin in hemodialysis patients”, Am J Nephrol, Vol 28, 2008, pp. 115-121.
94. Ferring-Appel D., Hentze M.W., Galy B., “Cell-autonomous and systemic context-dependent functions of iron regulatory protein in mammalian iron metabolism”, Blood, Vol 113, 2009, pp. 679-687.
95. Tanno T. and Miller J.L., “Iron loading and overloading due to ineffective erythropoiesis”, Advances in Hematology, Vol 2010, 2010, pp. 358283.
96. Ramirez J.M., Schaad O., Durual S., et al., “Growth differentiation factor 15 production is necessary for normal erythroid differentiation and is increased in refractory anaemia with ring-sideroblasts”, British Journal of Haematology, Vol 144, no. 2, 2009, pp. 251-262.
97. Kanda J., Mizumoto C., Kawabata H., et al., “Serum hepcidin level and erythropoietic activity after hematopoietic stem cell transplantation,” Haematologica, Vol 93, no. 10, 2008, pp. 1550-1554.
98. Liu X.B., Nguyen N.B., Marquess K.D., Yang F., Haile D.J., “Regulation of hepcidin and ferroportin expression by lipopolysaccharide in splenic macrophages”, Blood Cells Mol and Dis, Vol 35, 2005, pp. 47-56.
99. Nguyen N.B., Callaghan K.D., Ghio A.J., Haile D.J. and Yang F., “Hepcidin expression and iron transport in alveolar macrophages”, Am J Physiol Lung Cell Mol Physiol, Vol 291, 2006, pp. L417–L425.
100. Zhang X. and Rovin B.H., “Hepcidin expression by human monocytes in response to adhesion and pro-inflammatory cytokines”, Biochim Biophys Acta, Vol 1800, 2010, pp. 1262-1267.
101. Weiss G. and Theurl I., “Monocyte hepcidin and the anemia of chronic disease”, Blood, Vol 111, no. 7, 2008, pp. 3902-3903.
102. Janardan H.P., “Elucidating the role of monocyte-derived hepcidin”, Blood, Vol 111, no. 7, 2008, pp. 3902.
103. Marsik C., Halama T., Cardona F., Schlifke I., Mittermayer F., Jilma B., “Endotoxemia enhances expression of the signalling receptor (gp1γ0) on protein and molecular level”, Clin Immunol, Vol 114, 2005, pp. 293-298.
104. Nakanishi T., Kuragano T., Kaibe S., Nagasawa Y., Hasuike Y., “Should we reconsider iron administration based on prevailing ferritin and hepcidin concentrations?”, Clin Exp Nephrol, Vol 16, 2012, pp. 819-826.