Page 1
UNIVERSITA’ DEGLI STUDI DI PADOVA
Dipartimento di Ingegneria Industriale DII
Corso di Laurea Magistrale in Ingegneria Energetica
MicroCHP or Heat Pump: The question for the most efficient heating
solution for domestic buildings through an Economic and Environmental
criterion
Relatore: Prof.ssa Anna Stoppato
Correlatore: Dott.ssa Elizabeth Massey (IERC)
Laureando: Giovanni Conti
Matricola:1082722
Anno Accademico 2015/2016
Page 3
iii
Acknowledgements
I would like to thank International Energy Research Centre (IERC) for giving me the possibility to
develop there my project and for all beautiful moments spent together.
I am also thankful to my supervisor, professor Anna Stoppato, for all support throughout this thesis
work.
I would like to express my gratitude to the city of Cork for this amazing Erasmus period and for
giving me the opportunity to meet lot of interesting and stimulating people.
Thanks to all friends, flatmates and classmates that I have met during these six months in Ireland
and during all these years of study spent in Padova.
Finally, my sincere thank goes to all my relatives and, in particular, to my parents for their love and
for their moral and material assistance.
Page 5
v
Abstract
Heat pumps and microCHP devices are two technologies that can be used in the heating residential
context and can help to reduce dramatically the CO2 emissions from this sector. Moreover, even if
they have a high investment cost respect to conventional heating systems, they could lead to a
significate savings on utility bills for end-users.
Heat pumps and microCHP are two very different technologies and as such it can be difficult to
distinguish a set of criteria on which to assess in absolute values which has the ‘best’ performance.
The main aim of this thesis work consists of developing an analysis of performance through a larger
perspective that includes economic and environmental criteria in order to assess which is the most
efficient appliance in heating a typical Irish house.
This study has been carried out firstly by modelling the building through SketchUp software.
Subsequently, after the selection of climate data for 2014, year chosen for the simulation, building
thermal and architectural features and the heating plant layout it possible to make the simulation run
using EnergyPlus software. In particular, the building is a typical Irish detached house, located in
Dublin, comprising 13 rooms and an attic. A hydronic radiant heating system embedded in the
building floor heat each room exclusive of the attic. Furthermore, a hot water tank located in the
utility room provides domestic hot water required by the tenants. According to the results from the
simulation, the nominal heating power output of the system that must supply the thermal demand of
the building is 15 kWth. For the simulation, an air-source heat pump and an internal combustion
engine microCHP, taken from the default software library, have been selected. From simulation
results, electricity profiles of these two appliances have been evaluated in two different weeks: one
in January and one in July. According to these profiles, it is possible to observe when there is a
thermal demand or when there is an electrical demand by tenants. In order to develop the
environmental criterion, it has been necessary to obtain values of Irish grid CO2 intensity for 2014.
Conversely, for economic criterion was fundamental to gather gas and electricity prices,
respectively to feed microCHP and heat pump, related to the global annual consumption of the
building since, in Ireland, prices are divided in bands depending on different consumption ranges.
Moreover, the price of electricity produced by the microCHP device and exported to the grid has
been considered.
Page 6
vi
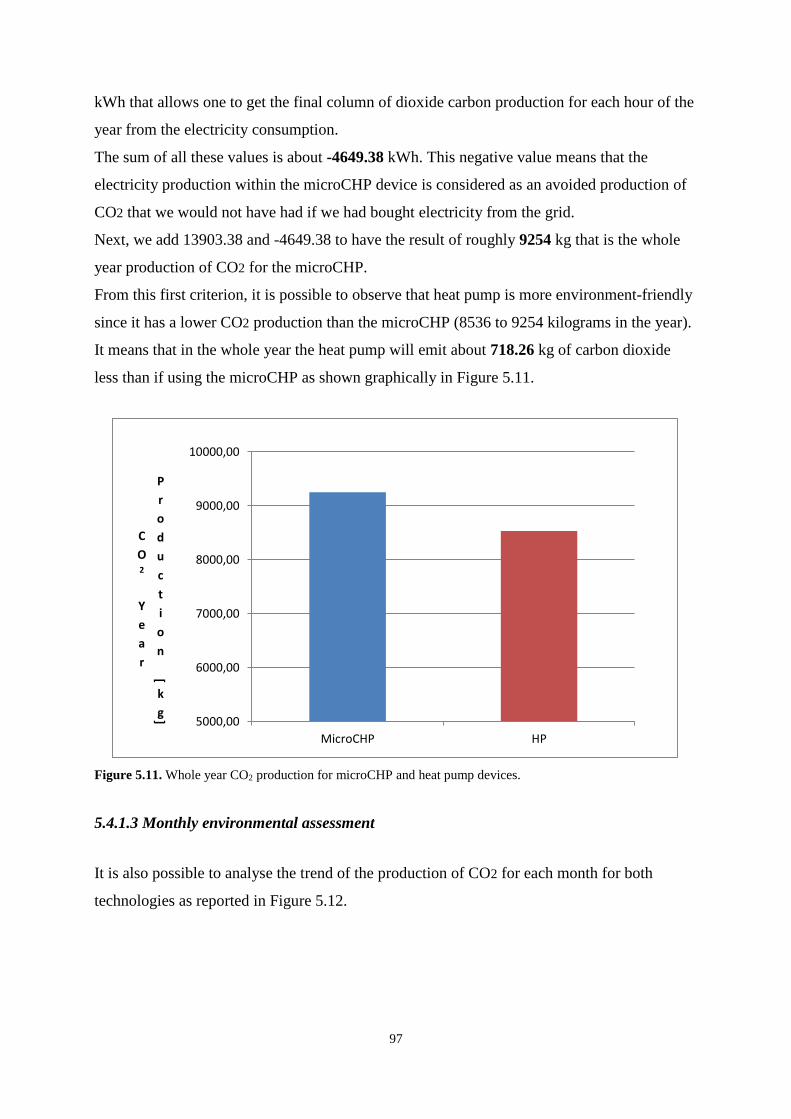
Environmental analysis results showed that in the year heat pump produces 8536 kg of CO2 while
the microCHP produces 9254 kg. From economic investigation, it is possible to observe that the
heat pump has an operation cost that is amount to 3156 € while for the microCHP is 2942 €.
Furthermore, a Net Present Cost (NPC) analysis was set up in order to compare these two devices
with a conventional boiler used for residential heating. The analysis was developed for a period of
20 years, with a discount rate of 5% and an annual rate of increase of energy price of 1%.
Considering an investment cost of 1903 € for a boiler, 4048 € for the heat pump and 13000 € for the
microCHP, NPC analysis provides values of 45221.74 € for the boiler, 44441.64 € for the heat
pump and 50228.16 € for the microCHP.
The thesis provides an overview of the state of art of these two technologies, with a discussion of
various typologies, characteristic parameters and typical values of them. Also presented is a general
review on business models suitable for both heat pumps and microCHP devices and the regulatory
framework currently adopted in Europe and Ireland. These two aspects are important due to the fact
that they could foster the penetration of these technologies in the residential market, helping
consumers to overcome typical barriers that are mainly related to social and economic issues.
Page 7
vii
Sommario
Le pompe di calore e i dispositivi di micro cogenerazione sono due tra le tecnologie utilizzabili nel
riscaldamento domestico che possono permettere di ottenere un sostanziale abbattimento delle
emissioni di CO2 in quel settore. Oltretutto, nonostante un elevato costo di investimento rispetto
alle tecnologie di riscaldamento convenzionali, possono permettere un concreto risparmio sul costo
della bolletta energetica per il consumatore finale. Tuttavia è difficile definire un criterio che
stabilisca quale tra le due tecnologie sia la migliore, in termini di efficienza e di performance, dal
momento che i parametri utilizzati per caratterizzarle sono diversi.
Per questo, l’obiettivo principale del presente lavoro di tesi è stato quello di sviluppare un’analisi
secondo un criterio economico-ambientale che possa valutare quale delle due applicazioni sia la
migliore, sotto questi punti di vista, nel riscaldamento di un’abitazione in Irlanda. L’analisi è stata
condotta andando dapprima a modellare l’edificio tramite il software SketchUp e, successivamente,
procedendo con le simulazioni tramite il software EnergyPlus. Quest’ultimo, in particolare, richiede
la compilazione di svariati campi nel proprio interfaccia, che rappresentano i parametri necessari ad
effettuare la simulazione. Tra questi si possono annoverare i principali che sono: i dati climatici
relativi al luogo e al periodo in cui si realizza la simulazione, le caratteristiche strutturali
dell’edificio e il layout dell’impianto di riscaldamento. Specificatamente, l’edificio consiste in una
tipica villetta irlandese, situata a Dublino e l’anno scelto per la simulazione è il 2014. La villetta si
compone di 13 stanze riscaldate tramite riscaldamento a pavimento ed un attico non riscaldato, non
sono presenti le bocchette per il recupero dell’aria esausta se non nella cucina e nei bagni e la casa è
ventilata naturalmente tramite l’apertura di porte e finestre. Inoltre, nel ripostiglio è ubicato il
serbatoio che contiene l’acqua necessaria a soddisfare le richieste di acqua calda sanitaria
dell’utenza. Stando ai risultati ottenuti dalla simulazione, la potenza nominale dell’impianto che
deve soddisfare la richiesta termica dell’edificio è di 15 kWt. Per la simulazione sono stati scelti una
pompa di calore aria-acqua con COP di 3.9 e potenza termica di 14500 W ed un dispositivo micro
cogenerativo funzionante tramite un motore a combustione interna alimentato a gas con potenza
elettrica di 7500 W ed un rapporto di 2.44 tra output termico ed elettrico. Entrambe queste
apparecchiature sono state selezionate dalla libreria fornita da EnergyPlus.
Per prima cosa, dai dati sui consumi elettrici annui della pompa di calore e dall’energia elettrica
netta (quindi prodotta o importata dalla rete a seconda della situazione) del microCHP, è stato
Page 8
viii
possibile sviluppare una serie di diagrammi in cui si illustrano i profili elettrici delle due tecnologie
in una settimana di gennaio ed in una di luglio. Mettendo a confronto i diversi profili è possibile
interpretare in quali occasioni l’utenza ha una richiesta termica o elettrica. Nel primo caso, ad un
picco del profilo elettrico della pompa di calore corrisponde un picco negativo dell’impianto
cogenerativo il quale esprime che l’elettricità prodotta dal sistema viene esportata alla rete. Nel
secondo caso, che si concretizza in estate quando non c’è riscaldamento della casa e il dispositivo
cogenerativo è attivo solo per produrre acqua calda sanitaria, ad una richiesta elettrica da parte
dell’utenza quest’ultimo deve far fronte importando l’elettricità dalla rete poiché non l’ha prodotta
per proprio conto non dovendo fronteggiare alcuna richiesta termica. Successivamente, per ricavare
i risultati dell’analisi ambientale si è dovuto ottenere il valore di intensità di CO2 della rete elettrica
nazionale irlandese nel 2014. Per quanto riguarda invece l’analisi economica, dai dati di letteratura
si sono desunti i valori del prezzo dell’elettricità e del gas richiesto per alimentare rispettivamente la
pompa di calore e il microCHP, sulla base della richiesta globale annua dell’edificio. In Irlanda,
infatti, i prezzi di gas ed elettricità sono differenziati in bande a seconda del consumo totale annuo.
Inoltre per l’impianto micro cogenerativo si è trovato l’attuale prezzo dell’energia elettrica da esso
prodotta ed esportata nella rete elettrica nazionale. Dai risultati dell’analisi si evince che la pompa
di calore produce in un anno circa 8536 kg di anidride carbonica mentre il microCHP ne produce
9254 kg. Per quanto riguarda invece lo studio economico, si è trovato che la pompa ha un costo
operativo annuo di 3156 € mentre il costo del microCHP ammonta a 2942 €.
A questi risultati si è aggiunta un’analisi comparativa delle due tecnologie rispetto ad un boiler a
gas convenzionale secondo il criterio del Valore Attuale Netto (VAN) considerando un arco
temporale di 20 anni e valutando solamente i flussi di cassa uscenti e quindi le spese sostenute per
garantire il funzionamento dei tre sistemi. In questa ricerca, si è assunto un tasso di sconto pari al
5% ed un valore di incremento annuo del prezzo dell’energia pari all’1%. Considerando un costo di
investimento pari a 1093 € per il boiler, 4048 € per la pompa di calore e 13000 € per il microCHP,
lo studio consegna un VAN pari a 45221.74 € per il boiler, 44441.64 € per la pompa di calore e
50228.16 € per il microCHP. Queste analisi forniscono dei risultati che danno la possibilità di
evidenziare quale delle due tecnologie possa essere la migliore, e sotto quale punto di vista, nel
riscaldamento di un edificio residenziale.
Oltre a ciò, obiettivi secondari del lavoro di tesi sono stati quello di fornire una panoramica sullo
stato dell’arte delle due tecnologie andando ad esporre le principali tipologie di pompe di calore e
microCHP (utilizzate anche in settori diversi da quello residenziale), i parametri che ne definiscono
le prestazioni e i loro valori caratteristici. Questo excursus ha avuto come obiettivo principale
Page 9
ix
quello di chiarire come i parametri distintivi di questi due sistemi non siano confrontabili tra loro e
divenga quindi necessario sviluppare altri criteri per poter avere una comparazione tra di essi.
Inoltre, il lavoro di ricerca bibliografica ha interessato anche gli aspetti del business model e del
quadro normativo relativi a queste due apparecchiature. In particolare, per quanto riguarda il
business model si sono definiti quali possono essere i modelli principali adattabili a queste
situazioni (soprattutto ESCO e leasing), mentre per quanto concerne il quadro normativo si sono
fornite le direttive principali che regolano il settore a livello europeo ed irlandese. Questi due aspetti
rappresentano un importante aiuto alla possibilità di diffusione all’interno del mercato del
riscaldamento residenziale per le pompe di calore e i microCHP, dal momento che possono aiutare i
potenziali consumatori finali a decidere di installarli superando le principali barriere che sono
soprattutto di natura economica (elevato costo dell’investimento iniziale e lunghi tempi di ritorno),
sociale (scarsa conoscenza della tecnologia e dei suoi benefici) e politica (mancanza di una
normativa stabile e trasparente in molti paesi europei, Irlanda compresa).
Page 11
xi
Table of contents
Chapter 1: Introduction…………………………………………………………………………....1
1.1 Background…………………………………………………………………………………...1
1.2 General overview……………………………………………………………………………..5
References…………………………………………………………………………………….......7
Chapter 2: Literature review……………………………………………………………………....9
2.1 Overview of space heating technologies for residential buildings………………………....….9
2.1.1 Heat pumps………………………………………………………………………………..9
2.1.1.1 Ground source heat pumps………………………………………………………….14
2.1.1.2 Air source heat pumps………………………………………………………………16
2.1.1.3 Conclusions about air source and ground source heat pumps……………………....18
2.1.1.4 Absorption heat pumps……………………………………………………………...19
2.1.2 MicroCHP…………………………………………………………….………………….20
2.1.2.1 Stirling engines……………………………………………………………………...25
2.1.2.2 Internal combustion engines………………………………………………………...26
2.1.2.3 Fuel cells…………………………………………………………………………….27
2.1.2.4 Organic Rankine cycles……………………………………………………………..29
2.1.2.5 Gas turbines…………………………………………………………………………30
2.2 Business models for residential space heating……………………………………………….30
2.2.1 Components of business models………………………………………………………...31
2.2.2 Business models situation for microCHP devices in residential buildings……………...32
2.2.2.1 Market players………………………………………………………………………33
2.2.2.2 Market drivers and penetration……………………………………………………..34
2.2.2.3 Market barriers……………………………………………………………………...35
2.2.3 Business models situation for heat pumps in residential buildings……………………...36
2.2.3.1 Market players……………………………………………………………………....37
2.2.3.2 Market drivers and penetration……………………………………………………...37
2.2.3.3 Market barriers……………………………………………………………………...38
Page 12
xii
2.2.4 Business models applicable for both technologies in residential buildings……………..39
2.2.4.1 ESCO………………………………………………………………………………..40
2.2.4.2 ESC………………………………………………………………………………….41
2.2.4.3 EPC………………………………………………………………………………….42
2.2.4.4 IEC…………………………………………………………………………………..43
2.2.4.6 Leasing……………………………………………………………………………...44
2.2.4.7 Feed-in remuneration scheme……………………………………………………….46
2.3 Electricity and gas prices in Ireland………………………………………………………….47
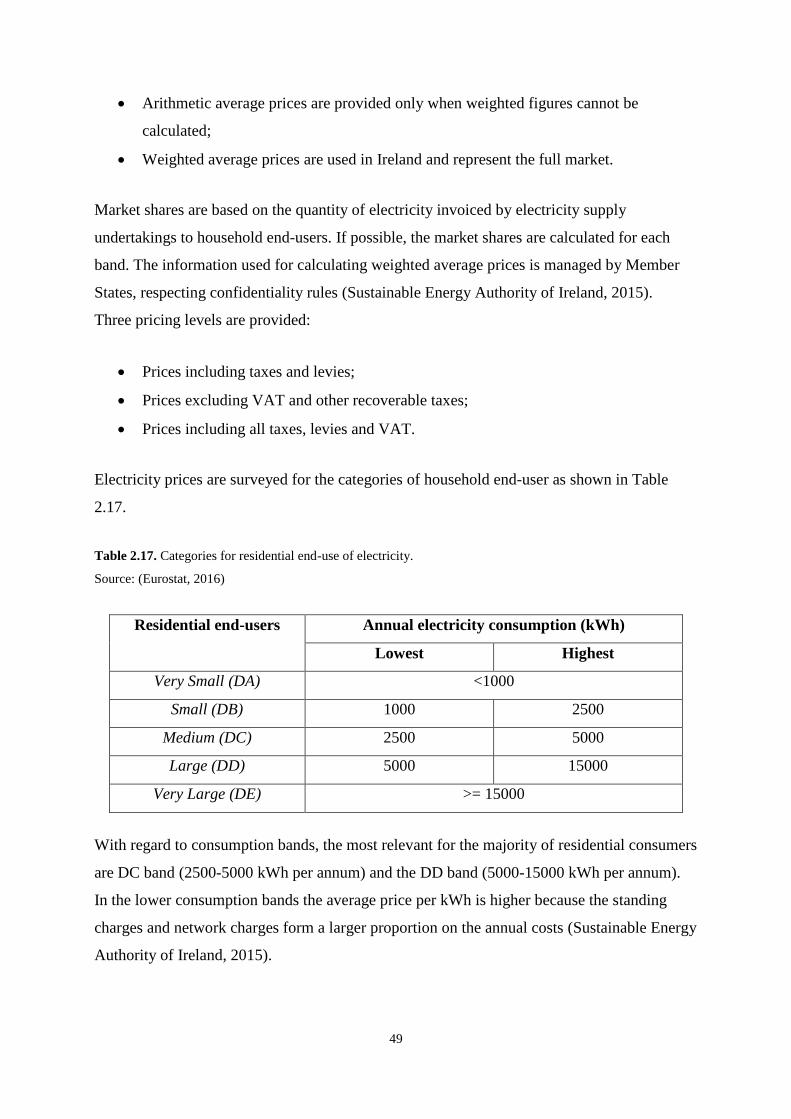
2.3.1 Residential electricity prices…………………………………………………………….48
2.3.2 Residential gas prices……………………………………………………………………51
2.4 Policies and regulations………………………………………………………………………53
2.4.1 EU Directive 2009/28/EC………………………………………………………………..53
2.4.2 National Renewable Energy Action Plan (NREAP)…………………………………….54
2.4.3 Decision No 406/2009/EC……………………………………………………………….55
2.4.4 Heat pumps regulatory framework………………………………………………………55
2.4.4.1 The RES Directive…………………………………………………………………..55
2.4.4.2 Energy Performance of Buildings Directive (EPBD)……………………………....56
2.4.4.3 Energy Efficiency Directive (EED)…………………………………………………56
2.4.4.4 Heat pump regulatory framework in Ireland………………………………………..56
2.4.5 MicroCHP regulatory framework………………………………………………………..57
2.4.5.1 MicroCHP regulatory framework in Ireland………………………………………..58
References………………………………………………………………………………………..59
Chapter 3: Methodology…………………………………………………………………………..65
Chapter 4: Model description……………………………………………………………………..67
4.1 Introduction…………………………………………………………………………………..67
4.2 Building description & plant layout………………………………………………………….67
4.2.1 Location and architectural design………………………………………………………..68
4.2.2 HVAC system & plant layout……………………………………………………………71
4.2.2.1 Heat pump model…………………………………………………………………...73
4.2.2.2 MicroCHP model……………………………………………………………………73
4.2.3 Occupancy profile……………………………………………………………………….73
4.2.4 Heat gains and losses…………………………………………………………………….74
Page 13
xiii
4.2.4.1 Heat gains and losses in wintertime………………………………………………...75
4.2.4.2 Heat gains and losses in summertime…………………………………………….....77
4.2.5 Thermostatic control……………………………………………………………………..78
4.2.6 Domestic hot water………………………………………………………………………79
4.2.7 Weather and simulation period…………………………………………………………..79
References………………………………………………………………………………………..81
Chapter 5: Results and discussion………………………………………………………………..83
5.1 Electricity consumption for heat pump………………………………………………………83
5.1.1 Wintertime for heat pump……………………………………………………………….84
5.1.2 Summertime for heat pump……………………………………………………………...86
5.2 Electricity consumption for microCHP………………………………………………………87
5.2.1 Wintertime for microCHP……………………………………………………………….88
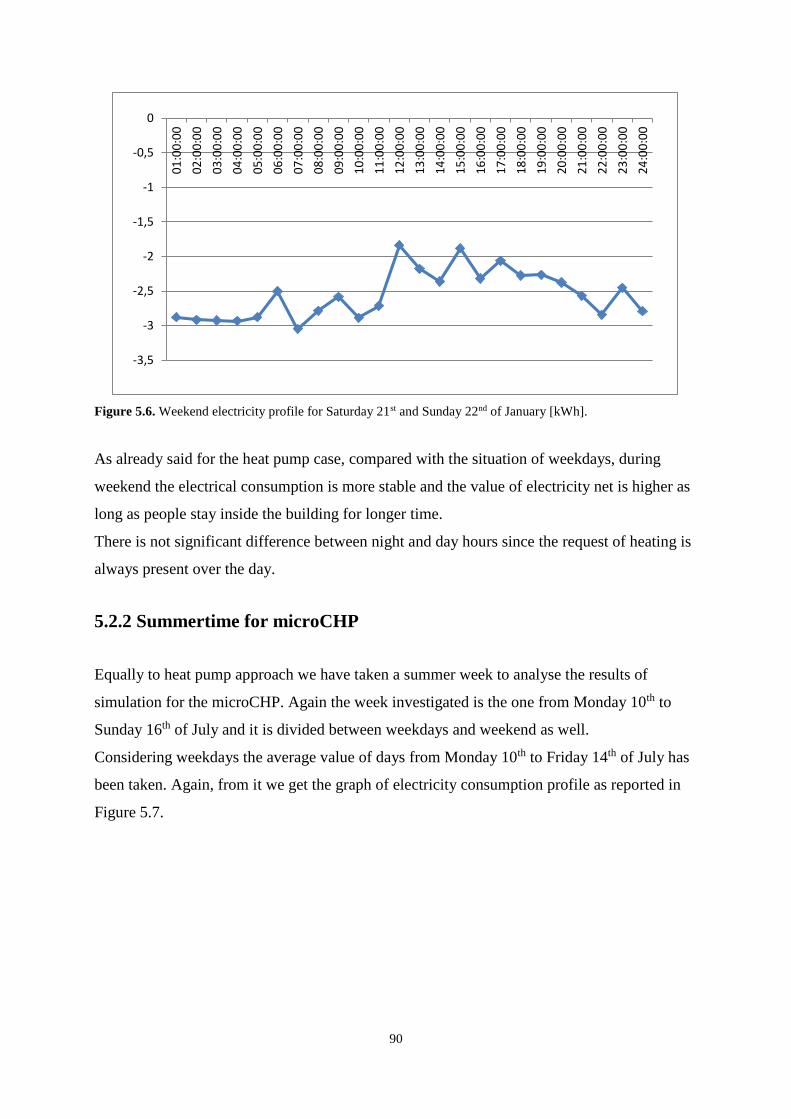
5.2.2 Summertime for microCHP…………………………………………………………..…90
5.3 Electricity consumption for end uses………………………………………………………...92
5.4 Comparison between heat pump and microCHP……………………………………………..94
5.4.1 Environmental assessment……………………………………………………………….95
5.4.1.1 Heat pump environmental assessment………………………………………………95
5.4.1.2 MicroCHP environmental assessment………………………………………………96
5.4.1.3 Monthly environmental assessment………………………………………………....97
5.4.2 Economic assessment……………………………………………………………………98
5.4.2.1 Heat pump economic assessment…………………………………………………...99
5.4.2.2 MicroCHP economic assessment………………………………………………….100
5.4.2.3 Monthly economic assessment…………………………………………………….101
5.5 Net present cost analysis……………………………………………………………………102
5.5.1 Boiler simulation’s data………………………………………………………………..103
5.5.2 Analysis development………………………………………………………………….104
5.6 Considerations from the analysis……………………………………………………………105
References………………………………………………………………………………………108
Chapter 6: Conclusions…………………………………………………………………………..109
Page 15
1
Chapter 1: Introduction
1.1 Background
The residential sector accounted for just over a quarter (27%) of all primary energy used in
Ireland in 2013 and it was the second largest energy using sector, after the transport sector. It
was also responsible for 27% (10.5 million tonnes) of energy related CO2 emissions in 2013
(Dennehy & Howley, 2013). Energy use in the sector includes energy for heating, hot water,
cooking, cleaning, washing, drying, lighting, cooling and entertainment. Space heating and
hot water provision account for the majority of fuel use in the residential sector (Gaffney &
Clancy, 2015). The principal sources of energy supply to the sector are oil, electricity and
natural gas, respectively accounting for 36%, 25% and 20% of energy use in 2013 (Dennehy
& Howley, 2013). In the five year period from 2006 to 2013, overall residential sector energy
consumption fell by 4.4% (0.9% per annum) while, in the same period, residential sector CO2
emissions fell by 11% (2.3% per annum) significantly faster than the fall in energy
consumption (SEAI, 2012) (SEAI, 2011). On a weather corrected basis, the “average”1
dwelling in Ireland consumed almost 20,000 kWh of energy in 2013. This comprised
approximately 5,000 kWh of electricity and almost 15,000 kWh of non-electrical
consumption. Moreover, the average dwelling was responsible for emitting 6.4 tonnes of
energy-related CO2 emissions in 2013; of this 3.9 tonnes of CO2 (61%) came from direct fuel
use and the remaining 2.5 tonnes arose indirectly from electricity use (SEAI).
The average energy efficiency in Irish housing improved by 34% over the period 1997 to
2013 (2.5% per annum) and the total energy spend in the sector during 2013 was 3 € billion,
an increase of 10% on 2006 (Dennehy & Howley, 2013).
In the recent past, most Irish houses were heated by open fires with back boilers, oil/gas based
central heating systems, or electrical storage heaters (SEAI, 2014).
Today, home heating costs are one of the greatest budgetary concerns for any Irish household.
In recent years, motivated by rising energy costs and the impacts of new legislation for the
1Total residential energy divided by the number of permanently occupied dwellings.
Page 16
2
built environment Irish homeowners understand better that energy needed for heating homes
and buildings can be reduced through reducing heat loss and improving the building fabric.
For this reason, heat pump and microCHP devices are proving an attractive alternative for the
replacement of conventional gas central heating boilers when they reach the end of their
useful life. In particular, these two technologies could offer lower operating costs and
reduction of carbon emissions (Energy Saving Trust, 2001) (SEAI, 2014).
In order to inform policy formulation the SEAI (Sustainable Energy Authority of Ireland)
Energy Modelling Group produced forecasts which examine energy usage out to 2020
(Dennehy & Howley, 2013). The so-called NEEAP/NREAP forecast assumes that the 20%
energy efficiency improvement by 2020 and 16% overall RES (Renewable Energy Systems)
target, required by the EU Renewable Energy Directive (based on achievement of the 40%
renewable electricity, 12% renewable heat and 10% renewable transport targets), are
achieved. An overall decrease in residential energy demand to 2020 is forecast (16%). With
the exception of renewables demand for all other energy sources is expected to fall and the
same tendency will be observed for electricity too. The greatest decrease is expected for coal
at approximately 7% per annum, followed by natural gas at 3% per annum and oil at between
2% and 3% per annum. Oil will still have the highest share in final residential energy
consumption in 2020 but electricity will overtake natural gas to have the second largest share
in the sector (Dennehy & Howley, 2013) (European Commision , 2012). Figure 1.1 shows the
NEEAP/NREAP forecast for the residential sector.
Figure 1.1. Residential final energy demand by fuel 2010 to 2020 (NEEAP/NREAP Scenario).
Source: SEAI.
Page 17
3
Under the Energy Efficiency Directive 2012/27/EC2 and the Renewable Energy Directive
2009/28/EC3 EU Member States are encouraged to lower energy consumption and are legally
bound to increase the deployment of renewable energy technologies. Ireland must increase
renewable energy use to 16% of gross final energy consumption by 2020 and have committed
to reducing the national energy demand by 20% compared to the average 2001-2005 level
through energy efficiency measures by 2020 (Department of Communications , 2014).
Energy efficiency policies have been successful in reducing household demand for thermal
energy, while building regulations for household dwellings implemented in 2008 have led to
an increased amount of renewable energy being used for heat (SEAI, 2014). In spite of these
developments, fossil fuels continue to dominate heat production in the residential sector; the
higher capital costs of new technologies such as heat pumps and microCHP, access to the
natural gas grid and a lack of market experience in the use of these options have all added to
the list of barriers restricting the uptake of alternatives (Irish Academy of Engineers, 2013)
(Hewitt, 2012).
Due to their potential for high efficiencies, heat pumps are considered a renewable source of
heat under EU Renewable Energy Directive 2009/28/EC3. In addition, heat pumps can
provide an alternative to the existing heat sources used to meet the nation’s thermal energy
needs. The potential benefits may include:
Lowering national reliance on imported fossil fuels;
Reducing CO2 emissions;
Delivering renewable heat;
Operating in conjunction with smart grid technology to maximise the benefits from
renewable electricity generation.
The European Union CHP Directive4, approved in February 2004, sought to create a
favourable environment for CHP installations. The directive contained definitions for micro,
small and large scale CHP. In table 1.1 it is possible to observe the operational capacity in
2014 for microCHP (Holland, Howley, & Dineen, 2015).
2 European Union, ‘Energy Efficiency Directive 2012/27/EC’, Brussels, 2012. 3 European Union, ‘Renewable Energy Directive 2009/28/EC’, Brussels, 2009. 4 European Union, ‘Directive 2004/8/EC on the promotion of cogeneration based on useful heat demand in the internal
energy market’, 2004.
Page 18
4
Table 1.1. Number of units and installed capacity for microCHP in 2014 in Ireland.
For microCHP technology benefits may incorporate (Cogen Europe):
Empowering energy consumers;
Producing heat and power at point of demand and at time of maximum demand;
Balancing renewables;
Saving primary energy;
Decarbonising heat and electricity production.
Policy intervention to overcome the barriers to energy technology uptake in the heat sector
has proven more difficult than in other areas. The heat sector, in Ireland as in Europe, has
seen much less activity to support new technologies (such as heat pump and microCHP) when
compared with other sectors (European Commision, EACI, 2011). This brings to the
fragmented nature of the heat market, the difficult of retrofitting buildings with new heat
technology and the administrative difficulties of implementing policy support for renewable
heat (Clancy, 2015).
The generation and use of heat energy is shaped by the complexity in the interactions among
generation, supply and end-use arising from the physical characteristics of heat energy. Heat
energy is difficult to transport over significant distance in an efficient way and this means that
the economies of scale that are available in electricity sector are unavailable. As a result, heat
is generally not traded as a commodity and typically does not have a market price (Clancy,
2015). Space and water heating in homes typically occurs over the winter months, with a
residual demand for water heating over the summer months. This reduces the relative
importance of fuel consumption and ongoing maintenance costs, and increases the relative
importance of upfront installation costs in heat technology choice. The available technology
choice is more diverse due to the lower temperature requirements of space and water heating.
Moreover, tenants and landlords may have different incentives, with landlords’ choice of heat
Electrical
capacity size
range
Number of
units
Number of
units (%)
(compared to
other sizes)
Operational
capacity
(MWe)
Operational
capacity (%)
MicroCHP < 50
kWe 69 26.3 0.5 0.2
Page 19
5
technology dependent mainly on the installation cost, while tenants are more concerned with
the ongoing running costs. This can result in a technology with a higher overall lifetime cost
being chosen (Howarth & Sanstad). Additionally, the suitability of a building for a technology
type, and consumers attitudes towards changing technology, are also important determinants
of which technology is chosen when replacing and old gas or oil central heating system.
Nevertheless, both heat pumps and microCHP could represent a natural evolution of existing
boiler technology. For instance, many of components in a microCHP unit are the same as, or
based on, those found in a traditional gas boiler. The similarity of microCHP to the gas boiler
means consumers and businesses also have a familiarity with them (Cogen Europe). In the
same way, for heat pump system design and installation are crucial and it has to be designed
to integrate with other systems in the dwelling (SEAI, 2013).
In general, for both technologies before the installation, some features have to be analysed:
Available budget: focus should be on reducing the heat demand of a building through
low/medium/high cost impact measures, for example improving the insulation, air
tightness and glazing upgrade.
Space available on site: especially for heat pumps that are not always feasible due to
the space needed for the collector;
Dwelling suitability: examination of the energy performance of the residential
building and assurance that existing heat distribution system can be used in
conjunction with a heat pump or microCHP device;
Heat requirement: establish annual consumption;
Data availability: fuel cost comparison calculators and got quotes from suppliers;
Simple payback: calculation of how many years’ savings will be equivalent to the
overall cost of the system.
1.2 General overview
The general aim of this research work is to analyse the different performances between an air-
source heat pump and an internal combustion engine microCHP into heating a typical Irish
residential building. The comparison between these two technologies is carried out through
different criteria that study energy, economic and environmental performances. Alongside
Page 20
6
with this main purpose, there is also the objective to provide a brief overview about the
current state of art of the heat pump and microCHP appliances and the present situation for
business models available in order to foster the market penetration of these technologies.
The methodology used in this project for reaching those objectives includes:
Literature review of the state-of-the art technologies for heat pumps and microCHP
heating processes for residential buildings;
Review of feasible and appropriate business models;
Brief review of relevant European and Irish policies and regulations;
Assessment of energy performance through the investigation of electricity profile of
two devices;
Evaluation of CO2 yearly emissions and total annual costs for both technologies in
order to determine which option may be more attractive;
Net Present Cost (NPC) assessment in order to compare these two appliances with a
conventional heating boiler.
Page 21
7
References
Clancy, M. (2015). Renewable heat in Ireland to 2020. Dublin: SEAI.
Cogen Europe. (n.d.). The benefits of microCHP. Brussels: Delta-ee.
Dennehy, E., & Howley, M. (2013). Energy in the Residential Sector. SEAI.
Department of Communications . (2014, 09 03). Energy and Natural Resources, 'National
Energy Efficiency Action Plan'. Retrieved 02 22, 2015, from
http://www.dcenr.gov.ie/energy/en-ie/Energy-Efficiency.
Dunbabin, P., & Wickins, C. (2012). Detailed analysis from the first phase of the Energy
Saving Trust's heat pump field trial. London: Energy Saving Trust.
Energy Saving Trust. (2001). Domestic CHP: What are the potential benefits? EST.
European Commision . (2012). Energy roadmap 2050. European Commision.
European Commision, EACI. (2011, 12). Shaping an effective and efficient European
renewable energy market. Retrieved from http://www.reshaping-res-
policy.eu/downloads/Final%20report%20RE-Shaping_Druck_D23.pdf.
Gaffney, F., & Clancy, M. (2015). Replacing oil boilers with heat pumps: household
economics and system-wide impacts. SEAI.
Hewitt, N. (2012). Heat pumps and energy storage - the challenges of implementation .
Applied Science .
Holland, M., Howley, M., & Dineen, D. (2015). Combined Heat and Power in Ireland.
Dublin: SEAI.
Howarth, R., & Sanstad, A. (n.d.). Discount rates and energy efficiency. Contemporary
Economic Policy.
Irish Academy of Engineers. (2013). Policy advisor - the future of oil and gas in Ireland.
Dublin.
SEAI. (2011). Residential Energy Roadmap. Sustainable Energy Authority of Ireland.
SEAI. (2012). Energy in Ireland 1990-2011. Sustainable Energy Authority of Ireland.
SEAI. (2013). Domestic Heat Pump: a Consumer Guide. Cork.
SEAI. (2014). Better Energy Homes Scheme: Impact Report - Billing Analysis. Sustainable
Energy Authority of Ireland.
SEAI. (2014). Heat Pump Technologies. Retrieved from
http://www.seai.ie/Publications/Your_Home_Publications_/Heating/Best_Practice_Gu
ide_Heat_Pump_technologies.pdf.
Page 22
8
SEAI. (n.d.). National BER Research Tool. Retrieved 02 022, 2015, from
http://www.seai.ie/Your_Building/BER/National_BER_Research_Tool/.
Page 23
9
Chapter 2: Literature review
2.1 Overview of space heating technologies for residential
buildings
The aim of this paragraph is to provide a general overview of the state-of-art of the current
heat pump and micro cogeneration technologies used for residential buildings; the analysis
intention is to understand the main parameters that can define these two technologies and
current values that could be reached nowadays.
2.1.1 Heat pumps
A heat pump is a device that is able to transfer heat from one fluid at a lower temperature to
another at a higher temperature (Robur, 2016). The transfer of thermal energy from a heat
source to a heat sink is made through a compression cycle that takes advantage of temperature
gradients (European Commision, 2014).
Pumps can be driven by electricity or by thermal energy, the main difference being the
electrical heat pumps use a mechanical compressor, while thermally activated heat pumps
achieve compression by thermal means.
One of the advantage of using thermally activated heat pumps is their high output temperature
and simple integration with existing heating systems and infrastructure. Conversely, electric
heat pumps can operate on the grid in response to electricity prices and contribute to optimal
load management (The European Technology Platform on Renewable Heating and Cooling,
2016).
The most common heat pumps in the residential sector are air/air units and split-air
conditioners for air conditioning. ASHPs (Air Source Heat Pumps) can provide sanitary hot
water and space heating, while avoiding the need for expensive ground or water loops.
GSHPs (Ground Source Heat Pumps), which use underground heat exchangers, have higher
efficiencies in cold water than ASHPs (Sustainable Energy Ireland, 2009).
Page 24
10
In order to have a general overview about which are the main parameters and values that
define the performances of heat pumps it is possible to follow an analysis carried out by the
Energy Saving Trust.
This organization monitored a large number of heat pumps in residential properties across UK
and Ireland from April 2009 to March 2010 (Energy Saving Trust, 2013).
This project was developed by the Energy Saving Trust and delivered from a wide range of
stakeholders including main UK’s energy suppliers and heat pump manufactures and
installers including: Danfoss UK, NIBE, Mitsubishi Electric, Worcester Bosch and Baxi
Group.
The sample included a large number of site permutations and included the following
installation types:
Air source and ground source heat pumps;
Heat pumps installed in private and social housing properties;
Heat pumps installed in new build and retrofit properties;
Heat pumps providing heating only;
Heat pumps providing heating and hot water;
Heat pumps installed with different heat delivery systems: under-floor heating and/or
radiators.
The electricity consumption includes the energy input to the compressor and controls, plus
either the circulating pumps for the ground coil in the case of ground-source heat pumps.
The specification required other measurements to be taken to determinate the overall
performance of the heat pump. These factors can both influence performance, provide data
and may include:
Heat source temperatures;
Heat sink temperature, including central heating flow and return temperature and
temperature of domestic hot water;
Room temperature;
Outdoor ambient temperatures.
In the case of ground-source heat pumps, the heat source temperatures required are:
Page 25
11
The ground temperature at a distance from the heat extraction point;
The ground temperature close to the ground point;
Flow and return temperatures on the heat source loops.
For air-source heat pumps, just the air inlet temperature is required.
Efficiency of a heat pump may be defined as the ratio of heat output to the electricity used.
This ratio is dependent on (amongst other things) the temperature of the source (air or
ground), the flow temperature of the heat provided and the range of electricity inputs included
in the system boundary. There is difference between various definitions of efficiency
(coefficient of performance, seasonal coefficient of performance, seasonal performance factor
and system efficiency) and the range of different system boundaries that can be used (Energy
Saving Trust, 2012).
First, the coefficient of performance (COP) is determined by laboratory testing at defined
source and heat flow temperatures; the temperature at which COP is measured must always be
quoted (CEN/TC 228, 2011). The COP is the quotient of the current heat output power and
the current electricity power input (Kadar, 2012). This value is normally between 3 and 4 in
an average application (e.g. air/water pump). An example of that can be observed in Table 2.1
where both flow temperature and ambient temperature are reported.
Table 2.1. Specified COP values at different ambient and central heating flow temperatures for a typical air-
source heat pump.
Source: Energy Saving Trust
Ambient
temperature (°C)
Central heating flow temperature (°C)
35 45 55
-15 2.2
-7 2.65
2 3.84 3.28
7 4.39 3.69 3.19
Secondly, the seasonal coefficient of performance (SCOP) is a modelled estimate of the
efficiency of a heat pump in a given climate and it is based on laboratory measurements of
coefficient of performance, combined with climate data for a given location.
Then the seasonal performance factor (SPF) is the measured annual efficiency of a heat pump
at a particular location. It is important to define the difference between SPF from the
boundaries that could be taken i.e. SPFH1, SPFH2, SPFH3 and SPFH4 (Nordman, Andersson,
Page 26
12
Monica, & Markus, 2010). The four seasonal performance factors are illustrated in the Figure
2.1.
Figure 2.1. System boundaries for space and water heating circuits.
Source: Energy Trust Saving
Since in the trial just SPFH2 and SPFH4 are used to evaluate system efficiency is given the
definition of them:
SPFH2: the system boundary consists of the heat pump unit and the equipment to
make the source energy available for the heat pump and this parameter evaluates the
performance of heat pump operation. SPFH2 takes into account, in addition to SPFH1,
total source fan consumption, and the sink fan consumption only for non-ducted
internal units (SEPEMO, 2011).
SPFH4: consists of the heat pump unit, the pumps or fans to make the source energy
available, the auxiliary electric heater and domestic hot water immersion and all
auxiliary pumps including those on the heat sink. SPFH4 is equal to SPFH3 for non-
ducted unit (SEPEMO, 2011).
Page 27
13
Designations of electricity inputs and heat outputs for the definitions of seasonal performance
factors are presented in Table 2.2.
Table 2.2. Designation of electricity inputs and heat for definition of seasonal performance factors.
Source: Energy Saving Trust
Quantity Explanation
Heat QH_hp Space heating provided by the heat pump
QW_hp Water heating provided by the heat pump to
the domestic hot water cylinder
QH_aux Space heating, provided by the auxiliary
electric heater
QW_aux Water heating, provided by the electric
immersion to the domestic hot water cylinder
Electricity ES_fan/pump Electricity used by the source pump (for
ground-source) or fan (for air-source)
EHP Electricity used by heat pump (excluding the
ground loop/air inlet and auxiliary
heating/immersion)
Eimmersion Electricity used to supplement domestic hot
water production
EAux Electricity used to supplement space heating
Ebt_pump Electricity used by buffer tank pump (if
present)
EB_fan/pump Electricity used by the fan or pump of the
central heating system
Following the analysis accomplished by Carbon Saving Trust, we have to say that different
typologies of heat pumps have been studied before (phase I) and after (phase II) some
modifications of the system that were different for each situation. In particular, one of the aim
of the research was to understand performances of devices studied in order to see how
modifications could have improved them, paying particular attention to the factors that
influence system performances.
In phase I 83 properties were monitored by the Energy Saving Trust. 38 of these systems were
selected for interventions and further analysis and the selection process was determined by:
Identification of the need for an intervention or interventions;
Page 28
14
Willingness of the manufacturer to carry out the interventions;
Willingness of the householder to participate in a further year of monitoring.
A further six sites were added to the sample. Therefore, for phase II 44 sites were analysed
(Energy Saving Trust, 2013). The most common system configuration was a ground-source
heat pump, supplying radiators and domestic hot water (21 cases), followed by an air-source
heat pump supplying radiators and domestic hot water (12 cases) (Energy Saving Trust,
2013).
Between phase I and phase II a wide range of interventions were made. These have been
classified as major, medium and minor:
Major interventions (such as replacement of the heat pump, reduction of area heated
by heat pump, recharging refrigerant or repair leak to ground loop) required input
from a heat pump expert;
Medium interventions (e.g. installation of a buffer tank or new hot water tank, new
radiators or circulation pumps, connection of shower to heat pump circuit, etc.) could
be carried out by a plumber;
Minor interventions (such disabling auxiliary heater or extra insulation) consisted of
changes to controls or a general service.
From this path, it is possible to obtain typical values of system efficiency and seasonal
performance factors for ASHPs and GSHPs studied.
It is important to notice that the ambient temperature influences the system efficiency so, in
order to compare system efficiencies from phase I and phase II, the data have corrected for the
effect of ambient temperature (Energy Saving Trust, 2012).
2.1.1.1 Ground source heat pumps
For phase I of the analysis the average efficiency of this kind of heat pump got by the trial is
2.39, with a range of 1.55-3.37. As reported in Table 2.3 and Table 2.4 we can report the
system efficiency of heat pumps as a function of emitter type. Largely under-floor, which
includes systems with under-floor heating only, under-floor heating and domestic hot water,
and under-floor heating and radiators; or largely radiators, which includes systems with
Page 29
15
radiators only and systems with radiators that also provide hot water (Energy Saving Trust,
2013).
Table 2.3. System efficiency of ground-source heat pumps as a function of heating type.
Source: Energy Saving Trust
System efficiency Largely radiator heating Largely under-floor heating
Number 27 22
Average 2.23 2.58
Range 1.8-3.0 1.6-3.4
Table 2.4. System efficiency of ground-source heat pumps as a function of hot water production.
Source: Energy Saving Trust
System efficiency With hot water production Without hot water
production
Number 42 7
Average 2.34 2.68
Range 1.6-3.4 1.8-3.4
In the phase II, after modifications for each sites, it is possible to calculate SPFH2, SPFH4 and
system efficiency for the heat pumps in the trial. It was not possible to calculate all of these
quantities in every case due to metering arrangements or heat meter faults (Energy Saving
Trust, 2013). For example, SPFH2 can only be calculated for 36 of the 44 systems examined
in the trial (Energy Saving Trust, 2013). Values are reported in Table 2.5.
Table 2.5 SPFH2, SPFH4 and system efficiencies for phase II.
Source: Energy Saving Trust
SPFH2 SPFH4 System efficiency
Number 21 21 26
Average 3.08 2.82 2.54
Range 2.2-3.9 2.0-3.9 1.5-3.3
Page 30
16
2.1.1.2 Air source heat pumps
Concerned to air source heat pumps, the average efficiency for the phase I is 1.82, with a
range between 1.2 and 2.2 that is less compared to ground source type. There is no apparent
trend in these data since there are only 17 systems with radiators and 5 with under-floor
heating. Therefore, it is not possible to determinate reliable statistics for the system
performance (Energy Saving Trust, 2013). This situation is explained in Table 2.6 and Table
2.7.
Table 2.6. System efficiency of air source heat pumps as a function of heating type.
Source: Energy Saving Trust
System efficiency Largely radiator heating Largely under-floor heating
Number 17 5
Average 1.82 1.86
Range 1.2-2.2 1.4-2.2
Table 2.7. System efficiency of air source heat pumps as a function of hot water production.
Source: Energy Saving Trust
System efficiency With hot water production Without hot water
production
Number 13 9
Average 1.83 1.83
Range 1.4-2.2 1.2-2.2
These values are lower compared with the same showed for ground source heat pumps.
Also for air source heat pumps for phase II, after modifications, it is possible to obtain a table
as for the other typology as represent in Table 2.8.
Table 2.8. SPFH2, SPFH4 and system efficiencies for phase II.
Source: Carbon Saving Trust
SPFH2 SPFH4 System Efficiency
Number 15 15 16
Page 31
17
Average 2.72 2.45 2.16
Range 2.2-3.9 2.0-3.7 1.7-2.7
In the trial, six of the 44 heat pumps supplied only space heating while remaining 38 supplied
both space and water heating. In 11 cases, the complexity of the systems or faults with heat
meters meant that it was not possible to produce separate estimates of space and water heating
efficiencies (Energy Saving Trust, 2013).
In the whole analysis space heating efficiencies, as SPFH2, can be estimated for 34 sites. For
example, we could see the situation for space heating efficiencies, as SPFH2, for both
typologies as reported in Table 2.9.
Table 2.9. Space heating efficiencies for air- and ground-source heat pumps (as SPFH2).
Source: Carbon Saving Trust
SPFH2
Air source Ground source
Number 14 20
Average 2,73 3,21
Range 2,2-3,2 2,2-4,6
On average, the ground-source heat pumps showed higher space heating efficiencies (as
measured by SPFH2). Space heating efficiencies is a function of heating delivering during the
heating season. There could be a slight drop off in efficiency of ground-source heat pumps at
low annual heat demands (below 5000 kWh) while the efficiency stabilises at higher levels of
heat delivery (Zotti & Nordman, 2012).
A similar evaluation could be done to evaluate the space heating efficiency (as SPFH2) for
both typologies as shown in Table 2.10.
Table 2.10: Water heating efficiencies for air- and ground-source heat pumps (as SPFH2).
Source: Carbon Saving Trust
SPFH2
Air source Ground source
Number 11 16
Average 2,34 2,35
Range 1,8-3,2 1,6-3,6
Page 32
18
The efficiency of water heating is strongly influenced by the temperature at which domestic
hot water is stored. The efficiency of water heating (as SPFH2) is a function of the average
temperature of the domestic hot water tank. In particular, we can expect the highest water
efficiencies in sites where domestic hot water tank has a very low temperature (30-40
degrees) (Charlick & Summerfield, 2013).
2.1.1.3 Conclusions about air source and ground source heat pumps
To sum up, some considerations could be made:
Space heating efficiencies are greater for the ground source heat pumps than for the air
source heat pumps (average SPFH2 of 3.21 against 2.73);
On average, water heating efficiencies are lower than space heating efficiencies (2.35
for both air and ground source, measured with SPFH2);
For some individual sites, water heating efficiencies may be higher than annual space
heating efficiencies since the amount of energy used for water heater is roughly
constant in the year, but space heating load increases with ambient temperature, while
space heating efficiency decreases with ambient temperature.
As already said, SPFH4 takes account of all electricity used by heating system and therefore is
the most appropriate measure of efficiency for householders to understand the costs and
benefits of a heat pump (Miara, 2007). According to Energy Saving Trust trial’s results was
possible to calculate SPFH4 for 15 air source and 22 ground source systems. The average
SPFH4 values were found to be 2.45 ± 0.11 for air source and 2.82 ± 0.10 for ground source
(Energy Saving Trust, 2013).
Several case studies generally indicate good performance as measured by SPFH2, with mean
values being 2.68 for air source heat pumps and 3.10 for ground source heat pumps (Baylon,
Strand, Davis, Robison, & Kruse, 2005).
From trial’s results, for 34 cases (14 air source and 20 ground source) it was possible to
calculate SPFH2 for space heating and the average space heating efficiencies, as SPFH2, were
found to be 2.73 for the air source and 3.21 for ground source heat pumps (Energy Saving
Trust, 2013).
Page 33
19
Finally, in 27 cases it was possible to calculate SPFH2 for water heating that was found to be
2.35 with no detectable differences between air and ground source heat pumps (Energy
Saving Trust, 2013).
2.1.1.4 Absorption heat pumps
Gas absorption heat pumps could be fired by natural or propane gas, they do not use any
refrigerants harmful to the environment and they are easy to install. Like the electric heat
pumps they use renewable energy (air, ground, water) and they can supply hot water for
heating in winter (Critoph, 2013).
The main differences with electric heat pumps are the use of a gas burned instead of an
electric compressor and the use of a water-ammonia solution instead of a refrigerant.
Another important thing to notice is that the primary energy source of this type of heat pumps
are rated differently than electric heating equipment since they use gas. Gas absorption heat
pumps efficiencies are rated with GUE (Gas Utilization Efficiency).
The field trial followed for electrically driven heat pumps did not consider on its analysis
absorption heat pumps. Therefore, it is possible to consult manufacturers’ web sites in order
to obtain some features that can define this typology of heat pumps.
According to Robur Corporation technical data it is possible to see that at nominal conditions
the heat energy of the unit’s absorption cycle combined with the heat extracted from the
outdoor air is approximately 126%.
Considering GAHP-A model, an air to water gas fired absorption heat pump with several
applications into residential sector, some features are available (Robur S.p.A., 2013):
Domestic hot water delivered at 65°C with net GUE of 1.24;
38 kW supplied to radiators at 50°C with net GUE of 1.38;
Efficiency over 129%, recovering 38% of renewable energy from air and saving up to
40% in operational costs compared to a condensing boiler;
Reduction the need of electric power by approximately 87% in comparison with
electrical compressor units.
Page 34
20
2.1.2 MicroCHP
Combined heat and power (CHP), or cogeneration, is the simultaneous production of useful
heat and electricity from a single source, close to the point of use (BDR Thermea, 2015).
MicroCHP refers to small-scale production of heat and power for individual commercial
buildings, apartments and individual homes. In particular, micro cogeneration unit shall mean
a cogeneration unit with a maximum capacity below 50 kWel (European Commision, 2004).
As in a conventional boiler, the heat is used for space heating and hot water, but unlike in a
conventional boiler, electricity produced can be used on site or exported to the national grid.
The electricity generated in this way leads to significant carbon savings and an important
determinant of the effectiveness of microCHP is the carbon intensity of the national electricity
supply. In countries where most electricity is derived from gas or coal, considerable carbon
savings arise (Sustainable Energy Authority of Ireland, 2011).
The efficiency of energy conversion to useful heat and power is potentially greater than by
using the traditional alternatives like boilers or conventional fossil fuels fired central
electricity generation systems. If managed properly this increased efficiency can result in
lower costs and a reduction in greenhouse gas emissions (Knight & Ugusal, 2005). In
addition, cogeneration has the advantage of diversifying electrical energy production, thus
potentially improving security of energy supply in the event of problems occurring with the
main electricity grid (Harrison & Redford, 2001).
With the ability to attain overall efficiencies above 90%, microCHP units meet the demand
for heating, space heating and hot water in buildings, while providing electricity to replace or
supplement the grid supply.
To have an overall view about the state or art of this technology it is possible to refer to a field
trial that the Sustainable Energy Authority of Ireland (SEAI) commissioned in 2009 to assess
the operation, performances and benefits of microCHP in residential and commercial
situations.
Thirteen sites were selected across Ireland and included both existing buildings and new build
developments; for each site measurements were made of the gas and the electricity consumed
and of the electricity generated and the heat produced (both for space heating and for hot
water) (Sustainable Energy Authority of Ireland, 2011).
Page 35
21
Data were collected from thirteen residential and commercial sites in Ireland, analysed in
terms of operation, performance, efficiency and potential energy and carbon savings. All
microCHP devices considered in the trial are internal combustion engines fed by natural gas.
According to field trial’s results engines operated between 70-90%, with majority 80-85%
and an average of 82% overall efficiency (Sustainable Energy Authority of Ireland, 2011).
The overall efficiency includes both electrical import and export, and thus accounts for the
efficiency of the engine while in standby mode as well as during periods of operation. The
amount of time an engine is in standby has a direct effect on the annual efficiency of the
appliance due to the electricity consumed during these periods. In particular, an engine that
only operates for limited periods is in standby for considerable time and will have a reduced
efficiency compared with a similar engine that operates for long period (Cogen Europe).
For thermal efficiency, that shows little seasonal variation, engines operate between 50-60%,
with majority between 55-60% and an average of 58% (Sustainable Energy Authority of
Ireland, 2011).
Concerning on electrical efficiency the range is between 20-30%, with majority between 20-
25% and an average of 24% (Sustainable Energy Authority of Ireland, 2011).
Thermal efficiency varies more than electrical efficiency, although the changes are not
significant. Electrical efficiency, however, remains almost constant and the difference is
accounted for by variations in fuel supply, operating conditions and demand (Sustainable
Energy Authority of Ireland, 2011).
Overall, thermal and electrical efficiencies are calculated as follows:
Overall efficiency = Heat + Electricity Generated ;
Gas and Electricity Consumed
Thermal efficiency = Heat Generated ;
Gas and Electricity Consumed
Electrical efficiency = Electricity Generated .
Gas and Electricity Consumed
Moreover, in the analysis a carbon benefit ratio (CBR) assessment was carried out for each
site. This is one way to measure the reduction of carbon emissions by offsetting the electricity
consumed from the grid. This parameter depends on:
Page 36
22
The carbon content on the fuel it uses to generate heat and power (although this
doesn’t vary much);
The carbon content of the grid supplied electricity that microCHP displace (this vary a
lot between countries).
Carbon benefit ratio is calculated as follows:
CBR% = (Heat Output * CEFgas + Electricity Generated * CEFelectricity) * 100
(Gas Used * CEFgas + Electricity Used * CEFelectricity)
where:
Heat output = Total heat output from microCHP appliance
Electricity generated = Gross electricity generated from the microCHP
Gas used = Total gas used by the microCHP
Electricity used = Total electricity used by the system (pump, fans,
controls, etc.)
CEFgas = Carbon emission factor for gas (kgCO2/kWh)
CEFelectricity = Carbon emission factor for electricity (kgCO2/kWh)
For Ireland it is possible to assume a value of CEFgas of 0.205 kg/kWh and for CEFelectricity
of 0.511 kg/kWh (SEAI, 2014).
According to the trial, all sites were shown to be saving carbon, with CBR values of over
115%, with majority operating between 120-130%. This means all sites are benefiting from
the microCHP appliances in terms of carbon emissions. Engines with the longest operational
hours displayed the highest efficiency and carbon savings (Sustainable Energy Authority of
Ireland, 2011).
The CBR does not take into consideration the efficiencies of alternative heat sources, such as
boilers. It is rather an absolute measure of carbon benefit that can be applied to any
technology (ene.field, 2014)
Page 37
23
Another important parameter for defining microCHP devices is primary energy savings (PES)
that is a measure of the energy savings provided by cogeneration. It is calculated as follows in
accordance with the EU Cogeneration Directive5:
PES = 1 - 1 (Sustainable Energy Authority of Ireland, 2011).
CHPHη + CHPEη
refHη refEη
where:
CHPHη is the heat efficiency of the cogeneration product defined as annual useful
heat output divided by the fuel input used to produce the sum of useful heat and
electricity from cogeneration;
refHη is the efficiency reference value for separate heat production;
CHPEη is the electrical efficiency of the cogeneration production defined as annual
electricity from cogeneration divided by the fuel input used to produce the sum of
useful heat output and electricity from cogeneration;
refEη is the efficiency reference value for separate electricity production.
The majority of sites have a primary energy saving of between 15% and 25%. This means
that, although each site uses more fuel to generate its own electricity, the larger reduction in
energy use in central power generation leads to net savings of 15% to 25%. As with efficiency
and CBR, PES are proportional to the length of time the engine is operational (Sustainable
Energy Authority of Ireland, 2011).
Another field trial that could be followed to get results of typical parameters of microCHP
devices is one carried out by Carbon Trust’s MicroCHP Accelerator between 2008 and 2010.
This was the first large-scale independent field trial of microCHP systems in domestic and
small commercial applications implemented in UK (Carbon Trust, 2011). 87 microCHP
systems, including 72 domestic Stirling engines and 15 internal combustion engine systems,
were installed and monitored in typical UK households and small commercial applications
(Carbon Trust, 2011). In particular, the domestic microCHP systems considered in the field
5 Directive 2004/8/EC of the European Parliament and of the Council of 21st December 2006 on established harmonised
efficiency reference values for separate production of electricity and heat.
Page 38
24
trial were all based on Stirling engines, installed as main heating system, providing both space
heating and domestic hot water to a single household; typically they have peak thermal
outputs in the range of 8-15 kW and peak electrical outputs in the range of 1-3 kW.
We can see which are the models featured in the field trial in the Table 2.11
Table 2.11. Domestic microCHP models featured in the field trial
Source: Carbon Trust
Manufacturer Model Technology
Whispergen Mk4 Stirling engine
Whispergen Mk5 Stirling engine
Microgen Microgen Stirling engine
Disenco Home Power Plant Stirling engine
Baxi Innotech Home Heat Centre PEM fuel cell
According to field trial’s results, the mean measured annual thermal efficiency was 71%, the
mean electrical efficiency was around 6% while the overall efficiency was 96%. Then, the
carbon benefit ratio of the electricity generated by the domestic microCHP systems was 88%
(Carbon Trust, 2011).
Due to electricity consumed in start-up and shut-down, the analysis showed that current
Stirling engine microCHP units typically need to operate for a minimum cycle length of over
one hour to provide an overall carbon saving benefits. Therefore, performances would be
expected to be poor for systems installed in households with relatively low heat demands and
for all systems during summertime (Carbon Trust, 2011).
After that, it is possible to analyse the differences among technologies that run microCHP
devices. These five main categories are:
Stirling engines;
Internal combustion engines;
Fuel cells;
Organic Rankine cycles;
Gas turbines.
Page 39
25
With the exception of fuel cells, all of them use an engine as a generator and thus produce
electricity.
2.1.2.1 Stirling engines
Stirling engines are external combustion engines used in a much smaller proportion of
microCHP units, although they are gaining in popularity. They are currently being launched
into the domestic market as a replacement for gas boilers (Sustainable Energy Authority of
Ireland, 2011).
In theory, these engines are very efficiency; in practice on the market, they have an electrical
efficiency of about 10%. Moreover, they have small sizes and limited range of outputs that
make them less attractive in the commercial market (Department of Energy & Climate
Change, 2008).
Overall, the domestic Stirling engines microCHP systems achieved a carbon saving of around
5%, although the performances in individual households varied considerably. The Stirling
engines microCHP systems performed better in households with higher heat demands
(typically larger detached houses with four or more bedrooms).
Some features, taken from different manufacturers, are shown in Table 2.12.
Table 2.12. Features of Stirling engines microCHP systems.
Sources: Different companies’ web sites
Manufacturer Applications Electrical
Output
Thermal
Output
Cost Features
Whispergen (Mk4, Mk5)
Individual
family home
1 kWe 7 kWt € 14000
(installed
cost)
Availability
in Germany
since 2010
Baxi Ecogen Individual
family home
1 kWe 3-24 kWt £ 6-8000
(installed
cost)
Availability
in UK since
2010
Vaillant (Eco Power
1.0) Single
family home
1 kWe
(Electrical
efficiency
26.3%)
2.5 kWt / Overall
efficiency
92%
Page 40
26
Infinia (STC)
Individual
family home
1 kWe 4-40 kWt £ 6-8000
(supply cost
only, 2010)
Limited
availability,
2012
Disenco (Inspirit)
Homes
0.5-3 kWe 4-40 kWt / /
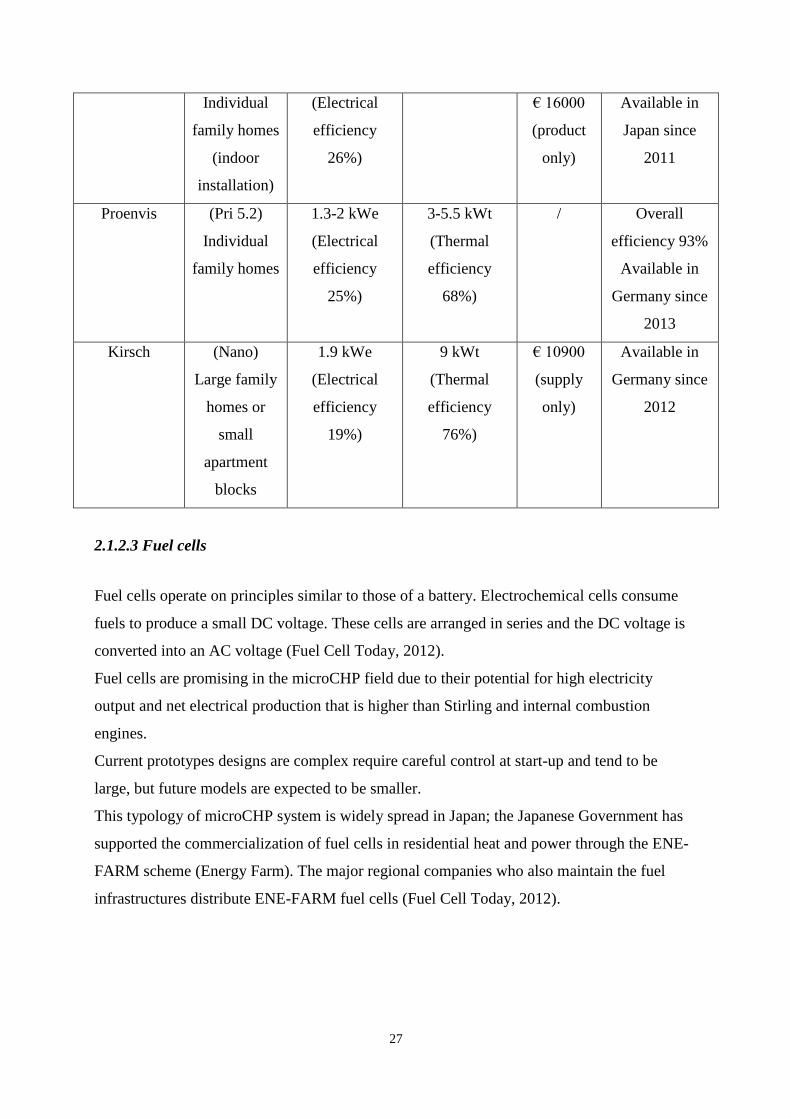
2.1.2.2 Internal combustion engines
The internal combustion engine microCHP are based on the automotive engine and are the
most established of all microCHP appliances. The majority of these engines could be
modified to improve their longevity (Sustainable Energy Authority of Ireland, 2011).
To maximise economic benefits, residential and small commercial scale microCHP should
operate for over 3000 hours/year. They have been used primarily in the commercial sector
(with 20-25% average electrical efficiency) and designs that are more modern can vary their
output, based on the demand for heat and/or electricity.
These products are also suited for family homes with electrical output around 1 kWe and
thermal output around 3 kWt; generally they work with electrical efficiency around 25% and
have lower heat output compared with Stirling engines (Sustainable Energy Authority of
Ireland, 2011).
Different characteristics of these microCHP systems are shown in Table 2.13.
Table 2.13. Features of internal engines microCHP systems.
Sources: Different companies’ web sites
Manufacturer Applications Electrical
Output
Thermal
Output
Cost Features
Honda (Ecowill)
Individual
family homes
1.2 kWe 3 kWt £ 5600
(installed
cost)
Overall
efficiency 85%
Available in
Japan since
2003
Vaillant (EcoPOWER
1.0)
1 kWe 2.5 kWt € 23000
(installed
cost)
Overall
efficiency 92%
Page 41
27
Individual
family homes
(indoor
installation)
(Electrical
efficiency
26%)
€ 16000
(product
only)
Available in
Japan since
2011
Proenvis (Pri 5.2)
Individual
family homes
1.3-2 kWe
(Electrical
efficiency
25%)
3-5.5 kWt
(Thermal
efficiency
68%)
/ Overall
efficiency 93%
Available in
Germany since
2013
Kirsch (Nano)
Large family
homes or
small
apartment
blocks
1.9 kWe
(Electrical
efficiency
19%)
9 kWt
(Thermal
efficiency
76%)
€ 10900
(supply
only)
Available in
Germany since
2012
2.1.2.3 Fuel cells
Fuel cells operate on principles similar to those of a battery. Electrochemical cells consume
fuels to produce a small DC voltage. These cells are arranged in series and the DC voltage is
converted into an AC voltage (Fuel Cell Today, 2012).
Fuel cells are promising in the microCHP field due to their potential for high electricity
output and net electrical production that is higher than Stirling and internal combustion
engines.
Current prototypes designs are complex require careful control at start-up and tend to be
large, but future models are expected to be smaller.
This typology of microCHP system is widely spread in Japan; the Japanese Government has
supported the commercialization of fuel cells in residential heat and power through the ENE-
FARM scheme (Energy Farm). The major regional companies who also maintain the fuel
infrastructures distribute ENE-FARM fuel cells (Fuel Cell Today, 2012).
Page 42
28
It is possible to report some features, taken from manufacturers’ web sites, of PEMFC6 and
SOFC7 technologies as reported in Table 2.14 and Table 2.15. A few companies have
launched products down-rated from 1 kWe to around 700 We to minimise the export.
Table 2.14. Features of fuel cells microCHP systems (PEMFC typology).
Sources: Different companies’ web sites
Manufacturer Electrical Output Thermal
Output
Cost Features
Toshiba 700 We (Electrical
efficiency 35%)
/ $ 20000 Equipped with a
supplementary
heater to provide
operational
flexibility
Available in Japan
since 2009
Baxi Innotech 1 kWe (Electrical
efficiency 32%)
1.7-20 kWt / Field trial in
Germany and UK
Elcore 300 We (Electrical
efficiency 33%)
600 Wt
(Thermal
efficiency
65%)
€ 9000
(installed
cost)
First field trial
installation in
2013
Viessman 750 We (Electrical
efficiency 37%)
1 kWt+ 19
kWt with
boiler
(Thermal
efficiency
53%)
€ 36000
(including
installation)
Available in
Germany since
2014
Panasonic 700 We (Electrical
efficiency > 40%)
940 Wt € 25000 Available in Japan
since 2011, in
Europe since 2014
6 PEMFC (Proton Exchange Membrane Fuel Cell).
7 SOFC (Solid Oxid Fuel Cell).
Page 43
29
JX Eneos 700 We (Electrical
efficiency 40%)
/ $ 31000 Available in Japan
since 2011
SOFC technology was largely considered as unsuitable for microCHP due to its relative
inflexibility to modulate power output and limitations in thermal cycling. However, the high
potential efficiency, the ability to reform fuel and other technical features may eventually
make this technology the leading for microCHP (Fuel Cell Today, 2012). Some technical
features are reported in table 2.15.
Table 2.15. Features of fuel cells microCHP systems (SOFC typology).
Sources: Different companies’ web sites
Manufacturer Electrical Output Thermal
Output
Cost Features
Ceramic Fuel
Cells
(Bluegen)
1.5 kWe (Electrical
effiency 60%)
600 Wt
(Thermal
efficiency 25%)
€ 25000 Bluegen 1.5 kWe
available in UK
and Germany
Acumentrics 250 W- 10 kW
(Electrical
efficiency increases
with nominal
capacity
improvement)
/ / Overall
efficiency 90%
with heat
recovery
Available since
2013
JX Eneos 700 We (Electrical
efficiency 45%)
/ $ 31000
(retail)
Available in
Japan since 2012
2.1.2.4 Organic Rankine cycles
An organic Rankine cycle (ORC) microCHP uses a working fluid that is first pumped through
a boiler, then evaporated and passed through a turbine and finally condensed. The fluid is
organic and usually have a lower boiling point than that of water (Sustainable Energy
Authority of Ireland, 2011).
Page 44
30
Some ORC engines are quite small and light, with theoretical net electrical efficiency up to
17% and some units can vary their output in response of the heating demand (Zywica,
Kicinski, & Ihnatowicz, 2015).
There are several large biomass machines installed in continental Europe but in practise this
technology is still at the field trial stage for domestic applications.
Overall, typical applications are:
Low enthalpy geothermal plants;
CHP biomass powered plants, in the range between 400 and 1500 kWe;
Heat recovery applications, in the range from 400 to 1500 kWe;
Solar applications.
2.1.2.5 Gas turbines
A gas turbine microCHP unit works by mixing air and gas in the combustion chamber and
igniting it. There are many theoretical advantages to gas turbine used for microCHP like high
efficiency, clean combustion and low maintenance but despite these advantages, they are still
more expensive than internal combustion engines (Sustainable Energy Authority of Ireland,
2011). This is due to the few moving parts, lower operation and maintenance that make them
comparable with internal combustion engines.
However, they are more widespread than Stirling and internal combustion engines in the
market.
2.2 Business models for residential space heating
While there is a great deal of literature on the subject of business models for distributed
energy technologies (Boehnke J. W., 2007), some common terms have been established and
alternative models are beginning to emerge (The MIT Energy Initiative, 2013), (Parker,
2015). . Using a definition from one of the foremost experts in distributed energy
technologies business models, ‘A business model could be defined as a strategy to invest in a
particular technology which creates value and leads to an increased penetration of this
technology in the built environment. Therefore, it is a description of a planned or existing
Page 45
31
business that includes information on value creation and market orientation’ (Würtenberger,
2012).
The importance of business models as topics for innovation have been increasing with the
advent of e-commerce since due to the need for new strategic analysis tools that provide firms
with a mechanism to prove how they create value and how they compete in the market. The
internet has been a disruptive force that completely changed the way traditional business was
conducted and created new opportunities for value proposition, revenue models and
configurations (Boehnke, 2007). For example, a successful business model can show how
financing and implementation of certain technologies in buildings are organised such that
barriers for deployment can be overcame.
Business models describe the structure and strategy behind a business case. Structural
components such as value proposition, key activities, cost structures and revenue streams are
important operational focus areas of a business. The strategic parameters of a business model
captures the logic and reasoning for initiating an activity i.e. an investment in the built
environment due changes in the market. The reasoning may also include a financial
calculation to show the profitability of the planned investment.
2.2.1 Components of business models
The market components of a business model define how a company delivers value. Four main
components can be distinguished i.e. value proposition, strategy, customers and revenue
model (Boehnke, 2007).
The value proposition shows the benefits that a business model creates for stakeholders and
eventually the final customer.
The strategy component describes the ability of a business to compete, relative to the value
proposition and to transformational strategies directed towards changing the market
environment.
The customer base must be understood since it is essential to be aware of target groups in
order to prepare a coherent value proposition.
Finally, the revenue model describes how the value delivered to the market is translated into
sale revenues and profits (Boehnke, 2007), (Berthold Hannes, 2013).
It is important that all components of a business model fits together. For example, the
strategy, the customer base and the revenue model must be logically related to the value
proposition. Moreover, value partners and the value creation architecture must be fit for
Page 46
32
purpose and in-line with the company’s strategic resources. Finally, great reciprocity is
between the market and the configuration components reflected in the design of a business
model. Hence, we should expect to see businesses with well-designed business models secure
a commensurate place in the market.
2.2.2 Business models situation for microCHP devices in residential
buildings
Residential microCHP energy markets play a key role for increasing liberalisation and for
fundamental changes through developments such as the trend towards decentralisation. In
particular, residential microCHP has the potential to be disruptive for existing energy supply
systems and to impact market dynamics. One of the most interesting components of a
microCHP business model is the value proposition for consumers to change their energy
supply to microCHP since it gives them a way to save money on their energy bills (Boehnke,
2007). Strategically, the microCHP since business model can complete in the market as a low
cost solution either in comparison to other micro cogeneration products or in comparison to
other options for supplying residential buildings (Boehnke, 2007).
In accordance with value proposition and strategy, microCHP business models must identify
the right customers for their products that could be both final consumers and partners.
Specifically for three groups of customers: those that actively look for environmental benefits
(eco-active), customers that view environmental benefits as an additional aspect of product
quality (eco-rational) and finally those that do not give additional value to the environmental
benefits (eco-passive) (Ecuity Consulting LLP, 2013), (Environment, 2015).
It is then useful to analyse the market status and the potential to reduce carbon emissions with
microCHP installations in appropriate domestic and residential applications. Generating own
power with microCHP can also improve power resilience.
In Japan, as in many countries, the power to most residential buildings is supplied from
centralized power generation plants over the national electricity grid. The introduction of
distributed sustainable energy systems, as recommended for residential buildings and the
large-scale adoption of distributed generation units such as microCHP could radically change
the electricity system turning consumers into producers. The Japanese government has
supported the residential-based ENE-FARM fuel cells microCHP since 2009, providing
subsides to reduce the system cost to consumers and after the 2011 earthquake and tsunami
Page 47
33
there has been a growing interest for producing from renewable energy. In Japan the main
technology used for microCHP is the fuel cell and the goal is to install 5.3 million residential
ENE-FARM units by 2030 (Curtin, 2013).
In January 2013, the European project Ene.field began with the ambition to be the largest
European-based demonstration of fuel cell-based microCHP. This is a five-year project co-
funded with the European Commission and 26 partners across the heating and energy industry
that will deploy up to 1000 residential fuel cell installation across several countries in this
period (Fuel Cells and Hydrogen Joint Undertaking Programme, 2013).
Such as the ENE-FARM program in Japan, the Ene.field program is supported by
governments of each country where devices are installed, co-funded by the partners and the
European Commission’s Fuel Cells and Hydrogen Joint Undertaking Programme (FCH JU).
In both cases, the main objectives of these two projects are to show the market potential, cost
and environmental benefits of using microCHP devices in residences and to create a more
mature supply chain ready for installations of large number of these appliances. Moreover,
especially in Japan, this governmental programme wants to make microCHP technology cost,
particularly for fuel cells, more competitive lowering their price through mass-production.
This case is a strong example for showing how important government intervention can be to
foster the market in order to make distributed energy technologies (such as microCHP) a
competitive and attractive solution for consumers.
2.2.2.1 Market players
It is possible to define the main characteristics of the market for the residential microCHP
starting with a definition of who are the market players involved in selling and purchasing the
products (Boehnke, 2007).
On the supply side market players can be divided into four groups that are:
Equipment manufacturers and merchants i.e. companies that produce microCHP;
Service providers that install equipment in consumer homes and by advising residents
to use micro cogeneration equipment. Usually service providers are developed by
energy supply companies;
Providers of infrastructure in particular fuel suppliers (natural gas mainly) and also
electricity network operators;
Page 48
34
Financers such as venture capitalist, banks or investment funds that encourage market
development by investing in microCHP and by starting their experience and
knowledge.
On the demand side market players can be split into:
Landlords that agree to install the microCHP device and usually pay the set-up costs.
Moreover for rental residences an incentive to involve occupants in the new
decentralized scheme economically may be needed;
Occupants who can be classified such as for landlords, according to the location, age
and size of the residence;
Creditors (typically banks) less concerned with the installation of microCHP devices
and rather more involved in purchasing decisions.
2.2.2.2 Market drivers and penetration
According to (Boehnke, 2007), market drivers for microCHP in residential buildings can be
divided in four categories that are:
Structural market drivers which are related to the situation of energy system and
dwellings. Main items of this group that affect diffusion of microCHP devices are
energy prices, availability of fuels, design of electricity networks and built
environment;
Technological market drivers study suitability of microCHP installations for
residential buildings. In this area the crucial entries are performance factors,
convenience factors, costs and financing;
Social market drivers associated with people involved in the decision about installing
or not the microCHP device. In this case one can analyse features that are related to
consumers mind and their behaviour such as opinions about microCHP, education and
motivation of consumers;
Political market drivers i.e. the impact that public institutions have on the market for
residential microCHP. An example of that was given before analysing differences
between Europe and Japan situations. Governmental actions, incentives and
regulations could concern structural, technological and social market drivers.
Page 49
35
Since political measures influence other market drivers one can see how there are a large
number of policies that influence positively market development. Policies supporting
microCHP can be targeted directly at particular technologies for residential cogeneration, e.g.
internal combustion engine, or for microCHP in general.
2.2.2.3 Market barriers
It is important then to analyse the larger obstacles that can prevent a wider diffusion of
microCHP products. Barriers exist with respect to each of the market drivers shown and can
be grouped similarly (Boehnke, 2007):
Structural market barriers e.g. low power price and feed-in-tariff schemes not
transparent;
Technological market barriers e.g. weak efficiencies under part load or high noise and
vibration levels for ICE;
Social market barriers for example insufficient knowledge about microCHP
technology;
Political market barriers such as no promotion of residential microCHP and little
effort to improve its image and minimal governmental sponsored incentives.
These barriers can be overcome with appropriate policies for each. With regard to market
liberalisation, easier network access for microCHP or building regulations that require
developers to consider microCHP. For structural barriers, tax incentives or active
participation of public institutions in development projects. For technological, social and
political barriers financial incentives from the government for both consumers and
technologists, institutionalised marketing campaigns or education or education programmes
for consumers including community outreach programmes such as the Renewable Energy
Hub8 that connects stakeholders in the sector.
8 https://www.renewableenergyhub.co.uk/
Page 50
36
2.2.3 Business models situation for heat pumps in residential buildings
The number of heat pump units in the European heat pump market increased by 3% in 2013
and during the last 20 years, the total amount of installed heat pumps has exceeded 6.74
million (EHPA, 2014).
Table 2.16. Heat pumps in Europe sales and stock (2005-2013).
Source: EHPA, 2014
Sum
EU-11
Sum
EU-21 Total Stock
2005 446 037 1 015 607
2006 504 428 1 525 401
2007 568 131 2 114 519
2008 770 538 2 918 976
2009 686 076 3 644 998
2010 671 392 800 388 4 437 530
2011 666 873 808 591 5 237 003
2012 621 818 750 436 5 979 042
2013 636 639 769 879 6 741 251
Global heat pump market is driven by growing demand of technology using renewable energy
resources and emitting less CO2 (Future Market Insights, 2015).
Government commissions and programs have activated also for heat pumps in order to foster
the development and market adoption of this advanced, energy-efficient technology. In
particular, main efforts regarded ground-source and advanced air-source heat pumps.
GSHPs (ground-source heat pumps) technology has gradually improved in last years and has
achieved a growing share in heating, cooling and sometimes water heating equipment markets
with modest policy strength (Goetzler, 2009).
Historically ASHPs (air-source heat pumps) have been used for heating and cooling in
moderate climate but this trend changed in recent years as high natural gas prices and
advanced technology that avoids resistance heating during cold weather make this type of
heat pumps attractive also for colder climates. Therefore, in the future we can expect to have
more air-source heat pumps used in cold climate (Goetzler, 2009).
Page 51
37
It is again possible to evaluate the market status of heat pump devices.
The global heat pump market is geographically segmented into seven key regions: North
America, South America, Eastern Europe, Western Europe, Asia Pacific, Japan and Middle
East & Africa. Europe holds the major share in global heat pump market, followed by North
America and Asia Pacific (Future Market Insights, 2015).
GSHPs are a small fraction of the global installed capacity for space-conditioning
applications. However, in recent years they have grown dramatically especially in North
America and Europe (Lund, 2013).
In Europe, there are several cases where trade associations were formed to promote heat
pumps and develop education and training programs in order to achieve the market growth.
Two examples of this are the European Heat Pump Association9 and the Heat Pump
Association in the UK10.
The Asian heat pump market is less established than in Europe and America. However, there
has been some recent growth in China and Japan with also activities of research and
development (Navigant Consulting, 2009).
This brief introduction shows the uptake of GSHPs and ASHPs in different markets
worldwide. A comprehensive analysis of energy-savings potential of this technology is
beyond the scope of this work, however, is possible to quickly show that the cost and
performance of GSHPs and advanced ASHPs will vary significantly depending on regional
construction practices, climate conditions and utility rates.
2.2.3.1 Market players
For the heat pumps, the market players are the same of those shown for the microCHP
situation.
2.2.3.2 Market drivers and penetration
It is possible to show the market penetration of GSHPs and advanced ASHPs as a function of
an economic parameter, usually the simply payback period. This criterion is used to represent
the economic attractiveness of those two types of heat pumps compared to alternative
technologies.
9 http://www.ehpa.org/ 10 http://www.heatpumps.org.uk/
Page 52
38
If payback periods are of five years or longer, the market penetration of a technology will be
lower. Usually a five-year payback is considered as threshold for widespread market adoption
of a certain technology. Moreover, payback periods of ten years suggest that those
applications are limited to niche market (Goetzler, 2009).
As seen for microCHP technology also for heat pumps one can observe how market
penetration of these devices depends on many factors that are not accounted for by simply
payback period. In particular, for space conditioning equipment these factors include:
Percent increase in first cost;
Degree of knowledge of brands that are present in the market;
Product warranties offered;
Success of marketing and promotional campaigns or branding;
Non-energy benefits such as comfort or noise;
Degree of interruption associated with new installations;
Desire of having “green image” technology by end-users.
Again, it is possible to confront these aspects with drivers reported for the microCHP and it
can be shown that there is similarity between these two technologies concerning market
penetration levels.
2.2.3.3 Market barriers
In order to evaluate how advanced ASHPs and GSHPs are diffused into the market the
barriers to uptake must be considered:
Technological barriers such as poor performance or poor reliability mainly due to
low manufacturing volumes, immature product design, high refrigerant cost, high
cost of materials, etc.;
Market barriers such as high installation costs result in poor payback, space
constraints in many urban area, operating cost dependent upon electricity pride,
etc.;
Lack of awareness by the residents;
Lack of familiarity that affects cost or discourages potential users;
Lack of supporting sales, installation and service infrastructure;
Page 53
39
Limited number of qualified, trained installers;
Restrictions due to environmental regulations.
By analysis, we can see that these barriers are quite similar to those presented for microCHP
market; generally, it is possible to observe how it is always a matter of structural, technical,
social and political issues.
Both advanced ASHPs and GSHPs show potential for important unit energy savings that
returns a deployment of these technologies into the market. However, while GSHPs generally
have efficiency advantages, advanced ASHPs tend to be more economical (following the
simple payback period results). GSHPs market may expand for many years probably without
capture a major area of heat pumps market (Hofmeister, 2014).
In order to foster a penetration in the market of energy efficient heat pumps should be
supported with incentives such as federal tax credit or utility rebates based on energy
efficiency achievements. In addition, for first-cost reductions for GSHPs one can evaluate
potential economies of scale, alternative business models and potential partnering
relationships.
Finally, to overcome social barriers there can be some promotional actives such as:
Support training for designers and installers;
Consider partnerships to create new business models in order to reduce costs;
Promote information programs;
Work together with local governments, utilities, developers, manufacturers and
installers to create community-based systems.
2.2.4 Business models applicable for both technologies in residential
buildings
Based on the common drivers for value creation, business models for these two technologies
in the built environment can be distinguished among:
Product Service Systems (PSS) are business models that make use of the delivery of
the function of a product combined with relevant service. ESCOs are the most
important examples of the PPS business models in the energy sectors (Würtenberger,
2012). Other contracting forms can also been relevant such as Energy Supply
Page 54
40
Contracting (ESC), Energy Performing Contracting (EPC) and the combination of
those could be used called Integrated Energy Contracting (IEC) (Hofmeister, 2014).
These can be explained as follows:
1. In the ESC typology a contractor implement measures that insures the heat supply
and also finance them and it is repaid from the payment for heat;
2. In the EPC model, the contractor implements measures that reduce energy use,
finance them and it is repaid from the savings;
3. For the IEC model, there is a combination of supply of useful energy with energy
conservation measure in the whole building (Bertoldi, 2013).
Leasing of renewable energy equipment that enables a building owner to use and
energy installation without having to buy it;
Feed-in remuneration scheme where the producer of energy receives a direct payment
per unit of energy produced.
2.2.4.1 ESCO
There are common features for an ESCO business model suitable for both microCHP and heat
pump devices. In general, ESCO’s remuneration is performance based paid on the measured
outputs as opposed to the inputs consumed and it guarantees for the result and for all cost of
the service package. All ESCO business models lead to a reduction of final energy demand
and achieve environmental benefits due to the associated energy and emission savings in
addition to non-energetic benefits, e.g. an increase in comfort (Bertoldi, 2013). Typically, an
ESCO acts as a general contractor and implements a customized service package (e.g. design,
installation, (co-)financing, operation & maintenance, optimization, fuel purchase, user
motivation) (Bleyl, 2008).
For implementation, the building owner assigns a customized energy service package and
demands guarantees for the results of the measure taken by the ESCO. The necessary
components for implementing energy projects are mainly:
Technology (suppliers, construction, operation & maintenance, etc.);
Know-how (engineers, architects, consultants, innovation, etc.);
Page 55
41
Energy (gas, fuel oil, etc.);
Money (capital, banks, subsides, etc.);
Legislative framework (laws, technical rules, etc.).
It is possible to observe how an ESCO works from the Figure 2.2.
Figure 2.2. Different services of the ESCO.
Source: Bleyl, 2009
Main actors in this business model are ESCO itself and the business owner. Usually
outsourcing of up-front costs is often the key driver to engage with the ESCO and it could
happen that ESCOs are not able to offer attractive financing conditions in comparison to a
building owner, especially when the client is a large organization. Therefore, the ESCO
service package does not necessarily need to include financing, it could be provided by the
building owner, the ESCO or a third financing partner, depending on who has better access to
capital and financing conditions (Würtenberger, 2012).
Combinations of these options are also possible to account for the specific project and actors
involved and many times a mixture of these financing sources is often the best choice to
balance risks.
2.2.4.2 ESC
In an Energy Supply Contracting (ESC) model, an ESCO supplies energy such as electricity
or hot water to a building owner or building user. The ESCO’s remuneration is performance
Page 56
42
based and depends on the useful energy output delivered. This business model gives the
building owner the opportunity to outsource technical and commercial risks associated with
energy supply related activities (e.g. planning, installation, operation & maintenance,
financing for heating, etc.) (Bertoldi M. R., 2010).
ESC is suitable for district and small-scale heating networks so it is used for microCHP
systems and particularly for geothermal applications since its energy can be measured with
little effort through electricity or heat meters.
Then the ESC model could implement efficient supply from fossil fuels (suitable for
microCHP) and renewable sources (apt for both ASHPs and principally GSHPs) for several
facilities, including residential buildings. It is effective in reducing final energy demand since
the ESCO pays for the final energy needed and it is remunerated just for its useful energy
output.
Finally, this is the most popular form of contract and service and it is dominant in France,
Italy and Spain and very popular in Germany and UK (Atanasiu, 2011).
2.2.4.3 EPC
Under an Energy Performance Contracting (EPC) business model, an ESCO guarantees
energy cost savings in comparison to historical or calculated energy cost baseline
(Würtenberger, 2012).
For its services and the savings guarantee, the ESCO receives performance-based
remuneration in relation to the savings it achieves. The ESCO is responsible for the
implementation and operation of the energy efficiency package and its own expenses and risk,
according to the project specific requirements. At the end of the contract term, the facility
owner benefits from the fuel energy cost savings, but all operation and maintenance amounts
are included in the account.
This type of contract may realize savings for all energy shippers such as electricity, gas or
water and typical sectors could be air conditioning systems, lighting or district heating
connection. Therefore, it could be suited for microCHP or heat pumps technologies. In
addition, EPC business model is increasing market share in most European countries, in
particular Germany, UK, Italy and France (Atanasiu, 2011).
Page 57
43
2.2.4.4 IEC
The Integrated Energy-Contracting (IEC) business model is a hybrid of ESC and EPC and its
aims are reduction of energy demand through the implementation of energy efficiency
measures and user behaviour and efficient supply of the remaining useful energy demand. As
with ESC and EPC, IEC business model offers the building owner the choice to outsource
technical and economic risks to a professional third party and to buy services instead of
individual components (Würtenberger, 2012).
The ESCO is responsible for the implementation and operation of the energy efficiency
package at its own expenses and risk, according to the project specific requirement defined by
the client and the ESCO. (Bertoldi I. L., 2013) IEC is built on ESC model so it could be
applicable in a similarly range of end-users sectors included residential buildings. Moreover,
since IEC combines energy efficiency and energy measures all technologies drafted in the
ESC and EPC business model descriptions are applicable comprised microCHP and heat
pumps devices.
To sum up it is possible to define the main features of an ESCO and its principal aims
independently by the typology of contracts. An ESCO is a means to deliver energy efficiency
improvements to facilities through typical services (e.g. energy audits, engineering design,
construction, operation and maintenance, etc.). ESCOs are traditionally focused on the public
sector buildings. However, due to European policies on heating and cooling (European
Commission, 2016), the ESCO market is increasingly expanding into residential buildings
(chiefly multifamily buildings) sector in several countries (e.g. Germany, Estonia, France,
Italy and Ireland as well) including deep retrofits, and in the district heating market (VTT
Technical Research Centre, 2012).
Several barriers that could affect the diffusion of ESCOs include low awareness, lack of
information about the ESCO concept, scepticism on the client’s side, non-supportive rules,
public budgeting rules, etc., and may be overcome by enabling factors such as standard
procedures and documents, dissemination of information for clients, policies, liberalization of
the energy markets, etc.
In conclusion basic conditions for a strong ESCO market are:
Creation of a long-term comprehensive energy efficiency programmes and facilitate
financing;
Page 58
44
Creation of a clear legislative framework and establishment of appropriate market
instruments and mechanisms;
To educate the users and financial people is critical needed in most countries;
To enhance the public acceptance of ESCOs with focused policy support and
supportive policy frameworks;
To establish and ESCOs association and enhance the collaboration with national
energy agencies (Atanasiu, 2011).
2.2.4.6 Leasing
Leasing permits a building owner to use an energy installation without buying it. The
installation is owned or invested in by another party usually a financial institution such as a
bank and the building owner pays a periodic lease payment to that party (Activum, 2011).
Generally, the financial institution remains owner of the resource during the lease period;
there are several types of leasing possible depending on ownership and other economical,
legal and fiscal conditions. It can be a central component of the business model on an ESCO
which has limited own capital and therefore also limited access to debt but it could lease
equipment from a financial institution and it can also be a central component of the business
model of a company that introduces a specific new technology to the market. (Würtenberger,
2012)
Leasing could be applicable to all types of buildings even residential and it could be available
especially for microCHP systems and for heat pumps.
Three of the most common leasing arrangements include:
In the first situation shown in Figure 2.3 a building owner leases the technology, such
as microCHP or heat pump, directly from a bank which owns the equipment. In
exchange the building owner pays a periodic lease rate during the contract period
which includes interest share (Würtenberger, 2012);
Page 59
45
Figure 2.3. Lease agreement with directly involvement of financial institution.
Source: Bleyl, 2009
In the second situation, an ESCO undertakes the negotiation with the financial
institution, provides additional services to the building owner and remains the lessee
of the equipment that is still owned by the financial institution itself. This situation is
represent in Figure 2.4:
Figure 2.4. Lease agreement with involvement of an ESCO.
Source: Bleyl, 2009
In the third option, a provider of microCHP or heat pump device leases the system to
private customer and the technology provider usually also guarantees operation and
maintenance service for the equipment as shown in Figure 2.5;
Figure 2.5. Leasing arrangement between a company distributing a technology and a building owner.
Source: Bleyl, 2009
Page 60
46
The main advantage of a lease for a building owner is that the leased equipment can be used
without having to invest in it. A maintenance contract could be offered in combination with
the lease in order to reduce the effort required by the building owner and the technical risk for
the lessor.
Generally, leasing is more expensive than taking a loan or financing the equipment otherwise
(Würtenberger, 2012). Moreover, another element of weakness could be that banks are
sometimes hesitant to offer leases since energy is not their core business and they may not
want to assume operational risks.
2.2.4.7 Feed-in remuneration scheme
A feed-in scheme is a policy where the owner or the producer of energy receives a direct
payment per unit of energy produced. This feed-in remuneration can be a tariff that covers the
full generating costs or a premium that is a bonus for the owner to cover the financial gap
accumulated for not using fossil fuels.
Feed-in based business models are applicable for all market segments, included residential
buildings. The two main actors in a feed-in scheme are the institution that makes the payment
available (government, network operator) and the recipient (homeowner, building manager or
ESCO). The actual payment can be executed through a government agency, the energy
supplier or through the network operator (Würtenberger, 2012). A feed-in scheme is a policy
so the government fixes the tariffs and budgets and the cost of this support is recovered both
from the government budget (i.e. from taxpayers) and from a network operator enlarges on
energy bill (i.e. from energy consumers).
The main advantage of a feed-in based business model is that it has a predictable and stable
long-term cash flow from a credit-worthy counterpart (Glifford, 2011). Conversely, the
weakness is that tariffs set may deviate from the real costs. Investors that plan multiple
investments over time do require trust in government to keep the stability of the feed-in
system, which may be difficult if the government allows itself too much flexibility and
changes from year to year (Würtenberger, 2012).
Page 61
47
2.3 Electricity and gas prices in Ireland
The aim of this chapter is to explain the main aspects that affect electricity and gas prices in
Ireland in order to describe the context in which this thesis work is carried out.
The increase in energy prices over the past number of years is a key concern for all energy
consumers in Ireland, as they have influence on consumer spending and market
competitiveness. Understanding the main contributing factors and the precise impacts of
energy price changes are of key importance in developing appropriate, sensible and measured
responses from business, householders and policymakers (Sustainable Energy Authority of
Ireland, 2015).
Many factors influence energy prices in Ireland and, generally, in many other countries such
as:
Global energy prices: the most significant factor affecting energy prices in Ireland is
the instability of global oil prices. This has particular effect on Ireland due to its high
dependence on oil. In addition, there is the knock-on impact that oil prices have on
other energy prices, in particular natural gas.
Fuel mix electricity generation: This is particularly significant with respect to an
electricity fuel mix that relies on internationally traded fuels like gas, oil and coal.
During periods of volatile price movements in these fuels, there is a strong knock-on
impact on electricity prices. (Sustainable Energy Authority of Ireland, 2015). Ireland
has high overall dependency of electricity generation from fossil fuels (68%) with also
high dependency on oil and gas generation (49%).
Investment in electricity and gas infrastructure: It depends on the level of costs and
the extent to which these costs are passed through to final consumer. Ireland depends
on an extensive high voltage transmission network and a medium low voltage
distribution network to transport electricity from generation locations to consumers.
Gaslink has operated the natural gas transmission network in Ireland since 2008;
according to the latest forecast from Gas Network Ireland (GNI) annual report (Gas
Network Ireland , 2014), Ireland’s transmission network infrastructure has sufficient
capacity to transport anticipated gas demand to all end consumers into the near future.
Page 62
48
Share of taxes in the prices paid by consumers in Europe: Business can generally
recover value-added tax (VAT). However, other taxes (including energy taxes, carbon
taxes and climate-change levies) are typically not recoverable so the level of ex-VAT
taxes is important especially when considering the business case for creating an in-
country footprint. In addition, a Public Service Obligation (PSO) levy is charged to all
electricity customers. The PSO levy support certain peat, gas and renewable
generation plants, it is mandated by Government and approved by European
Commission. (Eurostat, 2016).
Consumption volume (seasonal) effect on average unit price: This effect is due to the
fixed costs (standing charges, levies, etc.) that form a larger proportion of the average
price based on the consumption volume. This is also known as a seasonal effect, and it
is more pronounced in the household gas price than in the household electricity price
and larger at the lower consumption levels.
Purchasing power: When comparing prices of goods across countries, it is important
to correct for differences in currencies and for the differences in income and living
standards. This is particularly important when comparing prices paid by residential
consumers. (Sustainable Energy Authority of Ireland, 2015). Another factor affecting
gas and electricity prices in a country is the costs associated with labour and services.
2.3.1 Residential electricity prices
For households, electricity prices incorporate all charges payable that may include energy
consumed, network charges, other charges (capacity charges, commercialisation, meter rental,
etc.), all netted for any rebates or premiums due.
The Member States develop and implement cost-effective procedures to ensure the
establishment of data compilation system based on the following rules (Sustainable Energy
Authority of Ireland, 2015):
Prices represent weighted average prices, using the market share of the electricity
suppliers surveyed as weighting factors;
Page 63
49
Arithmetic average prices are provided only when weighted figures cannot be
calculated;
Weighted average prices are used in Ireland and represent the full market.
Market shares are based on the quantity of electricity invoiced by electricity supply
undertakings to household end-users. If possible, the market shares are calculated for each
band. The information used for calculating weighted average prices is managed by Member
States, respecting confidentiality rules (Sustainable Energy Authority of Ireland, 2015).
Three pricing levels are provided:
Prices including taxes and levies;
Prices excluding VAT and other recoverable taxes;
Prices including all taxes, levies and VAT.
Electricity prices are surveyed for the categories of household end-user as shown in Table
2.17.
Table 2.17. Categories for residential end-use of electricity.
Source: (Eurostat, 2016)
Residential end-users Annual electricity consumption (kWh)
Lowest Highest
Very Small (DA) <1000
Small (DB) 1000 2500
Medium (DC) 2500 5000
Large (DD) 5000 15000
Very Large (DE) >= 15000
With regard to consumption bands, the most relevant for the majority of residential consumers
are DC band (2500-5000 kWh per annum) and the DD band (5000-15000 kWh per annum).
In the lower consumption bands the average price per kWh is higher because the standing
charges and network charges form a larger proportion on the annual costs (Sustainable Energy
Authority of Ireland, 2015).
Page 64
50
Since DD band is very relevant for Ireland situation it is possible to report the trend of its
electricity prices as explained by Figure 2.6.
Figure 2.6. Residential electricity prices (all taxes included) in band DD (2nd semester 2007 to 1st semester
2015).
Source: (Eurostat, 2016)
As shown, prices in Ireland are generally fallen from the end of 2008 until the start of 2011.
After that, prices in Ireland generally increased until the end of 2014 when it was 38% higher
than the first half of 2011. In the last semester, prices in Ireland in this band fell by 6.6%
(Sustainable Energy Authority of Ireland, 2015). The average price in the EU and the Euro
Area has been steadily increasing over the whole period and the price being approximately
one third higher at the end of the period compared with the start. For reference, consumers in
bands DC and DD accounted for 81% of the residential electricity market, with band DD
being the largest at 47% of the market, and DC the second largest at 34% (Sustainable Energy
Authority of Ireland, 2015).
It is also possible to analyse the position of Ireland compared with the EU average residential
electricity for all bands in the first semester of 2015 as shown in Figure 2.7.
Page 65
51
Figure 2.7. Residential electricity prices (all taxes included) in the 1st Semester 2015.
Source: (Eurostat, 2016)
The price level in band DA is high compared with the EU average. In the first half of 2015,
Ireland was 17% above the EU average in band DC, up 7% points on the previous semester,
and in band DD Ireland moved to being 3% above the EU average, from 11% above in
previous semester.
2.3.2 Residential gas prices
For households, the situation is the same explained for electricity prices such as charges
payable included, procedures implemented by Member States for a data compilation system
based and the three pricing levels provided.
Gas prices are surveyed for the categories of household end-user as shown in Table 2.18.
Page 66
52
Table 2.18. Categories for residential end-use of natural gas.
Source: (Eurostat, 2016)
Residential end-
users Annual gas consumption (kWh)
Band share of residential
gas consumption in Ireland
S1 2015 Lowest Highest
D1 - Small 0 < 5600 6.5%
D2 - Medium 5600 < 56000 92.1%
D3 - Large >= 56000 1.4%
With regard to consumption bands, it is possible to notice that the most relevant for the
majority of residential consumers is the medium band referred as D2 and its trend is
graphically presented in Figure 2.8.
Figure 2.8. Residential gas prices (all tax included) in band D2 (2nd semester 2007 to 1st semester 2015).
Source: (Eurostat, 2016)
The gas prices in Ireland were higher than the EU average over the period between the second
semester of 2007 and the second semester of 2009. Between the first semester of 2010 and
second semester of 2012 the price in Ireland was below the EU average but it has been either
at or above the average since then. In the last semester the price in Ireland was 1.4% above
the EU average. Since the start of 2008, the price has been below the average Euro Area price.
Page 67
53
As already done for electricity prices, it is possible to analyse the Ireland’s position relative to
the EU average gas prices to householders for first semester 2015 for each bands. This
situation is shown in Figure 2.9.
Figure 2.9. Residential gas prices (all taxes included) in the 1st semester 2015.
Source: (Eurostat, 2016)
During first semester of 2015 band D1 was below the EU average by 20% but bands D2 and
D3 where above the average by 1.4% and 2.8% respectively (Eurostat, 2016).
2.4 Policies and regulations
2.4.1 EU Directive 2009/28/EC
In the European context, according to the EU Directive 2009/28/EC11 the renewable energies
are wind, solar, aerothermal, geothermal, hydrothermal, ocean energy, hydropower, biomass,
landfill gas, sewage treatment plant gas and biogases. This Directive established a legislative
common framework for the use of energy from renewable sources in order to limit
greenhouse gas emissions. The fields of action defined in the Directive are energy efficiency,
11 European Union, ‘Renewable Energy Directive 2009/28/EC’, Brussels, 2009.
Page 68
54
energy consumption from renewable sources, the improvement of energy supply and the
economic stimulation in energy sector.
The Renewable Energy Sources Directive (RES) establish an overall policy for the production
and promotion of energy renewable sources in the EU. It requires the EU to fulfil at least 20%
of its total energy needs with renewables by 2020 to be achieved through the attainment of
individual national targets (European Commision, 2016). Individual EU countries have
different available resources and their own unique energy markets. This means that they will
have to follow distinctive paths when it comes to meeting their obligations under the
Renewable Energy Directive, including 2020 targets (European Commision, 2016). In their
national action plans, they explain how they intend to do this. In particular, the plans cover
individual renewable energy targets for the electricity and heating sectors and each Member
State is required to complete the template.
2.4.2 National Renewable Energy Action Plan (NREAP)
In Ireland, National Renewable Energy Action Plan (NREAP) is the submission required
under the Directive and follows the format (data and questions) required in established
template (NREAP, 2009). The NREAP was published in 2010 and sets out the Government’s
strategic approach and concrete measure to deliver on Ireland’s 16% target under Directive
2009/28/EC.
The development of renewable energy is central to overall energy policy in Ireland. They
reduce dependence on fossil fuels, improve security of supply and reduce greenhouse gas
emissions creating environmental benefits and contributing to national competitiveness.
The Government’s ambitions for renewable energy and the related national targets are fully
commensurate with the European Union’s energy policy objectives and the targets addressed
to Ireland under the Renewable Energy Directive. Ireland’s energy efficiency ambitions (20%
by 2020) are duly reflected in the NREAP (European Commision, 2016).
National sub-targets in each of the energy end-use modes of electricity and heat have been set
by Ireland to achieve this overall target. These are a 40% penetration of renewable electricity
in gross electricity consumption and a 12% penetration of renewable energy consumption in
the heat sector (Clancy, Renewable Heat in Ireland to 2020, 2015).
Page 69
55
2.4.3 Decision No 406/2009/EC
Ireland signed the EU’s Effort Sharing Decision (Decision No 406/2009/EC) which set 2020
targets for EU Member States on greenhouse gas emissions from sectors that are not included
in the EU Emission Trading Scheme (EPA, 2015) (European Union, 2009). This sectors
covers, among others, built environment (residential, commercial/institutional) and Ireland’s
target is to achieve a 20% reduction by 2020 on 2005 levels. In addition, there are binding
annual emission limits for the period 2013-2020 to ensure a gradual move towards the 2020
target. Any overachievement of the emission limit in the particular year can be banked and
used towards compliance in a future year (EPA, 2015).
2.4.4 Heat pumps regulatory framework
The Directive on the Promotion of the Use of Energy from Renewable Sources (RES
Directive), EC/28/2009 recognises all heat pump typologies as renewable energy technologies
whether they use air, water or the ground as an energy source. As already observed, the shift
from the use of energy from non-renewable to the use of energy from renewable sources is
supported by several measures. Especially, the promotion of renewable energy will have a
positive impact on the heat pump market. However, examining the legislation shows that the
support for renewable energy is usually implemented at a general level and is not specific to
heat pumps.
The European legislation has an impact on the national legislation of the Member States and
an indirect impact on heat pump sales. Following, some of the major legislative acts currently
in place on the European level are reported.
2.4.4.1 The RES Directive
The Directive on the Promotion of the Use of Energy from Renewable Sources (RES
Directive) can be reviewed as having a positive impact on heat pump technology, as it
acknowledges heat pumps as a technology that makes ambient energy from air, water and
ground useful (Bettgenhäuser, et al., 2013). A minimum requirement on seasonal efficiency to
be reached at standard rating points is set by the RES Directive and only heat pumps that
reach a minimum efficiency (SPF of 2.53) will be counted.
Page 70
56
2.4.4.2 Energy Performance of Buildings Directive (EPBD)
The Energy Performance of Buildings Directive (EPBD) 2010/31/EU is focused on the
improvement of energy performance of buildings, building elements and technical systems.
This directive has already been transposed into national law by Member States.
The EPBD, as the RES Directive, has a positive impact on the development of heat pumps
since EPBD acknowledges heat pumps as a technology that transfer heat from natural
surroundings to buildings. Moreover, it sets minimum requirements for the building envelope
and it also consider available heating alternatives prior the construction (Bettgenhäuser, et al.,
2013).
2.4.4.3 Energy Efficiency Directive (EED)
The Energy Efficiency Directive (2012/27/EU), which must be implemented in EU Member
States by 5 June 2014, aims at increasing the efforts currently made by Member States to use
energy more efficiently and it contributes directly to the 20/20/20 target of 20% primary
energy reduction by 2020. The future impact of the EED on heat pump technology is yet
unclear, but can be expected to be a rather positive impact. The fact that the EED mentions
the efficiency potential of buildings and of distributed energy production is essential for the
advancement of heat pumps. Nevertheless, it is more focused on CHP and district heat
implementation. Therefore, the impact on heat pump devices is not as big as for other policies
(Bettgenhäuser, et al., 2013).
2.4.4.4 Heat pump regulatory framework in Ireland
In Ireland, as in European Union, specific policies and directives currently do not exist
regarding heat pumps. Generally, policies and environmental targets refer to renewable
energies and the major parts of them are quite old.
Under the European Commission’s “20-20-20” strategy, Ireland is committed to a 20%
reduction in final energy consumption, as compared to average energy use in the period 2001-
2005, a 20% reduction in greenhouse gas emissions from 2005 levels and an increase in the
contribution of renewables to final energy consumption to 16% by 2020 (Irish Academy of
Engineering, 2013).
Page 71
57
According to Academy of Engineering, the Policy Advisory demonstrates how these
reduction goals can be achieved through a strategic rebalancing of Government energy policy
between 2013 and 2020. In the residential sector, Academy of Engineering recommends
acceleration of the national insulation-retrofitting programme, in particular the retrofitting of
heat pumps, these to operate in conjunction with existing oil-fired central heating, but
reducing oil use by approximately 90% (Irish Academy of Engineering, 2013). From 2006
and 2011, was active the Renewable Heat Deployment Programme (ReHeat) a financial
measure that aimed to increase the deployment of renewable heating technologies (such as
heat pumps) in several sectors (including residential).
In March 2007, the Irish Government Launched the Energy White Paper, a practical action-
based strategy to promote a sustainable energy future, efficient prices to consumers and
fostering the renewable sources penetration in the energy market. Between 2007 and 2009,
the Greener Homes Schemes provides grant assistance to homeowners who intend to purchase
a new renewable energy heating system for either new or existing homes (SEAI, 2011). The
scheme finished its budget in 2011 and was administrated by SEAI and aimed to increase the
use of renewable energy, in particular heat pumps, in Irish homes. A large number of
manufacturers’ companies joined the project.
2.4.5 MicroCHP regulatory framework
The European Union CHP Directive 2004/8/EC (European Parlament, 2009), approved in
February 2004, is the first European Directive that created a favourable environment for CHP
installations, contained definitions for micro, small and large scale CHP.
The European Commission published Decision 2007/74/EC (Official Journal of the European
Union, 2006) establishing harmonised efficiency reference values for separate production of
electricity and heat in December 2006 (SEAI, 2014). MicroCHP is recognised at the EU level
in legislation such as Energy Efficiency Directive 2012/27/EU (EED) in order to contribute to
reaching EU’s energy savings target. Moreover, the faster rollout of MicroCHP would reduce
emissions attributed to the residential sector, while increasing the energy performance of
existing buildings as required in Energy Performance in Buildings Directive 2010/31/EU
(EPBD) (COGEN Europe, 2014).
In particular, the EED gives them the opportunity to assess current legislation and develop an
appropriate policy structure that is supportive of microCHP technologies (COGEN Europe,
2014).
Page 72
58
2.4.5.1 MicroCHP regulatory framework in Ireland
The Energy (Miscellaneous Provisions) Act of 2006 (Irish Statute Book, 2006) is the
transposition of the EU CHP Directive into Irish law. On 25th October 2012, Directive
2012/27 /EU (EED) of the European Parliament repealed the CHP Directive. Since, this
Directive places energy efficiency at the core of the EU Energy 2020 strategy, it recognises
that high efficiency CHP, together with district heating and cooling, has significant potential
for achieving primary energy savings.
Moreover, it disposes a number of obligations on Member States (Ireland included) that they
establish mechanism for guaranteeing the origin of electricity from cogeneration and provide
priority access for electricity generated from high efficiency cogeneration (SEAI, 2014).
Transposition of the Directive in Ireland was completed in 2014 by two statutory instruments,
SI 131 and SI 426. Finance Act 2012 (Irish Statute Book, 2012) made a provision for a partial
relief from fossil fuels and a fuel relief from peat, using heat and power cogeneration. Tax
reliefs, available also for microCHP plants, meet the requirements for high-efficiency
cogeneration under 2004/8/EC of the European Parliament. The relief is given by means of
repayment to the consumer of the fuel for microCHP plant and there is a further relief from
electricity tax for electricity used for combined heat and power generation (SEAI, 2014).
Page 73
59
References
Activum, f. (2011, June 24th). Tratto da https://financial-lease.nl/.
Atanasiu, B. (2011). Energy Services Companies (ESCO's) - definition and best practices
across the EU. Bucharest: Building Performance Instute Europe.
Baylon, D., Strand, S., Davis, B., Robison, D., & Kruse, E. (2005). Analysis of Heat Pump
Installation Practices and Performance. Heat Pump Working Group.
BDR Thermea. (2015). http://www.bdrthermea.com/micro-chp/.
Berthold Hannes, M. A. (2013). Distributed energy: Disrupting the utility. Dusseldorf, Los
Angeles: Bain and Company.
Bertoldi, I. L. (2013). ESCOs for residential buildings: market situation in the European
Union and policy recommendations. Ispra: ECEE Summer study proceeding.
Bertoldi, M. R. (2010). Energy Service Companies Market in Europe. Ispra : Institute for
Energy.
Bettgenhäuser, K., Offermann, M., Boermans, T., Bosquet, M., Surmeli, N., & von
Manteuffel, B. (2013). Heat Pump Implementation Scenarios until 2030. ECOFYS.
Bleyl, S. (2008). Energy Contracting to Achieve Energy Efficiency and Renewable using
Comprehensive Refurbishment of Buildings as an example. Elsevier.
Boehnke, J. (2007). Business Models for Micro CHP in Residential Buildings. St. Gallen:
University of St. Gallen.
Boehnke, J. W. (2007, August 7). Research Platform Alexandria. Tratto da University of St.
Gallen: https://www.alexandria.unisg.ch/40506/
Carbon Trust. (2011). Micro-CHP Accelerator.
CEN/TC 228. (2011). Heating systems in buildings. Method for calculation of system energy
requirements and system efficiencies. Space heating generation systems, air heating
and overhead radiant heating systems. EN 15316-4-2.
Charlick, H., & Summerfield, I. (2013). Investigation of the interaction between hot water
cylindres, buffer tanks and heat pumps. Kiwa.
Clancy, M. (2015). Renewable Heat in Ireland to 2020. SEAI.
COGEN Europe. (2014, April 28).
http://www.cogeneurope.eu/medialibrary/2014/04/28/79fdf1be/28_04_2014_COGEN
%20Europe_Position%20Paper_Micro-
CHP%20delivering%20energy%20savings%20in%20the%20EED%20framework.pdf.
Page 74
60
COGEN Europe. (2014). MicroCHP - A cost-effective solution to save energy, reduce GHG
emissions and partner with intermittent renewables.
Cogen Europe. (s.d.). The benefits of microCHP. Brussels: Delta-ee.
Critoph, R. (2013). State of the art in gas driven heat pumps. University of Warwick.
Curtin, S. (2013, January 11th). Tratto da www.altenergymag.com/content.
Department of Energy & Climate Change. (2008). CHP Technology: a detailed guide for
CHP developers - Part 2.
Ecuity Consulting LLP. (2013). The role of microCHP in a Smart Energy World - Supporting
widespread uptake to achieve energy policy objectives. Solihull: Ecuity.
EHPA. (2014). European Heat Pump Market and Statistics Report.
ene.field. (2014). http://enefield.eu/partners/energy-saving-trust/.
Energy Saving Trust. (2012). Detailed analysis from the first phase of the Energy Saving
Trus's heat pump field trial. Department of Energy & Climate Change.
Energy Saving Trust. (2013). Detailed analysis from the second phase of the Energy Saving
Trust's heat pump field trial. Department of Energy & Climate Change.
Environment, D. E. (2015). The benefits of micro-CHP. Edinburgh: COGEN Europe.
EPA. (2015). Ireland's Greenhouse Gas Emission Projections .
European Commision. (2004). Directive 2004/8/EC on the promotion of cogeneration based
on a useful heat demand in the internal energy market.
European Commision. (2014). Heat Pumps. SETIS.
European Commision. (2016). https://ec.europa.eu/energy/en/topics/renewable-
energy/renewable-energy-directive.
European Commission. (2016, February 16). An EU Strategy on Heating and Cooling.
Brussels, Belgium.
European Parlament. (2009, April 20). http://eur-lex.europa.eu/legal-
content/EN/TXT/PDF/?uri=CELEX:02004L0008-
20090420&qid=1409052593848&from=EN.
European Union. (2009, June 5). http://eur-
lex.europa.eu/LexUriServ/LexUriServ.do?uri=OJ:L:2009:140:0136:0148:EN:PDF.
Tratto da Official Journal of the European Union.
Eurostat. (2016, March 07). http://appsso.eurostat.ec.europa.eu/nui/show.do.
Eurostat. (2016, March 07). http://appsso.eurostat.ec.europa.eu/nui/show.do.
Page 75
61
Fuel Cell Today. (2012, May). Using fuel cells in residential heat and power. Tratto da
http://www.fuelcelltoday.com/media/1637150/using_fc_residential_heat_and_power.p
df.
Fuel Cells and Hydrogen Joint Undertaking Programme. (2013, January). Home. Tratto da
ene.field: http://enefield.eu/
Future Market Insights. (2015, May). http://www.futuremarketinsights.com/reports/heat-
pumps-market.
Gas Network Ireland . (2014). Transmission and Distribution System Performance Report.
Glifford, G. R. (2011). Renewable Energy Cost Modelling: A toolkit for Establishing Cost-
Based Incentives in the United States. Framingham: National Renewable Energy
Laboratory.
Goetzler, Z. L. (2009). Ground-Source Heat Pumps: Overview of Market Status, Barriers to
Adoption, and Options for Overcoming Barriers. U.S. Department of Energy, Energy
Efficiency and Renewable Energy, Geothermal Technologies Program.
Harrison, J., & Redford, S. (2001). Domestic CHP: What are the potetntial benefits? Energy
Saving Trust.
Hofmeister, B. H. (2014). Business Models on Geothermal District Heating Systems . Green
Energy Association.
Irish Academy of Engineering. (2013). Policy Advisory: Achieving Ireland's Energy CO2
Reduction Targets - An Alternative Approach.
Irish Statute Book. (2006). http://www.irishstatutebook.ie/eli/acts.html.
Irish Statute Book. (2012). http://www.irishstatutebook.ie/2012/en/act/pub/0009/.
Kadar, P. (2012). Comparison of Heat Pump and MicroCHP for Household Application.
Budapest: IEEE.
Knight, I., & Ugusal, I. (2005). Residential Cogeneration Systems: a Review of the Current
Technologies. FC+COGEN-SIM.
Lund, J. S. (2013, September). GEOTHERMAL (GROUND-SOURCE) HEAT PUMPS A
World Overview. GHC Bulletin, p. 10.
Miara, M. (2007). Performance/optimization of state-of-the art residential heat pump. Kyoto:
Solar Energy Systems ISE.
Navigant Consulting. (2009). Ground‐Source Heat Pumps: Overview of Market Status,
Barriers to Adoption, and Options for Overcoming Barriers. Washington, D.C.: US
DOE.
Page 76
62
Nordman, R., Andersson, K., Monica, A., & Markus, L. (2010). Calculation methods for SPF
for heat pump systems for comparison, system choice and dimensioning. Technical
Research Institute of Sweden.
NREAP. (2009). National Renewable Energy Action Plan.
Official Journal of the European Union. (2006, December 21). http://eur-
lex.europa.eu/LexUriServ/LexUriServ.do?uri=OJ:L:2007:032:0183:0188:EN:PDF.
Parker, G. P. (2015, April 30). Webinar: Alternative Business Models for Distributed Energy
Resources. Arnhem, Netherlands.
Robur. (2016, January).
http://www.robur.com/technical_dossiers/heat_pumps_absorption_technology/heat_p
umps_comparison_basic_principles.
Robur S.p.A. (2013, July 25). Robur - Integrated heating and cooling solutions with
absorption heat pumps powered by natural gas and renewable energies. Tratto da
http://www.robur.it/area_tecnica_documenti.
SEAI. (2011, May 24).
http://www.seai.ie/Grants/GreenerHomes/Homeowners/Product_List/HeatPumpRegis
teredList.pdf.
SEAI. (2014). Combined Heat and Power in Ireland. Sustainable Energy Authority of
Ireland.
SEAI. (2014).
http://www.seai.ie/Your_Business/Public_Sector/FAQ/Energy_Reporting_Overview/W
hat_are_the_carbon_emission_factors_used.html.
SEPEMO. (2011). A defined methodology for calculation of the seasonal performance factor
and a definition which devices of the system have to be included in this calculation.
Intelligent Energy Europe.
Sustainable Energy Authority of Ireland. (2011). Residential microCHP Field Trial Report.
SEAI.
Sustainable Energy Authority of Ireland. (2015). Electricity & Gas Prices in Ireland. Ireland:
Sustainable Energy Authority of Ireland (SEAI).
Sustainable Energy Ireland. (2009). Renewable Heat Pumps . SEI.
The European Technology Platform on Renewable Heating and Cooling. (2016).
http://www.rhc-platform.org/.
The MIT Energy Initiative. (2013). The MIT Utility of the Future Study, White Paper. Boston:
Massechusettes Institute of Technology.
Page 77
63
VTT Technical Research Centre. (2012). Description of market needs and business models in
area of district level energy services. Finland: EU Commission.
Würtenberger, B. M. (2012). Business models for renewable energy in the built environment.
ECN.
Zotti, A., & Nordman, R. (2012). Concept for evaluation of SPF: A defined methodology for
calculation of the seasonal performance factor and a definition of which devices of the
system have to be included in this calculation. SEPEMO report to the European
Commision.
Zywica, G., Kicinski, J., & Ihnatowicz, E. (2015). Prototype of the domestic CHP ORC
system: construction and experimental research. Brussels: Polish Academy of
Sciences.
Page 79
65
Chapter 3: Methodology
The previous chapters have mainly provided a review about the state of art of heat pumps and
microCHP devices and business models available for these two technologies.
This chapter focuses on the methodology used for getting results that represent the basis for
all analysis made about the two different technologies.
The aim of the chapter is to present the procedures adopted for developing the economic and
environmental comparison between heat pumps and microCHP and the path followed to
achieve these results. The analysis can be divided into three main parts, summarised in Figure
3.1:
Figure 3.1: Methodology structure adopted in the analysis.
The first part principally involved the physical modelling of the overall system and it could be
divided into three steps that are, first of, the residential building modelling i.e., using
SketchUp software the building is designed and modelled following a typical Irish bungalow
features. What is gained after this step is the detached house that will be described precisely
in the Chapter 4. Secondly, the heating system has been modelled following the building’s
Heating
system layout
Building
modelling
Building
design
EnergyPlus
SketchUp
MicroCHP
operation
setting
Heat pump
operation
setting
Analysis of
results and
developing of
criteria
EnergyPlus
simulation
Excel
Page 80
66
features, considering that heat in the house is supplied by a floor-heating system and a tank is
present in order to provide domestic hot water. The layout remains the same for the two
technologies and the only thing that changes is naturally the fuel supply.
After that, it is possible to create the EnergyPlus model after the data entry step. In particular,
in this part all parameter fields have been filled in the EnergyPlus “Edit-IDF Editor” in order
to represent a residential building, the climate and heating system technical data. Two
separate files were created to capture the heat pump and microCHP models.
In the second part, there is the software simulation that allows the creation of two different
Excel files for each technologies. In the first one, called “Meter” it is possible to evaluate the
whole consumption of electricity (for the heat pump case) and the whole gas consumption and
electricity produced (for the microCHP) for every single hour of the year. In addition, it is
possible to analyse the hourly electricity consumption for each item of the house i.e. facility,
lighting, equipment, etc. that both devices have to supply in the same way since the electricity
demand of the house does not change. The second Excel file that we can obtain after the
software simulation is called “Table” and reports data such as electricity consumption of the
house related to the building’s features. Therefore, it is possible to analyse, for instance, how
electricity consumption is divided among different items in the whole year or how energy
gains and losses are split in all rooms of the house.
In the third part of the analysis, results returned by EnergyPlus’ simulations are used to
achieve the goals of this thesis work. In particular, in order to make a comparison between
heat pump and microCHP devices we carried out an economical and environmental analysis
after having studied the differences between their energy performances.
In order to examine their energy performances it is necessary to compare their electricity
profiles that are obtainable by simulation’s results. Then, for environmental criteria, we
calculate the annual CO2 production of both technologies and the method followed will be
explained in Chapter 5.
Subsequently, to assess the economic criteria we need to find out which is the most expensive
devices during their operation in the whole year. Again, the method followed will be
illustrated in Chapter 5.
Finally, a Net Present Cost (NPC) analysis will be used to measure heat pump and microCHP
with a conventional heating boiler. This analysis and its results are described in Chapter 5.
Page 81
67
Chapter 4: Model description
4.1 Introduction
The aim of this study is to examine options for heating a residential building considering air-
source heat pump and microCHP devices, and comparing them according to three criteria:
energy efficiency, economic value and environmental impact.
The model used for the residential house is considered as located in Ireland and the analysis
was carried out using EnergyPlus and is described in the HVAC system section below.
In Ireland residential buildings account for 34% of total electricity energy consumption
according to SEAI (O'Leary, Howley, & O Gallachoir, 2008). It is expected that in the future
electricity demand patterns of the residential sector will change due to development of smart
grid initiatives and the increasing deployment of renewable energy system (RES) installations
(Pallonetto , Oxizidis, & Duignan, 2013).
The deployment of the smart grid allows buildings to provide flexibility as the ability to shift
electrical power consumption, which is normally aligned with real-time energy demand, to
other non-peak times (Pallonetto, Fabiano; Oxizidis, Simeon; Finn, Donald, 2014) .
Smart grid energy management schemes can contribute in decreasing the carbon footprint of
the consumer, optimising the building energy systems operation and evaluating appropriate
demand response schemes.
4.2 Building description & plant layout
The first step undertaken in the model building was characterising the structure of the house
and its size in order to examine the heat and the electric demand for the whole construction.
For this goal the software EnergyPlus has been used.
The following part of the thesis will report the main assumptions adopted for the building
structure, heat gains and heat losses, ventilations and infiltrations and the plant layout.
Page 82
68
4.2.1 Location and architectural design
The building is a detached house located in Dublin at 53.43° north latitude and 6.4° west
longitude with an elevation of 85 m. The weather station is located at UCD, Belfield Dublin
and the climate data was for the 2014; this data was used at the input for the building energy
simulation analysis.
Weather and climate data for the selected site were provided by the software EnergyPlus,
taken from the International Weather for Energy Calculations (IWEC) data set.
Moreover, the simulation is carried out for 2014 therefore all climate data are referred to that
year. A graphical re-elaboration of the outdoor temperature and solar radiation values for the
select location are shown in Figure 4.1. In particular, the annual average outdoor air
temperature in the site is 9.77°C.
Figure 4.1. Values of monthly average temperature and solar radiation for Dublin for 2014.
Source: IWEC
The house has a total surface area of 160 m2 and a total volume of 403 m3. The U-Values of
the different building components differ from the current Irish building regulation maximum
values (2011) since the facility is not insulated. Some of the main features for the building are
reported in Table 4.1.
Page 83
69
Table 4.1. Summary of the building characteristics adopted in the model.
Building characteristics Building values
Total floor area (m2) 160
Volume (m3) 403
Gross wall area (m2) 183.6
Gross wall area facing North (m2) 51
Gross wall area facing South (m2) 51
Gross wall area facing East (m2) 40.8
Gross wall area facing West (m2) 40.8
Roof area (m2) 97.58
U value, exterior walls(W/m2K) 4.335
U value, roof (W/m2K) 6.301
U value, windows (W/m2K) 3.165
U value, floor (W/m2K) 0.163
Moreover, the gross window-wall ratio for each side of the building is sumarized in Table 4.2.
Table 4.2. Gross window-wall ratio for each side of the building.
Total
North (315°
to 45°)
East (45° to
135°)
South (135°
to 225°)
West (225°
to 315°)
Gross
window-wall
ratio [%]
22.24 0 49.89 0 50.21
The gross wall area is defined as the area of a wall including any openings, such as doors or
windows in the wall (http://standards.phorio.com/, 2011). The total amount of this parameter
in the building is 183.6 m2 with the same value for north and south (51 m2) and for east and
west (40.8 m2). The window to wall ratio of a building is defined as the percentage of its
façade taken up light-transmitting glazing surfaces, including windows and translucent
surface such as glass bricks. Only façade surfaces are counted in the ratio, not roof surfaces
(http://standards.phorio.com/, 2011).
The overall window to wall ratio is 22.24% with 49.89% and 50.21% ratio on the east and
west faces respectively. It is important to notice how this value is 0 on the south and north
faces since in these sides windows are not present.
The house has 14 rooms and each one is considered a specific thermal zone. Table 4.3
describes some features for each room.
Page 84
70
Table 4.3. Performance zone summary in the building for each room.
Room Area
[m2]
Conditioned
(Y/N)
Volume
[m3]
Windows
Glass
Area [m2]
Lighting
[W/m2]
People
[m2 per
person]
Plug and
process
[W/m2]
Kitchen 14.1 Yes 36.66 3.32 75 1.77 736.3298
Utility 5.4 Yes 14.04 0 43 16.18 917.6852
Dining 18.5 Yes 48.1 5.51 48 4.68 12.5
Study 10.8 Yes 28.08 3.03 59 0.75 25.7407
Hall 12.7 Yes 33.02 0 43 16.18 12.5
Living 18.5 Yes 48.1 5.22 214 0.56 29.1486
Bath 6 Yes 15 1.44 59 1.8 12.5
Bed1 9 Yes 17.5 3.74 59 3.27 12.5
Bed2 11.33 Yes 28.33 3.74 75 3.27 12.5
Landing 17.66 Yes 44.15 0 43 16.18 12.5
Ensuite 4.01 Yes 10.02 0 59 1.8 12.5
Bed3 16 Yes 40 4.8 102 1.8 20.25
Bed4 16 Yes 40 4.8 91 1.35 12.5
Attic 80 No 82.43 0 / / /
Total 160 / 403 35.6 82.1174 1.7 110.4313
From this table it is possible to study which are the rooms where there are main demands and
consumptions during the year. For instance, in the living room there is the largest requirement
for lighting (214 W/m2) while in the utility room and in the kitchen there are the main
demands for plug and process that is the electricity spent for electric equipment.
In addition, the “people” column show which are the rooms that could be the highest traffic
areas. These rooms are utility, hall and landing room.
Besides, a schematic representation of the house designed using SketchUp software is
reported in Figure 4.2.
Figure 4.2. Residential building structure adopted in the model.
Page 85
71
Then it is also possible to present two other figures that represent the first and the second
floor of the building in order to understand how the structure is inside.
Figure 4.3. First floor plant of the building.
Figure 4.4. Second floor plant of the building.
4.2.2 HVAC system & plant layout
For space heating the house requires a calculated design load of almost 15 kW while the user
design load is higher than 17 kW. In the analysis the house is equipped with an air-source heat
pump or with an internal combustion engine microCHP device that supply the heating
demand in the two different situations. Both of these two appliances were modelled with
EnergyPlus using physical parameters taken from the software library in order to estimate
their performances in heating the house.
A floor heating system is used to heat the house in each room exclusive of the attic. There are
26 mixing zones considered in the analysis (i.e. simple air exchange from one zone to
another). The mixing zones are considered to affect the energy balance of the “receiving”
zone and will not produce any effect on the “source” zone.
Page 86
72
Both heat pumps and microCHP systems are composed of heating primary loop and heating
secondary loop as shown in the following figures.
Figure 4.5. Air to water heat pump heating system.
Figure 4.6. Internal combustion engine microCHP heating system.
As illustrated the heating system is the same for both technology. The only difference is,
naturally, devices that produce the heat and the condition in which they work. For the
microCHP system the exit temperature of the primary loop is 85°C while for the heat pump
Page 87
73
system is 70°C. Then the exit temperature of the secondary loop is 75°C for the microCHP
system and 67°C for the heat pump one.
4.2.2.1 Heat pump model
The heat pump device is composed by a heat pump water heater (HPWH) heating coil, air-to-
water direct-expansion (DX) system which includes a water heating coil, evaporator air coil,
evaporator fan, electric compressor and water pump.
Rated heating capacity (thermal output) of the system is 14500 W with a rated COP of 3.9.
The rated evaporator inlet temperature of dry-bulb air is 10°C while the rated condenser inlet
temperature of water is 35°C.
The ASHP tank that is the heat pump water heater has a volume of 0.1 m3, it requires
electricity as fuel and it is located in the utility room.
The ASHP has a constant volume fan intended to cycle on and off based on heating control or
other control signal. It has a total efficiency of 0.7 and it is coupled with a motor that has an
efficiency of 0.9.
4.2.2.2 MicroCHP model
The microCHP generator is an internal combustion engine fed by natural gas located in the
utility room that can produce a maximum electric power of 7500 W. It has a rated thermal to
electrical power ratio of 2.444.
4.2.3 Occupancy profile
The occupancy profiles, use of electric equipment and lights, domestic hot water (DHW) use
patterns and the respective distribution of internal gains were calculated. People, lights and
electric equipment have been evaluated as internal gains. To build the necessary profile, a
time of use activity survey was utilised. The profiles were calibrated with the convenient
occupant adjustments to better replicate the real life activity patterns.
The occupancy profile was adjusted according to the working time of the occupants and their
typical weekend and evening activities. The appliances typical time of use was also tuned
according to their habits. Specific schedules based on typical use were adopted for electrical
equipment such as washing machine and dishwasher. The building is naturally ventilated just
Page 88
74
by opening the windows and exhaust air extraction fans are not present except in the kitchen
and the bathroom. For this reason if the sum of infiltration and ventilation is calculated for
each room the values obtained are pretty similar without great differences among them. In
particular one can analyse how the living room has the lowest value of 1.13 ACH (Air
Changes per Hours) while the highest values are in the kitchen with 1.309 ACH and mainly in
the landing with 1.347 ACH as shown in the Table 4.4.
Seasonal (between winter and summer) and daily (between night and day) variations of both
infiltration and ventilation were considered.
Table 4.4. Infiltration and ventilation for each room.
Room Infiltration [ach] Simple ventilation
[ach]
Sum of infiltration
and ventilation
[ach]
Kitchen 0.751 0.558 1.309
Utility 0.763 0.563 1.326
Dining 0.745 0.547 1.292
Study 0.739 0.54 1.279
Hall 0.741 0.546 1.287
Living 0.786 0.344 1.13
Bath 0.774 0.482 1.256
Bed1 0.798 0.578 1.376
Bed2 0.778 0.491 1.269
Landing 0.776 0.571 1.347
Ensuite 0.764 0.553 1.317
Bed3 0.78 0.54 1.32
Bed4 0.785 0.556 1.341
4.2.4 Heat gains and losses
In order to evaluate how internal gains and losses are divided into the building it has been
analysed the situation for the living room during wintertime and summertime. In particular,
different situations in January and July were studied as outlined graphically in following
figures.
Page 89
75
4.2.4.1 Heat gains and losses in wintertime
Figure 4.7. Heat gains values and percentage for each item in January in the living room.
During January the main entry for energy gains comes from heat conduction through opaque
surface within the floor heating system supplied by heat pump or microCHP devices due to
the fact that the building is not insulated. If the building was a passive house this percentage
would have been much lower. It has the highest percentage (73% and 213.63 kWh of absolute
value) of energy gained inside the building followed by total heating (both latent and sensible)
derived from lights (8%, 22.78 kWh) and by sensible heat from people (7%, 19.86 kWh).
Other entries, which include convective heating from electrical equipment, total heat from
windows and radiant heating from electrical equipment, have really low percentages.
19,86; 7%
22,78; 8%
7,43; 2%
17,82; 6%
213,63; 73%
12,23; 4%
ZONE PEOPLE SENSIBLE HEATING
ENERGY [kWh]
ZONE LIGHTS TOTAL HEATING
ENERGY [kWh]
ZONE ELECTRIC EQUIPMENT
RADIANT HEATING ENERGY [kWh]
ZONE ELECTRIC EQUIPMENT
CONVECTIVE HEATING ENERGY
[kWh]
ZONE OPAQUE SURFACE INSIDE
FACES TOTAL CONDUCTION HEAT
GAIN ENERGY [kWh]
ZONE WINDOWS TOTAL HEAT
GAIN ENERGY [kWh]
Page 90
76
Figure 4.8. Heat losses values and percentage for each item in January in the living room.
For energy losses, the highest percentages are related to windows heat losses (45%, 131.01
kWh) and sensible heat losses due to infiltrations (38%, 109.62 kWh). This tendency is easily
comprehendible due to the strong difference of temperature between internal house and
temperature of environment outside that is low in January.
Moreover, it is possible to observe how total conduction heat losses from opaque surfaces
have a small value since the heating system is functioning for an extended period of time and
produced goes from the wall toward the internal space.
Another important aspect of energy losses is represented by the mixing sensible heat (11%,
32.84 kWh). This is difference of temperature between two adjacent rooms. In this case this
entry is not negligible since the living room has potentially a higher temperature than rooms
beside as it is more consistently occupied and therefore warmer.
38%
8,56; 3%
9,25; 3%
131,01; 45%
32,84; 11%
ZONE INFILTRATION
SENSIBLE HEAT LOSS
ENERGY [kWh]
ZONE VENTILATION
SENSIBLE HEAT LOSS
ENERGY [kWh]
ZONE OPAQUE SURFACE
INSIDE FACES TOTAL
CONDUCTION HEAT LOSS
ENERGY [kWh]
ZONE WINDOWS TOTAL
HEAT LOSS ENERGY [kWh]
ZONE MIXING SENSIBLE
HEAT LOSS ENERGY [kWh]
Page 91
77
4.2.4.2 Heat gains and losses in summertime
Figure 4.9. Heat gains values and percentage for each item in July in the living room.
This situation is less interesting since during summertime the house is not heated. However,
from the energy gains pie chart it is possible to notice that the largest item is represented by
the total heat through windows (66%, 209.18 kWh) due to the greater presence of solar
radiation compared with wintertime period. A considerable value comes from the total
conduction heat through opaque surface inside faces (15%, 46.7 kWh) which indicates that
there is radiation heat passing through the wall as a result of higher temperature outside than
inside the house.
The other values of energy gains that have negligible percentage are radiant and convective
heating energy from electrical equipment, total heat energy from lights and sensible heating
energy from people.
.
16,4; 5%
14,58; 5%
7,45; 2%
17,86; 6%
46,7; 15%
209,18; 66%
4,23; 1%
ZONE PEOPLE SENSIBLE HEATING
ENERGY [kWh]
ZONE LIGHTS TOTAL HEATING
ENERGY [kWh]
ZONE ELECTRIC EQUIPMENT
RADIANT HEATING ENERGY [kWh]
ZONE ELECTRIC EQUIPMENT
CONVECTIVE HEATING ENERGY
[kWh]
ZONE OPAQUE SURFACE INSIDE
FACES TOTAL CONDUCTION HEAT
GAIN ENERGY [kWh]
ZONE WINDOWS TOTAL HEAT
GAIN ENERGY [kWh]
ZONE MIXING SENSIBLE HEAT
GAIN ENERGY [kWh]
Page 92
78
Figure 4.10. Heat losses values and percentage for each item in July in the living room.
For heat losses, one can see the opposite situation compared with the graph of gains since the
main entry of energy loss is the total conduction heat through opaque surfaces (58%, 181.42
kWh) since radiation goes from internal rooms toward external environment that has higher
temperature. Through walls there is a higher amount of heat lost that gained during
summertime.
Other entries for heat losses are result of sensible heat infiltration (15%, 47.41 kWh) and also
of the total heat lost through the windows (13%, 40.19 kWh). However, the total amount of
heat gained through the windows is much higher than lost in this period.
Another item of loss is by cause of sensible heat ventilation (11%, 33.76 kWh) even if its
percentage is pretty low. For sensible heat ventilation this is loss of heat that is due to air
passing through doors or windows openings.
Finally, the lower item that affects energy loss here is mixing sensible heat that has a
negligible percentage. Compared with January this situation is different since during
summertime the whole house has a temperature that is similar in all rooms while during
wintertime rooms with people inside are warmer than empty ones.
4.2.5 Thermostatic control
The heating season is taken from 1st of October to 30th of April according to user schedule
preferences. In the living room there is a temperature of 21°C while in the remaining zones,
the temperature set point of the heating system is 18°C in accordance with the current Irish
regulation (AECOM House, 2013).
47,41; 15%
33,76; 11%
181,42; 58%
40,19; 13%10,89; 3%
ZONE INFILTRATION SENSIBLE
HEAT LOSS ENERGY [kWh]
ZONE VENTILATION SENSIBLE
HEAT LOSS ENERGY [kWh]
ZONE OPAQUE SURFACE INSIDE
FACES TOTAL CONDUCTION
HEAT LOSS ENERGY [kWh]
ZONE WINDOWS TOTAL HEAT
LOSS ENERGY [kWh]
ZONE MIXING SENSIBLE HEAT
LOSS ENERGY [kWh]
Page 93
79
During weekdays, occupants are usually at home before 9:00 am and after 5:00 pm while,
during the weekends, occupants spend most of their time at home. According to which is the
typical occupancy pattern between these two situations, the temperature is always maintained
at the user set point.
4.2.6 Domestic hot water
The hot water tank has a storage volume of 0.278 m3 and supplies the hydronic radiant
heating system embedded in the building floor controlled by varying the hot and chilled water
flow to the single unit. The water tank was modelled as water heater mixed, electricity fed and
with 100°C of maximum temperature limit.
4.2.7 Weather and simulation period
Two design days have been considered in order to create the parameters for the program to
generate the 24-hour weather profile that can be used for sizing as well as running to test the
other simulation parameters. These days are 21st of February for wintertime and 21st of July
for summertime and parameters include maximum dry bulb temperatures (-1.9°C and 22.1°C
respectively), wind speeds (3.6 m/s and 4.8 m/s respectively) and solar radiation values
calculated through ASHRAE Clear Sky Model (Powell, 1982).
Figure 4.10 shows graphically one of these features taken again from the International
Weather for Energy Calculations (IWEC) data set.
Page 94
80
Figure 4.10. Global horizontal radiation for Dublin for 2014.
Source: IWEC
Moreover, some holidays/special days are set up to be used during weather file run periods
such as NewYear’s Day, St. Patrick’s Day, Easter, Bank Holidays and Christmas.
Page 95
81
References
AECOM House. (2013). Report on the development of cost optimal calculations and gap
analysis for buildings in Ireland under directive 2010/31/EU on the energy
performance of buildings . Dublin: Department of Environment, COmmunity and
Local Government and the Suistainable Energy Authority of Ireland.
http://standards.phorio.com/. (2011, July 27th).
Lundström, L. (2012). Weather data for building simulation: New actual weather files for
North Europe combining. Västerås: School of Sustainable Development of Society
and Technology.
O'Leary, F., Howley, M., & O Gallachoir, B. (2008). Energy in the Residential Sector.
Dublin: SEAI.
Pallonetto , F., Oxizidis, S., & Duignan, R. (2013). Demand respons optimisation of all-
electric residential buildings in a dynamic grid environment: Irish case study.
Chambery: Conference of International Building Performance Simulation Association.
Pallonetto, Fabiano; Oxizidis, Simeon; Finn, Donald. (2014). Exploring the demand response
potential of a smart-grid ready house using building simulation software. Ottawa:
eSim.
Powell, G. (1982). The ASHRAE clear sky model-an evaluation. ASHRAE Journal, 32-34.
Page 97
83
Chapter 5: Results and discussion
This chapter discusses the results from the EnergyPlus software analysis for both the heat
pump and microCHP devices. The simulation results in two Excel tabs labelled one “Meter”
and “Table”. In the first tab the information is one divided by the electricity consumption
inside the building during the whole year among different items while in the second tab these
data are given related to the features of the building. The analysis has been conducted using
the values in kWh. The timeframes for analysis used were one week in wintertime and one
week in summertime, respectively in January and in July, for both heat pump and microCHP
in order to obtain the electricity profile of these two devices in two different conditions. The
idea is to show the electricity consumption per day and to see if there is a trend or pattern to
the data.
After that analysis, environmental and economic assessments have been carried out in order to
produce a comparison between the technologies.
Additionally, a Net Present Cost (NPC) investigation has been implemented to get an
observation among heat pump and microCHP devices in comparison with a conventional
boiler (since that is one of the most mature technologies among building heating
applications).
5.1 Electricity consumption for heat pump
Usually heat pumps present an electricity consumption graph where there are two main peaks,
one in the morning when tenants do their activities before leaving the house and one during
afternoon or evening when they return to home (Energy Sentry, 2013). This is more
representative for a week day when people work, thus it is recommended to get two graphs,
one for weekdays and one for weekend (Saturday and Sunday) to discover the main
differences between them.
For the simulation we used the default heat pump device available in the EnergyPlus’s library
already described in the previous chapter.
Page 98
84
The weekday and weekend graphs are then used to compare simulation results with the real
world situation for heat pump usage.
5.1.1 Wintertime for heat pump
Using a week in January from Monday the 16th to Sunday the 22nd and generating the
electrical consumption of the residence for 24 hours in the software simulation. Using this
information it is possible to graphically show how the electrical consumption varies during
the day.
Firstly, we graph for a particular weekday (Wednesday the 18th) and then for a particular
weekend day (Sunday the 22nd) of the same week created. Unfortunately, the graphs obtained
for single days were meaningless particularly due to climate factors. To mitigate this we
considered average results for weekdays taking values from Monday 16th to Friday 20th.
Considering average values of weekdays obtained it is possible to produce the electrical
profile consumption for the heat pump during this week as reported in Figure 5.1.
Figure 5.1. Weekdays electricity profile from Monday 16th to Friday 20th of January [kWh].
This graph shows clearly that there is a high peak in the morning hours, from 8:00 am to
10:00 am since people do their activities before leaving houses for the rest of the morning and
lunchtime.
In fact, in the hours between midday and 3:00 pm one can see the lowest value of electrical
consumption of the whole day as compared to night values. However, the value is over 1 kWh
0
0,5
1
1,5
2
2,5
3
3,5
4
01
:00
:00
02
:00
:00
03
:00
:00
04
:00
:00
05
:00
:00
06
:00
:00
07
:00
:00
08
:00
:00
09
:00
:00
10
:00
:00
11
:00
:00
12
:00
:00
13
:00
:00
14
:00
:00
15
:00
:00
16
:00
:00
17
:00
:00
18
:00
:00
19
:00
:00
20
:00
:00
21
:00
:00
22
:00
:00
23
:00
:00
24
:00
:00
Page 99
85
since there is still the need of space heating inside the house like night hours. Moreover, it is
possible to notice another peak more or less at 7:00 pm due to tenants returning to the house
and they get involved into different activities that require higher electricity consumption. In
addition, to heating systems there are interior lighting, interior equipment and water systems.
Applying the same method to the weekend data in order to get a significant trend from it, we
took an average value of electricity consumption for Saturday 21st and Sunday 22nd.
Taking the average value between these two days it is possible to get another graph that
shows the electrical profile demands during a winter weekend as summarized in Figure 5.2.
Figure 5.2. Weekend electricity profile for Saturday 21st and Sunday 22nd of January [kWh].
Here the situation is different from weekdays. In fact, during the weekend it is more likely
that people are inside at home for more time than during weekdays so there is not the same
variance of electricity consumption throughout the day. However, again in the hours of
morning from 8:00 to 10:00 am and in the first hours of evening until 7:00 pm there are two
main peaks for the same reasons that explained peaks of weekdays.
Additionally, the main differences between these two graphs are that during the weekend the
electrical consumption is higher and more consistent as compared to the weekday.
During the week the average value is about 51.81 kWh, for the weekend average value it is
approximately 86.83 kWh. Again, this contrast describes well the difference between the time
occupation of the building during weekend days and during weekdays.
0
0,5
1
1,5
2
2,5
3
3,5
4
4,5
5
01
:00
:00
02
:00
:00
03
:00
:00
04
:00
:00
05
:00
:00
06
:00
:00
07
:00
:00
08
:00
:00
09
:00
:00
10
:00
:00
11
:00
:00
12
:00
:00
13
:00
:00
14
:00
:00
15
:00
:00
16
:00
:00
17
:00
:00
18
:00
:00
19
:00
:00
20
:00
:00
21
:00
:00
22
:00
:00
23
:00
:00
24
:00
:00
Page 100
86
5.1.2 Summertime for heat pump
In the same way, it is possible to analyse the situation for the summertime period where we
considered the week from Monday 10th of July to Sunday 16th of July.
Following the same approach used for the wintertime, we have divided results between
weekdays and weekend days taking an average value for days from Monday to Friday and an
average one for Saturday and Sunday.
In the first case, we got an average weekdays value for 24-day hours then taking it is possible
to the electricity consumption profile as shown in Figure 5.3.
Figure 5.3. Weekdays electricity profile from Monday 10th to Friday 14th of July [kWh].
From this graph one can observe that there are two main peaks more evident than in
wintertime weekdays electricity profile and with much lower value. In particular, the first one
is again located in the morning from 5:00 am to 8:00 am while the second one is in the
lunchtime between noon and 1:00 pm. For the rest of the morning and during the afternoon
and evening the electrical consumption is fairly comparable and lower than wintertime.
Furthermore, we recognize that during the night hours electricity consumption has almost a
null value. This is the main difference to the wintertime profile due to the fact that in July
electricity is not required to heat the house so the only demand is for appliances used and for
domestic hot water.
0
0,2
0,4
0,6
0,8
1
1,2
01
:00
:00
02
:00
:00
03
:00
:00
04
:00
:00
05
:00
:00
06
:00
:00
07
:00
:00
08
:00
:00
09
:00
:00
10
:00
:00
11
:00
:00
12
:00
:00
13
:00
:00
14
:00
:00
15
:00
:00
16
:00
:00
17
:00
:00
18
:00
:00
19
:00
:00
20
:00
:00
21
:00
:00
22
:00
:00
23
:00
:00
24
:00
:00
Page 101
87
Now we consider the weekend period with the average value between Saturday 15th and
Sunday 16th. From this value derives the electricity consumption profile as reported in Figure
5.4.
Figure 5.4. Weekend electricity profile for Saturday 15th and Sunday 16th of July [kWh].
In this situation there is still the main peak of electricity demand from 7:00 to 8:00 am and
then there are some other high demands in particular during afternoon between 3:00 and 4:00
pm and in the evening during the dinner time from 7:00 to 9:00 pm. Similarly, to the
weekdays graph one can see that during night time the electricity demand is almost zero.
Conversely, the profile shows higher demand especially during afternoon and evening for the
reason that inhabitants stay more time inside the house during the weekend than weekdays
and this tendency is analogous to wintertime period.
Finally, if we take a look at the total amount of electricity consumption based on the average
values in the two different week’s period, this feature remains. For weekends there is a total
amount approximately of 12.83 kWh that is slightly higher to 10.67 kWh that we get from the
weekday period.
5.2 Electricity consumption for microCHP
Using EnergyPlus we created another simulation for the same building and with the same
climatic data considering a microCHP device instead of a heat pump.
0
0,2
0,4
0,6
0,8
1
1,2
1,4
1,6
1,8
2
01
:00
:00
02
:00
:00
03
:00
:00
04
:00
:00
05
:00
:00
06
:00
:00
07
:00
:00
08
:00
:00
09
:00
:00
10
:00
:00
11
:00
:00
12
:00
:00
13
:00
:00
14
:00
:00
15
:00
:00
16
:00
:00
17
:00
:00
18
:00
:00
19
:00
:00
20
:00
:00
21
:00
:00
22
:00
:00
23
:00
:00
24
:00
:00
Page 102
88
For the simulation we have used the default data for the natural gas fed microCHP given by
the software library and already described in the previous chapter. For this case, the same
analysis method for the heat pump simulation has been used. Therefore, we have considered
the same two periods in wintertime and summertime.
It is essential to underline that while for the heat pump simulation we have used the
electricity consumption within facility results present in “Meter” tabs, for the microCHP
simulation, however, we need to study the electricity net results always taken from “Meter”
tabs. This difference is due to the fact that the heat pump just requires electricity from the grid
to make the compressor work while for microCHP we have to consider the electricity
consumption by the building and the electricity produced by the device after burning natural
gas. Specifically, if we take a look to “Meter” tab of microCHP simulation we can observe
how the column of “Electricity:Facility” minus the column “ElectricityProduced:Facility”
gives the result for “Electricity:Net” column.
5.2.1 Wintertime for microCHP
As for the heat pump model we have taken the week from Monday 16th to Sunday 22nd of
January. In the same way we have considered an average value related to weekdays from
Monday to Friday and an average from the weekend i.e. Saturday and Sunday.
So for the weekdays we have studied days included between Monday 16th and Friday 20th and
the result is the average value of these days in the Excel file.
Taking these average values for each hour of a day we can create the following electricity
profile as shown in Figure 5.5.
Page 103
89
Figure 5.5. Weekdays electricity profile from Monday 16th and Friday 20th of January [kWh].
From this graph it is possible to notice how the electricity consumption stands for all hours in
the day in values lower than zero which is quite different from the same graph for the heat
pump. This situation is due to the fact that during wintertime the microCHP device generates
electricity to produce domestic hot water and to satisfy the heating demand.
The main production of electricity is during hours from 7:30 am to 9:00 am where there is the
most negative peak of the whole profile as for the heat pump. This is consistent with the
earlier results, since the inhabitants are the same. The fact that the electricity profile has
values lower than zero means that the microCHP device manages to meet the requirement of
building for domestic hot water, heating and electricity consumptions such that no electricity
from the grid is needed. After the average situation for weekdays it is possible to analyse the
situation for weekends in the same way used for the heat pump approach considering the
average value gained from Saturday 21st and Sunday 22nd of January. All these values are
negative such as for the weekdays’ situation and that means again that electricity from the
grid is not needed. It is also possible to notice how the weekend’s values are higher than
weekdays’ in absolute value. That is again since during weekend the building is occupied for
more time by residents so demand for heating, domestic hot water and electricity is higher.
In fact if one compares the sum of two average values for weekend and weekdays in the
whole 24 hours of the day, it is possible to find for the former a value of about -61.25 kWh for
the latter of approximately -21.86 kWh. Considering average values the electricity profile for
the weekend has been obtained as reported in Figure 5.6.
-2
-1,8
-1,6
-1,4
-1,2
-1
-0,8
-0,6
-0,4
-0,2
0
02
:00
:00
03
:00
:00
04
:00
:00
05
:00
:00
06
:00
:00
07
:00
:00
08
:00
:00
09
:00
:00
10
:00
:00
11
:00
:00
12
:00
:00
13
:00
:00
14
:00
:00
15
:00
:00
16
:00
:00
17
:00
:00
18
:00
:00
19
:00
:00
20
:00
:00
21
:00
:00
22
:00
:00
23
:00
:00
24
:00
:00
Page 104
90
Figure 5.6. Weekend electricity profile for Saturday 21st and Sunday 22nd of January [kWh].
As already said for the heat pump case, compared with the situation of weekdays, during
weekend the electrical consumption is more stable and the value of electricity net is higher as
long as people stay inside the building for longer time.
There is not significant difference between night and day hours since the request of heating is
always present over the day.
5.2.2 Summertime for microCHP
Equally to heat pump approach we have taken a summer week to analyse the results of
simulation for the microCHP. Again the week investigated is the one from Monday 10th to
Sunday 16th of July and it is divided between weekdays and weekend as well.
Considering weekdays the average value of days from Monday 10th to Friday 14th of July has
been taken. Again, from it we get the graph of electricity consumption profile as reported in
Figure 5.7.
-3,5
-3
-2,5
-2
-1,5
-1
-0,5
0
01
:00
:00
02
:00
:00
03
:00
:00
04
:00
:00
05
:00
:00
06
:00
:00
07
:00
:00
08
:00
:00
09
:00
:00
10
:00
:00
11
:00
:00
12
:00
:00
13
:00
:00
14
:00
:00
15
:00
:00
16
:00
:00
17
:00
:00
18
:00
:00
19
:00
:00
20
:00
:00
21
:00
:00
22
:00
:00
23
:00
:00
24
:00
:00
Page 105
91
Figure 5.7. Weekdays electricity profile from Monday 10th to Friday 14th of July [kWh].
One can see how the summertime graph is different from the wintertime since in summertime
the microCHP has just to work for producing domestic hot water and not to satisfy heating
demand. In the morning hours between 5:00 to 7:00 am there is a negative peak due to
demand of domestic hot water by the occupants, thus the electricity produced is higher than
the demand and this creates larger negative (meter) values. After midday the electricity
request is higher than production therefore the profile presents values higher than zero since
the building takes electricity from the grid in the same way that the heat pump does in order to
satisfy users’ electricity request. In particular, there is a peak of the electricity consumption in
the hours between 8:00 pm to 10:00 pm i.e. during and after dinnertime. Moreover, the
electricity consumption during the night is close to zero value and this element is similar to
the heat pump’s summertime operation.
In the same way the situation for weekend has been considered always looking at the average
value for Saturday 15th and Sunday 16th of July. From that it is possible to achieve another
chart that illustrates the electricity profile for the weekend average value as exposed in Figure
5.8.
-0,3
-0,2
-0,1
0
0,1
0,2
0,3
0,4
01
:00
:00
02
:00
:00
03
:00
:00
04
:00
:00
05
:00
:00
06
:00
:00
07
:00
:00
08
:00
:00
09
:00
:00
10
:00
:00
11
:00
:00
12
:00
:00
13
:00
:00
14
:00
:00
15
:00
:00
16
:00
:00
17
:00
:00
18
:00
:00
19
:00
:00
20
:00
:00
21
:00
:00
22
:00
:00
23
:00
:00
24
:00
:00
Page 106
92
Figure 5.8. Weekend electricity profile for Saturday 15th and Sunday 16th of July [kWh].
This electricity profile has a similar trend compared with the weekday’s one in particular
there is the same peak in the morning hours between 6:00 am and 9:00 am with higher
negative values of net electricity.
In addition, there are two positive peaks: first during lunchtime from 11:00 am to 1:00 pm
which could be due to people eating at home and using the cooking equipment that requires
higher electricity consumption. The second one during the evening time from 8:00 pm to 9:30
pm that is a similar situation compared with the weekday’s graph since people are inside
home during the evening.
5.3 Electricity consumption for end uses
The simulation results in the other tab in the output file called “Table” give information about
electrical consumptions related to characteristics of the house.
The following pie chart in Figure 5.9 shows how the electricity consumption is divided
among end uses over the whole year for the heat pump device.
-0,6
-0,5
-0,4
-0,3
-0,2
-0,1
0
0,1
0,2
0,3
0,4
01
:00
:00
02
:00
:00
03
:00
:00
04
:00
:00
05
:00
:00
06
:00
:00
07
:00
:00
08
:00
:00
09
:00
:00
10
:00
:00
11
:00
:00
12
:00
:00
13
:00
:00
14
:00
:00
15
:00
:00
16
:00
:00
17
:00
:00
18
:00
:00
19
:00
:00
20
:00
:00
21
:00
:00
22
:00
:00
23
:00
:00
24
:00
:00
Page 107
93
Figure 5.9. Percentages and values of electricity consumption by end uses for the heat pump in the whole year.
The total demand for interior lighting and interior equipment is clearly the same for both heat
pump and microCHP and respectively 639.12 kWh and 2132.75 kWh.
The electricity consumption pie chart for the heat pump explains how electricity needed by
the compressor to make the heat pump itself work is divided related to the users’ requirement.
The total electricity consumption for heat pump in the whole year is 18564.12 kWh.
The main entry of electrical consumption is water systems, the name that EnergyPlus uses to
refer to the whole heat pump system. This item supplies both heating demand and domestic
hot water. It has an absolute value of 14613.94 kWh with a percentage of 79%.
The balance of the consumption due to other systems has minimal affect except possibly the
demand by interior equipment that presents a percentage of 11%.
From the same Excel tab called “Table” obtained from the software simulation for microCHP
device it is possible to analyse the yearly electricity consumption by end uses as reported
graphically in Figure 5.10.
639,12; 3%
2132,75; 11%522,44; 3%
655,87; 4%
14613,94; 79%
InteriorLighting
InteriorEquipment
Fans
Pumps
WaterSystems
Page 108
94
Figura 5.10. Percentages and values of electricity consumption by end uses for microCHP in the whole year.
The electricity consumption chart for the microCHP explains how the electricity produced by
the device is used within the building to meet requirements.
For microCHP system there are three different items in which electricity consumption is
divided. In proportion, the two main entries are interior equipment and pumps with a
percentage respectively of 45% and 41%, while demand from interior lighting is much more
limited. In the microCHP there is no requirement by water systems since heating demand and
domestic hot water supply are satisfied by natural gas burning.
The total yearly electricity consumption for microCHP is 4733.39 kWh that is much lower
than heat pump datum. This is because, for the heat pump one have electricity as input while
for the microCHP one have to consider the natural gas that is used to feed the appliance.
5.4 Comparison between heat pump and microCHP
Since heat pump and microCHP devices work in different ways, they are evaluated with
different parameters as already shown in the first part of this thesis.
Therefore, to decide which one of these two devices has the most optimized features for a
given context one must follow an approach that normalizes the comparison since the
parameters by which to assess each technology are different.
639,12; 14%
2132,75; 45%
1961,48; 41%
Interior Lighting
InteriorEquipment
Pumps
Page 109
95
In particular, it is possible to have objective results about their performances following two
different paths. The first one analyses the environmental performance of heat pump and
microCHP while the second one studies the economic achievements of the two devices.
5.4.1 Environmental assessment
In order to classify environmental performances we look at two different ways for heat pump
and microCHP depending on their structure.
However, the goal of this approach is to get the value of total production of CO2 in the whole
year that one must consider in the software simulation in order to see which one between
these two appliances is more environmentally friendly.
5.4.1.1 Heat pump environmental assessment
For the heat pump analysis, it is possible to start from “Meter” tab results that is the electricity
consumption for the whole facility for every day of the year.
These values are given for each hour of the day so for every day we consider twenty-four
values. Starting from the 1st of January, which is a Sunday, we can obtain the global
electricity consumption value for the whole year.
As already said before, this value amount to 18564.12 kWh.
After that, from the official site of the Irish electrical grid (Eirgrid Group, 2015), it is possible
to gather values of CO2 intensity grid for 2014 i.e. how much CO2 is produced by the grid
during the year while it is working, given in grams for kWh.
It is important to indicate that these values are given for every quarter of an hour and we use
an average value for every hour in order to make it suit with the every hour value of
electricity consumption given in the simulation’s results.
Hence, for every single day of each month we collect 24 values of electricity consumption for
the whole facility. The result is that we get a column referred to as CO2 intensity of the Irish
national grid that includes the same number of values of the first column made for the
electricity consumption in the whole facility.
Now we have precise values of electricity consumption related to one precise value of CO2
intensity for each hour of the whole year and then we multiply these values in order to get the
production of CO2 for heat pump per annum. The result is a value of 8535.74 kg.
Page 110
96
5.4.1.2 MicroCHP environmental assessment
The approach that we used for the microCHP is different than the one used for heat pump
since they work in a different way.
MicroCHP device considered for the simulation is an internal combustion engine fed by
natural gas so, firstly, we check how much CO2 is produced by burning this type of fuel.
Again, from “Meter” tab results purchased from EnergyPlus simulation, one can study the
column of the gas consumption for the whole facility for each hour of every day of the year,
considering values in kWh.
After that, we can take the value of carbon dioxide emitted by full combustion of each fuel,
per unit of energy (Biomass Energy Centre, 2014). In particular, for natural gas this value is
227 g/kWh. Nevertheless, for the microCHP we must examine the electricity net related to the
facility whence we have already the electricity profile for wintertime and summertime in the
previous chapters. Using the column from “Meter” tab results with one value for each hour of
the whole year. This parameter stands for the difference between the electricity demand
required by the facility and the electricity production of the microCHP device.
Hence, in this column one can have some negative or positive values as already shown before.
A negative electricity value in this column means that the microCHP manages to produce by
itself the electricity needed by the tenants and they do not need to buy it from the grid.
Following, we will correlate to this column the same CO2 intensity values that we considered
for the heat pump case. Again, we took these values from the same source (Eirgrid Group,
2015) and we take an average value for each hour since they reported the CO2 intensity for
Irish electricity grid for every 15 minutes. As before, we took the same column of CO2
intensity for the Irish national grid that we had used for the heat pump situation.
The difference for the microCHP appliance is that with negative values of the column we can
consider the avoided emission of dioxide carbon from the grid since instead of importing
electricity from the grid (with consequent production of CO2) the microCHP device can
supply on its own the building electricity demand.
In order to determinate the global yearly production of the microCHP it is possible to follow
these steps: firstly, using the whole column of gas consumption in kWh and multiply each
value for 227 g/kWh and we get the column of whole CO2 production by burning gas. If we
sum all values, we get approximately 13903.38 kg of carbon dioxide.
Secondly, for the column of electricity net for facility in kWh, one have to multiply each
value of it for the correspondent one of the CO2 intensity column given in grams of CO2 per
Page 111
97
kWh that allows one to get the final column of dioxide carbon production for each hour of the
year from the electricity consumption.
The sum of all these values is about -4649.38 kWh. This negative value means that the
electricity production within the microCHP device is considered as an avoided production of
CO2 that we would not have had if we had bought electricity from the grid.
Next, we add 13903.38 and -4649.38 to have the result of roughly 9254 kg that is the whole
year production of CO2 for the microCHP.
From this first criterion, it is possible to observe that heat pump is more environment-friendly
since it has a lower CO2 production than the microCHP (8536 to 9254 kilograms in the year).
It means that in the whole year the heat pump will emit about 718.26 kg of carbon dioxide
less than if using the microCHP as shown graphically in Figure 5.11.
Figure 5.11. Whole year CO2 production for microCHP and heat pump devices.
5.4.1.3 Monthly environmental assessment
It is also possible to analyse the trend of the production of CO2 for each month for both
technologies as reported in Figure 5.12.
5000,00
6000,00
7000,00
8000,00
9000,00
10000,00
MicroCHP HP
C
O2
Y
e
a
r
P
r
o
d
u
c
t
i
o
n
[
k
g]
Page 112
98
Figure 5.12. CO2 emissions for microCHP and heat pump devices for each month.
During wither months like December, January and February microCHP system has a higher
production of CO2 compared to heat pump. The same situation is verifiable during summer
months like June, July and August. Conversely, for some months during spring and autumn
such as April, October and November the heat pump production of CO2 is slightly higher than
for microCHP. Generally, this situation is explicable since in Ireland most of electricity is
now produced by onshore (especially) and offshore wind farms built in the country.
Therefore, in months where there is a higher production of CO2 by the heat pump means that
wind blows less than in the rest of the year.
Less wind implies a higher production of carbon dioxide from the heat pump due to the fact
that CO2 intensity of the national grid will be larger. Conversely, less wind will bring more
CO2 production savings from the microCHP.
5.4.2 Economic assessment
The second way to compare heat pump and microCHP systems is through the economic
criterion that specifies for which one of these two devices we will spend less money in order
to supply users’ requests. It is important to underline that, even if the software simulation
refers to 2014 data, in this assessment current prices of electricity and gas have been
considered for both technologies, as they did not vary geatly during these two years.
0
200
400
600
800
1000
1200
1400
1600
P
r
o
d
u
c
t
i
o
n
o
f
C
O2
[
K
g]
MicroCHP
HP
Page 113
99
Moreover, it is important to say that this analysis does not take account of the investment
costs of two technologies but only of the operating costs of them.
5.4.2.1 Heat pump economic assessment
As before, from “Meter” tab results we consider the electricity facility column that contains
the values of electricity consumption for the whole building for each hour of the day. The
analysis is always carried out considering values in kWh.
From the site of SEAI (Sustainable Energy Authority of Ireland), we can find the energy costs
for different types of domestic fuels from 1st of January 2016 (SEAI, 2016).
What one must consider for the heat pump is naturally the cost of electricity and from this
document it is possible to see how these costs vary depending from the band of the house that
is the amount of electricity consumption per annum. As explained in Chapter 2, there are five
different bands for electricity needs as reported:
Band DA: <1000 kWh per annum;
Band DB: >=1000<2500 kWh per annum;
Band DC: >=2500<5000 kWh per annum;
Band DD: >=5000<15000 kWh per annum;
Band DE: >=15000 kWh per annum.
For each of these bands there is a different average price per unit given in €. So one needs to
determine which of these bands applies to the building. To figure out that, one needs to find
out the whole year electricity consumption for the heat pump and this value is easily findable
making sum of all hourly data of the electricity facility column.
For this working problem, the annual usage is approximately 18564.14 kWh and following
the guidelines above the building sits in band DE.
The average price per unit given for band DE is 0.17 €/kWh. By multiplying the annual
electrical consumption for whole building for this tariff we can get the total price for the heat
pump that amounts to roughly 3156 € per annum. This include just the operational cost of the
appliance.
Page 114
100
5.4.2.2 MicroCHP economic assessment
For the microCHP, as done for environmental approach, we re-consider the route to follow
compared to the heat pump to accommodate for the different way of working between the two
devices. Again, we must first consider the gas consumption for the whole facility taking the
same column from “Meter” tab results with hourly consumption in kWh.
According to SEAI website, we could take the same document in order to see that, also for
natural gas, there are different bands depending on the house yearly demand (SEAI, 2016). In
particular, there are three different bands with different tariffs, as presented in Chapter 2.
They are:
Band D1: <5556 kWh per annum;
Band D2: >=5556<55556 kWh per annum;
Band D3: >=55556 kWh per annum.
Therefore, we consider how much the yearly gas consumption is for the whole building. This
value is easily obtainable making the sum of each hourly value of the Excel column and it is
about 61248.39 kWh.
Hence, the building belong to band D3 that has an average price per unit of 0.063 €/kWh.
Multiplying 61248.39 kWh for 0.063 €/kWh, one picks up about 3858.65 € that represents the
total money spent for providing natural gas. Subsequently, one must consider again the
column of electricity net facility equally taken from “Meter” tab results in kWh.
We now consider the global annual value of electricity net facility that we obtain making the
sum of all hourly values in the column. We get a value of -10181.93 kWh that expresses the
surplus that the microCHP produces and which could be sold to the grid. This is the main
economic advantage of the microCHP.
Now, it is possible to assume just one value of the price for selling electricity produced by
micro cogeneration even if it could vary during and year and even if in some periods we can
have electricity bought from the grid because microCHP is not working or, if it works, it
cannot supply the building demand.
Under this assumption, the price is fixed and one can find it in the website (Electric Ireland,
2016) where it is reported that the current average price per unit of electricity produced with
microCHP device is 0.09 €/kWh and it will continue to be valid until 31st December 2016.
Page 115
101
Afterwards, we can estimate the total revenue that residents could potentially receive by
selling the electricity produced, by multiplying -101821.93 kWh for 0.09 €/kWh which equals
-916.37 €.
If we subtract expense of the natural gas as fuel for the microCHP we determinate that the net
cost of the microCHP is 2942.27 €.
In final analysis, we compare the total final prices of heat pump and microCHP that are 3156
€ and 2942 € respectively. So the heat pump has an annual global cost that is roughly 200 €
higher than the microCHP one as displayed in Figure 5.13.
Figure 5.13. Yearly operational price spent for microCHP and heat pump.
5.4.2.3 Monthly economic assessment
As already done for the environmental criterion, it is possible to analyse how prices for
microCHP and heat pump are split for each month as shown in Figure 5.14.
0
400
800
1200
1600
2000
2400
2800
3200
3600
MicroCHP Heat Pump
T
o
t
a
l
P
r
i
c
e
S
p
e
n
t
[
€]
Page 116
102
Figure 5.14 Overall operation cost for microCHP and heat pump devices for each month.
Except for June and July, where prices for microCHP are higher, for the rest of the year the
total amount of the heat pump is higher. The reason for this trend is that, during June and
July, the only request that heat pump has to supply is the domestic hot water since heating
system in the house is not working. In the rest of the year, when also heating is demanded
electricity bought from the grid by the heat pump is more expensive than the natural gas used
to fed the internal combustion engine of microCHP device.
To sum up, using the results of these two approaches we can see that the heat pump is a better
choice if the main concern is to optimise the environmental parameter since it emits a lower
volume of CO2. On the contrary, if money savings is the optimal parameter the microCHP is
a better overall choice since annually it will cost less to operate than the heat pump.
5.5 Net present cost analysis
After the comparison between heat pump and microCHP, the aim of this chapter is to study
these two technologies in relation to a mature heating device as a conventional boiler. In
particular, this analysis is carried out following the method of net present cost (NPC) that
actualize all revenue streams. Only cash flow spent are considered in a period of 20 years.
0
100
200
300
400
500
600
€MicroCHP
HP
Page 117
103
With this investigation, we want to see if a more eco-friendly appliance like heat pump or
microCHP is more expensive, in terms of investment and operation costs, as compared to a
conventional boiler. This study could be useful for a user that wants to submit his old heating
boiler. In order to develop the analysis we use an Excel file where is reported Net Present
Value (NPV) formula considering just the outgoing cash flows; in this case it represents the
Net Present Cost (NPC). For all of three technologies assessment a discount rate of 5% has
been taken and an annual rate of increase of energy price of 1% has been considered.
Moreover, another assumption that has been made in this analysis is that the total
consumption of electricity or gas do not change through 20 years therefore the same amount
of revenue stream spent could be considered for each year.
5.5.1 Boiler simulation’s data
First, we need to have data about gas and electricity consumption of the boiler that we
consider heating the house. It is possible to choose a conventional heating boiler from
EnergyPlus default library that has a thermal output of 15 kW, an overall efficiency of 0.9 and
that is fed by natural gas. Applying this data in the software with the same data used for
previous simulations (climate data, building model, location, etc.) we can easily get another
“Meter” tab results where are reported gas consumption and electricity consumption within
the building for each hour of every day of the year. If we sum up these data, we obtain a
yearly gas consumption of 37174.6 kWh and an electricity consumption of 3935.3 kWh per
annum. An assumption made is that the price of electricity sold to the grid by microCHP
device is constant during 20 years and it still amount to 0.09 €/kWh.
Applying the same method used before for the boiler, it is possible to notice how, with a gas
consumption of 37174.6 kWh the house stays in band D2 while, with an electricity
consumption of 3935.3 kWh the house stays in band DC. Since for band D2 the price is 0.067
€/kWh and for band DC the price is 0.24 €/kWh, we achieve a total amount for gas
consumption of 2491 € per annum and a total amount for electricity consumption of 944.5 €
per annum.
Page 118
104
5.5.2 Analysis development
As already shown in the previous chapter, we have a total amount spent for electricity for the
heat pump of 3156 € per annum while for microCHP we have a yearly amount spent for gas
of 3858.65 € and an annual saving for electricity produced and sold to the grid of -916.37 €.
In order to establish the NPC analysis, we have to consider the investment cost of these three
technologies. This value will be the cash flow spent at the year zero.
Since the boiler is the more settled and spread technology for heating system its investment
cost will be the lower. According to Vaillant website (Vaillant, 2015), it is possible to choose
the model eco TEC Plus 615 that present a thermal output of 15 kW. The investment cost for
this device is 1093 €. For the heat pump, according to www.climamarket.it/ (Carrier, 2015)
website, it is possible to select an air to water heat pump with 15 kW of thermal output. The
price for this appliance is 4048 €. Then, for microCHP device according to Senertec website
(Senertec, 2015) and (Perdichizzi) we choose a Senertec (DACHS) model with 13 kW of
thermal output, suited to request of the building. In this case, the investment cost consist of
13000 €. These three values represent the cost made at year 0 in order to buy these devices.
Now, we have to consider the total operation cost for each technology in 20 years.
Considering that the consumption of gas and electricity will remain the same for all 20 years
and considering an annual rate of increase of energy price of 1% and a discount rate of 5%,
using the Excel formula it is possible to evaluate the NPC for boiler, microCHP and heat
pump.
From the assessment, it is possible to see that the NPC for these technologies are respectively:
45221.74 € for boiler, 44441.64 € for heat pump and 50228.16 € for microCHP. This situation
is reported graphically in Figure 5.15.
Page 119
105
Figure 5.15. Comparison of actual values through NPC of boiler, microCHP and heat pump devices.
From this analysis, we can observe how the heat pump results as the better technology since it
has the lowest actualized operational price. Moreover, in the previous chapter we have
observed how it has also a lower production of CO2 per annum compared with microCHP. If
we have to replace an old boiler, a heat pump could be a good option even if its investment
cost is much higher compared with the boiler.
This could be the same problem for the decision to install a microCHP since it has a high
price of investment. Even if, as we assess in the previous subsection, it has a less operational
costs compared to heat pump.
5.6 Considerations from the analysis
These technologies work well only if houses are energy-efficient, in particular they need to be
well insulated. Related to building model used for the simulation, it is possible to think that
with lower U-values, higher performances of energy savings would have been reached.
Generally, the advantage in cost savings would be more significant when heat pumps and
microCHP are integrated with passive building concepts of air tightness and low-temperature
heating design.
Major barriers for both heat pumps and microCHP include the high initial cost and
insufficient recognition of benefits. First, consumers could help the penetration of these
41000
42000
43000
44000
45000
46000
47000
48000
49000
50000
51000
Boiler microCHP HP
€
Boiler
microCHP
HP
Page 120
106
technologies inside the market if they are sensitive to the protection of the environment since
much less CO2 production is obtained respect to conventional technologies. Moreover, it is
important that policy measures are present to promote the use of technologies including the
standardisation of efficiency indexes, system labelling and incentives in the form of subsides
and grant. For both technologies, the high investment cost, compared with conventional
technologies, is often recognized as disadvantage, even if the overall operation cost under life-
cycle approach is lower. Therefore, incentive schemes could be useful tools to encourage the
whole value chain including, among others, certified/qualified installers and end-users that
can be stimulated to make this significant investment. In the absence of financial supports, the
significant investment cost for end-users is extremely difficult to overcome. They could be
institutional schemes facilitating or providing infrastructure or financial schemes through
special tariffs, grants, taxed based incentives or feed-in-tariff. These schemes must be
transparent, accessible and comprehensible, with defined timelines and amounts (Carbon
Trust, 2011). Grant schemes have been effective in promoting of both microCHP and heat
pumps and in helping to overcome the initial capital cost barrier.
Heat pumps depend mainly on grid features. Its action is carbon free and the building’s CO2
footprint is contingent on the electrical supply from the grid. Heat pumps could not only
reduce the use of fossil fuel and related CO2 emissions with the substitution of conventional
heating systems but they also enable an energy switch from conventional fossil fuels to
electricity, the production of which is (increasingly) based on significant share of renewable
energy in many countries. For the case of Ireland, where lot of electricity is produced by wind
this technology is attractive if renewable energies are fostered. If feed-in-tariff were presented
for electricity produced by renewable source, heat pumps could be more attractive. This could
also help to overcome high upfront investment costs for the consumer point of view.
For microCHP the main benefit is the construction of distributed generation that could
transform consumers into “prosumers” (product-consumers) giving them greater control over
their energy use and production and become active participants in the energy system, to cut
their carbon footprint. Hence, behaviour and mentality of the users could help the spread of
this technology. Moreover, regarding to an internal combustion engine microCHP, a lowering
price of gas could increase the savings but a consumer could not rely on this since it is really
fluctuant.
Page 121
107
What could really foster a microCHP penetration in the market are transparent and stable
feed-in-tariff about generated and exported electricity by this device.
Feed-in-tariff scheme is useful for micro cogeneration diffusion since the scheme guarantees
to pay a fixed tariff for each kWh of electricity generated, and an additional payment for each
kWh of electricity exported to the grid (SEAI, 2011). It is designed to increase the number of
installations of micro cogeneration technologies and to reduce the payback time of the
investment. In Ireland this scheme is present just for biomass and anaerobic digestion CHP
plants.
Currently, in Ireland, do not exist dedicated government policies for the promotion of heat
pumps and microCHP even if they really would help. For example, the UK has recently
developed a policy and grant-aid programme that have the goal to increase heat-pump
penetration in the residential market. Furthermore, in the UK also exist defined, stable feed-
in-tariff mechanisms for microCHP since the UK green energy cashback generation tariff
offers a 10 p/kWh generated electricity plus 3 p/kWh exported electricity (Carbon Trust,
2011). These example represent the importance of central Government interventions since the
UK, as Germany, are the countries with larger numbers of these devices installed in
proportion to end-users in Europe.
As for the Italian context, there are regulatory laws and financial incentives for both heat
pumps and microCHP appliances. For heat pumps, heating and cooling are required due to
prevailing Mediterranean climate of the country. Therefore, heat pumps are considered to play
an increasingly important role, as they can be used for both heating and cooling. Regarding
microCHP devices, several forecast thinking that could supplant conventional boilers.
However, for both technologies the problems are always high upfront costs, lack of awareness
of their benefits, high payback periods and lack of well-informed installers. Consequently,
similar to Italy, with weak governmental action towards the implementation of these
technologies, their penetration, especially in the residential sector, will be very hard.
Page 122
108
References
Biomass Energy Centre. (2014). http://www.biomassenergycentre.org.uk/portal . Tratto da
www.direct.gov.uk.
Carbon Trust. (2011). MicroCHP Accelerator.
Carrier. (2015). https://www.climamarket.it/vendita/pompa-di-calore-carrier-aquasnap-plus-
15-kw-con-modulo-idronico.
COGEN Europe. (s.d.). The benefits of microCHP. Bruxelles: Delta.
Eirgrid Group. (2015). http://www.eirgridgroup.com/how-the-grid-works/system-
information/.
Electric Ireland. (2016, January). https://www.electricireland.ie/residential/home.
Energy Sentry. (2013, June). http://energysentry.com/newsletters/high-electric-bills.php.
http://www.casaeclima.com/ar_18884__RINNOVABILI-Cogenerazione-cogenerazione-
microgenerazione. (2014, July 15).
O' Sullivan, J. (2014). Heat without fire: heat pumps as a solution for carbon emissions.
Engineers Journal.
Perdichizzi, A. (s.d.). Sistemi per l'energia in edilizia: Microcogenerazione. Univeristà degli
Studi di Bergamo.
SEAI. (2011). Commercial microCHP field trial report. Sustainable Energy Authority of
Ireland.
SEAI. (2016, January 1).
http://www.seai.ie/Publications/Statistics_Publications/Fuel_Cost_Comparison/Dome
stic-Fuel-Cost-Comparisons.pdf.
Senertec. (2015). http://www.senertec.it/it/derdachs.html.
Vaillant. (2015). http://www.vaillant.co.uk/installers/products/ecotec-plus-612-615-618-624-
630-3584.en_gb.html.
Page 123
109
Chapter 6: Conclusions
The aim main of this thesis work was developing a comparison between a heat pump and a
microCHP device in the heating of a detached house located in Ireland. This analysis has been
carried out following environmental and economic criteria.
The secondary objective of the work was providing an overall view on the state of art of these
two technologies, on the business models suitable for them and on currently regulatory
framework at European and Irish state level that could foster their penetration in the energy
market.
Regarding the literature review, treated in the first part of this work, main parameters and
typical values of the two technologies have been defined. For heat pumps we have Coefficient
of Performance (COP) and Seasonal Performance Factors (SPF) while for microCHP devices
we have defined thermal, electrical and overall efficiencies, Primary Energy Savings (PES)
and Carbon Benefit Ratio (CBR). In order to define these parameters two field trials lead by
the Energy Saving Trust (for heat pumps) and the Sustainable Energy Authority of Ireland
(for microCHP) have been followed. Moreover, a brief overview of various types of heat
pumps and microCHP devices was presented.
Regarding business models, ESCOs, leasing and feed-in-tariff models were discussed.
Implementations of these models, based on local or regional contexts, could help the
penetration of heat pumps and microCHP devices into several energy sectors, including
residential heating market.
Finally, a discussion on regulatory frameworks showed that there are specific European
Directives that regulate microCHP and renewable sources (including heat pumps) market,
define the operation of these appliances and explain how each Member State must transpose
them into a national legislative framework. The discussion paid particular attention to Ireland
since the simulation and modelling work is set around a residential building in Ireland.
The technology comparison discussion focused on an air to water heat pump and an internal
combustion engine microCHP. To perform the comparison the following were necessary:
create a model of the residential building to be used in the simulation, design the heating plant
Page 124
110
layout and specify the single hour operational settings during the year chosen for the
simulation, 2014 in the case. The software used for the simulation was EnergyPlus.
From the results of the simulation it has been possible to observe the electricity profile of the
two technologies during the summertime and the wintertime and, comparing them, it is
possible to understand when there is an electrical or, a thermal demand. This has been the first
way to compare the performance of each technology. Moreover, from the results of the
simulation, according to the electricity consumption of the heat pump and the gas
consumption and electricity produced by microCHP it is possible to obtain how much CO2
they produce in the whole year. Taking the value of the CO2 intensity of the national Irish
grid we assess a yearly CO2 production from the heat pump of 8535.74 kg and from the
microCHP of 9254 kg. From the same data, we determine the price of electricity and gas
according to the building yearly consumption, and it is possible to evaluate the yearly
operation cost of the heat pump that is 3156 € and the operation cost of microCHP which
amounts to 2942 €. According to these results, the heat pump is more attractive from an
environmentally friendly point of view since it produces roughly 700 kg of carbon dioxide
less than the microCHP in the whole year during its operation. Conversely, microCHP has a
lower cost of operation since the annual operating cost of the heat pump is about 200 € higher,
without considering the initial investment cost.
Additionally, a Net Present Cost (NPC) analysis, developed for 20 years, has been carried out
in order to compare these two appliances and with a conventional heating boiler. We use the
same data resulting from the software simulation.
With an investment cost of 1093 € for the boiler, 4048 € for the heat pump and 13000 € for
the microCHP the NPV study gives the following results: an actual value of 45221.74 € for
the boiler, 44441.64 € for the heat pump and 50228.16 € for the microCHP.
Due to the technological differences between the air source heat pump and the gas-fuelled
microCHP, we use a variety of criteria to normalize those differences. This allows us to
observe the optimal nature of each technology within a given context. Operationally, the heat
pump returns the better results as it has the lowest actualized operational price and it has also
a lower production of CO2 compared with microCHP. Both these technologies have a much
lower operational cost compared with a conventional boiler and their main barrier to uptake
inside the energy residential market is their high initial investment cost.
Page 125
111
Market uptake barriers and alternatives for consumers were discussed. The reality is that the
market needs to be prepared in order to foster the penetration of these systems. There needs to
be (at a minimum) a sufficient amount of qualified installers, certified equipment available
and ready to install and educated consumers. It is also important to recognize the role of the
Government in terms of market uptake and providing support through clearly defined
regulatory frameworks. In addition, approachable business models for investment in
renewable energy and energy efficiency (such as heat pumps and microCHP) could help
private consumers to make such purchases. By clearly stating the benefits of long-term
investments and addressing concerns such as the high up-front costs, the business models can
mitigate a lack of awareness and knowledge about these technologies. In particular, ESCO’s
scheme or financial institutions such as banks can promote the uptake of heat pumps and
microCHP with creation of leasing or loan schemes. The large-scale deployment of heat
pumps and microCHP is affected by factors that are common to other emerging technologies
such as uncertainties in the market and the long-term nature of investment in the energy
sector. Therefore, in order to achieve their full potential, investments in infrastructure are
needed, along with supportive business initiatives and an increased social awareness of
environmental issues.
In the end, the results from the analysis and the literature review show that heat pumps and
microCHP systems in the residential heating context are feasible projects, attracting both
economic and environmental aspects. Generally, to become economically desirable the
investment cost must be lower or, at least, the end-user must have the possibility to overcome
this barrier with fostering business models. It is furthermore fundamental the development of
relevant policies and regulations that include stable grant schemes, feed-in tariff schemes in
order to define and stimulate benefits of these technologies.