Universitat Polit` ecnica de Catalunya BarcelonaTech. Institut de Ci` encies Fot` oniques Thesis in co-tutorship with Universit´ e Paris Diderot, Paris 7 Laboratoire Mat´ eriaux et Ph´ enom` enes Quantiques CNRS UMR 7162 Thesis presented to obtain the qualification of Doctor from the Universitat Polit` ecnica de Catalunya. BarcelonaTech. in sciences By: BRICE DUBOST Under the direction of: Prof. MITCHELL W. Morgan (Universitat Polit` ecnica de Catalunya. BarcelonaTech.) Dr. GUIBAL Samuel (Universit´ e Paris Diderot, Paris 7) Subject : Light-matter interaction with atomic ensembles Defended in Institut de Ci` encies Fot` oniques the MM DD YYYY In front of the jury composed of: Mr. Julien Laurat Mr. Aur´ elien Dantan Mr. Carlo Sirtori Mr. Hugues De Riedmatten
Transcript
Universitat Politecnica de CatalunyaBarcelonaTech.
Institut de Ciencies Fotoniques
Thesis in co-tutorship with
Universite Paris Diderot, Paris 7
Laboratoire Materiaux et Phenomenes QuantiquesCNRS UMR 7162
Thesis presented to obtain the qualification of Doctor fromthe Universitat Politecnica de Catalunya. BarcelonaTech.
in sciences
By: BRICE DUBOST
Under the direction of:
Prof. MITCHELL W. Morgan (Universitat Politecnica deCatalunya. BarcelonaTech.)
Dr. GUIBAL Samuel (Universite Paris Diderot, Paris 7)
Subject :
Light-matter interaction with atomic ensembles
Defended in Institut de Ciencies Fotoniquesthe MM DD YYYY
In front of the jury composed of:
Mr. Julien LauratMr. Aurelien DantanMr. Carlo SirtoriMr. Hugues De Riedmatten
Abstract
The study of quantum light-matter interaction with atomic ensembles is an activeresearch area. This kind of system allows fundamental studies on measurementin the context of continuous variables, in collective entanglement and in quantumsimulations. This field of research is also interesting in the context of quantummetrology, quantum networking and quantum computation. In this thesis twocomplementary aspects of light matter interaction with atomic ensembles havebeen studied with trapped ions and cold neutral atoms. The trapped ion experi-ment is intended to evaluate the possibility to use large ion clouds for realizing aquantum memory with long coherence times. Whereas the cold atom experimentfocused on the use of quantum non demolition measurements to evaluate non-Gaussian states. This experiment is similar to quantum networking experimentcurrently planned.
Laser cooled trapped ions can reach a crystalline phase due to the strongCoulomb repulsion between ions. In this phase the relative positions betweenthe ions is fixed avoiding collisions and the ions to explore magnetic field inho-mogeneities which can be a source of coherence loss. At low ion number, longcoherence times have been demonstrated. With large ion numbers, the trappingmechanism can induce heating of the ion cloud thus making more difficult to ob-tain the crystallized regime. During this thesis, large Coulomb crystals containingmore than 1× 10⁶ ions have been obtained and signature of electromagneticallyinduced transparency in such system have been obtained. This study also re-vealed limitations of this kind of systems which have to be further studied toallow strong light matter interaction probability with cold large ion ensembles ina regime allowing for long coherence times.
Neutral atoms systems allow strong light matter coupling probabilities butusually reduced coherence times. Quantum memories, entanglement betweenatoms and light, high precision magnetometry have been demonstrated with neu-tral atomic vapors. The system used during this thesis is designed to allow stronglight matter coupling probability with detuned polarized light pulses, allowing toprecisely measure the spin state of the atomic system without destruction and lownoise. The measurement noise of the system is lower than the atomic noise openingthe way for collective entanglement (via measurement induced spin squeezing) andultra sensitive magnetic field measurements. This system is closely related withsystems designed for quantum networking and quantum memories. Non Gaussianatomic states are a resource for quantum computation and quantum communica-tion, in the context of atomic physics experiments, their detection can be difficult.The work presented in this thesis focuses on the detection of non Gaussian statesin atomic ensembles using cumulants, and in particular their noise properties.
Resume
L’etude de l’interaction lumiere matiere avec des ensembles atomiques est un do-maine de recherche actif. Ce type de systeme permet des etudes fondamentalessur la mesure dans le contexte de variables continues, l’intrication collective, etles simulations quantiques. Ce domaine de recherche est egalement interessantdans le contexte de la metrologie quantique, la communication quantique etl’informatique quantique. Dans cette these, deux aspects complementaires del’interaction lumiere matiere avec des ensembles atomiques ont ete etudies avecdes ions pieges et des atomes neutres refroidis par laser. L’experience basee sur lesions pieges a pour but d’evaluer la possibilite d’utiliser de grands nuages d’ions afind’obtenir une memoire quantique possedant un long temps de coherence. Alorsque l’experience atomes froids c’est concentree sur l’utilisation de mesures nondestructives pour detecter les etats non gaussiens atomiques. Cette experienceest semblable aux experiences de communication quantique qui sont actuellementmenees.
Les ions pieges refroidis par laser peuvent atteindre une phase cristalline duea la forte repulsion de Coulomb entre les ions. Dans cette phase, les positionsrelatives entre les ions sont fixees evitant ainsi les collisions et que les ions ex-plorent les inhomogeneites du champ magnetique, ce qui peut etre une source dedecoherence. Des temps de coherence tres longs des degres de liberte internes ontete mis en evidence avec des ions uniques. A grand nombre d’ions, le mecanismede piegeage peut induire un rechauffement du nuage d’ions, ce qui rend plus dif-ficile l’obtention d’un systeme cristallise. Durant cette these, de grands cristauxde Coulomb contenant plus de 1× 10⁶ ions ont ete obtenus, ainsi que la signa-ture de la transparence electromagnetiquement induite. Cette etude a egalementrevele les limites de ce systeme qui doivent etre etudiees plus en profondeur afind’obtenir une forte probabilite d’interaction avec des ensembles d’ions froids dansun systeme permettant de longs temps de coherence.
Les systemes d’atomes neutres permettent de fortes probabilites de couplageentre la lumiere et la matiere, mais en general, des temps de coherence pluscourts. Les memoires quantiques, l’intrication entre les atomes et la lumiere, lamagnetometrie de haute precision ont ete demontres dans des experiences baseessur des vapeurs atomiques neutres. Le systeme utilise dans cette these est concupour permettre une grande probabilite de couplage entre la matiere et la lumiere,en utilsant des impulsions de lumiere polarisee, qui permettent de mesurer avecprecision et de maniere non destructive l’etat de spin du systeme atomique avecun bruit faible. Le bruit de la mesure dans ce systeme est inferieure au bruitatomique, ce qui pourrait provoquer l’intrication collective des spins atomiques(par l’intermediaire du spin squeezing induit par la mesure) et des mesures dechamp magnetique ultra sensibles. Ce systeme est etroitement liee a des systemesconcus pour la creation de communication quantique et de memoires quantiques.
Les etats atomiques non gaussiens representent une ressource pour l’informatiquequantique et la communication quantique, dans le cas d’experiences de physiqueatomique, leur detection peut etre difficile. Le travail presente dans cette these seconcentre sur la detection des etats non gaussiens dans des ensembles atomiques enutilisant les cumulants, et en particulier le bruit associe a la mesure des cumulants.
Resumen
El estudio de la interaccion luz materia con conjuntos atomicos es un area deinvestigacion activa. Este tipo de sistema permite fundamental estudios sobre lamedicion en el contexto de las variables continuas, en entrelazamiento colectivay en las simulaciones cuanticas. Este campo de la investigacion tambien es in-teresante en el contexto de la metrologıa cuantica, comunicacion cuantica y lacomputacion cuantica. En esta tesis dos aspectos complementarios de la inter-accion luz materia con conjuntos atomicos han sido estudiados con iones atrapadosy atomos neutros frıos. El experimento de iones atrapados pretende evaluar laposibilidad de utilizar grandes nubes de iones para la realizacion de una memoriacuantica con largo tiempo de coherencia. En vez de que el experimento de atomosfrıos se centro en el uso de medidas de no demolicion cuantica para evaluar estadosno gaussianos. Este experimento es parecido a los experimentos de comunicacioncuantica que se desarrollan actualmente.
Los iones atrapados enfriados por laser pueden llegar a una fase cristalina de-bido a la fuerte repulsion de Coulomb entre los iones. En esta fase, las relativasposiciones entre los iones se fijan de manera a evitar las colisiones y los ionesque exploran inhomogeneidades del campo magnetico que puede ser una fuentede perdida de coherencia. Con bajo numero de iones, largos tiempos de coheren-cia han sido demostrados. Con iones numerosos, el mecanismo de captura puedeinducir un calentamiento de la nube de iones, haciendo ası mas difıcil de obtenerel regimen cristalizado. Durante esta tesis, los cristales de Coulomb grandes quecontiene mas de 1× 10⁶ iones se han obtenidos y la prueba de la transparenciainducida electromagneticamente en tal sistema ha sido obtenida. Este estudiotambien revelo las limitaciones de este tipo de sistemas que tienen que ser estudi-ado mas a fondo para obtenir una fuerte probabilidad de interaccion con conjuntosde iones frıos en un regimen permitiendo largos tiempos de coherencia.
Los sistemas de atomos neutros permiten fuertes probabilidades de acoplamientoluz materia, pero generalmente reduce los tiempos de coherencia. Memoriascuanticas, el entrelazamiento entre atomos y la luz, magnetometrıa de alta pre-cision han sido demostrados en experimentos relaciondaos con vapores atomicos
neutros. El sistema utilizado en esta tesis se ha disenado para permitir que laprobabilidad de acoplamiento luz materia sea importante, con pulsos de luz po-larizada, lo que permite medir con precision el estado de espın del sistema atomicosin destruccion y con bajo ruido. La medicion del ruido del sistema es mas bajaque el ruido atomico, lo que podrıa inducir el entrelazamiento colectivo de losespines atomicos (a traves del squeezing de espines inducido por la medicion) ymediciones de campo magnetico ultra sensibles. Este sistema esta estrechamenterelacionado con sistemas disenados para la creacion de comunicacion cuantica ymemorias cuanticas. Los estados atomicos no gaussianos constituyen un recursopara la computacion cuantica y la comunicacion cuantica, en el contexto de losexperimentos de fısica atomica, su deteccion puede ser difıcil. El trabajo pre-sentado en esta tesis se centra en la deteccion de los estados no gaussianos enconjuntos atomicos utilizando cumulants, y en particular el ruido relacionado conla medicion de los cumulants.
B Rubidium data 137B.1 Rubidium spectroscopic data . . . . . . . . . . . . . . . . . . . . . 137
C Offset lock for MBR 139
D Various 143D.1 Branching ratios . . . . . . . . . . . . . . . . . . . . . . . . . . . . 143D.2 Lifetime and frequencies of low energy levels of Sr+ . . . . . . . . 144
10 CONTENTS
Bibliography 145
Chapter 1
Introduction
1.1 Context
The recent theoretical and technological advances allow to control light and atomicsystems down to the quantum level. This level of control allows one to proposeand implement experiments and devices using quantum properties to outperformtheir classical counterparts and, from a more fundamental point of view to un-derstand quantum process which were only thought experiments a few years ago.Metrology benefits from quantum engineering both when light and atoms areused as sensors [Wilpers 02, Louchet-Chauvet 10, Gross 10, Schnabel 10], in par-ticular in the context of magnetometry [Budker 07, Shah 10, Kominis 03], timemeasurements [Andre 04], and interferometric length measurement [Schnabel 10].Devices based on the control of quantum properties are predicted to allow solvingsome computation problem faster than with classical computation and to imag-ine communication devices that ensure security by the law of physics instead ofa computationally hard problem. These perspectives need quantum control ofboth light, for propagatin quantum information and matter for storing and pro-cessing quantum information. In this context, the quantum interface betweenlight and matter [Hammerer 10] is particularly important both for writing fromlight to matter [Hedges 10, Longdell 05, Zhao 09b, Hosseini 11] and extractinginformation from matter to light.
The quantum properties of single particles and ensembles can be controlledwhich leads to two different, non-exclusive approaches. Single particles are simplersystems and their quantum properties are better controlled than ensembles butthey can suffer from low interaction levels with the environment. Single photonsare hard to detect and are difficult to couple with single atoms (or ions). Onthe other side, ensembles can provide strong interaction probabilities, but theirquantum properties are difficult to control. In this context, the work presentedin this thesis has been made following two complementary approaches: improving
11
12 CHAPTER 1. INTRODUCTION
the light matter interaction probability with large ion ensembles and studying themeasurements of non-Gaussian states in atomic ensembles.
Trapped ions are known to exhibit long coherence times and good quantumcontrol and detectivity. The strong Coulomb repulsion avoids collisions betweentrapped ions but makes high densities difficult to achieve. Neutral atoms on theother side are known for a stronger interaction probability thanks to higher atomicdensity but present usually smaller coherence time for the information stored inthe internal degrees of freedom. The ion experiment goal is to achieve sufficientlyhigh densities in the perspective of a quantum memory with trapped ions. Theneutral atoms experiment takes advantage of the strong interaction to implementlow noise quantum non demolition measurements. This system has been used tostudy the use of a statistical tool: the cumulants to detect non Gaussian statesin atomic ensembles. Non Gaussian states are a resource for several quantuminformation and quantum communication tasks.
This work have been divided over two research groups: the ion trap workat the Ions Pieges et Information Quantique group in Laboratoire Matriaux etphenomenes quantiques at Universite Paris Diderot and the neutral atoms exper-iment at Morgan Mitchell’s group in Institut de Ciencies Fotoniques(Barcelona).
1.2 Organization of the manuscript
The thesis is organized in two main parts:
1. a first part containing the work on ion ensemble and the description ofthe experimental techniques used on both experiments. This part coverschapter 2 to chapter 7 with the description of the experimental techniquesin chapter 3. This part is divided in the following chapters:
• Chapter 3 describes ion trapping and cooling techniques as well as theexperimental set-up
• In Chapter 4 the work performed to reach large coulomb crystals isdescribed
• A new, simple method for isotopic enrichment is described in Chapter5
• Chapter 6 Describes spectroscopic measurements performed to measureisotopic shifts in strontium, allowing better addressing of the variousisotopes in the trap.
• The measurement of light matter interaction strength as well as thelimiting factors are described in Chapter 7
1.2. ORGANIZATION OF THE MANUSCRIPT 13
2. a second part describing the work on the detection of non-Gaussian statesin atomic ensembles starting page 101. This part is divided in the followingchapters:
• Cumulant theory and its application to atomic non Gaussian states arepresented in Chapter 8
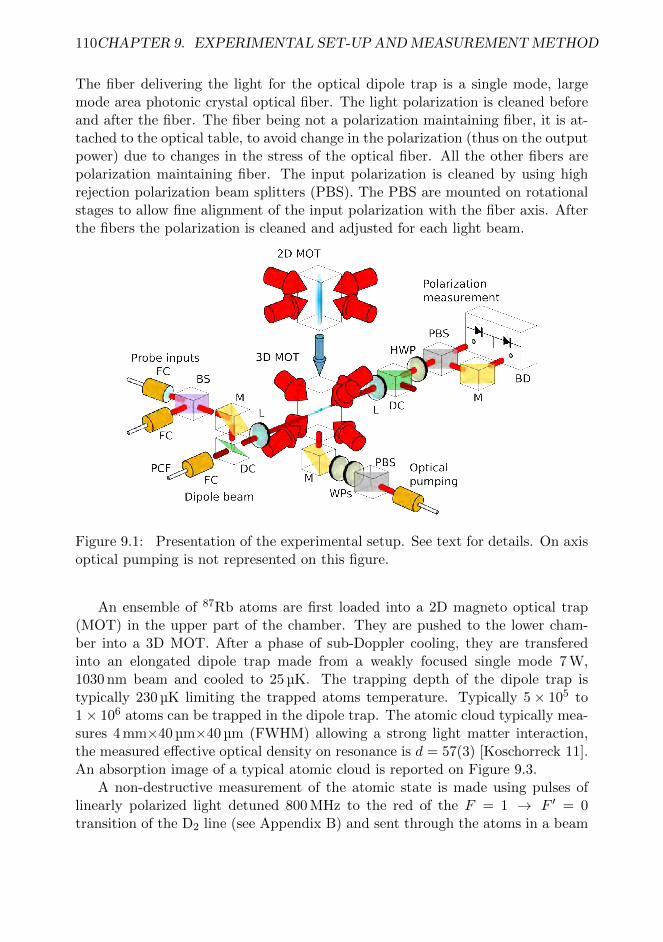
• Chapter 9 covers the experimental setup used and the method for pro-ducing test states
• The analysis of the noise performance of cumulants in the context ofdetection of non Gaussian states in atomic ensembles is presented inChapter 10
14 CHAPTER 1. INTRODUCTION
Part I
Towards high light mattercoupling in ion Coulomb
crystals
15
Chapter 2
Introduction
Trapped ions allowed great advances in metrology and quantum information pro-cessing. Indeed they are close to the ideal physical system, as a single ion canbe trapped during days in a ultra high vacuum chamber without being signifi-cantly disturbed by the trapping potential and the collisions. Such systems havedemonstrated very long coherence time of quantum superpositions stored in theinternal degrees of freedom (> 10 s for magnetically insensitive states and 1 msfor magnetically sensitive states) of quantum information stored in a single ion[Langer 05, Schmidt-Kaler 03], and two trapped ions have been entangled for morethan 20 s [Haffner 05].
Interface between light and ions have also been demonstrated at the singlephoton-single ion level [Piro 11, Slodicka 10] but suffers from the low light matterinteraction probability. This interaction probability can be increased by the use ofcavities. The collective strong coupling regime have been demonstrated in trappedions [Herskind 09]. In this regime, the physics of the system is dominated by theinteraction between ions mediated via the cavity which enhances the light fieldstrength thus the light matter interaction. This approach which is very promisingis technically difficult and, in the perspective of quantum memories suffers froma limitted bandwidth due to the presence of the cavity.
Another, complementary approach is to increase the light matter interactionprobability by increasing the number of ions while keeping the density reasonablewithout the help of a cavity. This approach is challenging because of the strongrepulsion between ions, and the possibility of sample heating from the trap atlarge ion numbers. Previous work in the group [Removille 09a] opened the wayon enhanced light matter interaction with large ensembles.
In the following, work toward greater light matter interaction with large ionensembles will be presented. This work allowed for the measurement of significantsingle pass probe absorption levels ( ≈ 3%), and the signature of Electromagnet-ically Induced Transparency in large ion ensembles have been observed. This
17
18 CHAPTER 2. INTRODUCTION
study allowed to identify current limitations of the system, to measure spectro-scopic shifts in Strontium and to develop a new isotopic enrichment method.
This work has been performed in the Ion Pieges et Information Quantiquegroup at Laboratoire Materiaux et Phenomenes Quantiques. The goal of the groupis to study quantum information aspects with trapped ions in two experimentalcontexts: large ion Coulomb crystals trapped in a 2D Paul trap and the effect ofthe trap design on ion heat rate in the context of sub millimetric surface traps.
In chapter 3 standard ion trapping techniques will be presented, as well asthe experimental apparatus. Work performed allowing to trap million ions in aCoulomb crystal is presented in chapter 4. Isotopic enrichment method is pre-sented in chapter 5. Spectroscopic measurementss of Strontium isotopic shifts aredescribed in chapter 6. And finally light matter interaction probability measure-ments and Electromagnetically Induced Transparency in large ion ensembles arepresented in chapter 7.
Chapter 3
Ion trapping and experimentaloverview
In the following chapter we will present the different aspects of ion trapping andcooling and the experimental set-up allowing the formation and manipulation oflarge coulomb crystals.
3.1 Ion trapping and cooling
Ion traps, since their first demonstration in the 1950’s have been of great interestfor fundamental and applied research. They allow to trap charged particles withvery low perturbations for extremely long periods of time, thus making possi-ble some ideal realizations for fundamental research. On the other hand, theirmass selectivity allowed the development of an important range of applications inparticular in the domain of mass spectrometry.
The electric charge of ions allows for a strong interaction with electric andmagnetic fields but Laplace’s equation (Equation 3.1) forbids the existence ofminima for the electrical potential φ, thus preventing the trapping of chargedparticles with static electric fields.
∂2φ(x, y, z)
∂x2+∂2φ(x, y, z)
∂y2+∂2φ(x, y, z)
∂z2= 0 (3.1)
Two different solutions were proposed by Wolfgang Paul and Hans Dehmeltfor which they have been awarded with the Nobel price in 1989. Hans Dehmeltproposed to use both magnetic fields and electric fields [Dehmelt 68]. The presenceof a magnetic field in the trap may constitute an important limitation for manyatomic physics experiments.
19
20 CHAPTER 3. ION TRAPPING AND EXPERIMENTAL OVERVIEW
Wolfgang Paul proposed, in the 1950’s, to use specially designed time varyingelectrical fields in order to create a confining effective pseudo potential. The orig-inal Paul trap uses hyperbolic shaped electrodes to generate a purely harmonicpseudo potential thus creating several constraints on the trap design. An impor-tant evolution of the Paul Trap is the linear Paul trap, used in this thesis, whichhas been invented in 1989 [Prestage 89].
In the following we will review the concepts of ion trapping and cooling inthe case of linear Paul traps. The reader interested to other traps and to morecomplicated cases can refer to the abundant literature available, in particular[Ghosh 95].
3.1.1 Ion trapping in linear Paul traps
Ions are confined in a linear Paul trap using both static and radio-frequencyelectric fields. The radio frequency field is designed to trap in two dimensions(X-Y plane), the trapping in the other dimension is ensured by a static electricfield (Z axis).
The 2D confinement is ensured by a time varying quadrupolar potential (Equa-tion 3.2) where VRF is the amplitude of the radio-frequency field, VDC is the staticpotential, and R is the distance between the trap center and the electrode edge.The shape of this potential at t = 0 is represented on Figure 3.1. This poten-tial is usually generated by four cylindrical electrodes (ideally with an hyperbolicsection) organized on a square for which the radius of the electrodes is approx-imately equal to the distance between the trap center and the closest electrode.Such arrangement is visible on Figure 3.3 page 27.
φ(x, y, t) = (VRF cos (ωRF t)− VDC)x2 − y2
R2(3.2)
Figure 3.1: Quadrupolar potential created in the Paul trap. This potential canbe expressed by Equation 3.2
3.1. ION TRAPPING AND COOLING 21
By carefully choosing VRF , ωRF and VDC the particle can have a non diverging(stable) motion in the trap as will be seen in the next paragraph.
Equations of motion The trajectory of a particle of mass m and charge Zeplaced in the potential of Equation 3.2 obeys the following equations of motion :
m∂2x
∂t2=Ze(VRF cos (ωRF t)− VDC)
r20
x
m∂2y
∂t2= −Ze(VRF cos (ωRF t)− VDC)
r20
y
By introducing the following dimensionless parameters :
q =ZeVRFmR2ω2
RF
a =ZeVDCmR2ω2
RF
τ = ωRF t (3.3)
The equations of motions can be rewritten in the following form :
∂2x
∂τ2+ (a− qcos (τ))x = 0
∂2y
∂τ2− (a− qcos (τ))y = 0
This is the canonical form of the Mathieu equations, these equations admitnon diverging solutions for different ranges of the a and q parameters called sta-bility zones. These conditions have been discussed extensively in the literature:[Ghosh 95, Drewsen 00]. There is a infinite number of stability zones, we willconsider only the so called first stability region. This stability region correspondsto the simple case where a ≈ 0 (VDC ≈ 0 V) and q 1, i.e. the radio frequencyfield time variation is fast compared to the typical ion motion. This region isschematically represented on Figure 3.2.
Low order solutions The Mathieu equations do not exhibit analytical solu-tions for the general case, but they can be solved under some approximations. Inthe following, only the lowest order solutions for the first stability zone will bediscussed. Higher order solutions give corrections that are out of the scope of thisintroduction.
For |a| 1, |q| 1 the Mathieu equations admit solutions of the followingform:
u(t) = u0 [1− qcos (ωRF t)] cos (ωrt)
Where ωr = ωRF
√q2
2− a
(3.4)
22 CHAPTER 3. ION TRAPPING AND EXPERIMENTAL OVERVIEW
0 0.2 0.4 0.6 0.8 1
0
-0.4
-0.2
0.4
0.2
a
qFigure 3.2: First Stability zone, in grey the zones for which the Matthieu equa-tions admit stable solutions.a and q are defined in Equation 3.3.
Since |a| 1, |q| 1, we have ωr ωRF . So the ion motion consists in ahigh amplitude oscillation at low frequency called the secular motion, surimposedto a fast, low amplitude oscillation called micromotion.
By averaging in time the fast motion, the motion of the ion is similar to themotion of a charged particle in an harmonic potential called pseudo-potentialwhich can be expressed the following way:
Φ(r) =1
2mω2
rr2
In the case a = 0
ωr = ωRFq√2
=ZeVRF√
2mR2ωRF
Φ(r) =(ZeVDC)2
4mR4ω2RF
r2
We can notice a dependence of the trapping pseudo potential on the mass ofthe particle. This dependence is an interesting feature and will be discussed inmore detail in chapter 5
Axial confinement The axial confinement is ensured by applying a DC voltageto a set of electrodes (usually called endcaps) creating an harmonic potential alongthe z axis giving the following final potential :
3.1. ION TRAPPING AND COOLING 23
Φ(r, z) =1
2m(ω2
rr2 + ω2
zz2)
The subsequent radial deconfinement due to the Laplace equation can be takeninto account by an effective az which is usually small [Drewsen 00].
Micro motion amplitude The micromotion is the source of the so-called RadioFrequency heating. This heating is due to the energy transfer from the trappingfield to an ion cloud by the collisions between the ions thus is absent when asingle ion is trapped. From Equation 3.4 and with the initial conditions, we cansee that the amplitude of the micromotion is independent of the position on thez axis and is proportional to the distance from the trap center. We see hereone of the advantages of the Linear Paul Trap : we can trap several ions on thetrap axis without micromotion. We notice also that the micromotion amplitudeis proportional to the q stability parameter giving rise to a strong dependencybetween radio frequency heating and this parameter [Prestage 91].
3.1.2 Ion clouds at low temperature
It is possible to trap large numbers of charged particles in a linear Paul trap.When the temperature of the ion cloud is sufficiently low, the ion cloud can bedescribed as a liquid and even as a crystal. The presence of this arrangement is ofparticular interest for single ion addressing in the context of quantum simulationsand quantum information.
Coulomb crystals and plasma coupling parameter An ion cloud at lowtemperature can be studied using the theoretical background of plasma physics.In particular an ion cloud is (generally) a one component plasma. The ther-modynamic properties of a one component plasma are fully characterized by adimensionless parameter ΓP [Ichimaru 82].
This parameter is the ratio between the mean interaction energy and thethermal energy and can be expressed as follows:
ΓP =(Ze)2
4πε0awskBT
where Z is the charge of the ions (usually +1) and aws is the Wigner Seitzradius which can be linked to the density ρ0 :
4
3πa3
ws =1
ρ0
In ion clouds a clear phase transition occurs between the gas and the liquidstate and the transition between the liquid to the crystalline state is continuous
24 CHAPTER 3. ION TRAPPING AND EXPERIMENTAL OVERVIEW
[Blumel 88]. The ion cloud is in a gas phase for ΓP < 2. The crystallization isconsidered to be reached for ΓP > 170 in the case of infinite clouds : [Slattery 80]and for higher values of ΓP in the case of finite clouds. These limits allow for anestimate of the ion cloud temperature given an estimate of the ion density andhigh resolution imaging of the ion cloud.
Crystal density The crystalline state has some interesting properties in par-ticular concerning the density. Considering a crystal at zero temperature. Thecrystal is at the thermodynamic equilibrium (neglecting edge effect), noting thetotal potential φtot this gives:
φtot(r, z) = cst
∇2φtot(r, z) = 0
∇2φtrap(r, z)
Ze+∇2φcharge(r, z) = 0
The potential created by the ions φcharge(r, z) can be computed using thePoisson’s equation :
∇2φcharge(r, z) = −Zeρ0
ε0
Which allows to obtain:
ρ0 =ε0V
2RF
mr40ω
2RF
Where m is the ion mass, r0 the distance between the trap center and theelectrodes. The density inside the ion crystal is constant and only depends onthe mass and the trapping parameters. This important result is valid only forharmonic potentials. The density at the edge of the crystal depends on the tem-perature and can be characterized by a characteristic length : the Debye length[Dubin 99]. This length is expressed as follows :
λD =
√kBTε0e2ρ0
This length can be expressed with the Wigner Sietz radius and the couplingparameter
λD =aws√3ΓP
3.1. ION TRAPPING AND COOLING 25
For an ion crystal, this length is about 20 times smaller than the WignerSeitz radius showing that the edge effects can be neglected, and a crystal can beconsidered as a uniform density medium.
3.1.3 Ion cooling
The principles of laser cooling of neutral atoms applies to trapped ions. However,due to the strong confinement from the trap, the coulomb interaction betweenions and the radio frequency heating displays some particularities of ion cooling.
The tight confinement offers, for some trap configurations, the possibility ofadvanced cooling by addressing transitions between quantized vibrational levels.This technique named “resolved sideband cooling” allows for the cooling to theground vibrational state [Neuhauser 78, Eschner 03]. Singly ionized alkaline earthions possess a Λ level structure, allowing for the use of electromagnetically inducedtransparency (EIT) cooling [Morigi 00]. This technique uses the change in theexcitation probability spectrum induced by EIT for a more efficient cooling.
As described previously, contrary to neutral atoms, ions trapped in radio fre-quency trap can experience significant heating due to the time dependent trappingpotential. The presence of this heating source changes the optimal parameters forlaser cooling. In systems were external heating is negligible, the lowest temper-ature is reached for low cooling intensity and detuning equal to −Γ/2 where Γis the natural linewidth of the excited state [Stenholm 86]. Due to the presenceof heating we need to maintain a significant scattering rate, thus increasing theintensity. At high intensities, the scattering rate is important but its dependenceon the detuning becomes low due to the line broadening, making the process inef-ficient. In this case, the detuning needs also to be increased to operate on the edgeof the broaden line. A compromise has to be found between the high scatteringrate and the cooling efficiency.
In a trap containing several ions, thanks to the Coulomb interaction whichcouples the different degrees of freedom, the ion motion can be cooled in the threespatial directions with only one laser beam. In the single ion case the same is trueif the beam has projections along the three axes of the trap.
Ionic systems, thanks to the strong coulomb interaction, offer the possibilityof efficient sympathetic cooling. By trapping different species or isotopes in thetrap, it can be possible to laser-cool only one of the species without perturbingthe internal states of the others. The heat being exchanged by coulomb interac-tion, this technique allows for the cooling of the whole sample. This technique isof particular interest when direct laser cooling is difficult, for example in molec-ular ions spectroscopy, cold chemistry, mass spectroscopy, molecular ion coolingetc. or when the heating sources are too important, for example in micro-traps[Deslauriers 06, Dubessy 09].
This technique has proven its effectiveness in several experiments. Ion strings
26 CHAPTER 3. ION TRAPPING AND EXPERIMENTAL OVERVIEW
containing about 10 ions can be cooled to less than 10 mK using just one ion asa coolant [Bowe 99]. This approach has been improved for quantum informationpurposes where ions are shuttled in pair. One laser cooled ion (refrigerant) keepingthe qubit ion cooled without affecting the quantum superposition in the internalstates [Kielpinski 02, Home 09, Barrett 03, Jost 09]. This technique also allowsfor the cooling of heavy and complex molecules to ≈ 0.1 K [Ostendorf 06] openingthe way to high precision spectroscopy of proteins and other complex organicmolecules.
Cooling of Sr+ The level structure of Strontium is detailed in Figure 3.10. Weuse the 5S1/2 → 5P1/2 transition as the main cooling transition. Given the naturallinewidth of this transition Γ = 2π × 20 MHz we obtain a Doppler temperatureTD = ~Γ
2kBof ≈ 0.5 mK. For a density of 2× 10¹⁴ ions/m3, the crystallization
temperature is ≈ 10 mK and for a sample cooled down to the Doppler tempera-ture we obtain a crystallization parameter ΓP ≈ 3000 showing that ions can becrystallized using only Doppler cooling.
To avoid accumulation of the ions in the metastable 4D3/2 level, we addressthe 4D3/2 → 5P1/2 transition with a repumping laser. This J → J − 1 transitionpossesses a single field dark state for all polarizations of the repumping laser. Thisdark state can be destabilized by modulating the polarization of the repumpinglaser or by applying a magnetic field [Berkeland 02]. As will be described in thesection 3.10, we use this dark state to find the zero of the magnetic field and applya directing field to destabilize it.
3.2 Trap
The trap which has been used during this thesis is a linear Paul trap designedfor trapping high volume, high density coulomb crystals. The main dimensionsof the trap can be found on Figure 3.3. This trap has been designed to be verysymmetric to reduce the need of electric field compensation [Removille 09b].
3.3 Radio-frequency source
Reaching high densities in a high volume trap while keeping the radio frequencyheating low poses several constraints on the design of the radio frequency source.In particular it is important to operate at a low q trapping parameter [Prestage 91]thus requiring high voltages at high frequencies and having the possibility to addDC voltages to the trapping electrodes for the micromotion compensation.
3.3. RADIO-FREQUENCY SOURCE 27
R
6mm
25.8mm 4mm
9mm
Side FrontFigure 3.3: Trap dimensions and design. The yellow bar are the RF electrodes,the grey pieces are the endcaps.Here R = 3.36 mmFor better shielding, the trap is held between two horizontal metallic ground plates(not represented)
3.3.1 Resonator
As stated previously, to obtain a large light matter interaction in ion ensemblesone of the key parameter is the ion density. Keeping the q parameter low for lowradio frequency heating brings constraints on the choice of the radio frequencyvoltages and frequencies.
The density in an ion crystal and the q parameter can be expressed as follows(see section 3.1)
n = ε0
(V 2RF
mR4ω2RF
+mω2z
)
q =ZeVRFmR2ω2
RF
For a fixed geometry, to increase the density one can increase the radio-frequency voltage VRF or decrease ωRF . Since q has to be maintained low highVRF and high ωRF are needed.
Since the Paul trap and its connections can be seen electronically as almostpure capacitors, resonant LC circuits are often used to generate high voltages athigh frequency by stepping up a standard radiofrequency source. To obtain thesevoltages, we use a double output resonator made of two air spaced coils woundedas a tore with alternating turns. This allows for a good cross inductance andresults in the same resonance frequency for the two outputs and opposite phasesallowing to double the effective VRF with respect to a single resonator. Each
28 CHAPTER 3. ION TRAPPING AND EXPERIMENTAL OVERVIEW
secondary output consists in a 22 turns torus coil made with a copper wire of1.7 mm in diameter. The internal torus diameter is 32 mm and the torus diameteris 15 cm.
The resonance frequency is about 7.5 MHz and the measured step-up gain is 20.This resonator allows for a 50 V amplitude input signal to obtain two signals withand amplitude 1000 V making differential RF amplitude of 2000 V correspondingto VRF = 1000 V, q = 0.04 and ρexpected ≈ 2× 10¹⁴ ions /m3.
In order to protect the RF amplifier, it is important to match the outputimpedance of the amplifier to the resonator. In our case, the amplifier toleratesan impedance mismatch of 3:1.
By measuring, for different frequencies, the relative amplitudes and phaseof the signals across a divider bridge made with a 50Ω resistor and the coupleresonator + trap, the complex impedance of the couple resonator + trap can bemeasured.
Figure 3.4: Impedance of the resonnator without the impedance matching. Seemain text for details.
The result of this measurement is depicted on Figure 3.4. From this mea-surement, the values of the components needed to build an impedance adaptationcircuit like the one depicted on Figure 3.5 can be computed using standard sim-ulation tools such as http://designtools.analog.com/RFIMPD/.
The addition of this circuit, have shifted the resonance frequency by 10%(6.8 MHz to 7.6 MHz) and the impedance at resonance is now Z ≈ 60Ω + i.10Ω,giving an impedance mismatch significantly lower than 3:1 needed for the safe
Figure 3.5: Circuit for impedance matching between the amplifier and the res-onatorGood impedance matching is obtained for C = 600 pF and L = 680 nH
operation of the amplifier.
In order to have access to the resonator output voltage without perturbing itsbehavior, a single turn coil has been placed near the output wire of the resonatorand calibrated. This probe coil allow to measure the output voltage over the fullaccessible range. The result of this measurement versus the input RF power isdepicted on Figure 3.6.
The resonator with the impedance adaptation circuit, allow to reach highvoltages at high frequencies, allowing an important confinement while keepingthe q parameter low.
3.3.2 Micro motion compensation
To reduce the amount of micro motion, the ions must be trapped where at theradio frequency field node. The static electric fields must be compensated at thenode of the radio frequency field to allow the trap potential minimum to overlapwith the RF node.
Stray electric field may arise from geometrical imperfections, the ion pump,deposited charges on insulating surfaces, etc. . . To cancel stray fields two methodsare widely used. The first one uses supplementary external electrodes. The othermethod, used in our trap, consists in adding DC offset to the main RF electrodes.The circuits used for this purpose are depicted Figure 3.7 and Figure 3.8.
The tuning of the compensation voltages can be achieved in different ways.The most used technique is based on the measurement of the micro-motion am-plitude by single photon correlations [Berkeland 98]. Because the cooling laser isdetuned from the transition, variations in speed, have a signature in the absorptionprobability inducing a correlation between the fluorescence and the radiofrequencyfield proportional to the micro motion amplitude. This technique is efficient forsingle ion traps. In the case of coulomb crystals we can use observation of the
30 CHAPTER 3. ION TRAPPING AND EXPERIMENTAL OVERVIEW
200
400
100
600
800
1000
Power before amplifier (dBm)
Ou
tpu
t am
plit
ud
e (
V)
2000
−25 −20 −15 −10 −5
Figure 3.6: RF amplitude on each electrode versus RF power before the RFamplifier. The non linear behavior on the top right corner of the graph is due tothe saturation of the amplifier.The red continuous line is a theoretical fit giving VRF = 68.36
√10PdBm/10
DC
1MΩ
RF
TOELECTRODE
10nF10nF
Figure 3.7: Circuit for mixing the RF andthe DC voltage. This circuit is present oneach RF electrode.This circuit can be considered as a Biastee adapted the the high voltage radio fre-quency. This circuit is placed between thevacuum feedthrough and the resonator box.
3.3. RADIO-FREQUENCY SOURCE 31
U1
U 1DC
U2
U 2
DC
Figure 3.8: Connection of the fourDC voltages to each RF electrode.The bias tee circuit is not repre-sented on this figure.Bars with the same colors are con-nected to the same RF phase (seethe subsection 3.3.1)This connection is made to decouplethe compensation degrees of free-dom with respect to the UDC volt-ages which affect the a trapping pa-rameter.
crystal shape and the isotopes arrangement (see section 5.2 page 58) to adjustthe compensation voltages that are, in any case, less crucial than in the ion stringcase.
In the presence of stray fields, the trap center depends on trap stiffness andtherefore on the radio-frequency amplitude. The compensation voltages (U1 andU2 on Figure 3.8) can be adjusted by imaging an ion cloud and changing theamplitude of the radio frequency field. The voltages are adjusted in order toreduce the position change of the ion cloud as a consequence of this change. Theprecision obtained is on the order 50 V m−1 (which corresponds to a displacementof 30 µm at high RF amplitude).
Figure 3.9: Image of the edge of a natural Sr+ ion cloud for different compensa-tion voltages. The variation of the relative position between the isotopes is clearlyvisible.
The presence of multiple isotopes in the trap can also be used for compensatingstray fields. The trap stiffness is inversely proportional to the mass, which implies,for multiple isotopes cloud, a trapping center different for each isotope when strayfields are present. This differences make the ion cloud asymmetric as can be seenon Figure 3.9. This technique is used in parallel with the previous one.
32 CHAPTER 3. ION TRAPPING AND EXPERIMENTAL OVERVIEW
3.4 Laser system
1004nm
421.7nm
1092nm
407.8nm
1033nm1/25P
1/25S
3/24D
3/25P
5/24D
Figure 3.10: Low energy levels of Sr+ and the associated dipole allowed transi-tions. The lifetimes are presented section D.1.
In order to avoid the accumulation of the ions into the metastable 4D3/2 stateduring the cooling process, a “repumping” laser drives the 4D3/2 → 5P1/2 tran-sition. The repumping laser is a commercial fiber laser (Koheras Adjustik Y10)with a nominal linewidth of 70 kHz and it is stabilized by a transfer lock techniqueusing a ring cavity and a single mode diode GaN laser (Toptica DL100) lockedonto an Rubidium atomic reference.
The different sources and their feedback are schematically represented in Fig-ure 3.11
3.5 Violet laser source
The light needed for ion cooling and manipulation of the 422 nm transition isprovided by a frequency-doubled commercial Ti:Sa laser. In the following section,the optical set-up and the stabilization system will be presented.
3.5. VIOLET LASER SOURCE 33
KOHERAS1092nm
RINGCAVITY
LAMBDA-METER
TO MACROTRAPEXPERIMENT
TO MICROTRAPEXPERIMENT
TOPTICA422nm
SATURATEDABSORPTION
TO MICROTRAPEXPERIMENT
FEEDBACK FEEDBACKMBR 110
+ DOUBLING422nm
SATURATEDABSORPTION
TO MACROTRAPEXPERIMENT
FEEDBACKFEEDBACK
OFFSETLOCK
Figure 3.11: Overview of the laser system and feedbackThe Toptica DL100 diode is locked onto a Rubidium atomic reference. This laseris then used to lock the ring cavity to which the infrared repumping laser is locked.The MBR cooling laser is either locked on it’s atomic reference or, on the TopticaDL100 diode using an offset lock.
VERDI
MBR
L/2PBS
L/2
500mm 100mm
PPKTP
PBS
To experiment
RubidiumCell
L/4ND
PBS
Figure 3.12: Optical set up for the generation and the stabilization of the 422 nmlaser source.
34 CHAPTER 3. ION TRAPPING AND EXPERIMENTAL OVERVIEW
The optical set-up is schematically represented in Figure 3.12. A CoherentVerdi V-18 delivers pump beam of 18 W @ 532 nm. This beam pumps the MBR-110 Ti:Sa laser which delivers a 3 W, single mode beam at 844 nm. The power sentto the crystal is controlled by a couple half-waveplate, polarizing beam splitter.For the alignment of the pump polarization with the crystal axis, a zero order half-waveplate is placed before the doubling crystal. The beam is then focused into aPeriodically Poled Potassium Titanyl Phosphate crystal (Raicol) of 1×2×30 mm3.This crystal is optimized for second harmonic generation of light @ 842 nm andanti reflection coated both at 842 nm and 421 nm.
The doubling efficiency of periodically poled crystal is very sensitive to thetemperature (the doubling efficiency is divided by two when the temperature isaway of 0.25 K from the optimal temperature). The crystal is maintained to itsoptimal temperature (64.5 C) by using an oven from Raicol crystals which hasa long term stability of ±0.05 C. The typical output is in the order of 80 mW ofviolet light for 1.8 W of pump.
Residual polarization fluctuation (less than 1% of rotation) have been noticedafter the crystal. In order to ensure proper operation of the polarization maintain-ing fiber, a PBS is placed in front of the input coupler to clean the polarization.This PBS is held in a rotating mount for fine adjustment of the polarization axisto the fast axis of the fiber.
3.5.1 Frequency stabilization
Thanks to a quasi coincidence between the 5S1/2 → 5P1/2 transition of 88Sr+
and the 5S1/2 (F=2) → 6P1/2 (F’=3) transition of 85Rb [Madej 98] the coolinglaser can be stabilized using an atomic reference. In order to do that, a rubidiumsaturated absorption spectroscopy set-up [Schawlow 82] is used. The cell is 3 cmlong and contains isotopically pure 85Rb. In order to increase the atomic density,it is maintained at a temperature of 120 C. In these conditions, we obtain aprobe absorption of 80% with narrow features with 10% contrast.
In order to get an error signal from the absorption peaks the dither lockmethod is used. The first derivative of the absorption signal is obtained with alock-in amplifier that demodulates a frequency-modulation (amplitude ≈ 5 MHz)imposed to the laser. The main difference with the common Pound Drever Halltechnique [Drever 83] is the lower bandwidth. The MBR-110 is already modulatedat 89.2 kHz for the lock of the cavity thin etalon that ensures single mode oper-ation of the laser. The reference signal is taken on the motherboard of the lasercontroller and injected into the reference input of the lock-in amplifier (FEMTOLIA-MV-200-H). Since the internal modulation modulates the intensity of thelaser by a few percent, an offset is present on the demodulated signal. This offsetis minimized by adjusting the phase of the lock in amplifier and then canceledelectronically. This offset does not vary significantly thus does not constitute
3.6. INFRARED LOCK IMPLEMENTATION 35
a source of instability. The offset-subtracted demodulated signal is sent to thefrequency scan input of the laser via an analog PID filter.
The laser usually remains locked for about half a day. This is mainly limitedby the temperature drifts of the cavity which bring the feedback out of range.At the end of this thesis, this lock has been replaced by an offset lock which isdetailed on Appendix C page 139.
3.5.2 Intensity fluctuations
Whereas the output intensity of the MBR-110 is quite stable ( 2% fluctuationson a timescale of a few minutes) the doubled 422 nm laser beam exhibit relativelylarge intensity fluctuations : 10% to 20% on a timescale of a few minutes. Theorigin of these fluctuations is still unclear, issues in the temperature regulation ofthe crystal being a probable cause. The sensitivity of the oven temperature probedoes not allow to see correlation between the measured temperature and the laserintensity. Pointing instability have been excluded since the signal after the fiberdoes not exhibit significantly larger fluctuations. Work is in progress to set up anoise eater to eliminate these fluctuations.
3.6 Infrared lock implementation
3.6.1 Locking method
The frequency of the 4D3/2 → 5P1/2 transition for 88 Sr+ is 274 589.4 GHz. Thereis no strong atomic coincidence or quasi coincidence at this energy. In the absenceof atomic reference, the laser can be locked to hollow cathode lamps, ultra stablecavities or standard cavities via transfer lock. The later strategy has been set uptaking advantage of the already stabilized 422 nm sources.
The transfer lock cavity is a 3-mirrors, 1 m long ring cavity made from onepiezo controlled spherical mirror (f = 1 m) placed at the back of the cavity andtwo flat mirrors at the entrance ports. All the mirrors are coated for maximizingthe reflection at 422 nm and 1092 nm. The cavity has a finesse of ≈ 100 both in theviolet and the infrared. The two lasers are counter propagating in the ring cavity,the signals from the two lasers are measured independently via the reflexion fromthe entrance mirrors as depicted on Figure 3.13.
A typical signal obtained while spanning the cavity back mirror is depicted onFigure 3.14. One can see the main resonances and the smaller peaks correspondingto the higher order spatial modes.
The repumper laser lock needs to compensate for slow frequency drifts of theorder of 100 kHz/s. To obtain a good flexibility on the set point we implementedthe transfer lock by continuously scanning the cavity and measuring the relativepositions of the resonance peaks [Seymour-Smith 10, Burke 05]. This method
36 CHAPTER 3. ION TRAPPING AND EXPERIMENTAL OVERVIEW
Figure 3.13: IR locking scheme. Transfer lock from the violet laser diode lockedonto an atomic reference to the Infrared laser.
allows for a large capture range and a total flexibility for moving the laser setpointwhile keeping its frequency locked. The detailed scheme is depicted on figure 3.13
Time
PD
Volt
age
Figure 3.14: Typical traces at theoutput of the cavity when the lasersare locked and the cavity is spanning.In red the signal from the 1092 nmlaser, in blue the signal from the422 nm laser. The minor peaks corre-sponds to higher order spatial modes.
A program has been developed for the traces analysis and feedback compu-tation.1 The program continuously records the traces from the cavity. After amoving average on the traces, it detects all the peaks. From the peak positionsit computes the mean time between the violet reference peaks to convert the hor-izontal unit of the traces from time into fraction of free spectral range allowingto take into account changes in the piezo response. It corrects the cavity drift
by measuring the distance between the center of the trace and the closest violetpeak. The feedback gain is chosen to have the best correction in one step. Theinfrared laser frequency is corrected by measuring the distance between the violetpeak closest to the center and the infrared peak closest to the set-point. When theuser requests a change in the frequency of the infrared laser, the laser is movedclose to a calculated position (using the calibrated piezo gain of the laser) andthe set-point is adjusted, taking into account the folding induced by the cavityFSR. Generally, the laser is able to reach the target position (within 1 MHz) intwo steps.
This lock is a pure integral lock with the gain adjusted in order to have theright correction in one iteration. The lock bandwidth is ≈3 Hz, currently limitedby the non linearities of the cavity piezo which would even become larger at higherfrequencies. Since the feedback is relatively slow compared to the response timeof all the elements in the loop, there are no stability concerns.
3.6.2 Calibration and performances
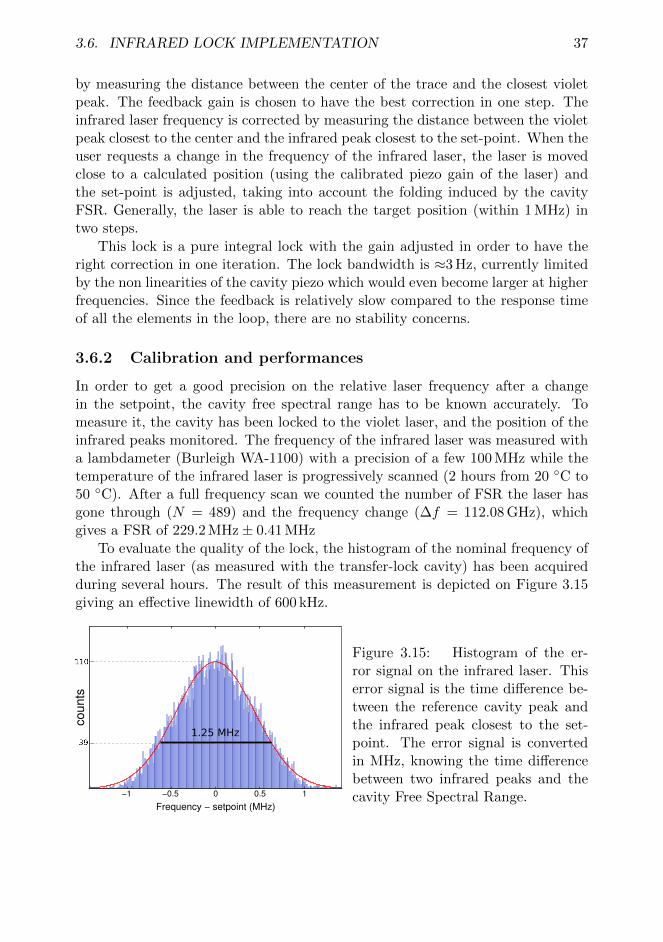
In order to get a good precision on the relative laser frequency after a changein the setpoint, the cavity free spectral range has to be known accurately. Tomeasure it, the cavity has been locked to the violet laser, and the position of theinfrared peaks monitored. The frequency of the infrared laser was measured witha lambdameter (Burleigh WA-1100) with a precision of a few 100 MHz while thetemperature of the infrared laser is progressively scanned (2 hours from 20 C to50 C). After a full frequency scan we counted the number of FSR the laser hasgone through (N = 489) and the frequency change (∆f = 112.08 GHz), whichgives a FSR of 229.2 MHz± 0.41 MHz
To evaluate the quality of the lock, the histogram of the nominal frequency ofthe infrared laser (as measured with the transfer-lock cavity) has been acquiredduring several hours. The result of this measurement is depicted on Figure 3.15giving an effective linewidth of 600 kHz.
Figure 3.15: Histogram of the er-ror signal on the infrared laser. Thiserror signal is the time difference be-tween the reference cavity peak andthe infrared peak closest to the set-point. The error signal is convertedin MHz, knowing the time differencebetween two infrared peaks and thecavity Free Spectral Range.
38 CHAPTER 3. ION TRAPPING AND EXPERIMENTAL OVERVIEW
3.6.3 Limitations and possible improvements
This lock is mainly limited by two factors: the non linearity of the cavity piezoresponse, and its bandwidth. The first problem limits the precision, the erroris estimated to be about 1% across the FSR. This situation can be improvedby using violet laser peaks as a ruler to estimate the non linearity in real time.The bandwidth is mainly limited by the mass of the back mirror. Scanning thisheavy mirror faster increases the non linearity of the scanning (because it becomessinusoidal). A factor of 10 can be obtained by replacing this mirror by a smallerone. Then the lock would be limited by the acquisition card sampling rate which iscurrently of 250× 103 s−1. In this case a faster data analysis could be implemented[Seymour-Smith 10].
3.7 Frequency and polarization control
As stated previously, natural strontium contains several stable isotopes. The iso-tope shifts are sufficiently large for independent laser addressing and, for evenisotopes, sufficiently close to be addressed using standard accousto optic modula-tors. A more detailed description of these shifts and their measurement is givenin chapter 6. A cooling and a repumping laser beams have been set up for eachof the A=88 and A=86 isotopes as described below.
The frequency of the four beams is fine tuned using accousto optic modulators.The polarization of the violet beam addressing the A=86 isotope is controlled viaan electro optic phase modulator. An overview of the optical set-up is presentedon Figure 3.16.
3.7.1 Probe beam control
The A=86 isotope occupies the center of a natural Sr+ ion crystal (see chapter 4).For this reason, this isotope has been chosen to be the work isotope since itsoverlap with a focused Gaussian laser beam is optimized. The beam addressingthis isotope is used as a cooling, pumping and probe beam. For this reasonfrequency, intensity and polarization of this laser beam can be adjusted quicklyand independently.
Spatial control To ensure a maximum interaction between light and the atomicensemble, the laser beam profile needs to be matched with that of the atomicensemble. For large multi isotope ion clouds, the atomic sample has a cylindricalshape with a length between 5 mm and 20 mm and a diameter between 50 µm and1 mm. As soon as the beam is fully contained in the atomic sample the opticaldepth of the sample does not depend on the diameter. Reducing the size of the
3.7. FREQUENCY AND POLARIZATION CONTROL 39
GLANTAYLOR
POLARIZER
ELECTRO OPTICPHASE MODULATOR
PINHOLE
POLARIZINGBEAM SPLITTER
NON POLARIZINGBEAM SPLITTER
QUARTERWAVEPLATE
HALFWAVEPLATE
BEAMSTOPPER
AOM 1 AOM 2 AOM 3 AOM 4
IONS
422nmfrom MBR-110
1092nmfrom KOHERAS
PROBEPHOTODIODE
Figure 3.16: Frequency and polarization control of the laser sources.This set-up allows us to address independently and simultaneously the couplesA=88,86 or A=86,84. The frequency and intensity controlled is ensured by theuse of accousto optic modulators. The polarization of the violet beam addressingthe A=86 isotope is controlled using a electro optic phase modulator.
40 CHAPTER 3. ION TRAPPING AND EXPERIMENTAL OVERVIEW
probe beam is important for maximizing the interaction for a given number ofions.
As shown on Figure 3.16, the probe beam is focused onto a 100 µm pinholewith a f=30 mm lens and imaged on the ion cloud with a bi-convex, 2”, f=500 mmlens in a 2f-2f configuration. This configuration allows for a diffraction limitedimaging of the pinhole and spatial mode cleaning.
In order to check the quality of the final beam, it has been imaged onto alinear Prosilica GC660 CCD camera. A 2D Gaussian fit of the measured intensitygives a beam intensity waist of 27 µm which corresponds to 90% of the intensitycontained in a circle of 113 µm diameter, in good agreement with the expectations.The Rayleigh length associated to this waist is 5 mm corresponding to the typicalhalf length of the ion cloud.
After the ion trap, the beam is re-imaged with a similar 2f-2f configurationonto the probe photodiode.
Figure 3.17: Set up for the control of the radio frequency for the probe AOM. Thisset up allows for a fast switching between two frequencies and two attenuations
Polarization control In order to control the populations in the various Zeemansublevels in the 5S1/2 state (Figure 3.18) the polarization of the beam addressing
3.7. FREQUENCY AND POLARIZATION CONTROL 41
1/25P
1/25S
3/24D
3/25P
5/24D
mF -1/2 +1/2
Figure 3.18: Levels of Sr+ with the Zeemansublevels. With a magnetic field along thetrap axis we can address the5S1/2(mF = +1/2) → 5P1/2(mF = −1/2)and5S1/2(mF = −1/2) → 5P1/2(mF = +1/2)with the two opposite circular polarizationsThis allows for the pumping and probeatoms in the 5S1/2(mF = −1/2) and5S1/2(mF = +1/2) states
the 5S1/2 → 5P1/2 transition has to be controlled. For optical pumping and prob-ing purposes, the two circular and one linear polarization are needed at differenttimes in an experimental sequence.
The electro optic modulator used has a π voltage (the voltage needed to createa π phase difference between the two axis) of about 1000 V at 422 nm. To obtainfast response times, an electronic circuit for switching the high voltage (HV) sentin the EOM has been developed. This circuit, depicted on Figure 3.19 is based onHV field effect transistors driven using fast optocouplers isolating the TTL inputsfrom the control computer card.
The fast optocouplers possess internal amplifiers and need their own powersupplies relative to the output low point. In order to avoid isolation issues, thesepower supplies are provided by batteries. The lifetime of the batteries is in theorder of 200 working hours. This circuit is able to switch between three volt-
42 CHAPTER 3. ION TRAPPING AND EXPERIMENTAL OVERVIEW
ELECTRO OPTICMODULATOR
DIGITALINPUT 2
DIGITALINPUT 1
DIGITALINPUT 3
V1 V2
V3
SLOW
FAST
HIGHVOLTAGE
V1
V2
V3
Figure 3.19: Circuit for the fast commutation of the Electro Optic ModulatorEach transistor commutes a voltage to the electrode. The bottom transistor isneeded for faster switching from high to low voltages. The three voltages aremade by a resistor bridge with fine tuning provided by variable resistors. Thetransistors (STP4N150) are driven using an external TTL signal through opto-isolators (A6N37) which are powered with batteries to avoid isolation issues.The stabilization capacitors between the voltage bridge and the transistors areomitted on this sketch.
3.8. FEMTOSECOND PHOTO-IONIZATION LASER 43
ages which are adjusted for delivering the three wanted polarizations. Typicalswitching time is ≈10 µs for rising voltages and ≈100 µs for high to low voltageswitching. The switching time is mainly limited by the capacitance of the 1 mcoaxial cable between the circuit and the EOM.
3.8 Femtosecond photo-ionization laser
In the following, the characteristics of the photo ionization laser and its doublingsystem will be presented.
Neutral strontium atoms are ionised driving a two-photon transition towardsa self-ionising level [Removille 09b, Kirilov 09]. The photoionizing laser pulses areissued from a doubled Ti:Sa oscillator (Tsunami, Spectra-Physics) with a centralfrequency of 695 THz (λ = 431 nm) and a pulse duration of ≈ 150 fs. The spectralwidth associated to these ultrafast pulses (≈ 10 THz) makes this loading processinsensitive to both Doppler effect and isotope-shift, providing samples with acomposition that respects the natural abundances. A summary of the technicalcharacteristics of the laser are reported on Table 3.1
Optical power 1.5 W @ 860 nmRepetition rate 80 MHz
Pulse Width ≈ 150 fsBandwidth ≈ 10 nm(adjustable)
Beam diameter 2 mm
Table 3.1: Characteristics of the mode locked femtosecond Ti:Sa laser
The 862 nm output beam is focused using an achromatic lens (f=30 mm) ontoa 250 µm thick BIBO crystal from CASIX for second harmonic generation. Atthese power levels, regular damage of the crystal has been noticed, which reducessignificantly the doubling efficiency after ≈ 100 hours of operation. The crystaldamage is localized on the laser focus spot, allowing to move the crystal for re-covering normal operation. After the crystal, the blue beam and the pump areseparated using dichroic mirrors. This allows us to use the depleted pump topump another crystal for the other ion trap experiment of the group. After dou-bling, 500 mW of blue power is obtained, which corresponds to a 33% conversionefficiency. This blue beam is expanded to a diameter of 1 cm then focused intothe trap using a f=300 mm lens.
The loading performances of this laser are detailed in chapter 4.
44 CHAPTER 3. ION TRAPPING AND EXPERIMENTAL OVERVIEW
3.9 Imaging system
Trapped ions offer an excellent detectivity. The depth of the trap (≈ 20eV)allowing for the collection of the fluorescence from a strong cycling transitionwithout losses. Moreover, in the context of this thesis large ion ensemble areused, thus providing a large signal (as can be seen on Figure 4.7) reducing theconstraints on the imaging system. The ion cloud is imaged from one side andfrom above. The side imaging system consists in a Coolsnap EZ CCD camera(Roper ScientificTM) and a standard f=85 mm photo lens. The lens is attachedto the camera using a homemade extension tube. The camera pixels are 6.45 µmlarge and the magnification of this imaging system is 1:2.
The imaging system above the cloud is similar to the side one and consists ina Prosilica GC1600 camera with 4.4 µm pixels and a f=58 mm photo lens. Themagnification of this system is 1:3.
A software has been developed for the control of the top camera and is availableat : http://github.com/braice/Camera-interface
High resolution images in this manuscript were taken with a modified sideimaging system. For the high resolution images, the imaging system consisted intwo camera objectives and a Prosilica GC1020 camera. The first objective is aCanon EF Macro-lens 100 mm f/2.8 placed just outside the viewport (≈ 30 cmaway from the trap). With this distance, we obtain an image with a magnificationof about 1:1 approximately 10 cm after the back ring of the lens. This virtualimage is magnified using a standard 50mm camera objective used in the reversedirection. The camera sensor is placed ≈15 cm after the front lens of the secondobjective. The position of the second objective is adjusted to obtain the focus onthe camera sensor. The whole system allows to obtain a magnification of ≈2:1.
3.10 Magnetic field control
In all the experiments in this thesis we are working with a magnetic field along thetrap axis (Z) that defines a quantization axis that coincides with the propagationaxis of the probe. The experiments performed are sensitive to the magnetic fielddirection but, to the first order, not to the magnetic field inhomogeneities. Thecontrol of the magnetic field in the trap is achieved by the use of 3 set of coilsoutside the vacuum chamber. In order to null the field at the center of the trap,we use the presence of a one photon dark state on the repumping transition[Berkeland 02]. For B = 0 the ions are trapped in a dark state, superposition ofthe four Zeeman sublevel of the 4D3/2 state, for any polarization of the repumper.By measuring the fluorescence versus the current on each coil, we are able tofind the zero of the magnetic field. To ensure that we are in the zero of themagnetic field and not being in another dark state, we vary the polarization of the
Figure 3.20: Typical fluorescence versus current in the Z coil with X and Y fieldsset to 0.
repumping laser with a set of waveplates. A typical fluorescence measurement as afunction of B is depicted on Figure 3.20 showing a clear minimum for IZ = 0.34 A.The residual fluorescence is due to magnetic field gradients (on a ≈ 5 mm longcloud) and imperfect compensation on the other axis. In the extinction point, thefluorescence does not reappear by changing the repumper polarization. The fieldgenerated by the Z coil is estimated to be ≈ 2 G/A, then the sensitivity of thismethod is ≈ 2 mG deduced from the uncertainty on Figure 3.20.
46 CHAPTER 3. ION TRAPPING AND EXPERIMENTAL OVERVIEW
Chapter 4
Large coulomb crystals
One important goal of this work is to achieve strong light-matter coupling withwell controlled system. Reaching high optical density with trapped ions is partic-ularly challenging but essential for developing a ion based quantum light-matterinterface.
Due to the strong repulsive interaction between ions, achieving a significantoptical thickness in an atomic sample of cold trapped ions is a challenge. Forexample, in the case of Sr+, for a cloud of 2 cm × 200 µm × 200 µm, in order toreach a single pass absorption of 50%, a crystal of a few 107 ions is needed1.
Wigner ion crystals of more than 5× 10⁵ ions have been demonstrated in Pen-ning traps which are not affected by radio-frequency heating [Itano 98, Mitchell 98].In linear Paul traps coulomb crystals of 10 000 ions which exhibit a 3D arrange-ment were demonstrated [Mortensen 06] and crystals with more than 105 ionswere demonstrated [Drewsen 98].
There are several factors which can limit the maximum number of ions in aPaul trap : Trap volume, density, collisional heating, radio frequency heating andthe ratio between loading rate and lifetime.
4.1 Trap density measurement
As seen in section 3.1, the key parameter which controls the ion density is thetrap stiffness. This stiffness can be computed theoretically from the trap voltageand the geometrical characteristics of the trap. These calculations can suffer fromthe various geometrical imperfections of the trap and give only access to a roughorder of magnitude of the cloud density.
By applying a sinusoidal excitation on the trap compensation electrodes (par-allel to the main electrodes) we can excite the ion cloud when the excitation
1The model for estimating single pass absorption is detailled in chapter 7
47
48 CHAPTER 4. LARGE COULOMB CRYSTALS
frequency is resonant with one of the main trap frequencies (“tickling” excita-tion). This excitation can be detected by a change in the fluorescence of the ioncloud. If the cooling laser is significantly red detuned (≈ 5Γ), when the ion cloudis excited the Doppler effect will induce a fluorescence increase.
By repeating this analysis for different radio frequency powers, we are able todeduce the dependence of the radial frequencies with the trap RF voltage. Theaxial frequency has been measured to be ≈ 20 kHz with an endcap voltage of 50 V.The tickle measurements results are depicted on Figure 4.1. This measurementhas been performed on a natural strontium crystal, a comparison with an enrichedcrystals shows that the measured frequency is dominated by the A= 88 isotope.The uncertainty on the measurement is ±5%.
300 400 500 600 700 800 900 1000
50
100
150
200
250
VRF
(V)
Rad
ialf
requ
ency
(kH
z)
Figure 4.1: Radial frequency versus VRF .
From these measurements the density can be computed using the followingexpression (see section 3.1 page 24) :
n =mε0e2
(ω2x + ω2
y + ω2z)
The results are depicted on Figure 4.2.
Using the expressions derived in section 3.1 we can check the consistency ofthis measurement with the expected densities and frequencies obtained from themeasurement of the RF voltage (Figure 3.6 page 30). For P = −10 dBm we havea peak to peak voltage on each bar of 750 V, this corresponds to a radiofrequencyamplitude of VRF = 750 V. This gives a radial frequency of ωx = ωy = q√
2ωRF =
2.π.168 kHz, this is 20% lower than the measured value. This corresponds to a
4.2. IMPROVEMENTS ON THE LOADING RATE 49
300 400 500 600 700 800 900 10000
0.5
1
1.5
2
2.5
3
x 1014
VRF
(V)
Ion
dens
ity(io
ns/m
3 )
Figure 4.2: Ion density versus VRF . The density is calculated from measurementof the radial frequencies made by “tickle” with a radial frequency of 20 kHz.
theoretical density of n = 2mε0e2ω2R = 1.1× 10¹⁴ m−3, this is 40% lower than the
one measured : 1.5× 10¹⁴ m−3.
The new resonator allowed us to reach high densities about n = 3× 10¹⁴ m−3
while keeping a q factor low in a high volume trap.
4.2 Improvements on the loading rate
In the experimental setup formerly developed in the group, the typical loadingrate was about 100 ions/s [Removille 09b] which means that more than 12 hourswere needed to load a cloud containing five million ions. Higher loading rates of3000 ions/s have been obtained by the group of M. Drewsen [Herskind 08].
The loading rate can be improved in two ways : increasing the neutral fluxand increasing the ionization probability.
A too high flux of neutral atoms can increase the chamber pressure and, moreimportantly, if metal gets deposited on the trap electrodes, it can induce anoma-lous heating of the ions [DeVoe 02]. The key parameter increase significantly theloading rate is the photo-ionization probability.
In the following, the strontium oven characterization will be described as wellas the results on the photo-ionization rate.
50 CHAPTER 4. LARGE COULOMB CRYSTALS
4.2.1 Strontium oven characterization
The oven is made from a tungsten wire of 100 µm diameter and 10 cm longwounded in a spiral in which a strontium dendrite sits (Sigma Aldrich 99.9%pure). This wire is held in a metallic housing with an aperture of 3 mm to col-limate the atomic beam. The top of the oven housing is visible on the bottomright of Figure 4.7.
The oven has been characterized by loading an empty trap 10 s and measuringthe final fluorescence for different oven currents. The results are depicted onFigure 4.3.
Loadin
g r
ate
(A
rb.
Un.)
Oven current (A)0.8 1 1.2 1.4
102
100
101
103
104
105
Figure 4.3: Loading rate versus oven current.Since the real loading rate depends on the photo-ionization laser the vertical axisis in arbitrary units.The red line is an exponential fit of the data. The loading rate increases by afactor two for each 0.055 A current step.
The exponential fit of the experimental data gives a characteristic currentof 55 mA. This current is the current needed to double the loading rate. Thisexponential model reproduces well the behavior in the range of current used.
4.2.2 Photo-ionization characterization
When increasing the photo-ionization power, it is important to verify that theloading rate scales quadratically with the laser intensity as expected for sucha 2-photon process. The experimental technique is similar to the one used forcharacterizing the strontium oven. The results are depicted on Figure 4.4.
4.2. IMPROVEMENTS ON THE LOADING RATE 51
0.001
0.01
0.1
ioni
zatio
nra
te(a
rb.u
n.)
40020010060laser power (mW)
Figure 4.4: Loading rate versus photo-ionization power. This curve have beenobtained by measuring the loading time to obtain a given cloud size (containinga few 1e3 ions) versus the photo-ionization laser power. The oven current havebeen chosen to obtain a loading time of 20 s at P = 520 mWWe see the good dependency in I2 and no saturation effect.
The dependency of the loading rate versus the photo ionization laser focusposition has also been studied. The position of the focus strongly influences thetime to get an ion crystal. When the focus is far from the trap center, the ions arecreated with a significant potential energy. This energy has to be removed fromthe system by the laser-cooling. Since in ion traps the cooling efficiency stronglydepends on the temperature, the time needed to reach the crystalline phase issignificantly increased. Once a crystal of a few thousands ions is in the trap, thiscrystal act as a cold bath for newly created ions such keeping the cooling efficiencyhigh. In this way, even if the ions are created far from the center, they are keptin the trap and cooled rapidly, explaining the low influence on the loading rate ofthe distance between the focus of the photo-ionization laser and the trap center.
Let us remark that this study on photo ionization allowed for discovery ofa new phenomenon which leads to the production of Sr2+ ions by removing anelectron to the Sr+ ions with the help of a three plus one photon process.2
The possible issue represented by the production of Sr2+ ions is avoided bydisplacing the focus of the photo ionization laser away from the trap center by≈ 2 mm. This distance is sufficient to avoid the production of Sr2+ ions froma crystallized sample but not from a melted sample. Therefore, our strategyconsists in two steps. First we create a small Coulomb crystal by loading during
2Paper in preparation
52 CHAPTER 4. LARGE COULOMB CRYSTALS
some seconds and waiting until the whole sample crystallizes. Then we resumethe loading that now add ions directly to the crystal.
4.2.3 Final loading rate
With an oven at 1.35 A and 500 mW of photo-ionization laser power we obtain aloading rate of 1100 ions per second. This allows to load million of ions in aboutone hour.
This loading rate whereas being clearly improved, is still lower from what wecould expect from theory. This improvement of the loading rate is an importantstep for studying large ion ensembles. Even if the lifetime of ions in the trap isvery long, it is limited by chemical reactions and laser locks. When a laser goesout of lock, the cooling disappear and the ion cloud leaves the crystalline state.For ion clouds containing several millions of ions, we are not able to recover themdue to the radio frequency heating being significantly larger in the liquid and gasstate than in the crystalline state [Ryjkov 05].
In order to improve the loading rate, the oven could be improved by having abetter thermalization and collimation allowing an higher working temperature.
Other schemes are also developed. The loading rate can be greatly increasedby first trapping and cooling the neutral vapor using a standard neutral atom trapthen photo-ionize the cloud to load an ion trap [Cetina 07]. This scheme has notbeen used with strontium but people already demonstrated successful trappingand cooling of neutral Strontium [Katori 99].
Results and chapter conclusion
As illustrated on Figure 4.5 we have demonstrated successful loading and coolingof ion coulomb crystals containing more than three million ions with a density of3× 1014 ions/m3.
At these densities, in our linear Paul trap the crystal melts when its radiusbecomes larger than a millimeter. For example, the crystal depicted on Figure 4.5melted when the number of ions reached 5.5 millions. The influence of all theparameters on the radio frequency heating have not been studied in detail, so it isnot possible to conclude if this limitation is due to the imperfections of our trap,to the choice of the trapping parameters or if its a more general limit.
In order to verify the crystalline nature of the ion cloud, high resolution pic-tures have been taken, by increasing he magnification of the imaging system.Figure 4.6 displays such a picture of a cloud containing about a million ion at adensity of 2× 10¹⁴ ions /m3.
We can clearly see ion layers which proves, at least a 2D arrangement. 3D ar-rangement cannot be seen, possibly because the temperature is too high [Mortensen 06].
4.2. IMPROVEMENTS ON THE LOADING RATE 53
10mm
Figure 4.5: Top picture of a crystal containing 2.8× 10⁶ ions. The non ellipticalshape is due to the anharmonicity of the axial confinement potential. The darkregion inside is due to the isotopes A=86 and A=87 which are not shined on thispicture.Cloud density 3.1× 10¹⁴ m−3, diameter 1080 µm length 13.2 mm. Quasi perfectcylinder. V = 1.2× 10⁻⁸ m3
Figure 4.6: High resolution picture of a big cloud with a density of2× 1014 ions /m3.We can see the layers proving the crystalline state of this ion cloud.
54 CHAPTER 4. LARGE COULOMB CRYSTALS
From these images, it is difficult to determine the value of the coupling parameter(defined in section 3.1).
Let us remark that these crystals are visible to naked eye. A picture obtainedwith a commercial photo-camera is shown on page 55, Figure 4.7.
These crystals contain more than one order of magnitude more ions thanpreviously reported [Hornekær 02]. This regime is unexplored both theoreticallyand experimentally, making this system of particular interest for the study of radiofrequency heating, heat transport in ordered system and more generally studiesof large cold organized samples with long-range interaction.
This number of ions combined with the possibility of sympathetic cooling[Bowe 99] opens the way to quantum information experiments in a novel regime,different with respect to the collective strong coupling regime which has beenrecently achieved [Herskind 09].
Experiments demonstrating EIT and significant absorption with this systemhave been carried out during this thesis and are detailed in chapter 7.
4.2.IM
PROVEMENTSON
THE
LOADIN
GRATE
55
Figure 4.7: Picture of the trap containing a few million ions.From inside to outside. Blue/violet is the fluorescence from the strontium cloud. The gold bars are the RF electrodes.On the side of the electrodes we can see the endcaps. On the bottom we can see the e- gun (not used in this work) andthe strontium oven. Around is the vacuum view-port.This picture was taken using a Canon EOS 7D + Canon EF 200mm f/2.8 L. The exposure time was 3 s at 400 ISO,f/5.6
56 CHAPTER 4. LARGE COULOMB CRYSTALS
Chapter 5
Isotopic enrichment
5.1 Introduction and goal of the method
In this chapter I will present an experimental technique that can be applied to im-prove and characterize sympathetic cooling in the case of multi-isotope Coulombcrystals. As explained in the introduction, sympathetic cooling is one of the mostimportant resources of laser-cooled ions. It can be performed with different atomicspecies, or with different isotopes of the same atom if the isotopic shift is suffi-ciently large to allow independent laser addressing. In the latter situation thecontrol of the isotopic ratio is important for an efficient cooling process. In thecase of strontium, the natural abundances for the isotopes 88,87,86 and 84 arerespectively 82.58%,7.0%,9.86% and 0.56%. In the context of this thesis, we areinterested in using the A=86 or A=87 isotopes as an active atomic medium, whileusing the A=88 as a coolant. An efficient isotopic enrichment would allow us toremove the unwanted isotopes and to control the proportion of the “refrigerator”.For example, if one wants to use the A=87 isotope as a working isotope, its pro-portion is relatively low and it can be necessary to enrich the sample, removing theA=86 and decreasing the amount of A=88 in order to reach a properly balancedratio between the coolant specie and the active medium.
The isotopic control can be obtained using enriched sources [Benhelm 08]which are expensive and difficult to obtain. Another solution is to perform theenrichment by taking advantage of the trapping set-up. Several methods reachingthis purpose were demonstrated. In particular several groups reported successfulenrichment by adjusting the photo-ionization parameters in a way that increasesthe isotopic selectivity [Lucas 04, Mortensen 04, Tanaka 07]. This method has theadvantage to only load the wanted isotopes in the trap, does not induce heatingbut suffers from a lack of selectivity in certain cases. The other major strategiesfor isotopic enrichment are based on selective heating and cooling, either by laser,non linear resonances or tickle [Alheit 96, Hasegawa 00, Toyoda 01]. All these
57
58 CHAPTER 5. ISOTOPIC ENRICHMENT
methods induce heating of the whole ion sample which is a major limitation forlarge coulomb crystals and were only demonstrated for small ion crystals.
Here we demonstrate an isotopic enrichment method based on radiation pres-sure and control of the axial confinement allowing for the control of the ratiobetween the coolant and the isotopes of interest. Our method being very selec-tive, it allows to prepare pure samples of rare isotopes making experiment on rareisotopes more flexible. Moreover it can be combined with isotopic enrichmentmethods based on the photoionization selectivity. In the following we will firstdescribe the ingredients of the method: spatial segregation, and radiation pres-sure, then describe a simulation tool which we have used to study the feasibility ofthis method and finally we will describe the experiment and the results obtained.
5.2 Ingredients for isotopic enrichment
5.2.1 Radial separation
Ion traps mass selectivity has been widely used, in particular in mass spectrome-ters. By tuning the trap parameters it is possible to have small stability regionsthus reaching great mass selectivity. This is the most used property of quadrupo-lar ion traps. As described in chapter 3 we are operating the trap in the firststability region, such that all the strontium isotopes are stable.
In a radio-frequency trap, after averaging out the “fast” micromotion com-ponent, the stiffness depends on the mass. In particular the trapping force isstronger for lighter ions, according to the expression
ωR =1
m
eVRF√2R2ωRF
At a distance r from the trap axis, the potential energy of an ion scales thenas r2/m so the energetic cost of an ion away from the center for increasing massdecreases. This effect is almost invisible on hot samples (for which the kineticenergy is much greater than the interaction energy: Γ 1), but when the ionsare crystallized, the potential energy term dominates and the mass effect becomesvisible. This phenomenon induces a radial segregation clearly visible in Figure 4.5.
This effects tends to organize the cloud in axial concentric shells containingion of different masses with clearly defined edges. This leads to a first method ofisotopic enrichment: by lowering the radio frequency field amplitude the heavyions are removed from the trap by leading them to collide with the electrodes.This method is mostly effective for large ion clouds.
In order to be able to enrich successfully we will combine this effect with theradiation pressure induced by the cooling lasers.
5.2. INGREDIENTS FOR ISOTOPIC ENRICHMENT 59
5.2.2 Radiation pressure
When atoms interact with a laser beam they undergo a force due to the momentumtransfer between the photons and the atoms. It is studied since a few decades[Ashkin 70] and can be expressed as follow :
F =h
λ
1
τNf
Where τN is the lifetime of the excited state (7 ns for Sr+ 5P1/2 state) and fis the proportion of atoms in the excited state.
Calculating analytically the ion arrangement in a crystal, taking in account themass dependency and the radiation pressure is analytically difficult (or impossi-ble). The ion arrangement which minimize the potential energy can be calculatednumerically up to a few million ions. This kind of calculation can give an insighton the ion arrangements for various trapping parameters thus allowing to studythe feasibility of the isotopic enrichment method. A simulation tool has beendeveloped and will be described in section 5.3.
Figure 5.1: Natural strontium ion cloud (density ≈ 1× 10¹⁴ ions m−3, ≈ 5 mmlong) with counter-propagating cooling lasers (similar intensities and detunings≈ −2Γ) for the A=88 and A=86 isotopes. We clearly see a reorganization of theions which is the result of the competition between radiation pressure and theaxial confinement. The dark zone in the middle are the A=87 and A=84 ionswhich are not addressed by the cooling lasers. In the tail of the bright A=86 ionswe see a small dark region which corresponds to the 0.56% of A=84 ions.
Experimentally, radial segregation effects are strong as it can be seen on figure5.1. The ions reorganize themselves in a triangular shape because of the competi-tion between the radiation pressure which would bring all the ions of the pushedisotope on one side and the mass dependent radial confinement which tends tokeep the cloud in an axial shell structure. In other words, if we push the lighterions on one side, some of them will increase their distance to the trap axis. How-ever, this process has an energy cost because they take place of heavier ions thatare less confined.
60 CHAPTER 5. ISOTOPIC ENRICHMENT
This axial segregation is the basis of the proposed enrichment method. Theprecise shape of the Coulomb crystal induced by such a segregation of the differentisotopes depends on the radial confinement and on the amount of radiation pres-sure. Let us mention that the shape of the axial potential (that is not harmonicin our trap) also influences the final shape of the crystal. To study the possibilityfor this axial segregation it is possible to perform simulations described in thenext section.
5.3 Simulations
5.3.1 Position of the problem
The goal of this simulations is to find the ion arrangement which minimizes thepotential energy, taking into account the radiation pressure, the trap confinement(radial and axial) including the mass dependence and the Coulomb interactionbetween the ions.
The simulation is based on minimization using gradient descent algorithm. Fora given ion arrangement, the corresponding energy is computed together with itsgradient (derivative of the energy versus the ion coordinates). Then it is possibleto follow the gradient to reduce the overall energy. This method is extensivelyused and benefits from an abundant literature.
The total energy contains several terms with different algorithmic complex-ities. The potential energy term originating from radiation pressure and trapconfinement only depends on the ion position, so it has a linear O(N) complexity.On the other hand, the Coulomb interaction energy is the sum of the interactionenergy of each ion with all the others so this calculation has a quadratic complex-ity O(N2). For large ion numbers N ≈ 106 this calculation becomes too expensivein computation time to be performed on a normal desktop computer (several daysof computation would be needed).
In ion systems the screening is an important effect and the details of thelocal arrangement of the ions distant from the ion of interest doesn’t changesignificantly its potential energy. This allows us to perform an approximationconsisting in computing the interactions exactly for the nearest neighbors butconsidering an average potential for distant ions that are grouped. This procedureneeds to sort the ion positions at each iteration to define hierarchically the groupsof ions. The overall complexity is dominated by the complexity O(Nln (N)) of thissorting operation: the calculation becomes accessible for a standard computer.Romain Dubessy, former member of the group has a strong expertise in this kindof algorithms, in particular for simulating the ion motion in a Paul trap in thepresence of laser cooling. His experience strongly contributed to the writing of
5.3. SIMULATIONS 61
the current simulation program. 1
The gradient descent method, in the case we are interested in, suffers fromtwo issues which need to be addressed.
A first issue is a particular version of the local energy minimum problem. Alight ion can remain at the edge of the cloud even if it’s energetically better for itto be closer to the center. This ion on the edge is a local minimum for the system,because having it in the center gives a lower total energy but in order to move itto the center an energy barrier must be overpassed. Several methods are used toavoid local minima in gradient descent algorithms such as simulated annealing.In the particular case of ion cloud arrangements it is possible to use a simplermethod to overcome this issue. By adding an iteration to the gradient descentwhich checks if making a permutation between two ions of different masses canimprove the situation, we solved this problem in an efficient way without increasingthe complexity.
The second issue is the choice of the gradient descent algorithm. The naiveapproach consists in multiplying the gradient by a constant to compute the newpositions : ~PN+1 = ~PN + α~G where α is a constant, ~PN the position vector atiteration N and ~G is the gradient. This approach can lead to slow convergenceand/or oscillations around the minimum. Several approaches can be used to over-come this problem, most of the methods being based on a dynamic α dependingon higher order energy derivatives and previous α values. In our case we obtainedsatisfying results by adopting a simpler approach consisting in increasing or de-creasing α at each step choosing the value which provide the largest decrease onthe final energy as a new value. This approach leads to two phases. A first phasefrom the initial condition to an almost crystallized clouds during which the ionsneed to be moved significantly and α increases. When the ion cloud approachesthe crystalline state, important ion displacements do not decrease the energy ofthe system anymore and α decreases, allowing for the final adjustment of the ionpositions.
5.3.2 Results
A typical result of a simulation is depicted on Figure 5.2. This simulation is inexcellent qualitative agreement with the experimental observations.
This simulation tool allowed us to understand the subtile aspects of simul-taneous segregation by mass and radiation pressure in a radio frequency trap.Moreover it demonstrated the feasibility of isotope enrichment (see next section)and could be used in the future to optimize this process for different traps andparameters.
1The program is available at : http://github.org/braice/FindMinimum
62 CHAPTER 5. ISOTOPIC ENRICHMENT
Figure 5.2: Simulated image of a multi-isotope Coulomb crystal containing 106
Sr+ ions with a natural abundance probability. The image is obtained by simpleprojection of the ion position without any attempt of simulating the depth of fieldof the imaging system.The calculated ion positions minimize the potential energy taking into account thedifferent masses, the radiation pressure and the trapping potential (harmonic).The 88Sr+ ions are in blue, the 86Sr+ in green, the 87Sr+ in purple and the 84Sr+
in white.The 86Sr+ (88Sr+) ions are pushed to the right (left) via radiation pressure.This simulation have been performed with the following parameters: For 88Sr+
ωr = 263 kHzFor all isotopes ωz = 35 kHzLaser detuning equal to the natural linewidth and with a saturation parameters = 0.17
5.4. EXPERIMENTAL ISOTOPE ENRICHMENT 63
5.4 Experimental isotope enrichment
The use of radiation pressure allows us to perform an efficient axial separation ofthe ion isotopes. In order to perform the enrichment it is necessary to control theaxial confinment potential to selectively eject ions from the trap.
5.4.1 Endcaps electrodes control
By adjusting the voltages applied to the endcap electrodes, it is possible to lowerprogressively the axial trapping potential allowing the ions at the cloud edge toleave the trap. The simulated pseudo potential for two different endcap voltagesset is shown on Figure 5.3. The potential due to each electrode of the trap hasbeen calculated with the software Simion r2.
Figure 5.3: Trapping potential for two endcaps configurations commonly usedfor isotopic enrichment.On the left part : normal trappingOn the right part : one of the endcap is lowered to allow escaping of onestrontium isotope
As can be seen on the simulation of the pseudo potential on the trap axis(Figure 5.4), the potential is still confining even with the endcap electrode voltageset to 0 V. This is due to the way the radio frequency field lines close at the endof the radio frequency electrodes.
Because of this phenomenon it is necessary to apply slightly negative voltagesto the endcap electrodes to perform selective ejection. The electronic circuitdepicted on Figure 5.5 has been used to generate such voltages controlled with asufficient precision (≈ 10 mV).
For enriching an ion sample, the propagation directions of the lasers are ad-justed in order to push the isotopes to be removed towards the controlled endcap
2http://simion.com
64 CHAPTER 5. ISOTOPIC ENRICHMENT
−15 −10 −5 0 5 10 15
0
150
100
50
-50
-100
Z (mm)
Pse
udo p
ote
nti
al (m
eV
)
0V
-0.2Vtrapping zone
Figure 5.4: Pseudo Potential on the trap axis for two endcaps configurations.This pseudo potential includes contributions of the Radio Frequency field (1000 Vsymmetric) and the endcaps. The left endcap is set to 1 V. The grey zone corre-sponds to the length of the Radio Frequency electrodes.The blue curve is obtained with the right endcap set to 0 V. We see that in thiscase, the ions can still be trapped. The endcap voltage has to be set to a slightlynegative voltage in order to open the trap along the z axis. For example −0.2 Vrepresented by the red curve.
Figure 5.5: Circuit used for the fine controlof the endcap voltage. The potentiometerallows us to add a voltage between -1.5Vand 1.5V to the main power supply. Thisvoltage allows for a fine tuning of the axialconfinement potential when the main PSUis set to 0V. It is put on the low side of themain PSU for safety reasons. Two of thesecircuits are implemented on the experiment.
5.5. RESULTS AND LIMITATIONS 65
and push in the opposite direction the enriched isotope. The radio frequency am-plitude and the laser detuning are then adjusted to optimize the axial segregationof the isotopes at the cloud edge. The endcap high voltage source is then loweredbefore adjusting progressively the endcap voltage down to the “escape point” atwhich the unwanted isotope gradually leaves the trap (characteristic proceduretime of a few seconds).
5.5 Results and limitations
This method allows for a great selectivity and flexibility. From a naturaly loadedcloud containing 0.56% of the A=84 isotope we are able to make a cloud containingalmost 100% of A=84 ions. During the enrichment process, less than 20% of theA=84 ions contained in the original cloud are lost. To prepare this cloud, firstall the A=88 ions of the original cloud are removed. Then the lasers are set topush towards the same direction the A=86 and A=84 ions, in order to removethe A=87 ions. Finally the A=86 ions are pushed towards the other directionand removed. A similar sequence allowed us to realize a balanced sample ideallysuitable to perform simultaneous spectroscopy of the A=86 and A=84 ions asdescribed in the chapter 6.
One of the main interests of this enrichment method consists in the optimiza-tion and control of sympathetic cooling in large (≈ 106) ion clouds. For exampleit is possible to remove the “dark” or useless isotopes not addressed by the lasersystem and tune the proportions between the isotopes of interest. A typical ex-ample with the A=86 and A=84 isotopes is visible on Figure 5.6. As an exampleof usefulness of the method, we report in Table 5.1 the estimated achieved purityof the samples obtained in two cases: for a target of a pure 84Sr+ crystal and inthe case of a 50% crystal of 88Sr+ and 86Sr+.
Mass number Natural strontium Remaining ratio Remaining ratioafter enrichment after enrichment
Table 5.1: Results example for work on rare isotopes and sympathetic coolingcontrol. Theses results have been obtained with clouds containing a few 1× 10⁴
ions. Typical unwanted losses for the kept isotopes are between 10% and 20%.
This enrichment scheme is based on the possibility to bring ions to be removedto the edge of the trap using radiation pressure. This implies natural limitations:
66 CHAPTER 5. ISOTOPIC ENRICHMENT
Figure 5.6: Enriched strontium cloud with A=84 ions pushed to the right, andA=86 ions to the left.
There is a few 103 A=84 ions and about 105 A=86 ions in this cloud.We can distinguish a few Sr2+ ions in the middle of the cloud, and a dark shell ofA=87 and A=88 ions around the cloud which causes a small indent on the upperleft edge.
Lighter ions can be removed more easily than heavier ions. In their case the effectof radiation pressure is combined with the radial organization of the cloud as canbe seen on Figure 5.2. This enrichment method is also more difficult to performfor tight traps for which the effect of radial arrangement becomes dominant overthe radiation pressure. Typically in our trap, the enrichment became difficultfor radial frequencies of ωR ≈ 200 kHz when the cloud contained more than a few1× 105 ions. We also expect that the shape of the axial potential, flat bottom andvery stiff edges (see Figure 5.3 and Figure 5.4) makes this method more difficult.
Chapter conclusion
This isotopic enrichment method that we have developed provides a flexible wayto enrich ion clouds with a very high selectivity without heating the ion sample.This scheme allowed us to control sympathetic cooling and to work with rareisotopes. Moreover this scheme can be combined with selective photo ionization,in order to increase the selectivity and providing a very efficient way to work withrare isotopes such as 43Ca (0.135%) which is of interest for quantum informationexperiments [Lucas 04].
Chapter 6
Isotope-shift measurements
6.1 Introduction
Ion traps, and in particular Paul traps, are an ideal tool for high resolutionspectroscopy. Ion traps provide the possibility to perform measurements on aquasi ideal system. A single trapped ion can be almost perfectly decoupled fromthe environment, it experiences less than one collision per second (in a typical1× 10−10 mbar vacuum chamber) and the static electric and magnetic fields canbe controlled. Since the trapping mechanism does not rely on the internal energylevels, its influence is extremely low and can be compensated with a very goodprecision [Margolis 04].
Ion traps, compared to neutral atom traps, are very tight and deep. Thisbrings several interesting properties for spectroscopy applications. First the trap-ping lifetime is extremely long, reaching in some cases several days. This longtrapping lifetime allows for measurements to be limited only by the lifetime ofthe probed levels. The motional energy levels can be sufficiently spaced for theuse of very efficient cooling mechanisms such as sideband cooling [Heinzen 90].This opens the possibility to cool down an ion to its vibrational ground state[Monroe 95], thus eliminating Doppler uncertainties. Finally the depth of the iontraps allows to perform repeated fluorescence measurement thus providing a greatdetectivity.
These properties allows clocks based on single trapped ions to surpass primaryCs fountain microwave standards, and reach unprecedented levels of precision (e.g.Aluminum, Mercury, Strontium and Ytterbium) [Rosenband 08, Margolis 04, Schneider 05],techniques proposed to reach precisions of 10−19 with trapped ions [Campbell 12].
Finally the strong coulomb interaction between ions and the possibility to putdifferent species or isotopes in the same trap open new possibilities in the contextof spectroscopy with trapped ions. Among them, quantum logic spectroscopyhas been demonstrated recently [Chou 10]. Quantum logic spectroscopy uses the
67
68 CHAPTER 6. ISOTOPE-SHIFT MEASUREMENTS
quantum motional state as a bus to map the internal state of one ion onto thestate of another.This mapping allows for the readout of the state of a ”difficult-to-measure” ion (which does not possesses a strong cycling transition or a shelvingstate) by the readout of its neighbor.
As mentioned in the previous chapter, strontium possesses several natural iso-topes that constitute a useful resource for sympathetic cooling. For that purposeit is important to know the frequency isotopic shifts of the transitions used forlaser-cooling. The detailed level structure is reported in section D.2 page 144.
Moreover this kind of measurements helps to improve the understanding ofthe nuclear structure and may feed the models predicting the values of the atomictransitions. In the case of strontium II ions most of the isotope shifts are notwell known. Isotope shift measurements on the 5S1/2 → 5P1/2 transition havebeen obtained for the first time in the 50’s using hollow cathode spectroscopy andgrating spectrometers : [Hughes 57]. Taking the A=88 isotope as a reference,the measured shift was ∆ν88,86 = −165± 30 MHz and ∆ν88,84 = −330± 60 MHz.More precise measurements were performed in the 80’s using fast beam laserspectroscopy : [Silverans 88] [Buchinger 90] [Borghs 83]. The measured shift was∆ν88,86 = −167(13)MHz and ∆ν88,84 = −361(25)MHz. Measurement with thesame precision have also been done on the A=87 isotope which possess an hyper-fine structure : [Sunaoshi 93].
The data available regarding the isotope shift on the metastable levels aremore recent due to the weakness of this transition and has been obtained withtrapped ions. The 5S1/2 → 4D5/2 is of particular interest for clocks. A precisemeasurement of the isotope shift between the isotopes A=88 and A=86 has beenperformed [Lybarger 11]. An isotope shift of ∆ν88,86 = 570.281(4)MHz has beenmeasured. To our knowledge, there are no reported isotope shift measurementson the 4D3/2 level.
With laser induced fluorescence spectroscopy, we have measured with mega-hertz precision the absolute frequency of the 5S1/2 → 5P1/2 transition for theA=88, A=86 and A=84 isotopes and the isotopic shift on the 4D3/2 → 5P1/2
transition for the A=88, A=86 and A=86, A=84 couples. The results are pre-sented on Figure 6.5.
In this work the isotope shifts have been obtained by studying the fluorescencespectra obtained by scanning the repumping laser frequency at fixed cooling laserfrequency. These spectra contain the information on the 4D3/2 → 5P1/2 transitionfrequency. Such a 3-level scheme leads to the existence of a 2-photon dark-stateinvolving the cooling and the repumping laser [Berkeland 02]. This dark stateallows us to measure the difference in energy between the cooling laser and the4D3/2 → 5P1/2 transition. Since the cooling laser is locked on a well knowntransition of 85Rb [Shiner 07] we also obtain the energy of this transition. Inorder to extract this information from experimental spectra, we fitted the datato a 3-levels, 2-lasers model. This model is detailed in section 6.2. In order to
6.2. THEORETICAL MODEL 69
reduce the effect of laser frequency drifts, the measurements have been performedsimultaneously on isotope pairs by using a sample containing 103 to 104 ions ofeach isotope.
This chapter is organized as follows: the model will first be presented. Thenthe experimental parameters used will be discussed. Finally the spectra are pre-sented with their analysis.
6.2 Theoretical model
In a 3-level system, the shape and the apparent central frequency of the spectradepend on the laser intensities and detunings. The position of the maxima isshifted by the light shifts and the shape can be affected by power broadening. Inorder to take this phenomenon into account, to choose the optimal experimentalparameters and to get maximum information from the spectra, a model has beendeveloped.
To make the analysis relatively simple while being able to describe the observedspectra we model our system by a collection of independent 3 levels atoms whichare interacting with two lasers for which the polarization is not taken in account[Gray 78].
Due to the presence of the two field dark state, the measured spectra canpresent a dip. The position of the dip mainly depends on the lasers relativedetuning. Its contrast is reduced by any phenomenon which can reduce the co-herence between the 5S1/2 and 4D3/2 levels such as laser linewidth, temperature,collisions . . . We model all these effects by a phenomenological decoherence termbetween the 5S1/2 and 4D3/2 levels. This term models small broadenings of thedip.
The model gives the population in the excited level (proportional to the fluo-rescence) as a function of the following parameters also summarized in Figure 6.1:
• Ωb : The Rabi frequency of the violet laser
• Ωr : The Rabi frequency of the infrared laser
• δb : The detuning of the violet laser from the resonance
• δr : The detuning of the infrared laser from the resonance
• γ31 : The decoherence rate between the ground state and the metastablestate
There are also two fixed parameters: the lifetime of the excited level Γ and thebranching ratio from the excited state to the metastable level ε (for strontium,see section D.2).
70 CHAPTER 6. ISOTOPE-SHIFT MEASUREMENTS
δb δr
ΩrΩb
γ311
3
2
Γ
Figure 6.1: The different free parameters of the model and the levels involved.In the case of Sr+ the levels are 1: 5S1/2, 2: 5P1/2, 3: 4D3/2
We go in the rotating frame with the following transformations :
σ11 → σ11
σ22 → σ22
σ33 → σ33
σ21 → σ21eiE2~ t
σ13 → σ13ei(δb−δi)tei
E3~ t
σ23 → σ23eiE2−E3
~ t
We add the decoherence term and the decay from the excited level, taking inaccount the branching ratio to the metastable state.
And, by adding the equation σ11 +σ22 +σ33 = 1 we obtain an equation matrixwhich corresponds to the following equation :
MSol− Source = 0
6.2. THEORETICAL MODEL 71
M =
iΓ 0 Ωb2 −Ωb
2 0 0 Ωr2 −Ωr
2
−iΓε 0 0 0 0 0 −Ωr2
Ωr2
ΩbΩb2
iΓ2 − δb 0 −Ωr
2 0 0 0
−Ωb −Ωb2 0 iΓ
2 + δb 0 Ωr2 0 0
0 0 −Ωr2 0 iγ31 − δb + δr 0 0 Ωb
2
0 0 0 Ωr2 0 iγ31 + δb − δr −Ωb
2 0Ωr2 −Ωr
2 0 0 0 −Ωb2
iΓ2 − δr 0
−Ωr2
Ωr2 0 0 Ωb
2 0 0 iΓ2 + δr
With the following source term1:
Source =
00
Ωb/2−Ωb/2
0000
The solution is then obtained by analytically inversing the matrix and multi-
plying it by the source term.
This model allows us to compute a spectrum that depends on the free param-eters. A typical example is shown in Figure 6.2
This model is used to guide the choice of the experimental parameters. Wehave decided to set the Rabi frequencies of both lasers between Γ and Γ/2. ARabi frequency too important induces a significant amount of power broadeningand light shifts. On the contrary if the Rabi frequency is too low, the signalbecomes weaker and the signal to noise ratio becomes problematic. Moreover tocompensate for radio-frequency heating it is needed to keep a sufficient coolingpower.
The other important parameter is the detuning of the violet laser. The dip isstronger when the blue laser is close to resonance but it induces cooling issues fortwo reasons. First the cooling become less efficient when the cooling laser is tooclose to the resonance (this issue is discussed in detail in chapter 7), secondly, if thedip is strongly pronounced, effects of EIT cooling [Morigi 00] becomes important.This cooling becomes heating on the other side of the dip. When this effect islow it can affect the shape of the dip, and if it becomes important can melt thecoulomb crystal. Finally the compromise chosen is to have a blue laser detunedbetween −2Γ and −3Γ.
1Which contains terms only due to the violet laser because this source term is due to theremoval of σ11 from M
72 CHAPTER 6. ISOTOPE-SHIFT MEASUREMENTS
δ /2π(MHz)r
0.1
0.0-100-200 100 2000
1/25Ppopulation
Figure 6.2: Excited state population versus infrared detuning for the fol-lowing parameters (typical from the experiment): Ωb = 20 MHz, Ωr = 15 MHz,δb = −22 MHz = −Γ, γ31 = 4 MHzOne can see on the left the two colors dark state which contrast is driven by theγ31 decoherence term.
6.3 Experimental results and discussion
6.3.1 Experimental method
As explained in chapter 5, we can trap the different isotopes of strontium andenrich the ion crystal. The following spectra have been recorded with samplescontaining equal proportions of the isotopes we want to study. In this way thefluorescence signals from th 2 isotopes are comparable and the whole sample can becooled by any of the two isotopes. As we will see this latter property is important.In order to have a significant signal without experiencing significant heating, thesamples contain between 103 and 104 ions.
The value of the isotopic shifts obtained in the literature are sufficiently preciseto set up two beams on the violet cooling laser. The two beams on the infraredrepumping laser were adjusted by preliminary isotope shift measurements. Re-garding the repumping beams, the accousto optic modulators are tuned in orderto have the two beams matching the isotopic shift on the 4D3/2 → 5P1/2 transitionwhich is about 570− 170 = 400 MHz.
The spectra are obtained by scanning the frequency of the infrared laser. Thisscan affects the frequency of the repumping beams for the two isotopes at thesame time, thus allowing a direct measurement (knowing their fixed frequencydifference imposed by acousto-optic modulators) of the isotopic shift. In orderto avoid any crosstalk in the fluorescence measurements for the two isotopes,only one repumper beam among the two is on while measuring the signal. The
6.3. EXPERIMENTAL RESULTS AND DISCUSSION 73
experimental sequence is detailed on Figure 6.3. This sequence is repeated foreach frequency of the main beam.
Isotope 2Lasers
Isotope 1Lasers
Freq IR
Camera
Cooling
New frequency
Image Is
otope 1
Image Is
otope 2
500ms 500ms
Figure 6.3: Experimental sequence for one point of the spectrum
The fluorescence is collected using a linear response CCD camera (Prosilicamodel GC1600). In order to reduce the noise due to the scattering of the coolingbeam, spatial filtering is used by integrating the signal on a portion of the image.
In order to decrease the number of free parameters the background (comingfrom the scattering of the cooling laser in the vacuum chamber) is subtracted.The background is recorded just before loading the trap.
The absence of crosstalk is verified by changing significantly the frequencydifference between the two repumper beams in order to increase the frequencydifference between the maxima of the two spectra. This kind of spectra is visibleon the top right corner of Figure 6.4.
Typical spectra for the two isotope couples studied are depicted on Figure 6.4.The three level model described earlier is in good agreement with the experimentaldata.
When these experiments were performed, technical issues limited the accessibledetunings for the cooling lasers on the A=84 isotope and limited the quality of theisotope enrichment. This two issues made the measurement on the A=84 isotopeless precise, and the spectra are broader.
The spectra were repeated several times to obtain an evaluation of the statis-tical error, the results are reported on Table 6.1. The ∆B are relative to the 5S1/2
F=2 → 6P1/2 F’=3 transition of 85Rb. The absolute frequency of this transitionis 710 962 401 328(40)kHz [Shiner 07]. In order to compute the values of the ∆B,
74 CHAPTER 6. ISOTOPE-SHIFT MEASUREMENTS
a b
c d
Figure 6.4: Typical experimental fluorescence spectra obtained. Green points: data from the heaviest isotope, Blue points : data from the lightest isotopewith their respective fits. Fluorescence intensity differences between isotopes aredue to unbalances in the crystal composition and to slight differences in laserintensities.
Top spectra : Spectra on the couple A=88, A=86The top right spectra was performed to check the absence of crosstalk betweenthe spectra for the two isotopes. The frequency difference between the tworepumper beams was adjusted to be significantly different from the isotopic shiftthus moving the spectra apart.
Bottom spectra : Spectra on the couple A=86, A=84For technical reasons (see chapter 5), it was not possible to detune significantlyto the red the cooling beam on the A=84. The dip is closer to the resonance.The broadening of the dip is probably due to the high temperature in the crystal.
From the fits we extract the following quantities : Ωb, Ωr, δb and γ31 for eachisotope, and the difference between the two δr. These data allows to computethe isotopic shifts on the 5P1/2 → 4D3/2 transition and given the detuning of thecooling laser to the locking reference, the absolute frequency of the 5S1/2 → 5P1/2
transition. The fit values are reported on Table 6.1.
6.3. EXPERIMENTAL RESULTS AND DISCUSSION 75
the frequency of the VCO feeding the Accousto Optic Modulator was measuredwith 50 kHz precison using a spectrum analyser.
Table 6.1: Raw results for the spectra obtained. The analysis of these raw resultsis depicted on Figure 6.5
The computation of the mean and the standard deviation of these measure-ments is reported on Figure 6.5.
The value obtained for the isotopic shift on the 5S1/2 → 5P1/2 transitionwere checked with another experiment. Fluorescence spectra were recorded bychanging the frequency of the cooling laser while keeping the repumping lasersufficiently detuned to avoid the two photon dark state. This kind of spectrais relatively difficult since the cooling efficiency (or even heating) depends onthe detuning of the violet laser. To reduce this problem, the measured isotopemay be kept cold via sympathetic cooling of the other isotope. The signal is thedifference between an image for which all the lasers are on and an image with therepumper of the probed isotope is off. Nevertheless we were not able to suppresscompletely the heating problem so these spectra are less precise than the infraredones. The data obtained are consistent with the data from the infrared spectra.The corresponding spectra are depicted on Figure 6.6.
The intensity of the lasers were monitored during the experiments and thelong term fluctuations of the laser’s intensities are in good agreement with cor-responding fluctuations in the values of the Rabi frequencies extracted from thefit.
76 CHAPTER 6. ISOTOPE-SHIFT MEASUREMENTS
A=88 A=86 A=841/25S
1/25P
3/24D822(6) MHz
400(2) MHz
710 962 401 MHz
Rb85
1/25S (F=2)
1/26P (F'=3)436(2) MHz 266(2) MHz 58(3) MHz
Figure 6.5: Graphical Summary of the isotope shifts measured in the experiment.
Chapter conclusion
The flexibility given by the isotopic enrichment and the intrinsic properties of coldion samples allowed us to measure the absolute frequency of the 5S1/2 → 5P1/2
transition and the isotope shift on the 5P1/2 → 4D3/2 transition on all the evenstable isotopes of singly ionized strontium.
It is possible to improve significantly the precision on the isotope shift of the4D3/2 level by addressing directly the 5S1/2 → 4D3/2 transition.
The precision obtained is one order of magnitude below the linewidth of thetransition involved. This measurement opens the way to a better control of iso-topic enrichment, sympathetic cooling, and in a general manner to a better controlof strontium ion ensembles.
6.3. EXPERIMENTAL RESULTS AND DISCUSSION 77
400 420 440 460
4
0
Frequency relative to the reference (MHz)
Fluore
scence
sig
nal (A
rb.
Un.)
230 250 270 290
2
0
Frequency relative to the reference (MHz)
Flu
ore
scen
ce s
ign
al (A
rb.
Un
.)
170 190 210
5
1
Frequency relative to the reference (MHz)
Fluore
scence
sig
nal (A
rb.
Un.)
3
Figure 6.6: Fluorescence specra versus the frequency of the cooling laser for theA=88,86,84 isotopes in the sympathetic cooling regimeTop left : A=88. Reference : 5S1/2 F=2 → 6P1/2 F’=3 transition of 85Rb. Mea-sured detuning: 430 MHz.Top right : A=86. Reference : 5S1/2 F=2→ 6P1/2 F’=3 transition of 85Rb. Mea-sured detuning: 265 MHz.Bottom : A=84. Reference : 5S1/2 F=2 → 6P1/2 F’=2 transition of 85Rb(117.36 MHz lower than the other transition). Measured detuning to the 5S1/2
F=2 → 6P1/2 F’=3 transition of 85Rb: 62.6 MHz.The detunings were measured with a Lorentzian fit of the data, points over450 MHz were excluded for the A=88 isotope.
78 CHAPTER 6. ISOTOPE-SHIFT MEASUREMENTS
Chapter 7
Light-matter interaction with alarge Coulomb crystal
7.1 Introduction
Trapped ions combine several advantages for quantum information processing.They exhibit for example long coherence times [Schmidt-Kaler 03], efficient cool-ing techniques, interaction between neighboring ions via the bus mode. Unfortu-nately the achievable optical depths in ion samples are relatively weak due to theusually small ion-number. Several approaches that can increase the light-matterinteraction probability are considered in trapped ion ensembles.
The first one consists in the use of high numerical aperture lenses that increasesthe field concentration at the ion. This approach has shown very promising resultsallowing for the coupling between single photons and single ions at the quantumlevel [Piro 11] and the observation of Electromagnetically induced transparency(EIT) on a single ion [Slodicka 10]. A similar approach has been used for singleatoms trapped in a dipole trap [Tey 08]. This approach is limited by severalfactors. First, the numerical aperture of the lens cannot be increased indefinitely.Secondly, the lens being generally made of an insulating material, its presenceclose to the ion can disturb the trap. Finally since the light impinges with a largespread of angles with respect to the quantization axis, the incoming photons arenot fully polarized, thus preventing accurate state control and readout.
A second approach, consists in the use of parabolic or spherical mirrors forcollecting and focusing the light. Since the mirrors can be metallic, their influenceon the ion trap can be taken into account. The use of a mirror allows largernumerical apertures than lenses. New traps are designed with this applicationin mind [Maiwald 09] and spherical mirrors have been used to reach a collectionefficiency up to 25% [Shu 10, Shu 11]. By improving the design it is expectedto reach coupling efficiencies of nearly 100% [Sondermann 07]. Unfortunately,
79
80 CHAPTER 7. LIGHT-MATTER INTERACTION WITH IONS
complex spatial polarization patterns are needed to reach such high couplings.
Finally cavities can be used to enhance the field at the ion position and in-crease the interaction between the ion and the light. This approach has beenimplemented with single ions [Mundt 02, Kreuter 04, Leibrandt 09] and with ionensembles [Herskind 09]. The ensemble experiments allowed for the realizationof the so called collective strong coupling regime, where the losses occurs at asignificantly lower rate than the coherent collective interactions mediated by thecavity light field. Optical switching and EIT have also been observed in such sys-tem [Albert 11]. The presence of a high finesse cavity around the atomic samplestrongly modifies the physics of the system giving rise to a class of new phenom-ena.
In the perspective of a quantum memory it would be interesting to avoidthe use of a cavity, since a high finesse cavity reduces the bandwidth and makesdifficult the storage of several spatial modes. The approach used in the ion trapexperiment to reach a high light matter interaction probability is similar to the oneused with neutral atoms. It consists in trapping an elongated atomic sample toincrease the on axis optical depth. This approach should allow to manipulate thecollective degrees of freedom of the atomic ensemble and to use them for storingquantum states. The use of trapped ions for this purpose is challenging due to thestrong coulomb repulsion. As seen in the previous chapters, experimental effortshave been done to overcome the usual limits of ion traps. In the following theexperiments performed for measuring the light matter coupling in a single passgeometry and the problems and limitations of such a strategy will be presented.
7.2 Theory
7.2.1 Expected absorption
Our system presents several characteristics allowing for a simple calculation ofthe single pass absorption. The ion density is constant in a Coulomb crystal andthe beam waist being relatively large, we can consider a collimated beam for thecalculation of the expected absorption, and neglect in first approximation thewave optics aspects of the propagation. For a beam smaller than the ion clouddiameter, the intensity at a distance z (0 being the edge of the ion cloud) is givenby:
I(z) = I(0).exp (−σρ0z)
Where σ = λ2
2π is the absorption cross section [Hilborn 82] and ρ0 is the atomicdensity.
As described in section 3.1, for the highest radio frequency amplitude used,with the radial frequency measurement we can estimate the ion density to be
7.2. THEORY 81
ρ0 = 3.1× 10¹⁴ m−3. For the 5S1/2 → 5P1/2 transition, σ = 2.8× 10⁻¹⁴ m2. Fora typical cloud length of lcloud = 10 mm, we obtain an expected absorption of:
A = 1− e−σ ρ0 lcloud = 8.3%
This model assumes that all the light beam interacts with a two-level atomensemble. This assumption is valid only when the atoms are prepared into abright state of the probe polarization. In the case of a linearly polarized probeinteracting with atoms in the ground state of a 1/2 → 1/2 transition, the probepolarization can be decomposed into two circular polarization states with equalintensities, each of which interacts with half of the population, i.e. an effectiveatomic density ρ0/2. The expected intensity is then I ′(z) =
√I(z). In the case
of a low absorption this corresponds to a reduction by a factor two.
7.2.2 Temperature effects
The temperature of the sample can be a limitation for the absorption and thecoherence time of the ion ensemble.
Doppler broadening For a thermal cloud, the Doppler broadening can bemodeled by convoluting the line shape with a Gaussian distribution for which thewidth depends on the temperature. For a temperature T , the full width at halfmaximum can be expressed the following way:
∆f =
√8kbT ln (2)
mc2f0
Where f0 is the transition frequency and m the ion mass. The relationshipbetween the temperature and the Doppler broadening, in the case of Strontiumions for the 5S1/2 → 5P1/2 transition is represented on the left panel of Figure 7.1.
Plasma coupling parameter In order to evaluate the actual temperatureregime, it is interesting to estimate the crystallization parameter ΓP described insubsection 3.1.2 page 23 for different temperatures thus different Doppler broad-enings of the transition. This parameter is given by:
ΓP =1
aw
e2
4πε0
1
kbT(7.1)
The variation of ΓP as a function of the broadenings was computed for thehighest density reached in our trap is represented on Figure 7.1. We notice thatin the liquid regime 2 < ΓP < 170 we can observe significant broadening of thetransitions. It have to be remembered that the crystallization bounds on ΓP wascomputed for infinite crystals [Slattery 80] and have to be taken with care. Inthe crystallized regime, this broadening becomes negligible with respect to thenatural linewidth of 21.5 MHz.
82 CHAPTER 7. LIGHT-MATTER INTERACTION WITH IONS
1 K
100 mK
10 mK
1 mK
100 μK
10 μK
Temperature
cristallizationlimit
Naturallinewidth
Dopplertemperature
Figure 7.1: (black continuous) ΓP versus Doppler broadening. The horizontalline corresponds to the limit of crystallization.(red dashed) Temperature versus Doppler broadening.
7.3 Absorption measurement method
Absorption spectra have been acquired on the 5S1/2 → 5P1/2 transition. Thesespectra allows for the measurement of the optical depth of the sample. Dependingon the laser parameters (light shift), these spectra may carry useful informationallowing us to estimate the temperature range of the sample. In order to ensurea maximal coupling between the probe beam and the atoms, the probe beamprofile has been shaped as described in section 3.7.1 page 38. The alignment ofthe probe beam is performed by observing the fluorescence signal due to a weakbeam propagating in a long ion cloud, the line that separates two different isotopesbeing used as a reference. This alignment is performed using images taken bothfrom the top and from the side. The experiments described below are performedin the presence of sympathetic cooling from the A=88 isotope, with its coolinglaser detuned by −2Γ.
In order to maintain a good precision while reducing the contribution of mul-tiple noise sources, several techniques have been used. Among all the possiblenoise sources, two of them have a significant contribution to the measured signal:the electronic noise from the photodiode and the light intensity noise.
The first one is reduced by using a low noise operational amplifier for thephotodiode transimpedance amplifier. Then, by repeating the measurement se-quence a hundred times and averaging the signal, this noise can be reduced downto acceptable levels1 The light intensity noise can be problematic because of its
1photodiode gain: 1.6× 10⁵ V/W, typical signal measured ≈ 1 V, RMS noise after averaging
7.3. ABSORPTION MEASUREMENT METHOD 83
1/25P
1/25S
3/24D
A C
mF -1/2 +1/2
DB
Figure 7.2: Experimental sequence used to prepare and probe the atomic system.During the whole sequence the probe beam is kept at low power and verticalypolarized, the cooling beam for the A=88 isotope is kept on.A: The atoms are pumped into the metastable level. B: The repumpers areswitched off during 1 ms, then the probe beam frequency is adjusted. C: Therepumper is switched back on. The population is quickly pumped into the groundlevel with a characteristic time < 10 µs. D: In steady state we can measure thedecrease of the probe power due to the atoms in the ground level.
intensity and its timescale. The typical absorption signal expected is in the orderof a few percent whereas the laser intensity can change by more than 10% fromshot to shot due to thermal effects in the doubling crystal. In order to reducesignificantly the effect of this noise, a background and a signal measurement areperformed in a time scale faster than the laser intensity fluctuations. First theatomic population is pumped into a dark state and the probe intensity is mea-sured. Then the ions are transfered quickly into a bright state, affecting the probeintensity. The probe intensity difference is then proportional to the absorption.By using this technique the laser intensity noise affects the signal, in first ap-proximation, proportionally to the measured absorption contrary to other simplerapproaches where the laser intensity noise translates directly in the measuredsignal.
The experimental sequence used for measuring the absorption with linear po-larization is depicted on Figure 7.2.
The measured signal can be superimposed with significant electronic ripplesynchronized with the experimental sequence. The exact origin of these fluctua-tions is not fully understood2 but a background signal can be subtracted from themain signal to get rid of these fluctuations. This background signal is acquiredby executing an identical sequence and blocking the repumper of the A=86 iso-tope with a mechanical shutter. Typical signals obtained using this technique
≈ 5 mV2One possible source is ground loops involving the high-voltage of the EOM
84 CHAPTER 7. LIGHT-MATTER INTERACTION WITH IONS
−50 0 50 100 150 200
−0.02
0
time (us)
Inte
nsity
(V)
−50 0 50 100 150 200
−0.02
−0.01
0
time (us)
Inte
nsity
(V)
Figure 7.3: Typical absorption signal obtained at a given probe detuning (offsetsubtracted). Top: Photodiode signals. Blue (top): Vp1(t), red (bottom) Vp2(t).Bottom: difference signal used for analysis (see text for details).
and the above-mentioned experimental sequence are displayed on the top panelof Figure 7.3.
On the bottom panel of Figure 7.3 is represented the averaged signal Vm(t)used for the data analysis which is obtained in the following way:
Vm(t) = 〈Vp1(t)− Vp2(t)〉20 samples
Where Vp1(t) (resp. Vp2(t)) represents the photodiode signal when the re-pumper is not blocked (resp. blocked) and 〈. . .〉n samples represents a moving av-erage over n samples.
The absorption signal is then evaluated using the amplitude of the signal step:
This procedure allows us to obtain a quantitative estimation of the opticaldepth with a good signal to noise ratio.
7.3.1 Absorption spectra with linearly polarized probe
A spectrum obtained with this technique is represented on Figure 7.4. This spec-trum is obtained with an ion density of 2× 10¹⁴ m−3 in a cloud containing more
7.3. ABSORPTION MEASUREMENT METHOD 85
than 1 million of ions3. The horizontal axis is normalized in units of the naturallinewidth of the excited level. The resonant absorption is 1.6%. The simple modeldescribed earlier predicts an absorption of 2.8 in these conditions.
The measured spectra are significantly broader than the natural linewidth.This excess width is a possible explanation for the lower absorption observed.Reducing the intensity of the probe (by a factor 2) and of the repumper (by afactor 10) did not allow to measure significant changes in the width of the spec-tra, combined with the fact that the probe intensity is well below the saturationintensity (¡ 1% Isat), power broadening is not a good candidate to explain thewidth of the observed spectra. The best candidate is then a thermal broadening.The red line on Figure 7.4 is a fit of the measured spectra by a Voigt profile givinga full width at half maximum for the convoluted Gaussian of 45 MHz (2.1Γ). Itwould corresponds to a temperature of 0.5 K. Assuming a broadening only due totemperature, we can compute the corresponding plasma coupling parameter ΓP(Equation 7.1) with the ion density. We obtain ΓP ≈ 3, this is compatible with asample which is between the liquid and the crystalline state.
Detuning
Figure 7.4: Spectrum obtained with a linear probe and a cloud density of2× 1014 m−3. Black dots: experimental data. Red continuous line: fit with aVoigt profile.
7.3.2 Large spectra and model for longitudinal oscillation
The shape of the absorption spectra depends on the experimental conditions, inparticular the axis of the sympathetic cooling laser. When the cooling laser is
3counting all the isotopes
86 CHAPTER 7. LIGHT-MATTER INTERACTION WITH IONS
along the trap axis or when sympathetic cooling is not used during the probingphase, the shape of the spectra is modified. This modification can be interpretedas a longitudinal motion of the ion cloud. However, the mechanism explainingthis motion and why it is not efficiently laser cooled is not understood yet.
The spectrum represented on Figure 7.5 has been recorded with the axis ofthe sympathetic cooling beam aligned along the trap axis.
Figure 7.5: Absorption spectra obtained with the laser cooling on axis. Theshape of the spectra could be explained by a harmonic oscillation along the trapaxis. Black dashed line: harmonic motion fit. Red continuous line: two speedmotion fit (see text for details).
This spectral shape could be interpreted as the result of a collective harmonicoscillation of the ions along the trap axis. For a harmonic motion the velocityprobability distribution can be evaluated
Pv(v) =1
vMAXπ√
1− v2/v2MAX
This probability distribution is plotted on Figure 7.6By convolving this probability distribution with a Voigt distribution we com-
pute the expected spectra. This model can be used to fit the experimentaldata. The result is the black dashed line of Figure 7.5 from which we obtainvMAX = 12 m s−1 which corresponds to an amplitude of motion of ≈90 µm for atrap longitudinal frequency of 20 kHz), and a Gaussian FHWM of 16 MHz. Suchan effect have been observed with single Barium ions in a hot regime [Schubert 89].
7.4. EIT IN A LARGE COULOMB CRYSTAL 87
Figure 7.6: Velocity probability density for an harmonic motion. The maximumspeed is normalized to 1.
This model does not take into account the anharmonicities of the axial trap-ping potential. As shown in Figure 5.4 page 64 the axial trapping potential is“flat” at the bottom and very steep at the edges. The velocity probability distri-bution of a particle in this kind of potential mostly consists in two peaks at speeds+v and −v. If we approximate the longitudinal motion by two opposite speedclasses plus some thermal broadening, we can model the measured spectrum witha sum of two shifted Voigt profiles. Fitting the data with this simplified model,the red continuous line of Figure 7.5 is obtained. The fit results are a velocityvMAX = 7.6 m s−1 and a full width at half maximum for the convoluted Gaussianof 20 MHz (0.9Γ, T ≈ 0.1K).
The real motion is probably an intermediate between these two models. Thesemodels despite their simplicity give a good interpretation of the shape of theobserved spectra even if the underlying mechanism giving rise to this motion isnot yet understood.
7.4 Evidence for EIT in ion cloud and spectra withcircular polarization
The goal of this experiment is to evaluate the possibility of using large ion en-sembles for quantum information tasks, in particular quantum memories. In thisperspective, several questions need to be addressed, in particular the possibilitiesof control of the collective atomic state and the level of coupling between light andmatter that can be reached. Optical pumping and single pass probe absorptionexperiments have been performed. Significant absorption levels have been mea-
88 CHAPTER 7. LIGHT-MATTER INTERACTION WITH IONS
sured, and preliminary data on electromagnetically induced transparency havebeen obtained. The data show an EIT signature in an large coulomb crystal. Butall the features contained in these data are not yet fully understood.
7.4.1 Optical pumping
As presented in section 3.7.1 page 40, the polarization of the probe beam is con-trolled by an electro optic phase modulator (EOM) and a set of waveplates. Thequality of the polarization and the calibration of the electro optic modulator canbe verified by measuring the fluorescence signal versus the voltage applied to theelectro optic modulator. With a magnetic field and the light propagation directionaligned along the trap axis. We expect a fluorescence extinction due to opticalpumping when the probe polarization is circular and a fluorescence maximum fora linear polarization. The measurement (performed with a guiding field along thecloud axis of 0.3 G) and a fit with a rate equation model is presented on Figure 7.7.An extinction of more than 90% is observed. The extinction can be limited byseveral factors, in our case two factors are suspected to contribute significantly:imperfect magnetic field direction and improper light polarization.
0 Π 2 Π
0
1
EO delay in radiants
Fluo
resc
ence
Hnor
mal
ized
L
Figure 7.7: Fluorescence of an ion cloud versus electro optic voltage. Data areobtained the cooling laser detuned by -3Γ and with an intensity significantly lowerthan the saturation intensity. Red line: model from rate equations. The measuredΠ voltage is Vπ = 859 V
7.4.2 Electromagnetically Induced Transparency
The experimental sequence used for this experiment is presented on Figure 7.8:the ions are first prepared in one of the ground state Zeeman sublevels by a
7.5. RF HEATING IN LARGE CRYSTALS 89
circularly polarized pump beam, then probed with an opposite polarization. Thistechnique allows us to study the transmission of the probe both in the presenceand in the absence of a repumper during the phase ”D” of Figure 7.8. In thislatter case the spectrum of the transient response is expected to display a simpletwo-level atom ensemble lineshape.
A typical transient absorption signal obtained with the experimental sequenceof Figure 7.8 is presented on Figure 7.9 (b): we notice two absorption peaks thatare washed out by the optical pumping in a characteristic time of 20 µs. Theheight of the peaks is measured the following way:
On Figure 7.10, absorption spectra obtained in various configurations are pre-sented. The shape of the spectrum without repumper could be explained by acombination of thermal effects and longitudinal oscillation as previously discussedin subsection 7.3.2 page 85.
A decrease of the absorption is observed around −20 MHz when the repumpinglaser is switched on during the probing phase (large arrow on Figure 7.10). Thisdip can be interpreted as a manifestation of EIT in a large ion cloud. Herethe repumper laser plays the role of the control laser and the violet laser is thesignal. This interpretation is also consistent with the fact that the frequencyat which this dip occurs is related to the frequency detuning of the repumper(control) beam, as can be noticed on Figure 7.10. Let us notice the presence ofother dips (marked with small arrows on Figure 7.10) in the spectra which needsfurther investigations to be completely understood. They could be linked with aspecial velocity distribution of the ions, however we lack information to confirmor infirm this hypothesis, in particular measurements of the ion temperature andtheir residual motion.
7.5 Preliminary experiments on RF heating in largesamples
The amount of light-matter coupling is probably limited by some residual motionof the ions. In order to explore this hypothesis, a preliminary study of the influ-ence of the cooling parameters on the observed absorption has been performed.However, no simple trend for significant improvement of the coupling has beenfound. A quantitative and detailed study needs to be performed, in particular witha quantitative measurement of the sample temperature. In order to understand ifthe source of broadening is the radio frequency heating, we have performed otherpreliminary experiments for studying radio frequency heating in large coulombcrystals. The ion crystal used for the experiments having a radial size comparable
90 CHAPTER 7. LIGHT-MATTER INTERACTION WITH IONS
1/25P
1/25S
3/24D
A C
mF -1/2 +1/2
C' DB
Probepolarization
Cooling
20000 100 200 200
Sympatheticcooling isotope
lasers
Probed isotopelasers
100
Linear Circular L Circular R
Probefrequency Probing
A B C D
Time (us)
CoolerRepumper
Figure 7.8: Experimental sequence used to prepare and probe the atomic system.A: The atoms are pumped to the metastable level. B: The repumper is switchedoff, then the probe beam frequency, polarization and power are adjusted, lettingtime for the photodiode transient to relax (millisecond timescale). C: The re-pumper is switched back on. The population is quickly (in less than 1 µs) pumpedinto the ground level. Immediately after (C’), we observe a decrease of the probepower due to the atoms sent back to the mF = −1/2 ground sublevel, then theprobe progressively pump the atoms into the mF = +1/2 ground sublevel. D: Thepolarization of the probe is switched to measure the absorption from the atomsin the mF = +1/2 sublevel. The repumper can be switched on or off during thisphase in order to isolate the specific features due to the 3-level scheme.
7.5. RF HEATING IN LARGE CRYSTALS 91
Inte
nsity
(m
V)
Inte
nsity
(m
V)
0 100 200 300 400−20
−10
0
time (us)
0 100 200 300 400−8
−4
4
0
time (us)
C
C
D
D
(a)
(b)
Figure 7.9: (a) Typical raw data signal for the transient absorption experimentdescribed in Figure 7.8. Blue (top): Vp1(t), red (bottom) Vp2(t) (the conventionsare the same previously introduced in Figure 7.3. (b) processed signal used foranalysis (see text for details). The phases A and B are performed before T=0.Phase C starts at T=0. Phase E starts at T=225 µs.
with the trap characteristic dimensions, radiofrequency heating can indeed playan important role in the observed temperature.
7.5.1 Temperature from image analysis
The temperature of an ion cloud can be estimated with high resolution image.However, in order to obtain quantitative information, a method is to compareimages with many-body simulations[Ostendorf 06]. Given the number of ions inour trap, this kind of simulations is computationally extensive. The followingstudy is based on a qualitative observation of the contrast between ion layers atthe edge of the ion cloud using high resolution images. This study allowed toobserve the influence of several cooling parameters, unfortunately no significantimprovement could be obtained.
In order to have some clues about the temperature of the ion cloud, highresolution images of the ion crystal have been taken. A picture of a cloud con-taining ≈0.5× 10⁶ ions with an estimated density of 2× 10¹⁴ m−3 is representedon Figure 7.11.
A 3D order cannot be distinguished whereas a clear 2D radial order exists.This phenomenon has been observed in [Drewsen 98] and indicates that the cloudis between the liquid and crystalline state. Given the result of Figure 7.1 page 82,this observation, even though not precise is consistent with the observed broad-
92 CHAPTER 7. LIGHT-MATTER INTERACTION WITH IONS
−60 −40 −20 0 200
1
2
3
Without repumper
With repumper
Repumper shifted by -10MHz
4.5
4
Frequency detuning of probe beam (MHz)
Ab
sorp
tion
(p
erc
en
t)
Figure 7.10: Signature of Electromagnetically Induced Transparency in a largeCoulomb crystal. Experiment performed with a guiding magnetic field of ≈ 3 G.Red,bottom : spectrum without repumper during the probing phase. Blue, middle: spectrum obtained in the presence of a repumper (Curve shifted by 1% forclarity). Curve shifted by 1% for clarity. Black,top : spectrum obtained in thepresence of a repumper being shifted by −10 MHz with respect to previous scan(Curve shifted by 2% for clarity). The dips induced by the repumper are markedwith arrows.
7.5. RF HEATING IN LARGE CRYSTALS 93
Figure 7.11: High resolution image of a cloud containing ≈0.5× 10⁶ ions. Thecooling laser on the A=88 isotope is detuned by −2Γ. 2D ion arrangement isvisible on the edge of the ion cloud. See text for details.
ening.
The effect on the temperature of the number of ions has been observed byimaging clouds containing two millions and half a million ions at a density of3.1× 1014 m−3. On Figure 7.12 the images obtained are represented. We noticea clear blurring of the crystalline layers for the highest ion number even at theedges of the sample. This supports the hypothesis of an increased temperaturefor larger ion numbers.
7.5.2 Absorption versus ion number
The effect of the radiofrequency heating has also been measured on the on-resonance absorption. Starting with an empty trap, the absorption have beenmeasured every minute during the continuous loading with a linearly polarizedprobe on resonance with the technique described in section 7.3 page 82. The resultof the measurement is depicted on Figure 7.13.
This experiment confirms the importance of the radio frequency heating inthe regime of very large coulomb crystals (N > 1× 10⁶). This radiofrequencyheating can be due to different factors such as an improper trap working point (aand q trapping parameters), an imperfect compensation of the stray fields, somegeometrical imperfections that become critical in this trapping regime.
For large clouds, the effect of the stray field compensation is expected tobe relatively small, the displacement of the ion cloud during the compensationprocedure being significantly smaller than its size. Therefore the effect of theexcess radiofrequency heating from imperfect compensation should be significantly
94 CHAPTER 7. LIGHT-MATTER INTERACTION WITH IONS
Figure 7.12: Top: Images for different ion number at a density 3.1× 10¹⁴ m−3.Cooling laser on the A=88 isotope detuned by −2Γ.Left: cloud containing 2.2× 10⁶ ions. Right: cloud containing 0.5× 10⁶ ions ionsBottom: radial intensity cut
7.5. RF HEATING IN LARGE CRYSTALS 95
Loading time (minutes)
Ab
sorp
tion
(p
erc
en
t)
20 40 60
1
2
3
0
1.3
Estimated ion number (million)
2.6 3.9
Figure 7.13: Absorption on resonance versus the ion-number in the trap (ionnumber estimated with the loading rate). Four phases can be identified: A firstphase where the ion cloud is radially smaller than the beam cross-section andthe absorption increases significantly with the number of ions. A second phasewhere the cloud has a size comparable to the beam cross section where the ab-sorption increases slowly due to the increasing ion cloud length (and a possibleslight misalignment of the probe). A third phase, where the absorption dropssignificantly, which can be understood as an increase of cloud temperature fromradio-frequency heating that affects the peripheral ions. Then more drastic ab-sorption drop is noticed, the observation of the cloud images show a simultaneousloss of the ”dense” phase. This phenomenon can be interpreted by an insufficientcooling to keep the dense phase cold enough.
96 CHAPTER 7. LIGHT-MATTER INTERACTION WITH IONS
lower than the total radiofrequency heating experienced by the ion cloud.
Radiofrequency heating has not yet been studied in such large coulomb crys-tals. As in the case of smaller crystals, the trapping regime, in particular theq parameter, are expected to play an important role. The q parameter can belowered by using lighter ions, reducing the distance between the electrodes andincreasing the radiofrequency amplitude. In order to keep the ion density constantthe RF frequency has to be increased by the same amount as the reduction of theq parameter. A decrease of the q factor by a factor of 4 by reducing the trap sizeby a factor of two, will lead to a RF frequency of 30 MHz which is a difficult butachievable goal.
Chapter conclusion
We have measured an unprecedented level of coupling between light and a coulombcrystal in free space (up to 3% with linear probe polarization) and observed EITin a large Coulomb crystal.
The light-matter coupling is probably currently limited by some residual mo-tional effects and by the temperature of the sample. Temperature measurement,associated with a study of the dependence of the heating rate versus the trap-ping parameters would allow for a better understanding of these phenomena andcould allow for an improvement of the trap design. Several factors could affectthe sample temperature, in particular the q parameter, the stray fields, the trapdefects and the isotopic proportion are expected to play an important role. Thereason why a longitudinal oscillation would not be efficiently damped by laser andsympathetic cooling still has to be understood.
The transition between the different even isotopes of Sr+ are too close to com-pletely neglect the off-resonance excitation of the “dark” isotope by the coolinglaser. This phenomenon can be reduced by using a spatial filter or by using a theA=87 isotope, the hyperfine structure of which provides GHz of level splitting.In this perspective, more direct and more precise temperature measurements willbe useful. These measurements can be based on the spectroscopy of the narrow5S1/2 → 4D3/2 transition or narrow Raman transitions. Combined with imag-ing and electron shelving, these methods methods could allow to obtain spatialinformation about the sample temperature.
Another perspective to improve the coupling is to use the 4D3/2 → 5P1/2 (or4D3/2 → 5P3/2) transition as a storage transition. This transition has a frequencyof 274 589.4 GHz. Due to the difference in wavelength with the 5S1/2 → 5P1/2, theinteraction cross section is larger by a factor 6.7. Moreover, for technical reasons,it is significantly easier to produce and carry non classical states with near infraredwavelengths compared to blue-violet wavelength. Let us remark however that, a3/2→ 1/2 (or 3/2→ 3/2) transition is more complicated than a 1/2→ 1/2. This
7.5. RF HEATING IN LARGE CRYSTALS 97
approach will be also limited by the finite lifetime of the 4D3/2 level (395 ms).Finally, light-matter coupling can be enhanced by the use of a low finesse
cavity allowing for high signal bandwidth and significant optical depth. But, inthe perspective of quantum memory experiments, the sympathetic cooling has tobe improved and heat sources have to be understood and reduced.
98 CHAPTER 7. LIGHT-MATTER INTERACTION WITH IONS
Part II
Detection of non-Gaussianstates in atomic ensembles
99
101
Research context
This part of the thesis has been done in the group of Morgan W. Mitchell at theInstitute of Photonic Sciences (ICFO - Castelldefels (Barcelona) - Spain). TheInstitut de Ciencies Fotoniques (ICFO) is an independent, non-profit, perma-nent research center established by the Generalitat de Catalunya (Government ofCatalonia, Spain), Ministry of Economy and Knowledge, and by the UniversitatPolitescnica de Catalunya.
The group is aimed on the experimental quantum manipulation of light andatomic ensembles, in particular the study of quantum metrology i.e. how a quan-tum state can improve the ultimate precision of a measurements. This researchis performed on two experiments: a quantum light experiment, and a cold atomexperiment.
The non-classical light experiments are designed to produce non classical statesof light for the interaction with atomic ensembles of rubidium. The state are pro-duced with optical parametric oscillators, filtered by an ”interaction free” atomicfilter [Cere 09], and depending on the experimental conditions, produces polar-ization NOON states [Wolfgramm 10b] of photon pairs or polarization squeezedlight [Wolfgramm 10a]. A NOON state is a maximally entangled state, resourcefor quantum information and quantum metrology measurements. Heralded sin-gle (g2 = 0.04± 0.012) photons are also produced [Wolfgramm 11] resonant withatomic transitions, with a linewidth (7 MHz) fitted to the atomic transition life-time. These photons are a direct resource for quantum information and quantumnetworking experiments. In a different experimental regime, polarization squeezedlight is produced, allowing to beat the standard quantum limit (thus improvingprecision) in magnetometry experiments.
The other experiment, with which this work has been done, is designed to ma-nipulate and measure the collective spin state of a cold (25 µK) 87Rb atomic ensem-ble. The atomic state is measured using Quantum non-demolition measurements(QND), via the Faraday rotation induced by the atoms on light pulses spatiallymatched with the atomic ensemble. This technique is commonly used for genera-tion and measurement of non-classical states in atomic spin ensembles [Appel 09a,Koschorreck 10a] and nano-mechanical oscillators [Hertzberg 10]. The measure-ment noise is significantly lower than the atomic shot noise [Koschorreck 10b] andthe state demolition is sufficiently low to obtain measurement induced spin squeez-ing [Koschorreck 10c]. This spin squeezed state is a ”macroscopically” entangledstate, interesting on a fundamental level, and also a resource for quantum magne-tometry. For a QND measurement, the a compromise have to be found betweenthe signal and the state demolition, the light intensity levels and detunings arechoosen to provide linear, non destructive measurements. But this setup allowedto explore another regime of the light matter interaction. The light detunings canbe chosen to emphases the non linear interaction, still having access to the very
102
sensitive linear measurement. This regime allowed to demonstrate that non lin-ear measurements have a better signal to noise scaling than linear measurementscalled super Heisenberg scaling [Napolitano 11].
This experimental apparatus, have been used in the context of this thesis, formeasuring non Gaussian atomic states [Dubost 12]. In particular study the noiseproperties of an approached based on the use of cumulants which are statisticaltools well adapted to the measure of non gaussianity of a distribution. In thefollowing chapters, the theory, the measurement method and the results will bepresented.
Chapter 8
Detection of non-Gaussianstates in atomic ensembles
8.1 Introduction
8.1.1 Non-Gaussian states
Non-Gaussian states, for which the Wigner distribution differs from a Gaussiandistribution, are an essential requirement for universal quantum computation[Ralph 03, Lloyd 99] and several quantum communication tasks with continuousvariables, including improving the fidelity of quantum teleportation [Dell’Anno 07]and entanglement distillation [Eisert 02, Giedke 02].
The state obtained after the subtraction of a photon from a squeezed vacuumor a Fock state is very similar to a superposition of small coherent states (so-called Schrodinger Kitten) having many interesting properties. It can be used asa resource for several quantum information protocols and is a perfect candidatestate for the study of decoherence. This kind of state has been produced exper-imentally by several groups using conditional preparation [Neergaard-Nielsen 06,Ourjoumtsev 06, Ourjoumtsev 07, Wakui 07, Takahashi 08]. The non-Gaussiancharacter of a single photon state have also been verified [Jezek 11].
In atomic systems, proposals are being actively pursued. These proposals arebased on large spin squeezing associated with a QND measurement [Massar 03],cavities and conditionnal preparation using homodyne detection [Nielsen 09], stor-age of optical non Gaussian state [Filip 08] wich can be combined with QND in-teraction [Lemr 09]. In [Lemr 09] the non gaussianity of a light beam (a heraldedphoton substracted state) is transfered into the atomic system, and with coherentdisplacements depending on the result of the QND measurement, a the equiva-lent of photon substraction or addition can be implemented, allowing to preparearbitrary Dicke states.
In photonic systems, to demonstrate the non-Gaussianity of the measured state
103
104 CHAPTER 8. DETECTION OF NON-GAUSSIAN STATES
two main techniques have been used. Histograms of the probability distributionfunction [Wenger 04] have been used as a simple and direct technique. Histogramsare related to the probability distribution but not directly to the non-classicalityof the measured state. For this reason, state tomography have been used in severalexperiments [Jezek 11, Neergaard-Nielsen 06, Ourjoumtsev 07, Takahashi 08].
These approaches needs a significant number of measurements, typically a few104. In material systems like atomic spin measured using QND measurements,the time-scales may be significantly longer than in optical systems 1 making theprevious approaches prohibitively expensive. In the following we will consider theuse of cumulants which could be seen as global measures of distribution shape, toshow non-Gaussianity in an atomic spin ensemble.
Cumulants can be used to show non-classicality [Bednorz 11], [Shchukin 05]and [Eran Kot 11]. Moreover, they can be estimated with few measurements andhave known uncertainties [Kendall 58], a critical requirement for proofs of non-classicality. The known uncertainties allows to estimate statistical uncertainty onthe measured value, thus allowing to limit the number of measurements.
8.1.2 Approach
0
1
2
SignalX(t)=a
0
1
2
NoiseZ(t)=a+Y(t)
More samples⟨Z⟩=a
SignalP=P
X
NoiseP =P ⨂ P
X YZ
More samplesP=P
Z
Observables
Distributions
0
1
2
Z(t)
Figure 8.1: Illustration of the difference between observables and distributionsestimation. Top: Quantification of observables, the measurement noise (if zeromean) does not change the measured value but only it’s precision. Bottom: quan-tification of distributions, the alteration of the distribution by measurement noisecannot be suppressed by taking additional measurements.
1The measurement time scale in an atomic system is typically in the microsecond[Koschorreck 10b] or millisecond range [Zhao 09a]. Optical system can have typical measure-ment time in the nanosecond or picosecond range [Wenger 04, Neergaard-Nielsen 06].
8.2. THEORY 105
Quantification or testing of distributions has features not encountered in quan-tification of observables as illustrated on figure Figure 8.1. In particular, experi-mental noise plays a major role as it distorts the measured distribution and cannotbe “averaged away” by additional measurements. Additional, independent mea-surements do not change the shape of the measured distribution, they increasesthe precision of the estimation of the distribution itself which includes the mea-surement noise. This situation is naturally handled by the theory of cumulantsas will be seen later.
This work presented in this thesis is focused on the fourth-order cumulant κ4,the lowest-order indicator of non-Gaussianity in symmetric distributions such asFock [Lvovsky 01] and “Schrodinger kitten” states [Ourjoumtsev 06, Ourjoumtsev 07,Massar 03]. We study theoretically and experimentally the noise properties ofFisher’s unbiased estimator of κ4, i.e., the fourth “k-statistic” k4 versus the mea-sured distribution, the measurement noise and the number of samples acquired.Finally we find optimal measurement conditions. Because κ4 is related to the neg-ativity of the Wigner function [Bednorz 11], this estimation is of direct relevanceto detection of non-classical states.
8.2 Theory
8.2.1 Moments, cumulants and estimators
A continuous random variable X with probability distribution function P (X) iscompletely characterized by its moments
µk ≡∫XkP (X)dX
or cumulants
κn = µn −n−1∑k=1
(n−1k−1
)µn−kκk
where (nk) is the binomial coefficient.
This gives the first four cumulants:
κ1 = µ1 κ2 = µ2 − µ1 κ3 = µ3 − 3µ2µ1 + 2µ31
κ4 = µ4 − 4µ1µ3 − 3µ22 + 12µ2
1µ2 − 6µ41
The two lowest-order cumulants are of common use, κ1 being the mean andκ2 the variance. A Gaussian distribution is fully characterized by κ1 and κ2 allother higher order cumulants being null. Thus, the estimation of κ4, (or κ3 fornon-symmetric distributions), is a natural test for non-Gaussianity. Intuitively,κ3 measures the asymmetry of the distribution compared to a Gaussian and κ4
106 CHAPTER 8. DETECTION OF NON-GAUSSIAN STATES
its “peakedness”. For example, a “flat” distribution like P (X) = 1 for |X| < 1/2and P (X) = 0 elsewhere will have a negative value of κ4.
In an experiment, a finite sample X1 . . . XN from P is used to estimate theκ’s. Fisher’s unbiased estimators, known as “k-statistics” kn, give the correctexpectation values 〈kn〉 = κn for finite N [Kendall 58] 〈kn〉 being the expectationvalues of kn i.e. the mean of kn when it’s computed on several independentexperiments. Other “naıve” estimators show a bias for finite N . The use ofunbiased estimators is very important for small sample numbers. Defining Sn =∑
iXni these estimators have been calculated by Fisher [Kendall 58] and can be
written:
k1 =S1
N(8.1)
k2 =NS2 − S2
1
N(N − 1)(8.2)
k3 =N2S3 − 3NS1S2 + 2S3
1
N(N − 1)(N − 2)(8.3)
k4 =N2(N + 1)S4 − 4N(N − 1)S1S3 − 3N(N − 1)S2
2
N(N − 1)(N − 2)(N − 3)
+12NS2
1S2 − 6S41
N(N − 1)(N − 2)(N − 3)(8.4)
We need the uncertainty in the cumulant estimation to test for non-Gaussianity,or to compare non-Gaussianity between distributions. For hypothesis testing andmaximum-likelihood approaches, we need the variances of the estimators k3, k4
for a given probability distribution P . These are found by combinatorial methodsand given by Kendall and Stuart [Kendall 58]:
var(k3) =κ6
N+ 9N
κ2κ4 + κ23
N(N − 1)+
6N2κ32
N(N − 1)(N − 2)(8.5)
var(k4) =κ8
N+ 2N
8κ6κ2 + 24κ5κ3 + 17κ24
N(N − 1)
+72N2 κ4κ22 + 2κ2
3κ2
N(N − 1)(N − 2)
+24N2(N + 1)κ4
2
N(N − 1)(N − 2)(N − 3). (8.6)
It is possible to estimate the uncertainty in k4 from data X using estimatorsof higher order cumulants [Kendall 58] (reported on Appendix A). The efficiencyof cumulant estimation is illustrated in Fig. 8.2.
8.2. THEORY 107
1.5
1.0
0.5
0.5
1.0
1.5
3
p = 0 1/3 1/2 2/3
4k
a)
b)
Figure 8.2: Simulated value of estimator k4 as a function of sample size N for abi-Gaussian distribution. a) (insets) black curves show quadrature distributionsof states ρ = (1 − p) |0〉 〈0| + p |1〉 〈1|, scaled to unit variance, and six N = 1000histograms (offset for clarity) for p = 0 (green), 1/3 (brown), 1/2 (blue) and 2/3(red). b) Ten realizations of k4 versus N drawn from each of the four distributions.Shaded regions show κ4 ±
√var(k4), from Eqs (8.4), (8.6). With N = 1000, k4
distinguishes p = 1/2 (blue) from p = 0 (green, Gaussian) with > 7σ significance,even though the histograms look similar “to the eye.”
108 CHAPTER 8. DETECTION OF NON-GAUSSIAN STATES
8.2.2 Measurement noise
When the measured signal is Z = X+Y , where X is the true value and Y is uncor-related noise, the measured distribution is the convolution P (Z) = P (X)⊗ P (Y ).The effect of this distortion on cumulants is the following: for independent vari-
ables, cumulants accumulate (i.e., add) [Kendall 58], so that κ(Z)n = κ
(X)n + κ
(Y )n ,
where κ(Q)n , k
(Q)n indicate κn, kn for distribution P (Q). For the extremely im-
portant case of uncorrelated, zero-mean Gaussian noise, κ(Y )2 = σ2
Y and othercumulants zero, is thus very simple:
κ(Z)n = κ(X)
n except for κ(Z)2 = κ
(X)2 + σ2
Y
Critically, added Gaussian noise does not alter the observed κ3, κ4, but al-ters the observed variance see Equation 8.6. This result can also be found bycomputing the new values of the cumulants on P (Z).
Chapter conclusion
Cumulants are an interesting tool to detect non-Gaussian distributions. Theyuncertainty can be computed, both because of the finite measurement numberand the measurement noise. We characterized this noise in the case of QNDmeasurements, allowing to put a boundary on the detected values.
Chapter 9
Experimental set-up andmeasurement method
Introduction
The experimental system is based on an atomic ensemble trapped in an elongatedfar off resonance dipole trap and measured via the induced Faraday rotation onpolarized light pulses by a very low noise balanced polarimeter. The elongatedgeometry allows a strong interaction between the atomic ensemble and the probelight. Non gaussian test states (statistical mixtures) have been produced by partialoptical pumping of a spin thermal state. The experimental system and the exper-imental procedure for producing and measuring non Gaussian states will be pre-sented in this chapter. More information on the experimental system can be foundin: [Koschorreck 10b, Koschorreck 10a] and, in particular in [Koschorreck 11].
9.1 Experimental system
The experimental set-up is represented in Figure 9.1. It consists in a two stagevacuum chamber pumped differentially with a rubidium source connected to theupper chamber. The laser system used for trapping and cooling is presented in Fig-ure 9.2. It is constituted of two Extended cavity diode laser (ECDL) locked onto asaturated absorption cell using the Pound Drever Hall technique [Drever 83], oneslave diode laser. These lasers are used for addressing the F = 1 → F ′ = 0− 2and the F = 1 → F ′ = 1− 3 transitions. A third ECDL is used for the off-resonance probing and is locked using a digital offset lock between −400 MHz and−1200 MHz compared to the F = 1 → F ′ = 0 transition.The 1030 nm sourcefor the dipole trap is a thin disk laser and delivers 15 W CW, single mode. Allthe laser sources are fiber coupled for delivering light to the trap, allowing easieralignment, clean spatial modes and better stability concerning the trap alignment.
The fiber delivering the light for the optical dipole trap is a single mode, largemode area photonic crystal optical fiber. The light polarization is cleaned beforeand after the fiber. The fiber being not a polarization maintaining fiber, it is at-tached to the optical table, to avoid change in the polarization (thus on the outputpower) due to changes in the stress of the optical fiber. All the other fibers arepolarization maintaining fiber. The input polarization is cleaned by using highrejection polarization beam splitters (PBS). The PBS are mounted on rotationalstages to allow fine alignment of the input polarization with the fiber axis. Afterthe fibers the polarization is cleaned and adjusted for each light beam.
Figure 9.1: Presentation of the experimental setup. See text for details. On axisoptical pumping is not represented on this figure.
An ensemble of 87Rb atoms are first loaded into a 2D magneto optical trap(MOT) in the upper part of the chamber. They are pushed to the lower cham-ber into a 3D MOT. After a phase of sub-Doppler cooling, they are transferedinto an elongated dipole trap made from a weakly focused single mode 7 W,1030 nm beam and cooled to 25 µK. The trapping depth of the dipole trap istypically 230 µK limiting the trapped atoms temperature. Typically 5× 10⁵ to1× 106 atoms can be trapped in the dipole trap. The atomic cloud typically mea-sures 4 mm×40 µm×40 µm (FWHM) allowing a strong light matter interaction,the measured effective optical density on resonance is d = 57(3) [Koschorreck 11].An absorption image of a typical atomic cloud is reported on Figure 9.3.
A non-destructive measurement of the atomic state is made using pulses oflinearly polarized light detuned 800 MHz to the red of the F = 1 → F ′ = 0transition of the D2 line (see Appendix B) and sent through the atoms in a beam
9.1. EXPERIMENTAL SYSTEM 111
TOPTICAPROBE
OFFSETLOCK
TOPTICAF=2
SATURATEDABSORPTION
FEEDBACK FEEDBACK
SLAVEF=2
2D MOT COOLER2D MOT PUSH BEAM
SEEDECDLF=1
SATURATEDABSORPTION
FEEDBACK
H PROBEV PROBE
F=2 DEPLETIONCOOLING
ABSORPTION IMAGING
REPUMPING (DEPLETE F=1) OPTICAL PUMPING
CIRCULAR ON AXIS OPT PUMPING
Figure 9.2: Laser system. See text for details.
8 mm
3 mm
Figure 9.3: Absorption image of a typical atom cloud trapped in the dipole trap.The cloud contains about 1× 10⁶ atoms.
matched to the transverse cloud size. The light experiences a polarization rotationproportional to the population difference between the |F = 1,mF = −1〉 and|F = 1,mF = 1〉 states. The linear polarization can be decomposed in two circularpolarizations, each of those polarization experience a phase shift proportional tothe population of each Zeeman sublevel it interact with. The rotation of the linearpolarization is thus proportional to the population difference.
In this context, the light polarization state is described by the Stokes operatorsS:
S0 =1
2
(a†+a+ + a†−a−
)Sx =
1
2
(a†−a+ + a†+a−
)Sy =
1
2
(a†−a+ − a†+a−
)Sz =
1
2
(a†+a+ − a†−a−
)
where a†±, a± are respectively the creation an annihilation operators of the σ±
modes of the field.
As shown in [Geremia 06] we can express the atomic polarization in terms ofthe collective atomic pseudo-spin operators J:
J0 =1
2N
Jx =1
2
∑k
(F 2x,k − F 2
y,k
)Jy =
1
2
∑k
(Fx,kFy,k + Fy,kFx,k
)Jz =
1
2
∑k
Fz,k
Where N is the atom number operator, Fi,k is the ith component of the spinoperator corresponding to the kth atom. The sum is over all atoms.
With these notations, the interaction Hamiltonian can be written the followingway [Geremia 06, de Echaniz 08]:
9.1. EXPERIMENTAL SYSTEM 113
H(0)I =
4
3gα(0)S0J0
H(1)I = 2gα(1)SzJz
H(2)I = 2gα(2)
(SxJx + SyJy +
1
3S0J0
)
Where g is a coupling constant, α(i) are the tensor polarizability componentsof the atomic transition. The detuning of the probe is chosen such as the α(1)
term dominates over the α(2) term, this condition is achieved when the probe issignificantly detuned to the red of the F = 1→ F ′ = 0 transition. The term S0J0
which represents a global energy shift, can be ignored.In this case, the the mutual polarization - spin interaction when a pulse (of
duration τ) passes through the ensemble can be described as evolution for a timeτ under an effective Hamiltonian.
H = ~G
τJzSz
where G is a coupling constant depending on the detuning, the transitionparameters and the spatial matching between the light field and the atomic cloud[Kubasik 09].
When the net polarization rotation is small, in the sense that Sy changes bymuch less than NL, we can use the first-order input-output relation, giving:
S(out)y ≈ S(in)
y +GJ (in)z S(in)
x
Thus mapping the z component of the atomic state onto the light polarizationstate. The light input state is 〈Sy〉 = 〈Sz〉 = 0, 〈Sx〉 = NL/2 with NL being thenumber of photons. After interaction, the detected Stokes operator is proportionalto the z component of the atomic spin. Because 〈Sy〉, the input Stokes operator
S(in)y only contributes to quantum noise. It represent the effect of the light shot
noise on the measurement.The pulses are of 1 µs duration, contain 3.7× 10⁶ photons on average, and are
spaced by 10 µs to allow individual detection. Precise timing is ensured by theuse of a digital input output card with a hardware clock and FIFO (NI PCIe-6259) and a hardware pulse generator. The 240:1 aspect ratio of the atomiccloud creates a strong paramagnetic Faraday interaction G ≈ 6× 10⁻⁸ rad/spin.
After interaction with the atoms, S(out)y is detected with a shot noise limited (SNL)
balanced polarimeter in the±45 basis. The probe photon numberNL is measuredwith a beam-splitter and reference detector before the atoms. The probing-plus-detection system is shot-noise-limited above 3×10⁵ photons/pulse. Previous work
with this system has demonstrated QND measurement of the collective spin Fzwith an uncertainty of ∼ 500 spins [Koschorreck 10b, Koschorreck 10a].
9.2 State preparation
For testing the previous approach Gaussian and non-Gaussian distributions aregenerated. The non-Gaussian test distribution is a statistical mixture of two dis-placed Gaussian spin distribution and is defined on Figure 9.4. The non-Gaussian
distribution is defined by P(NG)α (Fz) = [Pα+(Fz) + Pα−(Fz)]/2 where Pα±(Fz) is
the gaussian distribution: Pα±(Fz) = (σ√
2π)−1exp(−((Fz ± α)2)/(2σ2)
)The non-Gaussian distribution has the following cumulants:
κodd = 0 (9.1)
κ2 = α2 + σ2 (9.2)
κ4 = −4α4 (9.3)
κ6 = 16α6 (9.4)
κ8 = −272α8 (9.5)
𝛂𝛂
FZ
P 𝛔
Figure 9.4: The test distribution (black line) is a statistical mixture of twodisplaced Gaussian distributions (red and blue dashed lines).
The Gaussian and non-Gaussian distributions are prepared with the followingstrategy: we prepare a “thermal state” (TS), an equal mixture of the F = 1,mF =−1, 0, 1 ground states, by repeated optical pumping between the F = 1 and F = 2hyperfine levels. The optical pumping is performed with the 3D MOT laser beams,thus producing a highly varying spatial polarization pattern. The lasers are tuned
9.3. DATA ACQUISITION AND NORMALIZATION 115
to the F = 1 → F ′ = 2 and F = 2 → F ′ = 2 transitions. Different phases ofoptical pumping (≈ 300 µs long each) are performed with different magnetic fielddirections to suppress any net polarization [Koschorreck 10b].
Because the thermal spin state of each atom is random and independent, atthe limit of a large number of atoms, the macroscopic spin distribution is Gaussianwith 〈Fz〉 = 0 and, for a spin 1 state, var(Fz) = σ2 = 2NA/3.
By optical pumping with pulses of on resonance circularly-polarized light wedisplace this to 〈Fz〉 = α, with negligible change in var(Fz)
1 [Toth 10], to produce
Pα(Fz) =1
σ√
2πexp
(−(Fz − α)2
2σ2
)By displacing different thermal states alternately to α+ and α−, we produce anequal statistical mixture of the two displaced states, represented on Figure 9.4:
tions of mixtures of n = 0, 1 Fock (number) states and m = N,N − 1 symmetricDicke states. The experimental sequence is shown in Figure 9.5.
The optical pumping beams are matched with the atomic cloud and counterpropagating. Both beams are matched with the probe beam, firstly by optimiz-ing the coupling of the probe beam into the fiber of the backward pump beam,adjusting the backward beam mirrors. Then the forward beam is aligned by op-timizing its coupling into the backward beam fiber. The beams are controlledindependently with their respective AOMs.
9.3 Data acquisition and normalization
For each preparation, 100 measurements of Fz are made, with readings (i.e., esti-
mated Fz values by numerical integration of the measured signal)mi = 2S(out,i)y /N
(i)L .
In order to reduce technical noise and compensate for possible drifts, the numer-ical integration includes a electronic background subtraction step: the electroniclevel measured before each pulse is subtracted from the corresponding pulse.
Imperfect thermalization produce a small residual atomic polarization. Thisresidual polarization depends on the number of atoms in the trap, and its fluc-tuation produce excess noise in the data. The change of this polarization versusthe number of atoms is measured with the sequences without displacement DM[0]
1The noise increase is about√NP where NP ≈ 103 is the number of photons absorbed by the
atoms during the pumping process. Giving a noise significantly lower than the shot noise of 106
Figure 9.5: Experimental sequence: The experimental sequence divides into dis-tinct tasks. Baseline acquisition: prepare the thermal state and probe to measurethe residual rotation. Displace and measure (DM[α]): prepare the thermal state,displace by α and probe. Approx 10% of atoms are lost at each thermalization,so that the number of atoms NA drops in steps from ≈ 8× 10⁵ to ≈ 2.5× 10⁵
during the whole sequence. Measure number of atoms NA: by pumping the atomsinto F=1, mF=1 and probing we measure the number of atoms in the trap. Tocorrect for drifts, a sequence without displacement (DM[0]) is performed every 11runs. We perform the sequence varying the displacement to acquire a dataset of
Because the measurement is non-destructive and shot noise limited, we cancombine readings in a higher-sensitivity metapulse with reading M ≡
∑mi
[Koschorreck 10b]. This metapulse (containing NR readings) is equivalent to per-forming a measurement with NR × NL photons and can be seen as erasing thetime information from the detector. This technique allows to vary the readoutnoise without performing additional measurements.
The non-Gaussian experimental states allow to compare the measured cumulantsvalues, and their noise expectations with the experimental data. In the followingchapter the analysis of the experimental data, as well as the calibration of thenoise sources and the comparison with the expectations is presented.
10.1 Detection, Analysis and Results
For a given optical pumping strength α, the measurements can be described bythe distribution
Pα±(M) =1
σM√
2πexp
(−(M ± α)2
2σ2M
)where the variance σ2
M = σ2AN′A
2N2R + σ2
R includes atomic noise σ2AN′A
2 withN ′A = NA/N
MAXA (with NMAX
A the mean number of atoms after loading) andreadout noise, σ2
R = NR/NL due to the probe light shot noise.
The variance σ2A is determined from the scaling of var(M) with NA and NR, as
in [Koschorreck 10b]. The variance of the measured distributions (with fixed NA,NR) for each pumping direction is computed. The expression σ2
M = σ2AN′A
2N2R +
σ2R is fitted with the measured variance, with σA as variable.
The readout noise σ2R can be varied over two orders of magnitude by appro-
priate choice of the number of pulses NR used in the metapulses. For one probe
pulse and the maximum number of atoms we haveσ2R
σ2AN′ANR
= 84.7.
The non-Gaussian test distribution is produced by composing metapulses fromNR samples drawn from displaced thermal state (DM[α+] or DM[α−]) prepara-
tions with equal probability, giving distribution P(NG)α (M) = [Pα+(M)+Pα−(M)]/2.
With αM ≡ (α+ − α−)/2.
119
120CHAPTER 10. NOISE PERFORMANCEOF CUMULANT BASED APPROACH
100
102
104
106
NR=4
NR=8
NR=16
NR=32
NR=64
2 4 8 10 20
−1
1
Figure 10.1: Measured and predicted k4 with residuals for non-Gaussian dis-tributions of different α. Readout noise is varied by the choice of the numberof pulses NR used in the metapulses. Top: Points show normalized −k4 calcu-lated from N = 100 preparations of the ensemble. Black line indicates expected−k4/N
4Rσ
2A calculated using equation Equation 9.1 and σA determined from the
analysis of the independznt distributions, red line (top) shows −κ4 +√
var(k4)calculated from the distribution parameters for the largest readout noise. Bottom:normalized residuals.
Our ability to measure the non-Gaussianity is determined by 〈k4〉 = κ4 andfrom Equation 8.6. The combination of Equation 9.1 and Equation 8.6 gives :
var(k4) = 136α8M −
144Nα4M (α2
M + σ2M )2
N − 1
+24N(N + 1)(α2
M + σ2M )4
(N − 1)(N − 2)(10.1)
As shown in Figure 10.1, the experimentally obtained values agree well withtheory, and confirm the independence from measurement noise.
The “signal-to-noise ratio” for κ4, S = κ42/var(k4), is computed using Equa-
tion 10.1, κ4 = −2α4M , and experimental αM , NR, σR, is shown as curves in Fig-
ure 10.2. We can confirm this S experimentally by computing SN ≡ 〈k4〉2 /var(k4)using k4 values derived from several realizations of the experiment, each samplingPNGα N times. In the limit of many realizations SN → S. We employ a boot-
strapping technique: From 100 samples of P(NG)α (M) for given parameters αM , NR
10.2. OPTIMUM ESTIMATION OF NON-GAUSSIAN DISTRIBUTIONS 121
100
101
102
10−1
100
101
102
15.9
10.3
6.19
4.03
2.67
1.75
Figure 10.2: Signal-to-noise in estimation of κ4 versus readout noise for differentα′ = αM/(NR σA). Points show measurement results, lines show theory.
and NA, we derive thirty-three N = 20 realizations by random sampling withoutreplacement, and compute 〈k4〉 and var(k4) on the realizations. As shown in Fig-ure 10.2, agreement with theory is observed. The deviations at low signal to noiseratio are coming probably from the statistical noise on the signal to noise.
10.2 Optimum estimation of non-Gaussian distribu-tions
We note that in scenarios where measurements are expensive relative to statepreparation (as might be the case for QND measurements of optical fields or fortesting the successful storage of a single photon in a quantum memory), opti-mal use of measurement resources (e.g. measurement time) avoids both too fewpreparations and too few probings.
We consider a scenario of practical interest for quantum networking: a her-alded single-photon state is produced and stored in an atomic ensemble quantummemory[Filip 08]. Assuming the ensemble is initially polarized in the X direction,the storage process maps the quadrature components X,P onto the correspond-ing atomic spin operators XA, PA ∝ Fz,−Fy, respectively. QND measurementsof Fz are used to estimate XA, and thus the non-Gaussianity of the stored singlephoton. Due to imperfect storage, this will have the distribution of a mixture of
122CHAPTER 10. NOISE PERFORMANCEOF CUMULANT BASED APPROACH
Figure 10.3: Signal-to noise-ratio S versus NR for a fixed probe number NMNR =1× 10⁵ for the probability distribution associated with Fock state mixture de-scribed in the text with a normalized n=0 width σ0 = 1. Red curve (top): p=1.Green curve (bottom): p= 0.5 with SNL measurement: σR =
√20/NR.
n = 0 and n = 1 Fock states: ρ = (1 − p) |0〉〈0| + p |1〉〈1|. For a quadrature X,we have the following probability distribution
Pp(X) =1√
2πσ0
exp
(− x2
2σ20
)(px2
σ20
+ 1− p)
, where σ0 is the width of the n = 0 state.
Taking in account the readout noise σ2R, the cumulants are κodd = 0, κ2 =
(2p + 1)σ2H + σ2
R, κ4 = −12p2σ4H , κ6 = 240p3σ6
H , κ8 = −10080p4σ8H , where the
readout noise σ2R is included as above. Here κ4 is directly related to the classicality
of the state, since p > 0.5 implies a negative Wigner distribution [Lvovsky 01].
For a fixed total number of measurement resources NMNR, an optimal distri-bution of resources per measurement NR exists as shown in Figure 10.3. Withincreasing NR, the signal-to-noise first increases due to the improvement of themeasurement precision. Then, once the increased measurement precision no longergives extra information about k4, the precision decreases due to reduced statis-tics because of the limited total number of probes. For a large total number ofmeasurements, we can derive a simplified expression of this optimum. We deriveasymptotic expressions of S: SL (SH) for σR σ0 (σR σ0). The optimal NR
is found by solving SL = SR giving σR8 ≈ σ8
0(1 + 8p − 12p2 + 48p3 − 24p4). Forthis optimal σR, the measurement noise is in the same order of magnitude as thecharacteristic width of the non-Gaussian distribution.
10.3. CONCLUSION 123
10.3 Conclusion
We have demonstrated a good agreement between the expected noise and theexperimental signal to noise ratio, thus validating the cumulant approach for non-Gaussian atomic states. We have also noted an interesting scenario where the useof the resource can be optimized in order to reduce the noise on the estimation ofthe fourth order cumulant. The approach described here can be easily extendedto other non Gaussian states.
124CHAPTER 10. NOISE PERFORMANCEOF CUMULANT BASED APPROACH
Chapter 11
Conclusion
The cumulant-based methods described here should be very attractive for experi-ments with non-Gaussian states of material systems such as atomic ensembles andnano-resonators, for which the state preparation time is intrinsically longer, andfor which measurement noise is a greater challenge than in optical systems. Themeasurement noise does not affect the measured value, and its contribution tothe statistical noise can be evaluated thus allowing to evaluate boundaries on themeasured values. This advantage is valid only for noise source with a Gaussianprobability distribution. Care have to be taken with technical noise (comparedto shot noise) which can have a broad range of probability distributions. Experi-mental tests have been performed with a cold atomic ensemble that demonstratethe method in a system highly suitable for quantum networking, while the theoryapplies equally to other quantum systems of current interest.
Non classicality of the measured state can be easily demonstrated if assump-tions on the measured states is done. For example in the case of a statisticalmixture between n = 0 and n = 1 Fock states ρ = (1 − p) |0〉〈0| + p |1〉〈1|, thefourth order cumulant gives information about the value of the parameter p andbounds it, allowing to evaluate if the original state is non classical in the senceof having a negative Wigner function. In the general case cumulants can provenon-classicality [Bednorz 11, Shchukin 05, Eran Kot 11] but work have still to bedone in order to obtain a simple set of criterion well adapted to experimentalsystems currently used or proposed.
This approach can be extended to higher order cumulants in order to obtain ahigher amount of information on the probability distribution, thus the quantumstate. To confirm the interest of this method for evaluating unknown non Gaus-sian quantum states, the reconstruction problem have still to be addressed. Inparticular what information is brought by increasing the order of the evaluation.Knowing that the statistical noise is expected to increase with the order of theevaluated cumulant for a given ”physical” distribution.
125
126 CHAPTER 11. CONCLUSION
Part III
Conclusion
127
129
Two aspects of light matter interaction with atomic ensembles have been stud-ied in the perspective of writing information from light to the atomic state withtrapped ion ensembles and studying a new method to read information from theatomic ensemble, in the context of non-Gaussian states measured with QuantumNon Demolition measurements.
The work with trapped ions allowed us to reach significant probe absorptionlevels in a large coulomb crystal and observing the signature of Electromagneti-cally Induced Transparency in such a system. Strong absorption combined withthe quantum control of the atomic state are necessary building blocks for a ionensemble based quantum memory. The light matter interaction probability levelsobserved during this thesis despite being unprecedented in such systems are toolow in the context of building a quantum memory with trapped ion ensembles.Radio frequency heating has been identified as the possible main limitation insuch system. Further studies are needed to understand this phenomenon in largeion ensembles and improving trap design in order to minimize it. Together withthis study, it is necessary to measure and optimize the coherence time in largeion ensembles. These measurements would allow one to evaluate the qualities oflarge ion ensembles for quantum information storage and processing.
On the other side the question of extracting information from atomic ensemblehave been asked in the experimental context of a large cold Rubidium ensemblemeasured with low noise Quantum Non Demolition measurements. In particu-lar the question of the detection of non Gaussian states in such systems havebeen addressed. Non Gaussian states are an essential building block for quantuminformation processing with continuous variables. The production and the mea-surement of non Gaussian states have been performed in photonic systems andproposals are actively pursued in atomic systems. Since atomic systems are usu-ally more difficult to measure (higher noise and longer time scale), particular toolscan be needed to detect such states efficiently. The work performed allowed toevaluate the possibility of using statistical tools as cumulants in this context. Cu-mulants allow to evaluate non Gaussian state with few measurements and knownuncertainty which have been compared against a classical non Gaussian test state.Non classicality is linked with the cumulants, but in a relatively complex way.More theoretical work is needed to obtain simple boundaries adapted to recentexperimental proposals.
Particularities The bandwidth needed being relatively low, this offset lock isbased on a analog devices N-divider PLL with a bandwidth of 400 MHz: theADF4002.
The feedback in the MBR-110 is performed on a piezo of a cavity mirror, al-lowing a low feedback bandwidth of a few Hz. To avoid oscillations, it is importantto increase the typical time constant of the loop filter. The filter being mainlyintegral, the right time constant to take into account is the time for saturatingthe output when the error signal is maximum. This time is chosen to be a few100 ms.
The output signal of the ADF4002 is a charge pump, with the sign of thedelivered current depending on the sign of the frequency difference. Whereas thischarge pump is able to drive negative current, it is not able to produce negativevoltages. Thus it is important that the time constant of the first stage, the passiveintegral filter, are not too low in order to avoid saturation of the charge pump, inparticular for negative currents.
139
140 APPENDIX C. OFFSET LOCK FOR MBR
FAST OPA
RAMP GENERATION DC OFFSET
CURRENT TO VOLTAGEINTEGRATOR
GLOBAL GAIN+ OFFSET
GAIN 2PROPORTIONAL INTEGRAL
FILTER
OUTPUT
INPUT
CE AGND DGND
CLK
DATA
LE
REFIN
RFINA
RFINB
24-BIT INPUTREGISTER
SDOUT
AVDD DVDD
14-BITR COUNTER
R COUNTERLATCH
22
14
FUNCTIONLATCH
N COUNTERLATCH
13-BITN COUNTER
M3 M2 M1
MUX
SDOUT
AVDD
HIGH Z
MUXOUT
CPGND RSETVP
CPPHASE
FREQUENCYDETECTOR
LOCKDETECT
REFERENCE
CHARGEPUMP
CURRENTSETTING 1
ADF4002
CPI3 CPI2 CPI1 CPI6 CPI5 CPI4
CURRENTSETTING 2
Quartz20MHz
MinicircuitsRF amplifier
Frequencyconversion
Filter
AOM
Laser system
To experimentTi:Sa
LASER
Leakage fromTOPTICA laser diode
50:50beam splitter
VERDI18W
modulationinput
6𝛍F
1k𝛀
1k𝛀
5k𝛀
5k𝛀
550𝛀
1M𝛀 330nF
140k𝛀
FC=2Hz
1k𝛀
2k𝛀
10k𝛀
10k𝛀
10k𝛀
Figure C.1: Offset lock general schemeThe laser to lock is beating with a reference laser (top part), this beating signalis then sent to the detection system (middle part) which will generate an errorsignal depending on the setpoint. This error signal is then sent to a feedback filter(bottom part). The output signal is then sent back to the laser.The filter contains also the generation of a triangle ramp and offset.
141
characterization and results The offset lock has been characterized using asaturated absorption spectroscopy setup.
−1
0
1
−800 −400 0 400 800
−0.02
−0.01
0
0.01
𝚫f (MHz)
Err
or s
igna
lS
pectroscopy
Figure C.2: Black, thick : Typical unfiltered offset lock error signal. Red :simultaneous spectroscopy. The setpoint was 370 MHz
A typical error signal is depicted on Figure C.2. The sign change of the errorsignal at ≈±600 MHz is due to a folding of the spectrum 1 with the (undocu-mented) effective sampling frequency of the input divider which we measured tobe about fsample = 1.2 GHz. The frequency of this sign change is fsample−fsetpointand is not extremely stable, thus avoiding it’s use for locking. This phenomenahave to be kept in mind in the case of high fsetpoint because it reduces the lockcapture range.
Once locked, the power beating signal is ≈ 4 MHz wide at half height. Thiswidth is interpreted to be mainly due to a residual frequency modulation of theetalon lock of the MBR 110
Possible improvments The main limitation is the laser linewidth. It can bereduced by adding an AOM at the output of the laser and filtering the highfrequency signal of the output of the PLL to perform feedback on the AOM ra-diofrequency. The bandwith of an accousto optic modulator being larger than thewidth of the beating signal, it would allow to reduce the relative laser linewidth.
1Third order Nyquist harmonic
142 APPENDIX C. OFFSET LOCK FOR MBR
Appendix D
Various
D.1 Branching ratios
1/32/3 1/32/31
1 1/102/5 3/10 3/5 4/5
-3/5 -2/5 2/5 -1/15 -8/15
Figure D.1: Clebsch Gordan coefficients for the levels involved in Sr+
143
144 APPENDIX D. VARIOUS
D.2 Lifetime and frequencies of low energy levels ofSr+
C]
B
52P3/2
52P1/2
42D5/2
42D3/2
52S1/2
674.025589 nm [34533 msec. [
687.0066 nm [39538 msec. [
407.886nm [6.99 nsec [
421.6706nm [7.87 nsec [
1033.01nm [115 nsec [ ]
1003.94nm [901 nsec [ ]
1091.79nm [105 nsec [
Strontium IIAtomic Number 38
Mass number A = 88 (82.6%)
A
A
]A
B
B]
]
]
D]C]
C]
C]
C]
C]
D]
Figure D.2: Sr II transitions from [James 97]References:A: [Barwood 97]B: [Gallagher 67]C: [Moore 52]D: [Gerz 87]
Bibliography
[Albert 11] Magnus Albert, Aurelien Dantan & Michael Drewsen. Cavity elec-tromagnetically induced transparency and all-optical switching usingion Coulomb crystals. Nat Photon, vol. 5, no. 10, pages 633–636,October 2011.
[Alheit 96] R. Alheit, K. Enders & G. Werth. Isotope separation by nonlinearresonances in a Paul trap. Applied Physics B: Lasers and Optics,vol. 62, pages 511–513, 1996.
[Andre 04] A. Andre, A. S. Sørensen & M. D. Lukin. Stability of Atomic ClocksBased on Entangled Atoms. Phys. Rev. Lett., vol. 92, no. 23, page230801, Jun 2004.
[Appel 09a] J. Appel, P. J. Windpassinger, D. Oblak, U. B. Hoff, N. Kjærgaard& E. S. Polzik. Mesoscopic atomic entanglement for precision mea-surements beyond the standard quantum limit. Proceedings of theNational Academy of Sciences, vol. 106, no. 27, pages 10960–10965,2009.
[Appel 09b] Jurgen Appel, Andrew MacRae & A I Lvovsky. A versatile digi-tal GHz phase lock for external cavity diode lasers. MeasurementScience and Technology, vol. 20, no. 5, page 055302, 2009.
[Ashkin 70] A. Ashkin. Atomic-Beam Deflection by Resonance-Radiation Pres-sure. Phys. Rev. Lett., vol. 25, no. 19, pages 1321–1324, Nov 1970.
[Barrett 03] M. D. Barrett, B. DeMarco, T. Schaetz, V. Meyer, D. Leibfried,J. Britton, J. Chiaverini, W. M. Itano, B. Jelenkovic, J. D. Jost,C. Langer, T. Rosenband & D. J. Wineland. Sympathetic coolingof 9Be+ and 24Mg+ for quantum logic. Phys. Rev. A, vol. 68, page042302, Oct 2003.
[Barwood 97] G.P. Barwood, P. Gill, H.A. Klein & W.R.C. Rowley. Clearly re-solved secular sidebands on the 2S1/2 -2D5/2 674-nm clock transi-
145
146 BIBLIOGRAPHY
tion in a single trapped Sr+ ion. Instrumentation and Measurement,IEEE Transactions on, vol. 46, no. 2, pages 133 –136, apr 1997.
[Bednorz 11] Adam Bednorz & Wolfgang Belzig. Fourth moments reveal the neg-ativity of the Wigner function. Phys. Rev. A, vol. 83, page 052113,May 2011.
[Benhelm 08] J. Benhelm, G. Kirchmair, C. F. Roos & R. Blatt. Experimentalquantum-information processing with 43Ca+ ions. Phys. Rev. A,vol. 77, no. 6, page 062306, Jun 2008.
[Berkeland 98] D. J. Berkeland, J. D. Miller, J. C. Bergquist, W. M. Itano &D. J. Wineland. Minimization of ion micromotion in a Paul trap.Journal of Applied Physics, vol. 83, no. 10, pages 5025–5033, 1998.
[Berkeland 02] D. J. Berkeland & M. G. Boshier. Destabilization of darkstates and optical spectroscopy in Zeeman-degenerate atomic sys-tems. Phys. Rev. A, vol. 65, no. 3, page 033413, Feb 2002.
[Blumel 88] R. Blumel. Phase transitions of stored laser-cooled ions. Nature(London), vol. 334, no. 6180, pages 309–313, July 1988.
[Borghs 83] G. Borghs, P. Bisschop, M. Hove & R. Silverans. Hyperfine in-teractions in the alkaline-earth Sr ions by collinear fast beam laserspectroscopy. Hyperfine Interactions, vol. 15, pages 177–180, 1983.
[Bowe 99] P. Bowe, L. Hornekær, C. Brodersen, M. Drewsen, J. S. Hangst &J. P. Schiffer. Sympathetic Crystallization of Trapped Ions. Phys.Rev. Lett., vol. 82, no. 10, pages 2071–2074, Mar 1999.
[Buchinger 90] F. Buchinger, E. B. Ramsay, E. Arnold, W. Neu, R. Neu-gart, K. Wendt, R. E. Silverans, P. Lievens, L. Vermeeren,D. Berdichevsky, R. Fleming, D. W. L. Sprung & G. Ulm. Sys-tematics of nuclear ground state properties in 78−−100Sr by laserspectroscopy. Phys. Rev. C, vol. 41, no. 6, pages 2883–2897, Jun1990.
[Budker 07] Dmitry Budker & Michael Romalis. Optical magnetometry. NatPhys, vol. 3, no. 4, pages 227–234, April 2007.
[Burke 05] John H. T. Burke, Ofir Garcia, K. Jeramy Hughes, Brian Livedalen& Charles A. Sackett. Compact implementation of a scanning trans-fer cavity lock. Review of Scientific Instruments, vol. 76, no. 11, page116105, 2005.
BIBLIOGRAPHY 147
[Campbell 12] C. J. Campbell, A. G. Radnaev, A. Kuzmich, V. A. Dzuba, V. V.Flambaum & A. Derevianko. Single-Ion Nuclear Clock for Metrologyat the 19th Decimal Place. Phys. Rev. Lett., vol. 108, page 120802,Mar 2012.
[Cere 09] Alessandro Cere, Florian Wolfgramm, Mario Napolitano & Mor-gan W. Mitchell. Narrow-Band Filter for Quantum Light. InCLEO/Europe and EQEC 2009 Conference Digest, page EA P17.Optical Society of America, 2009.
[Cetina 07] Marko Cetina, Andrew Grier, Jonathan Campbell, Isaac Chuang& Vladan Vuletic. Bright source of cold ions for surface-electrodetraps. Phys. Rev. A, vol. 76, no. 4, page 041401, Oct 2007.
[Chou 10] C. W. Chou, D. B. Hume, J. C. J. Koelemeij, D. J. Wineland &T. Rosenband. Frequency Comparison of Two High-Accuracy Al+
[de Echaniz 08] S. R. de Echaniz, M. Koschorreck, M. Napolitano, M. Kubasik &M. W. Mitchell. Hamiltonian design in atom-light interactions withrubidium ensembles: A quantum-information toolbox. Phys. Rev. A,vol. 77, page 032316, Mar 2008.
[Dehmelt 68] H.G. Dehmelt. Radiofrequency Spectroscopy of Stored Ions I: Stor-age. Advances in Atomic and Molecular Physics, vol. 3, pages 53 –72, 1968.
[Dell’Anno 07] F. Dell’Anno, S. De Siena, L. Albano & F. Illuminati. Continuous-variable quantum teleportation with non-Gaussian resources. Phys.Rev. A, vol. 76, page 022301, Aug 2007.
[Deslauriers 06] L. Deslauriers, S. Olmschenk, D. Stick, W. K. Hensinger, J. Sterk& C. Monroe. Scaling and Suppression of Anomalous Heating in IonTraps. Phys. Rev. Lett., vol. 97, page 103007, Sep 2006.
[DeVoe 02] Ralph G. DeVoe & Christian Kurtsiefer. Experimental study ofanomalous heating and trap instabilities in a microscopic 137Ba iontrap. Phys. Rev. A, vol. 65, page 063407, Jun 2002.
[Drever 83] R. W. P. Drever, J. L. Hall, F. V. Kowalski, J. Hough, G. M. Ford,A. J. Munley & H. Ward. Laser phase and frequency stabilizationusing an optical resonator. Applied Physics B: Lasers and Optics,vol. 31, no. 2, pages 97–105, 1983.
148 BIBLIOGRAPHY
[Drewsen 98] M. Drewsen, C. Brodersen, L. Hornekær, J. S. Hangst & J. P. Schiff-fer. Large Ion Crystals in a Linear Paul Trap. Phys. Rev. Lett.,vol. 81, no. 14, pages 2878–2881, Oct 1998.
[Drewsen 00] M. Drewsen & A. Brøner. Harmonic linear Paul trap: Stabilitydiagram and effective potentials. Phys. Rev. A, vol. 62, page 045401,Sep 2000.
[Dubessy 09] R. Dubessy, T. Coudreau & L. Guidoni. Electric field noise abovesurfaces: A model for heating-rate scaling law in ion traps. Phys.Rev. A, vol. 80, page 031402, Sep 2009.
[Dubin 99] Daniel H. E. Dubin & T. M. O’Neil. Trapped nonneutral plasmas,liquids, and crystals (the thermal equilibrium states). Rev. Mod.Phys., vol. 71, pages 87–172, Jan 1999.
[Dubost 12] B. Dubost, M. Koschorreck, M. Napolitano, N. Behbood, R. J.Sewell & M. W. Mitchell. Efficient Quantification of Non-GaussianSpin Distributions. Phys. Rev. Lett., vol. 108, page 183602, May2012.
[Eisert 02] J. Eisert, S. Scheel & M. B. Plenio. Distilling Gaussian States withGaussian Operations is Impossible. Phys. Rev. Lett., vol. 89, page137903, Sep 2002.
[Eran Kot 11] Eugene S. Polzik Eran Kot Niels Grønbech-Jensen & An-ders S. Sørensen. Authenticating Non-Classicality. ArXiv quant-ph/1110.3060, Oct 2011.
[Eschner 03] Jurgen Eschner, Giovanna Morigi, Ferdinand Schmidt-Kaler &Rainer Blatt. Laser cooling of trapped ions. J. Opt. Soc. Am. B,vol. 20, no. 5, pages 1003–1015, May 2003.
[Filip 08] Radim Filip. Excess-noise-free recording and uploading of nonclas-sical states to continuous-variable quantum memory. Phys. Rev. A,vol. 78, page 012329, Jul 2008.
[Gallagher 67] Alan Gallagher. Oscillator Strengths of Ca II, Sr II, and Ba II.Phys. Rev., vol. 157, pages 24–30, May 1967.
[Geremia 06] J. M. Geremia, John K. Stockton & Hideo Mabuchi. Tensor polar-izability and dispersive quantum measurement of multilevel atoms.Phys. Rev. A, vol. 73, page 042112, Apr 2006.
[Gerz 87] Ch. Gerz, Th. Hilberath & G. Werth. Lifetime of the 4D3/2 and4D5/2 metastable states in Sr II. Zeitschrift fur Physik D Atoms,Molecules and Clusters, vol. 5, pages 97–99, 1987.
BIBLIOGRAPHY 149
[Ghosh 95] Pradip K. Ghosh. Ion traps. Oxford University Press, 1995.
[Giedke 02] Geza Giedke & J. Ignacio Cirac. Characterization of Gaussian op-erations and distillation of Gaussian states. Phys. Rev. A, vol. 66,page 032316, Sep 2002.
[Gray 78] H. R. Gray, R. M. Whitley & Jr. C. R. Stroud. Coherent trappingof atomic populations. Opt. Lett., vol. 3, no. 6, pages 218–220, Dec1978.
[Gross 10] C. Gross, T. Zibold, E. Nicklas, J. Esteve & M. K. Oberthaler.Nonlinear atom interferometer surpasses classical precision limit.Nature, vol. 464, no. 7292, pages 1165–1169, April 2010.
[Hammerer 10] Klemens Hammerer, Anders S. Sørensen & Eugene S. Polzik.Quantum interface between light and atomic ensembles. Rev. Mod.Phys., vol. 82, no. 2, pages 1041–1093, Apr 2010.
[Hasegawa 00] T. Hasegawa & T. Shimizu. Removal of irrelevant isotope ions inthe presence of laser cooling in a rf trap. Applied Physics B: Lasersand Optics, vol. 70, pages 867–871, 2000.
[Hedges 10] Morgan P. Hedges, Jevon J. Longdell, Yongmin Li & Matthew J. Sel-lars. Efficient quantum memory for light. Nature, vol. 465, no. 7301,pages 1052–1056, June 2010.
[Heinzen 90] D. J. Heinzen & D. J. Wineland. Quantum-limited cooling and de-tection of radio-frequency oscillations by laser-cooled ions. Phys.Rev. A, vol. 42, pages 2977–2994, Sep 1990.
[Herskind 08] P. Herskind, A. Dantan, M. Langkilde-Lauesen, A. Mortensen,J. Sørensen & M. Drewsen. Loading of large ion Coulomb crys-tals into a linear Paul trap incorporating an optical cavity. AppliedPhysics B: Lasers and Optics, vol. 93, no. 2, pages 373–379, Novem-ber 2008.
[Herskind 09] Peter F. Herskind, Aurelien Dantan, Joan P. Marler, Magnus Al-bert & Michael Drewsen. Realization of collective strong couplingwith ion Coulomb crystals in an optical cavity. Nat Phys, vol. 5,no. 7, pages 494–498, July 2009.
[Hertzberg 10] J. B. Hertzberg, T. Rocheleau, T. Ndukum, M. Savva, A. A. Clerk& K. C. Schwab. Back-action-evading measurements of nanome-chanical motion. Nat Phys, vol. 6, no. 3, pages 213–217, March2010.
150 BIBLIOGRAPHY
[Haffner 05] H. Haffner, F. Schmidt-Kaler, W. Hansel, C. F. Roos, T. Korber,M. Chwalla, M. Riebe, J. Benhelm, U. D. Rapol, C. Becher &R. Blatt. Robust entanglement. Applied Physics B: Lasers andOptics, vol. 81, pages 151–153, 2005.
[Hilborn 82] R. C. Hilborn. Einstein coefficients, cross sections, f values, dipolemoments and all that. Am. J. Phys., vol. 50, pages 982–986, 1982.
[Home 09] Jonathan P. Home, David Hanneke, John D. Jost, Jason M. Amini,Dietrich Leibfried & David J. Wineland. Complete Methods Setfor Scalable Ion Trap Quantum Information Processing. Science,vol. 325, no. 5945, pages 1227–1230, 2009.
[Hornekær 02] L. Hornekær & M. Drewsen. Formation process of large ionCoulomb crystals in linear Paul traps. Phys. Rev. A, vol. 66, no. 1,page 013412, Jul 2002.
[Hosseini 11] M. Hosseini, B.M. Sparkes, G. Campbell, P.K. Lam & B.C. Buch-ler. High efficiency coherent optical memory with warm rubidiumvapour. Nat Commun, vol. 2, pages 174–, February 2011.
[Hughes 57] R. H. Hughes. Isotope Shifts in the Spectra of Strontium. Phys.Rev., vol. 105, no. 4, pages 1260–1261, Feb 1957.
[Ichimaru 82] Setsuo Ichimaru. Strongly coupled plasmas: high-density classicalplasmas and degenerate electron liquids. Rev. Mod. Phys., vol. 54,no. 4, pages 1017–1059, Oct 1982.
[Itano 98] W. M. Itano, J. J. Bollinger, J. N. Tan, B. Jelenkovic, X.-P. Huang& D. J. Wineland. Bragg Diffraction from Crystallized Ion Plasmas.Science, vol. 279, no. 5351, pages 686–689, 1998.
[James 97] Daniel F. V. James. Quantum dynamics of cold trapped ions, withapplication to quantum computation. ArXiv quant-ph/9702053, Feb1997.
[Jezek 11] Miroslav Jezek, Ivo Straka, Michal Micuda, Miloslav Dusek, JaromırFiurasek & Radim Filip. Experimental Test of the Quantum Non-Gaussian Character of a Heralded Single-Photon State. Phys. Rev.Lett., vol. 107, page 213602, Nov 2011.
[Jost 09] J. D. Jost, J. P. Home, J. M. Amini, D. Hanneke, R. Ozeri,C. Langer, J. J. Bollinger, D. Leibfried & D. J. Wineland. En-tangled mechanical oscillators. Nature, vol. 459, no. 7247, pages683–685, June 2009.
BIBLIOGRAPHY 151
[Katori 99] Hidetoshi Katori, Tetsuya Ido, Yoshitomo Isoya & Makoto Kuwata-Gonokami. Magneto-Optical Trapping and Cooling of StrontiumAtoms down to the Photon Recoil Temperature. Phys. Rev. Lett.,vol. 82, no. 6, pages 1116–1119, Feb 1999.
[Kendall 58] Maurice G. Kendall & Alan Stuart. The advanced theory of statis-tics. C. Griffin, London, 1958.
[Kielpinski 02] D. Kielpinski, C. Monroe & D. J. Wineland. Architecture for alarge-scale ion-trap quantum computer. Nature, vol. 417, no. 6890,pages 709–711, June 2002.
[Kirilov 09] E. Kirilov & S. Putterman. 2-photon ionization for efficient seedingand trapping of strontium ions. The European Physical Journal D- Atomic, Molecular, Optical and Plasma Physics, vol. 54, pages683–691, 2009.
[Kominis 03] I. K. Kominis, T. W. Kornack, J. C. Allred & M. V. Romalis. Asubfemtotesla multichannel atomic magnetometer. Nature, vol. 422,no. 6932, pages 596–599, April 2003.
[Koschorreck 10a] M. Koschorreck, M. Napolitano, B. Dubost & M. W. Mitchell.Quantum Nondemolition Measurement of Large-Spin Ensembles byDynamical Decoupling. Phys. Rev. Lett., vol. 105, page 093602, Aug2010.
[Koschorreck 10b] M. Koschorreck, M. Napolitano, B. Dubost & M. W. Mitchell.Sub-Projection-Noise Sensitivity in Broadband Atomic Magnetome-try. Phys. Rev. Lett., vol. 104, page 093602, Mar 2010.
[Koschorreck 10c] Marco Koschorreck, Mario Napolitano, Brice Dubost, NaeimehBehbood, Robert Sewell & Morgan W. Mitchell. Spin Squeezingvia Quantum Non-Demolition Measurements in Cold 87Rb AtomicEnsemble. In Quantum Electronics and Laser Science Conference,page QThA4. Optical Society of America, 2010.
[Koschorreck 11] Marco Koschorreck. Generation of Spin Squeezing in an en-semble of Cold Rubidium 87. PhD thesis, ICFO - The Institute ofPhotonic Sciences and Univeristat Politecnica de Catalunya, 2011.
[Kreuter 04] A. Kreuter, C. Becher, G. P. T. Lancaster, A. B. Mundt, C. Russo,H. Haffner, C. Roos, J. Eschner, F. Schmidt-Kaler & R. Blatt. Spon-taneous Emission Lifetime of a Single Trapped Ca+ Ion in a HighFinesse Cavity. Phys. Rev. Lett., vol. 92, page 203002, May 2004.
152 BIBLIOGRAPHY
[Kubasik 09] M. Kubasik, M. Koschorreck, M. Napolitano, S. R. de Echaniz,H. Crepaz, J. Eschner, E. S. Polzik & M. W. Mitchell. Polarization-based light-atom quantum interface with an all-optical trap. Phys.Rev. A, vol. 79, page 043815, Apr 2009.
[Langer 05] C. Langer, R. Ozeri, J. D. Jost, J. Chiaverini, B. DeMarco, A. Ben-Kish, R. B. Blakestad, J. Britton, D. B. Hume, W. M. Itano,D. Leibfried, R. Reichle, T. Rosenband, T. Schaetz, P. O. Schmidt& D. J. Wineland. Long-Lived Qubit Memory Using Atomic Ions.Phys. Rev. Lett., vol. 95, no. 6, page 060502, Aug 2005.
[Leibrandt 09] David R. Leibrandt, Jaroslaw Labaziewicz, Vladan Vuletic &Isaac L. Chuang. Cavity Sideband Cooling of a Single Trapped Ion.Phys. Rev. Lett., vol. 103, page 103001, Aug 2009.
[Lemr 09] Karel Lemr & Jaromır Fiurasek. Conditional preparation of arbi-trary superpositions of atomic Dicke states. Phys. Rev. A, vol. 79,page 043808, Apr 2009.
[Lloyd 99] Seth Lloyd & Samuel L. Braunstein. Quantum Computation overContinuous Variables. Phys. Rev. Lett., vol. 82, pages 1784–1787,Feb 1999.
[Longdell 05] J. J. Longdell, E. Fraval, M. J. Sellars & N. B. Manson. StoppedLight with Storage Times Greater than One Second Using Electro-magnetically Induced Transparency in a Solid. Phys. Rev. Lett.,vol. 95, no. 6, page 063601, Aug 2005.
[Louchet-Chauvet 10] Anne Louchet-Chauvet, Jurgen Appel, Jelmer J Renema,Daniel Oblak, Niels Kjaergaard & Eugene S Polzik. Entanglement-assisted atomic clock beyond the projection noise limit. New Journalof Physics, vol. 12, no. 6, page 065032, 2010.
[Lucas 04] D. M. Lucas, A. Ramos, J. P. Home, M. J. McDonnell, S. Nakayama,J.-P. Stacey, S. C. Webster, D. N. Stacey & A. M. Steane. Isotope-selective photoionization for calcium ion trapping. Phys. Rev. A,vol. 69, no. 1, page 012711, Jan 2004.
[Lvovsky 01] A. I. Lvovsky, H. Hansen, T. Aichele, O. Benson, J. Mlynek &S. Schiller. Quantum State Reconstruction of the Single-Photon FockState. Phys. Rev. Lett., vol. 87, page 050402, Jul 2001.
[Lybarger 11] Warren E. Lybarger, Julian C. Berengut & John Chiaverini. Pre-cision measurement of the 5 2S1/2 – 4 2D5/2 quadrupole transitionisotope shift between 88Sr+ and 86Sr+. Phys. Rev. A, vol. 83, no. 5,page 052509, May 2011.
BIBLIOGRAPHY 153
[Madej 98] A.A. Madej, L. Marmet & J.E. Bernard. Rb atomic absorption linereference for single Sr+ laser cooling systems. Applied Physics B:Lasers and Optics, vol. 67, pages 229–234, 1998.
[Maiwald 09] Robert Maiwald, Dietrich Leibfried, Joe Britton, James C.Bergquist, Gerd Leuchs & David J. Wineland. Stylus ion trap forenhanced access and sensing. Nat Phys, vol. 5, no. 8, pages 551–554,August 2009.
[Margolis 04] H. S. Margolis, G. P. Barwood, G. Huang, H. A. Klein, S. N. Lea,K. Szymaniec & P. Gill. Hertz-Level Measurement of the OpticalClock Frequency in a Single 88Sr+ Ion. Science, vol. 306, no. 5700,pages 1355–1358, 2004.
[Massar 03] S. Massar & E. S. Polzik. Generating a Superposition of Spin Statesin an Atomic Ensemble. Phys. Rev. Lett., vol. 91, page 060401, Aug2003.
[Mitchell 98] T. B. Mitchell, J. J. Bollinger, D. H. E. Dubin, X.-P. Huang, W. M.Itano & R. H. Baughman. Direct Observations of Structural PhaseTransitions in Planar Crystallized Ion Plasmas. Science, vol. 282,no. 5392, pages 1290–1293, 1998.
[Monroe 95] C. Monroe, D. M. Meekhof, B. E. King, S. R. Jefferts, W. M. Itano,D. J. Wineland & P. Gould. Resolved-Sideband Raman Cooling of aBound Atom to the 3D Zero-Point Energy. Phys. Rev. Lett., vol. 75,pages 4011–4014, Nov 1995.
[Moore 52] C. E. Moore. Atomic energy levels vol ii. National Bureau of Stan-dards, Washington, 1952.
[Morigi 00] Giovanna Morigi, Jurgen Eschner & Christoph H. Keitel. GroundState Laser Cooling Using Electromagnetically Induced Trans-parency. Phys. Rev. Lett., vol. 85, pages 4458–4461, Nov 2000.
[Mortensen 04] A. Mortensen, J. J. T. Lindballe, I. S. Jensen, P. Staanum,D. Voigt & M. Drewsen. Isotope shifts of the 4s2 1S0 → 4s5p 1P1
transition and hyperfine splitting of the 4s5p 1P1 state in calcium.Phys. Rev. A, vol. 69, no. 4, page 042502, Apr 2004.
[Mortensen 06] A. Mortensen, E. Nielsen, T. Matthey & M. Drewsen. Observa-tion of Three-Dimensional Long-Range Order in Small Ion CoulombCrystals in an rf Trap. Phys. Rev. Lett., vol. 96, no. 10, page 103001,Mar 2006.
154 BIBLIOGRAPHY
[Mundt 02] A. B. Mundt, A. Kreuter, C. Becher, D. Leibfried, J. Eschner,F. Schmidt-Kaler & R. Blatt. Coupling a Single Atomic QuantumBit to a High Finesse Optical Cavity. Phys. Rev. Lett., vol. 89, page103001, Aug 2002.
[Napolitano 11] M. Napolitano, M. Koschorreck, B. Dubost, N. Behbood, R. J.Sewell & M. W. Mitchell. Interaction-based quantum metrologyshowing scaling beyond the Heisenberg limit. Nature, vol. 471,no. 7339, pages 486–489, March 2011.
[Neergaard-Nielsen 06] J. S. Neergaard-Nielsen, B. Melholt Nielsen, C. Hettich,K. Mølmer & E. S. Polzik. Generation of a Superposition of OddPhoton Number States for Quantum Information Networks. Phys.Rev. Lett., vol. 97, page 083604, Aug 2006.
[Neuhauser 78] W. Neuhauser, M. Hohenstatt, P. Toschek & H. Dehmelt. Optical-Sideband Cooling of Visible Atom Cloud Confined in Parabolic Well.Phys. Rev. Lett., vol. 41, no. 4, pages 233–236, Jul 1978.
[Nielsen 09] Anne E. B. Nielsen, Uffe V. Poulsen, Antonio Negretti & KlausMølmer. Atomic quantum superposition state generation via opticalprobing. Phys. Rev. A, vol. 79, page 023841, Feb 2009.
[Ostendorf 06] A. Ostendorf, C. B. Zhang, M. A. Wilson, D. Offenberg, B. Roth& S. Schiller. Sympathetic Cooling of Complex Molecular Ions toMillikelvin Temperatures. Phys. Rev. Lett., vol. 97, page 243005,Dec 2006.
[Ourjoumtsev 07] Alexei Ourjoumtsev, Hyunseok Jeong, Rosa Tualle-Brouri &Philippe Grangier. Generation of optical ‘Schrodinger cats’ fromphoton number states. Nature, vol. 448, no. 7155, pages 784–786,August 2007.
[Piro 11] N. Piro, F. Rohde, C. Schuck, M. Almendros, J. Huwer, J. Ghosh,A. Haase, M. Hennrich, F. Dubin & J. Eschner. Heralded single-photon absorption by a single atom. Nat Phys, vol. 7, no. 1, pages17–20, January 2011.
[Prestage 89] J. D. Prestage, G. J. Dick & L. Maleki. New ion trap for frequencystandard applications. Journal of Applied Physics, vol. 66, no. 3,pages 1013–1017, 1989.
BIBLIOGRAPHY 155
[Prestage 91] J. D. Prestage, A. Williams, L. Maleki, M. J. Djomehri & E. Hara-betian. Dynamics of charged particles in a Paul radio-frequencyquadrupole trap. Phys. Rev. Lett., vol. 66, no. 23, pages 2964–2967,Jun 1991.
[Ralph 03] T. C. Ralph, A. Gilchrist, G. J. Milburn, W. J. Munro & S. Glancy.Quantum computation with optical coherent states. Phys. Rev. A,vol. 68, page 042319, Oct 2003.
[Removille 09a] S. Removille. Vers une memoire quantique dans les ions pieges.PhD thesis, Universite Paris Diderot - Paris 7, septembre 2009.
[Removille 09b] S. Removille, R. Dubessy, Q. Glorieux, S. Guibal, T. Coudreau,L. Guidoni & J. P. Likforman. Photoionisation loading of largeSr+ ion clouds with ultrafast pulses. Applied Physics B: Lasers andOptics, 2009.
[Rosenband 08] T. Rosenband, D. B. Hume, P. O. Schmidt, C. W. Chou, A. Br-usch, L. Lorini, W. H. Oskay, R. E. Drullinger, T. M. Fortier, J. E.Stalnaker, S. A. Diddams, W. C. Swann, N. R. Newbury, W. M.Itano, D. J. Wineland & J. C. Bergquist. Frequency Ratio of Al+and Hg+ Single-Ion Optical Clocks; Metrology at the 17th DecimalPlace. Science, vol. 319, no. 5871, pages 1808–1812, 2008.
[Ryjkov 05] Vladimir L. Ryjkov, XianZhen Zhao & Hans A. Schuessler. Simu-lations of the rf heating rates in a linear quadrupole ion trap. Phys.Rev. A, vol. 71, no. 3, page 033414, Mar 2005.
[Schawlow 82] Arthur L. Schawlow. Spectroscopy in a new light. Rev. Mod. Phys.,vol. 54, pages 697–707, Jul 1982.
[Schmidt-Kaler 03] F Schmidt-Kaler, S Gulde, M Riebe, T Deuschle, A Kreuter,G Lancaster, C Becher, J Eschner, H Haffner & R Blatt. The co-herence of qubits based on single Ca + ions. Journal of Physics B:Atomic, Molecular and Optical Physics, vol. 36, no. 3, page 623,2003.
[Schnabel 10] Roman Schnabel, Nergis Mavalvala, David E. McClelland &Ping K. Lam. Quantum metrology for gravitational wave astron-omy. Nat Commun, vol. 1, pages 121–, November 2010.
[Schneider 05] T. Schneider, E. Peik & Chr. Tamm. Sub-Hertz Optical FrequencyComparisons between Two Trapped 171Yb+ Ions. Phys. Rev. Lett.,vol. 94, page 230801, Jun 2005.
156 BIBLIOGRAPHY
[Schubert 89] Michael Schubert, Ingo Siemers & Rainer Blatt. Line shape ofthree-level ions in Paul traps. Phys. Rev. A, vol. 39, no. 10, pages5098–5105, May 1989.
[Seymour-Smith 10] Nicolas Seymour-Smith, Peter Blythe, Matthias Keller &Wolfgang Lange. Fast scanning cavity offset lock for laser frequencydrift stabilization. Rev. Sci. Instrum., vol. 81, no. 7, page 075109,2010.
[Shah 10] V. Shah, G. Vasilakis & M. V. Romalis. High Bandwidth AtomicMagnetometery with Continuous Quantum Nondemolition Measure-ments. Phys. Rev. Lett., vol. 104, no. 1, page 013601, Jan 2010.
[Shchukin 05] E. Shchukin, Th. Richter & W. Vogel. Nonclassicality criteria interms of moments. Phys. Rev. A, vol. 71, page 011802, Jan 2005.
[Shiner 07] A.D. Shiner, A.A. Madej, P. Dube & J.E. Bernard. Absolute opti-cal frequency measurement of saturated absorption lines in Rb near422nm. Applied Physics B: Lasers and Optics, vol. 89, pages 595–601, 2007.
[Shu 10] G. Shu, N. Kurz, M. R. Dietrich & B. B. Blinov. Efficient flu-orescence collection from trapped ions with an integrated sphericalmirror. Phys. Rev. A, vol. 81, page 042321, Apr 2010.
[Shu 11] Gang Shu, Chen-Kuan Chou, Nathan Kurz, Matthew R. Dietrich& Boris B. Blinov. Efficient fluorescence collection and ion imagingwith the “tack” ion trap. J. Opt. Soc. Am. B, vol. 28, no. 12, pages2865–2870, Dec 2011.
[Silverans 88] R. E. Silverans, P. Lievens, L. Vermeeren, E. Arnold, W. Neu,R. Neugart, K. Wendt, F. Buchinger, E. B. Ramsay & G. Ulm.Nuclear Charge Radii of 78−100Sr by Nonoptical Detection in Fast-Beam Laser Spectroscopy. Phys. Rev. Lett., vol. 60, pages 2607–2610, Jun 1988.
[Sinclair 01] A. G. Sinclair, M. A. Wilson & P. Gill. Improved three-dimensionalcontrol of a single strontium ion in an endcap trap. Optics Commu-nications, vol. 190, no. 1-6, pages 193 – 203, 2001.
[Slattery 80] W. L. Slattery, G. D. Doolen & H. E. DeWitt. Improved equation ofstate for the classical one-component plasma. Phys. Rev. A, vol. 21,no. 6, pages 2087–2095, Jun 1980.
BIBLIOGRAPHY 157
[Slodicka 10] L. Slodicka, G. Hetet, S. Gerber, M. Hennrich & R. Blatt. Elec-tromagnetically Induced Transparency from a Single Atom in FreeSpace. Phys. Rev. Lett., vol. 105, page 153604, Oct 2010.
[Sondermann 07] M. Sondermann, R. Maiwald, H. Konermann, N. Lindlein,U. Peschel & G. Leuchs. Design of a mode converter for efficientlight-atom coupling in free space. Applied Physics B: Lasers andOptics, vol. 89, pages 489–492, 2007.
[Steck 03] D. A. Steck. Rubidium 87 D line data. http://steck.us/alkalidata/,2003.
[Stenholm 86] Stig Stenholm. The semiclassical theory of laser cooling. Rev. Mod.Phys., vol. 58, pages 699–739, Jul 1986.
[Sunaoshi 93] H. Sunaoshi, Y. Fukashiro, M. Furukawa, M. Yamauchi,S. Hayashibe, T. Shinozuka, M. Fujioka, I. Satoh, M. Wada &S. Matsuki. A precision measurement of the hyperfine structure of87Sr+. Hyperfine Interactions, vol. 78, pages 241–245, 1993.
[Tanaka 07] U. Tanaka, I. Morita & S. Urabe. Selective loading and laser coolingof rare calcium isotope 43Ca+. Applied Physics B: Lasers and Optics,vol. 89, pages 195–200, 2007.
[Tey 08] Meng Khoon Tey, Zilong Chen, Syed Abdullah Aljunid, BrendaChng, Florian Huber, Gleb Maslennikov & Christian Kurtsiefer.Strong interaction between light and a single trapped atom withoutthe need for a cavity. Nat Phys, vol. 4, no. 12, pages 924–927, De-cember 2008.
[Toth 10] Geza Toth & Morgan W Mitchell. Generation of macroscopic singletstates in atomic ensembles. New Journal of Physics, vol. 12, no. 5,page 053007, 2010.
[Toyoda 01] K. Toyoda, H. Kataoka, Y. Kai, A. Miura, M. Watanabe & S. Urabe.Separation of laser-cooled 42Ca+ and 44Ca+ in a linear Paul trap.Applied Physics B: Lasers and Optics, vol. 72, pages 327–330, 2001.
[Wenger 04] Jerome Wenger, Rosa Tualle-Brouri & Philippe Grangier. Non-Gaussian Statistics from Individual Pulses of Squeezed Light. Phys.Rev. Lett., vol. 92, page 153601, Apr 2004.
[Wilpers 02] G. Wilpers, T. Binnewies, C. Degenhardt, U. Sterr, J. Helmcke &F. Riehle. Optical Clock with Ultracold Neutral Atoms. Phys. Rev.Lett., vol. 89, no. 23, page 230801, Nov 2002.
[Wolfgramm 10a] Florian Wolfgramm, Alessandro Cere, Federica A. Beduini, AnaPredojevic, Marco Koschorreck & Morgan W. Mitchell. Squeezed-Light Optical Magnetometry. Phys. Rev. Lett., vol. 105, page053601, Jul 2010.
[Wolfgramm 10b] Florian Wolfgramm, Alessandro Cere & Morgan W. Mitchell.NOON states from cavity-enhanced down-conversion: high qualityand super-resolution. J. Opt. Soc. Am. B, vol. 27, no. 6, pagesA25–A29, Jun 2010.
[Wolfgramm 11] Florian Wolfgramm, Yannick A. de Icaza Astiz, Federica A.Beduini, Alessandro Cere & Morgan W. Mitchell. Atom-ResonantHeralded Single Photons by Interaction-Free Measurement. Phys.Rev. Lett., vol. 106, page 053602, Feb 2011.
[Zhao 09a] Bo Zhao, Yu-Ao Chen, Xiao-Hui Bao, Thorsten Strassel, Chih-SungChuu, Xian-Min Jin, Jorg Schmiedmayer, Zhen-Sheng Yuan, ShuaiChen & Jian-Wei Pan. A millisecond quantum memory for scalablequantum networks. Nat Phys, vol. 5, no. 2, pages 95–99, February2009.
[Zhao 09b] R. Zhao, Y. O. Dudin, S. D. Jenkins, C. J. Campbell, D. N. Mat-sukevich, T. A. B. Kennedy & A. Kuzmich. Long-lived quantummemory. Nat Phys, vol. 5, no. 2, pages 100–104, February 2009.