Page 1
UUNNIIVVEERRSSIITTII MMAALLAAYYSSIIAA PPAAHHAANNGG
BBOORRAANNGG PPEENNGGEESSAAHHAANN SSTTAATTUUSS TTEESSIISS♦♦♦♦
JUDUL : INVESTIGATING THE EFFECT OF GAS FLOW RATE ON THE DRAG REDUCTION PERFORMANCE IN
GAS OIL – SOLID GAS FLOW SYSTEM
SESI PENGAJIAN : 2011/2012
Saya NOR ` AQILAH BINTI NORAHZAN
(HURUF BESAR) mengaku membenarkan tesis (PSM/Sarjana/Doktor Falsafah)* ini disimpan di Perpustakaan
Universiti Malaysia Pahang dengan syarat-syarat kegunaan seperti berikut :
1. Tesis adalah hakmilik Universiti Malaysia Pahang
2. Perpustakaan Universiti Malaysia Pahang dibenarkan membuat salinan untuk tujuan
pengajian sahaja.
3. Perpustakaan dibenarkan membuat salinan tesis ini sebagai bahan pertukaran antara
institusi pengajian tinggi.
4. **Sila tandakan ( √ )
SULIT (Mengandungi maklumat yang berdarjah keselamatan
atau kepentingan Malaysia seperti yang termaktub di dalam
AKTA RAHSIA RASMI 1972)
TERHAD (Mengandungi maklumat TERHAD yang telah ditentukan
oleh organisasi/badan di mana penyelidikan dijalankan)
√ TIDAK TERHAD
Disahkan oleh
(TANDATANGAN PENULIS) (TANDATANGAN PENYELIA)
Alamat Tetap : NO. 38 TAMAN SRI BATIK, Associate Prof Dr. Hayder A. Abdul Bari
TELUK MURUH, LUMUT, Nama Penyelia
32200 LUMUT, PERAK
Tarikh : 19 JANUARY 2012 Tarikh: 19 JANUARY 2012
CATATAN : * Potong yang tidak berkenaan.
** Jika tesis ini SULIT atau TERHAD, sila lampirkan surat daripada pihak
berkuasa/organisasiberkenaan dengan menyatakan sekali sebab dan tempoh
tesis ini perlu dikelaskan sebagai SULIT atau TERHAD.
♦ Tesis dimaksudkan sebagai tesis bagi Ijazah Doktor Falsafah dan Sarjana
secara penyelidikan, atau disertasi bagi pengajian secara kerja kursus dan
penyelidikan, atau Lapuran Projek Sarjana Muda (PSM).
Page 2
INVESTIGATING THE EFFECT OF GAS FLOW RATE ON THE DRAG
REDUCTION PERFORMANCE IN GAS OIL- SOLID GAS FLOW SYSTEM
NOR`AQILAH BINTI NORAHZAN
A thesis submitted in fulfillment
of the requirements for the award of the Degree of
Bachelor of Chemical Engineering (Gas Technology)
Faculty of Chemical & Natural Resources Engineering
UNIVERSITI MALAYSIA PAHANG
JANUARY 2012
Page 3
iii
SUPERVISOR`S DECLARATION
“I hereby declare that I have read this thesis and in my opinion this thesis has fulfilled
the qualities and requirements for the award of Degree of Bachelor of Chemical
Engineering (Gas Technology)”
Signature : …………………………………….
Name of Supervisor : Associate Prof. Dr. Hayder A. Abdul Bari
Position :
Date : 19 January 2012
Page 4
iv
STUDENT`S DECLARATION
I declare that this thesis entitled “Investigating the effect of gas flow rate on the drag
reduction performance in gas oil- solid gas flow system” is the result of my own
research except as cited in references. The thesis has not been accepted for any degree
and is not concurrently submitted in candidature of any other degree.”
Signature :
Name : Nor ’ Aqilah Binti Norahzan
ID Number : KC08034
Date : 19 January 2012
Page 5
v
To my beloved Mum and Dad for always being there for me,
and my wonderful supervisor, Associate Prof. Dr. Hayder A. Abdul Bari who never
stops believing in me.
Page 6
vi
ACKNOWLEDGMENT
First and foremost, I would like to express my warmest appreciation to my
dedicated supervisor, Associate Prof. Dr. Hayder A. Abdul Bari for his continuous
enthusiasm, encouragement, words of wisdom, excellent advice and great concern
towards my work. Within the course of my research, he has given a steady and excellent
supervision and created a very friendly environment which made the research enjoyable.
My sincere appreciation also extends to all my colleagues and others who have
contributed towards my understanding and thoughts, and provided assistance at various
occasions. To all the people who are not listed but surely enrich my life while doing this
research, thank you. The experiences and knowledge I gained throughout the process of
completing this research project would prove invaluable to better equip me for the
challenges which lie ahead.
Last but definitely not the least I am grateful to all my family members,
especially Mum and Dad. I can never thank you enough for your love, and for
supporting me throughout my studies in University Malaysia Pahang (UMP).
Page 7
vii
ABSTRACT
Phenomenon on drag reduction in gas-liquid system has to be emphasized in the past
decade because of the importance in academic and industry. Drag has long been
identified as the main reason for the loss of energy in fluid transmission like pipelines
and other similar transportation channels. The main contributor to this drag is the
turbulence of the flow as well as friction against the pipe walls, which will results in
more pumping power consumption, increasing in production rates, pipelines capabilities
and faster transportation. In this study, injection of gas into the pipe flow as a drag
reducing agent was investigated. The experimental procedure also investigates the
effects of liquid flow rate, powder addition concentration and particle size of suspended
solid. The gas that used to inject in the pipelines is an air gas. Particular attention was
focused to the influence on the pressure drop due to the injection of air gas into the
horizontal 1.5 inch or 0.0381 meter pipe flow. The experimental results showed that the
drag reduction is more superior towards bigger particle sizes, higher in liquid flow rate
of diesel concentration and increasing the solid addition concentration. Percentage of
drags reduction increases by increasing the particle size. The maximum percentage of
drag reduction in the 630 µm particle size with 300ppm solid addition concentration for
9.5 m³/h liquid flow rate is 61.43 %.
Page 8
viii
ABSTRAK
Fenomena pada pengurangan seretan di dalam sistem gas-cecair telah diberi penekanan
dalam dekad yang lalu kerana kepentingan dalam akademik dan industri. Seret telah
lama dikenal pasti sebagai sebab utama untuk kehilangan tenaga dalam penghantaran
bendalir seperti saluran paip dan lain-lain saluran pengangkutan yang serupa.
Penyumbang utama kepada seretan ini adalah pergolakan aliran serta geseran terhadap
dinding paip, yang akan menyebabkan penggunaan kuasa yang lebih mengepam,
meningkatkan kadar pengeluaran, keupayaan saluran paip dan pengangkutan yang lebih
cepat. Dalam kajian ini, suntikan gas ke dalam aliran paip sebagai satu ejen
mengurangkan seretan disiasat. Prosedur eksperimen juga menyiasat kesan kadar aliran
cecair, serbuk kepekatan Selain itu, saiz zarah pepejal terampai dan tambahan dalam
kepekatan diesel. Gas yang digunakan untuk menyuntik di saluran paip gas udara.
Perhatian khusus tertumpu kepada pengaruh kepada kejatuhan tekanan akibat suntikan
gas udara ke dalam inci mendatar 1.5 atau 0.0381 meter paip aliran. Keputusan
eksperimen menunjukkan bahawa pengurangan daya seret lebih ke arah saiz zarah yang
lebih besar, lebih tinggi dalam kadar aliran cecair kepekatan diesel dan meningkatkan
kepekatan tambahan yang kukuh. Peratusan drags kenaikan pengurangan dengan
meningkatkan saiz zarah. Peratusan maksimum pengurangan heret dalam saiz 630 µm
zarah dengan kepekatan tambahan 300ppm kukuh untuk 9.5 m³ / h kadar aliran cecair
adalah 61.43%.
Page 9
ix
TABLE OF CONTENT
PAGE
SUPERVISOR`S DECLARATION iii
STUDENT`S DECLARATION iv
DEDICATION v
ACKNOWLEDGEMENT vi
ABSTRACT vii
ABSTRAK viii
TABLE OF CONTENTS ix
LIST OF TABLES xii
LIST OF FIGURS xiv
LIST OF ABBREVIATIONS xvi
LIST OF APPENDIX xvii
CHAPTER 1 INTRODUCTION
1.1 Background of Research 1
1.2 Problem Statement 5
1.3 Objectives of Study 5
1.4 Scope of Study 6
1.5 Rationale and Significant 6
CHAPTER 2 LITERATURE REVIEW
2.0 Introduction 7
2.1 Types of Fluid Flows 7
2.1.1 Laminar Flow 9
2.1.2 Turbulence Flow 10
2.2 Pressure Drop due to Friction 11
2.2.1 Principle & Theory 13
2.3 Drag Reduction 15
Page 10
x
2.3.1 Mechanism of Drag Reduction 17
2.4 Drag Reduction Agents 18
2.4.1 Polymeric Drag Reduction Agent 18
2.4.2 Surfactant Drag Reduction Agent 20
2.4.3 Fiber Drag reduction agent 21
2.5 Two phase flow drag reduction 22
CHAPTER 3 METHODOLOGY
3.0 Introduction 24
3.1 Equipments 24
3.1.1 Cylinder tank 24
3.1.2 Transporting fluid 24
3.2 Material 24
3.2.1 Preparation of sand 25
3.3 Experimental rig 26
3.4 Research Method 29
3.5 Experiment procedure 30
3.6 Experimental calculation 31
3.6.1 Percentage Drag reduction calculations 31
3.6.2 Velocity and Reynolds number calculation 31
3.7 Summary of Research Procedure 32
3.7.1 Summary of Preparation of sand particle diameter 32
3.7.2 Summary of Experimental Procedure 33
CHAPTER 4 RESULTS AND DISCUSSIONS
4.0 Injection of gas into two phase flow caused drag reduction 34
4.1 Effect of pressure drop in the different particle concentrations 34
4.2 Effects of liquid flow on the drag reduction efficiency 35
4.3 Effect of sand particle concentration 36
4.4 Effect of Reynolds numbers in addition solid particle 38
Page 11
xi
4.5 Effect between Reynolds number and percentage of drag
reduction with different particle size 40
CHAPTER 5 CONCLUSION AND RECOMMENDATIONS
5.1 Conclusion 42
5.2 Recommendation 43
REFERENCES 45
APPENDIX
A Experimental calculation 50
B Experimental data table 55
Page 12
xii
LIST OF TABLES
TABLE NO. TITLES PAGE
3.1 Diesel fuel oil properties at T = 293 K and 1 atm 25
3.2 Size of particle sand and weight 26
B.1 Detail Description of the Pipe 56
B-2.1.1 Drag Reduction Result for 71 µm with no additional
of sand concentration 57
B-2.1.2 Drag Reduction Result for 71 µm with 100ppm of
sand concentration 58
B-2.1.3 Drag Reduction Result for 71 µm with 200ppm of
sand concentration 58
B-2.1.4 Drag Reduction Result for 71 µm with 300ppm of
sand concentration 59
B-2.2.1 Drag Reduction Result for 315µm with no additional
of sand concentration 60
B-2.2.2 Drag Reduction Result for 315µm with 100ppm of
sand concentration 61
B-2.2.3 Drag Reduction Result for 315µm with 200ppm of
sand concentration 61
B-2.2.4 Drag Reduction Result for 315µm with 300ppm of
sand concentration 62
B-2.3.1 Drag Reduction Result for 630µm with no additional
of sand concentration 63
B-2.3.2 Drag Reduction Result for 630µm with 100ppm of
sand concentration 64
B-2.3.3 Drag Reduction Result for 630µm with 200ppm of
sand concentration 64
B-2.3.4 Drag Reduction Result for 630µm with 300ppm of
sand concentration 65
B-3.1 Data of pressure drop increasing with time taken
during the investigation for each additional sand
particle size diameter 66
B-4.1.1 Reynolds numbers for 71 µm of sand particle size 70
B-4.1.2 Reynolds numbers for 315 µm of sand particle size 71
Page 13
xiii
B-4.1.3 Reynolds numbers for 630 µm of sand particle size 71
B-5.1 Liquid flow rate with percentage of drag reduction 72
Page 14
xiv
LIST OF FIGURES
FIGURE NO TITLES PAGE
1.1 Types of gas injector 4
2.1 Velocity profile of laminar and turbulent flow 9
2.2 Diagram of Laminar Flow 10
2.3 Diagram of Turbulent Flow 11
2.4 Examine the x- component of the velocity, µ A
at a point A 12
2.5 Variation of the velocity component u with time at a
specified location in turbulent flow 13
2.6 Characteristic of turbulent and laminar flow in the
rough and smooth pipe with correlates to friction
factor of pipe 15
2.7 Phenomenon of drag reduction 17
3.1 Experimental rig design 28
3.2 Portable gas injector device 29
4.1 Behavior of the pressure drop influenced by different
particle sand 35
4.2 Behavior of the liquid flow rate on the drag reduction
efficiency influenced by different particle sand and
addition concentration 35
4.3.1 Relationship between percentages of drag reduction
with different sand particle concentration for size
71µm. 37
4.3.2 Relationship between percentages of drag reduction
with different sand particle concentration for size
315µm 37
4.3.3 Relationship between percentages of drag reduction
with different sand particle concentration for size
630µm 38
4.4.1 Relationship between Reynolds number and percentage
of drag reduction with different sand particle
concentration for size 71µm. 39
Page 15
xv
4.4.2 Relationship between Reynolds number and percentage
of drag reduction with different sand particle
concentration for size 315µm. 39
4.4.3 Relationship between Reynolds number and percentage
of drag reduction with different sand particle
concentration for size 630µm 40
4.5.1 Relationship between Reynolds number and percentage
of drag reduction with different sand particle
concentration for 300ppm 41
Page 16
xvi
LIST OF ABBREVIATIONS/ SYMBOLS
DRA Drag Reducing Agent
DR Drag Reduction, dimensionless
D.I Internal pipe diameter, meter
%DR Percentage Drag Reduction
m Mass, kg
ppm Parts per million
∆Pa Pressure difference after adding additives, N/m2
∆Pb Pressure difference before adding additives, N/m2
NRe Reynolds number, dimensionless
Q Volumetric flow rate, m3/hr
ρ Density, kg/m3
µ Viscosity, kg/s.m
Dp Diameter Pipe
PDRA Polymer Drag Reduction Agent
MDR Maximum Drag Reduction
Page 17
xvii
LIST OF APPENDIX
APPENDIX TITLE PAGE
A Experimental Calculation
A-1: Calculation for Required Additives 55
A-2: Calculation of Reynolds Number 56
A-3: Calculation for Drag Reduction 58
B Experimental Data Table 59
B-1: Detail Description of the Pipe 60
B-2: Flow Detail for injection of gas into the pipe 61
B-3: Flow detail for injection of gas into the pipe with pressure
drop data 70
B-4: Flow detail for injection of gas into the pipe with Reynolds
number data 74
B-5: Flow detail for injection of gas into the pipe with liquid
flow rate and percentage of drag reduction 76
Page 18
CHAPTER 1
INTRODUCTION
1.1 BACKGROUND OF STUDY
Since from the past, drag in the pipeline has been identified as the major
problem for the losses of energy during transportation. Drag or sometimes called fluid
resistance is referring to the forces that opposite to the relative motion of an object
though in the fluid dynamics. Drag happened between the fluids, and the pipe wall
causes substantial pressure drops along such pipelines as the fluid flow there though.
These energy losses can be identified through pressure drop, which will result in more
pumping power consumption.
The drag reduction phenomenon was first observed by Toms (1948) about 60
years ago. The idea of drag reduction when he studied the effect of polymer added into
a turbulent Newtonian fluid. He revealed that the addition of small amounts of polymers
in turbulent flow can produce a significant result in reducing frictional drag. Since that
time, nearly 7000 studies on drag reduction have been published.
Drag reduction serves as a typical approach to save pumping power in pipelines
or other transportation channels and equipments, particularly those which handle crude
oil and refined products. Pumping power saving corresponds to the reduction of
pressure drop in these media. Studies of the drag reduction agent have proven its ability
in reducing pressure drop.
Page 19
2
Drag Reducing Agents can be classified into three major categories such as
polymers, surfactants and suspended solids. The most effective drag reducing agent that
commonly used in industry is polymers. A few parts per million (ppm) of the additive
can greatly reduce the turbulent friction factor of fluid flow in a pipe (Toms, 1948).
There are two types of polymer, which are synthetic polymer and natural polymers.
Synthetic polymers are come from petroleum oil and meanwhile natural polymers can
be extracted from resources in nature.
Synthetic polymers such as polyethylene oxide (PEO), co- polymer (Magnafloc
1011) of polyacrylamide, carboxymethyl cellulose, polythene oxide, and sodium-
acrylate are rarely used as a drag reducing agent in turbulent flow. The results after
injections of these polymers into pipelines caused drag reduction in pressure loss;
especially at high mixture velocity by clearly change in the flow pattern (Al-Sarkhi et
al., 2001; Soleimani et al., 2004; Al-Wahaibi et al., 2007; Al-Yaari et al., 2009).
However, natural polymeric additives attracted less attention in industrial
applications but the benefits of a natural polymeric are similar to the synthetic polymers.
The explorations of newer sources of mucilage are increased with increasing in industry
demand. Currently, many researchers have discovered the potential of natural polymers
in the drag reduction phenomenon. The successful in a formulation Okra-natural
mucilage and Aloe Vera mucilage as a natural drag reduction agent gave the impressive
result and able to increase the flow rate of fluid in a pipeline at the same pressure drop
by reducing the friction drag (Hayder et al., 2011).
The second drag reducing agents are surfactants. Surfactant is a blend of surface
active agent. It works as an agent who can greatly lower the surface tension of a liquid
even though it presents in a very low concentration. The surfactant concentrations
necessary to achieve maximum drag reduction in order of a few hundred or thousand
ppm, depending on the surfactant type, Reynolds number, and temperature and flow
geometry (Andrej et al., 2010).
Page 20
3
The third drag reduction agents are suspended solid as known as fibers. Fibers in
suspension can interact and entangle even at low populations and can form bundles or
entities that behave differently from the individual fibers. According to Duffy et al.
(2002), fibers interlock at moderate concentrations to form three-dimensional structures
or networks which in liquid suspension alter the transport properties of the suspension
Another phenomenon that can be defined as the drag reduction is the injection of
gas into non- Newtonian liquid. The injection of gas with high speed into liquid metals
or slag is widely used in the pipelines industry. The injection of gas could reduce the
pressure loses in the liquid flow rates .There are some speculations that the injection of
gas can change the critical concentration of oil and water where phase inversion occurs
and that the pressure drop increase during phase inversion can become larger by
Ioannou et al. (2005).
In the single liquid cases with low mixture velocity, the pressure drop decreases
with increasing gas injection. It can decrease more at large values of the water fraction
than at smaller values at the point of phase inversion (Descamps et al., 2006). At low
superficial gas velocities the pressure drop decreases as mean velocity superficial gas
phase is increased. It also can reaches to a minimum value for the critical velocity in the
transition from laminar to turbulent flow.
The pressure gradient increases steadily after past this velocity. The drag
reduction by gas injection in Newtonian fluid is more effective than that for shear
shinning fluid when the dimensionless liquid height remains in the area of high value in
the turbulent gas-laminar liquid stratified flown (Jing-yu et al., 2009).
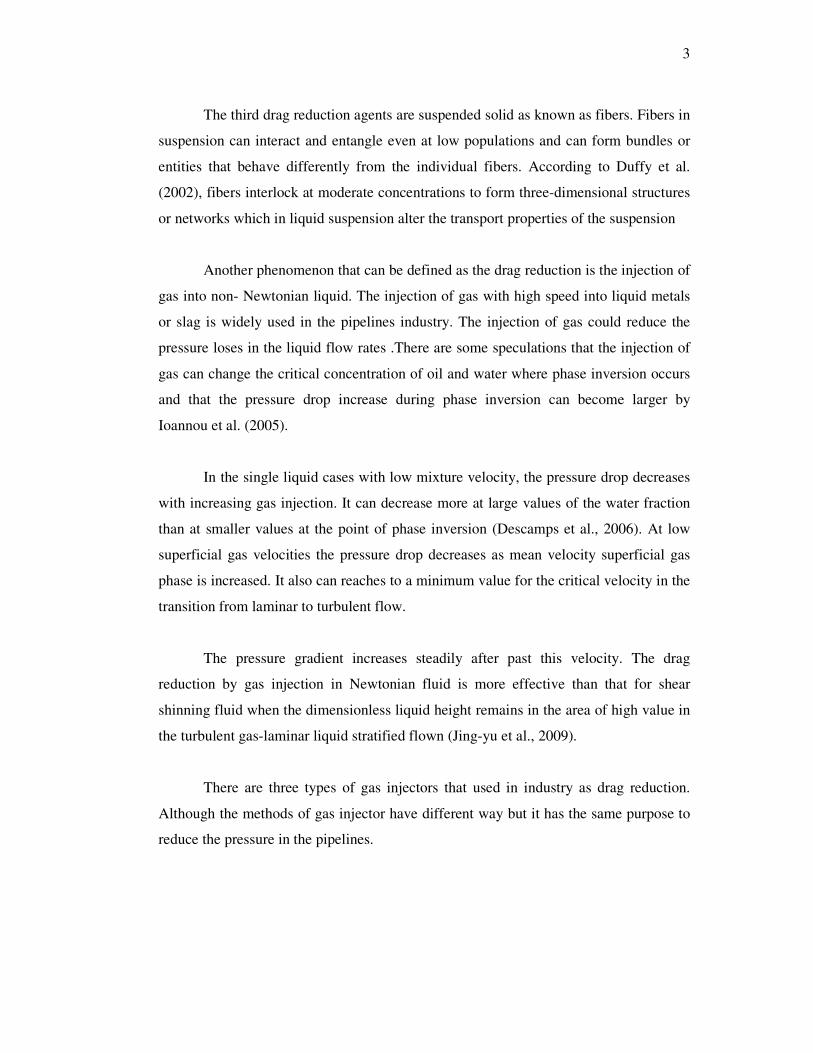
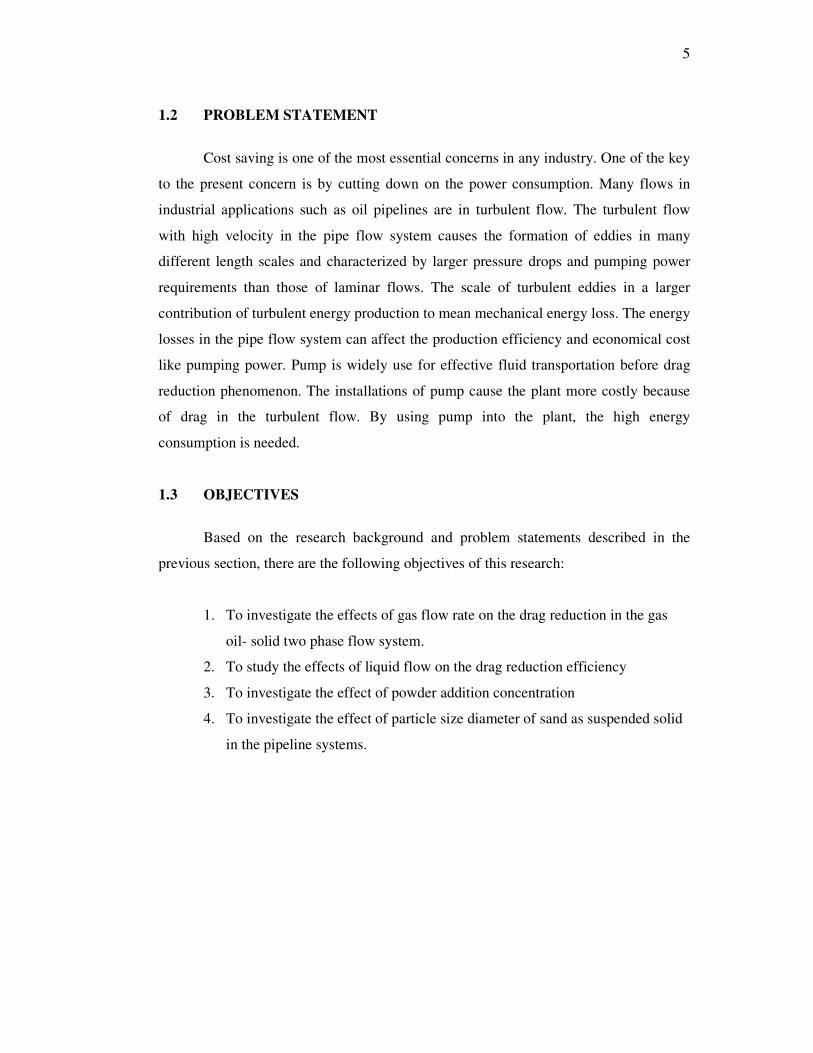
There are three types of gas injectors that used in industry as drag reduction.
Although the methods of gas injector have different way but it has the same purpose to
reduce the pressure in the pipelines.
Page 21
4
Figure 1.1: From top to bottom: nozzle injector, conical porous injector, circular porous
injector
Source: Descamps (2006)
In the present investigation, air will be injected in gas oil – solid two phase flow
in pipelines. Drag reduction performance will be investigated with different gas flow
rates due to the injection of air gas. The injection of gas can reduce pressure drop and
the pattern flow will move smoothly. The benefits when using drag reducing
phenomenon is allowing a greater production flow rate at an economical cost and
reduction of operating costs such as pumping power.
Page 22
5
1.2 PROBLEM STATEMENT
Cost saving is one of the most essential concerns in any industry. One of the key
to the present concern is by cutting down on the power consumption. Many flows in
industrial applications such as oil pipelines are in turbulent flow. The turbulent flow
with high velocity in the pipe flow system causes the formation of eddies in many
different length scales and characterized by larger pressure drops and pumping power
requirements than those of laminar flows. The scale of turbulent eddies in a larger
contribution of turbulent energy production to mean mechanical energy loss. The energy
losses in the pipe flow system can affect the production efficiency and economical cost
like pumping power. Pump is widely use for effective fluid transportation before drag
reduction phenomenon. The installations of pump cause the plant more costly because
of drag in the turbulent flow. By using pump into the plant, the high energy
consumption is needed.
1.3 OBJECTIVES
Based on the research background and problem statements described in the
previous section, there are the following objectives of this research:
1. To investigate the effects of gas flow rate on the drag reduction in the gas
oil- solid two phase flow system.
2. To study the effects of liquid flow on the drag reduction efficiency
3. To investigate the effect of powder addition concentration
4. To investigate the effect of particle size diameter of sand as suspended solid
in the pipeline systems.
Page 23
6
1.4 SCOPES OF STUDY
The following scopes have been identified in order to achieve the objectives:
1. Injection of air gas will be applied to study the influence of gas as drag
reduction performance in the flow system
2. The pressure readings of the testing section will be collected to calculate
pressure drops, followed by the percentage of drag reduction.
3. Diesel will be used as the transporting fluid in this study.
4. The addition of sand particle concentration.
5. 71 µm and 315 µm and 630 µm of particle size as suspended solid
6. Volumetric flow rate of fluid will be used to calculate the velocity and
Reynolds Number (Re) of the fluid.
1.5 RATIONALE AND SIGNIFICANCE
Drag reduction is the alternative way to reduce pumping power losses during
transportation through pipelines. So that, injecting the drag reduction would decrease
the friction pressure losses in a pipeline. The reduction of the frictional pressure during
flow can exceedingly reduce the cost of pumping power. Furthermore, power saving is
very important to save the cost in the plans. The present study focuses on injecting gas
into the gas oil – solid two phase in the pipelines that can reduce pressure loses and save
the environmental. The gas that used to inject in the pipelines is a gas air. Under some
conditions, the available quantities of gas with associated liquid could be transported
without building a new pipeline or perhaps without increasing pump horsepower.
Page 24
CHAPTER 2
LITERATURE REVIEW
Drag reduction is a term that frequently used to characterize the reduction in
friction turbulent flow through pipes resulting in an increase of fluid flow or decrease in
pressure loss. Drag reduction in turbulent flow is an important phenomenon for practical
applications in fluid transport. The friction pressures in laminar flow cannot be changed
unless the physical properties of the fluid are changed.
2.1 TYPE OF FLOW
There are three types of flow which are Laminar, Transitional and Turbulent
flow. The purpose when calculating heat transfer or pressure and head loss it is
important to know if the fluid flow is laminar, transitional or turbulent. Laminar flow
happens when dealing with small pipes and low flow velocities. Laminar flow can be
regarded as a series of liquid cylinders in the pipe. Non – laminar flow is called
turbulent flow.
Turbulent flow happens at high flow rates and with larger pipes. In turbulent
flow, eddies and wakes make the flow is unpredictable. The transitional flow actually is
a mixture of laminar and turbulent flow. This happens when the turbulent in the center
of pipe and the laminar flow near the edges. Each of these flows behaves in different
equations that predict their behavior and have different manners in terms of their
frictional energy loss while flowing in the pipelines (Witold et al., 2008).
In these cases, turbulent or laminar flow could be determined by the
dimensionless Reynolds Number. The Reynolds number is important in analyzing at
Page 25
8
any type of flow when there is substantial velocity gradient such as shear. The Reynolds
number is proportional to inertial force that divided by viscous force.
Re = ρVD
µ (2.1)
Where V is the mean velocity of the object relative to the fluid (m/s), µ is the dynamic
viscosity of the fluid (Pa·s or N·s/m² or kg/(m·s)), D is diameter of the pipe ( m)and ρ is
the density of the fluid (kg/m³) .
At high Reynolds numbers, the inertial forces, which are proportional to the
fluid density and the square of the fluid velocity, are more significant compared to
viscous forces, and therefore the viscous forces cannot inhibit the random and rapid
fluctuation of the fluid. This condition of flow is known as turbulent flow. Whereas in
low or moderate Reynolds number, the viscous forces are significant enough to restrict
the fluid fluctuation and keep the fluid under smooth ordered motion; and this is known
as laminar flow (Abulencia et al., 2009).
Critical Reynolds number, Recr is the value where the flow becomes turbulent
and this value varies for different geometries and flow conditions. The transition from
laminar to turbulent flows is also dependent on other factors; such as pipe surface
roughness, surface temperature, vibration and fluctuations in the flow. In most practical
conditions, having Reynolds number lower than 2300 is considered as laminar flow,
above 4000 is turbulent flow and in-between is transitional (Abulencia et al., 2009).
Figure 2.1 shows the velocity profile of both laminar and turbulent flow. A
laminar flow has a true parabola velocity profile, slightly pointed at the middle and
tangent to the wall of the pipe. The average velocity of a fully developed laminar flow is
about one-half of the maximum velocity flow in a pipe. In turbulent flow, the profile is
resembles a flattened parabola and the average velocity is about 0.8 times the maximum
velocity (Abulencia et al., 2009).
Page 26
9
Figure 2.1: Velocity profile of laminar and turbulent flow
Source: Cengel (2006).
2.1.1 Laminar Flow
Laminar flow sometimes known as streamline flow has motion that is very
regular and predictable. This can be seen when a water faucet is turned on low. The
flow of water in straight lines and the motion is rather smooth. The laminar flow usually
would be in the smooth flow of a viscous liquid through a tube or pipe. There are
different velocities of flow from zero at the walls to a maximum along the centerline of
the pipelines (Abulencia et al., 2009).


![[ Pekan Review ] Bridging Universiti Malaysia Pahang to ... · Bridging Universiti Malaysia Pahang to the World Community ... Dato' Sri Abdul Aziz: ... [ Pekan Review ] Bridging Universiti](https://static.documents.pub/doc/80x56/5ac62be47f8b9a12608e0327/-pekan-review-bridging-universiti-malaysia-pahang-to-universiti-malaysia.jpg)


