25
UNIVERSITI PUTRA MALAYSIA COMPETITIVENESS OF THE MALAYSIAN AND INDONESIAN PALM OIL EXPORTS CHENG CHOON HUAT FEP 2001 14
UNIVERSITI PUTRA MALAYSIA
COMPETITIVENESS OF THE MALAYSIAN AND INDONESIAN PALM OIL EXPORTS
CHENG CHOON HUAT
FEP 2001 14
COMPETITIVENESS OF THE MALAYSIAN AND INDONESIAN PALM OIL EXPORTS
By
CHENG CHOON HUAT
Thesis Submitted in Fulfilment of the Requirement for the Degree of Master of Science in the Faculty of Economics and Management
Universiti Putra Malaysia
February 2001
ii
Abstract of thesis presented to the Senate of Universiti Putra Malaysia in fulfilment of the requirement for the degree of Master of Science.
COMPETITIVENESS OF THE MALAYSIAN AND INDONESIAN PALM OIL EXPORTS
By
CHENG CROON RUAT
February 2001
Chairperson: Professor Fatimah Mohd. Arshad, Ph.D.
Faculty: Economics and Management
Indonesia's emergence in the palm oil trade could pose a strong threat to the
current competitive advantage that Malaysia is enjoying as Indonesia has large land
resources and an abundant supply of cheap labour. This study intends to evaluate the
Malaysian and Indonesian palm oil exports perfonnances in the last two decades and to
identify the factors contributing to the competitiveness of the exports. The
competitiveness of the Malaysian and Indonesian palm oil exports are measured using
economic indicators like Revealed Comparative Advantage (RCA) and Constant Market
Share (CMS) analysis ; while the potential export markets are ascertained through Shift-
Share technique.
This study utilises annual data from 1 987 to 1 998. The twelve year period is
decomposed into three sub periods with each period contains the four year average.
Period I covers 1 987-90, Period II covers 1 991 -94 and Period III covers 1995-98 for
iii
RCA and CMS analyses. The Shift-Share calculations involve only two time periods, that
are Period I (1987 -92) and Period IT (1993-98).
The results of RCA clearly show that the Malaysian palm oil export still
maintains strong comparative advantage. This is mainly due to the low level import of
palm oil. However, Malaysia shows a declining trend in Export Performance Ratio
throughout the periods of the study due to the declining share in world's palm oil export.
In the case of Indonesia, the RCA calculations show an increasing strength of
comparative advantage, which is attributed to the increasing palm oil export. CMS results
suggest that export gains of palm oil for both countries are mainly attributed to the size of
the market effect. Both countries show negative distribution effect, due to the
concentration of exports to low growth importing countries. The eMS analysis also
demonstrates that the competitiveness effect has contributed to the palm oil export
growth of Indonesia. On the contrary, Malaysian competitiveness effect is negative
between Periods I and II, Periods I and III, which is attributed to the reduction in the
Malaysia's share in the world export market. The Shift-Share analysis suggests that the
potential markets for palm oil export expansion for the two countries are almost similar,
covering China, Pakistan and India. However, Malaysia has a better opportunity to
increase her export to the EU countries.
From the calculations, the study concludes that Indonesia shows a better
competitiveness in the palm oil exports.
Abstrak tesis yang dikemukakan kepada Senat Universiti Putra Malaysia sebagai memenuhi keperluan untuk ijazah Master Sains.
DA YA SAING MALAYSIA DAN INDONESIA DALAM EKSPORT MINYAK KELAPA SA WIT
Oleh
CHENG CHOON HUAT
Februari 2001
Pengerusi: Profesor Fatimah Mohd. Arshad, Ph.D.
Fakllllti: Ekonomi dan Pen gurus an
iv
Kehadiran Indonesia dalam perdagangan minyat kelapa sawit boleh mengancam
kedudukan Malaysia yang menikmati kelebihan daya saing. Ini adalah kerana Indonesia
mempunyai sumber tanah luas dan tenaga buruh yang murah. Kajian ini cuba menilai
prestasi eksport minyak kelapa sawit bagi Malaysia dan Indonesia dalam dua dekad yang
lepas, dan mengenalpasti faktor yang menyumbang kepada daya saing eksport. Daya
saing eksport min yak kelapa sawit bagi Malaysia dan Indonesia dinilai dengan
menggunakan petunjuk ekonomi seperti Kelebihan Berbanding Ternyata (KBT) dan Syer
Pasaran Malar (SPM); manakala pasaran eksport potensi dikenalpasti melalui teknik
Anjakan-Syer.
Kajian ini menggunakan data tahunan dari 1987 hingga 1998. Tempoh dua belas
tahun ini dibahagikan kepada tiga tempoh yang mana setiap tempoh merangkumi purata
empat tahun. Tempoh I merangkumi 1 987-90, Tempoh II merangkumi 1 99 1 -94 and

v
Tempoh III merangkumi 1 995-98 bagi analisis KBT and SPM. Pengiraan Anjakan-Syer
hanya melibatkan dua tempoh sahaja, iaitu Tempoh I ( 1 987-92) dan Tempoh II ( 1 993-98).
Keputusan bagi KBT dengan nyata menunjukkan eksport minyak kelapa sawit
bagi Malaysia masih mempunyai kelebihan daya saing yang kuat. Ini disebabkan
temtamanya oleh paras import minyak kelapa sawit yang rendah. Walau bagaimanapun,
Malaysia menunjukkan kecenderungan menu run dalam Nisbah Prestasi Eksport
sepanjang tempoh kajian disebabkan oleh penurunan dalam syer eksport minyak kelapa
sawit dunia. Bagi Indonesia pula, pengiraan KBT menunjukkan kekuatan kelebihan daya
saing yang meningkat, yang mana disebabkan o]eh eksport min yak kelapa sawit yang
meningkat. Keputusan SPM menunjukkan keuntungan eksport minyak kelapa sawit bagi
kedua-dua negara disebabkan terutamanya oleh kesan saiz pasaran. Pasangan negara ini
menunjukkan kesan agihan yang negatif, akibat penumpuan eksport ke negara import
yang mempunyai pertumbuhan rendah. Analisis SPM juga menunjukkan yang kesan
saingan telah menyumbang kepada pertumbuhan eksport min yak kelapa sawit bagi
Indonesia. Sebaliknya, kesan saingan bagi Malaysia adalah negatif an tara Tempoh I dan
II, Tempoh I dan III disebabkan oleh penurunan syer Malaysia dalam pasaran export
dunia. Analisis Anjakan-Syer menggambarkan pasaran minyak kelapa sawit yang
berpotensi bagi Malaysia dan Indonesia adalah hampir serupa, merangkumi Cina,
Pakistan dan India. Walau bagaimana pun, Malaysia mempunyai peluang yang lebih baik
untuk meningkatkan eksportnya ke negara-negara EU.
Daripada pengiraan, kaj ian ini merumuskan bahawa Indonesia lebih berdaya saing
dalam eksport minyak kelapa sawit.
VI
ACKNOWLEDGEMENTS
This study would not have been possible without the advice, contribution and
moral support of several individuals.
First and foremost, I wish to express my gratitude to my supervisory committee:
chairperson Professor Dr. Fatimah Mohd. Arshad, for her guidance, suggestions and
support throughout the preparation of this thesis. From her, I learnt to be independent and
to think analytically. Professor Dr. Mad Nasir Shamsudin who is ever helpful and whose
constructive criticisms and suggestions helped in improving this thesis. I would like to
take this opportunity to thank them for their financial help in the form of Research
Assistantship. I would also like to thank En. Ismail Abdul Latif for his precious advice,
guidance and help in the completion of the thesis.
My appreciation is also extended to all my friends and coursemates who had
rendered their help in one way or another towards the completion of this thesis.
I also owe a great deal of appreciation to all the officers and staffs of Universiti
Putra Malaysia, Universiti Kebangsaan Malaysia, Universiti Malaya, Library of MPOB
and Bank Negara Malaysia during my search for information.
Last but not least, my deepest gratitude to my family who has been very
suppOltive and understanding throughout my years at Universiti Putra Malaysia. I would
like to record my appreciation for their sacrifices and love.
vii
I certify that an Examination Committee met on 2 February 2001 to conduct the final examination of Cheng Choon Huat on his Master of Science thesis entitled "Competitiveness of the Malaysian and Indonesian Palm Oil Exports" in accordance with Universiti Pertanian Malaysia (Higher Degree) Act 1 980 and Universiti Pertanian Malaysia (Higher Degree) Regulations 1 98 1 . The Committee recommends that the candidate be awarded the relevant degree. Members of the Examination Committee are as follows:
MOHAMMED YUSOFF, Ph.D. Professor Faculty of Economics and Management Universiti Putra Malaysia (Chairman)
FATIMAH MOHAMED ARSHAD, Ph.D. Professor Faculty of Economics and Management Universiti Putra Malaysia (Member)
MAD NASIR SHAMSUDIN, Ph.D. Professor Faculty of Agriculture Universiti Putra Malaysia (Member)
ISMAIL ABD. LATIF, M. S . Faculty of Agriculture Universiti Putra Malaysia (Member)
ALI MOHA YIDIN, Ph.D. ProfessorlDeputy Dean of Graduate School , Universiti Putra Malaysia
Date: 02 APR ZOOl

VlII
This thesis submitted to the Senate of Universiti Putra Malaysia has been accepted as fulfilment of the requirement for the degree of Master of Science.
MOHD. GHAZALI MOHAYIDIN, Ph.D Professor Deputy Dean of Graduate School Universiti Putra Malaysia
Date:
IX
DECLARATION
I hereby declare that the thesis is based on my original work except for quotations and citations, which have been duly acknowledged. I also declare that it has not been previously or concurrently submitted for any other degree at UPM or other institutions.
Candidate. 1 Name: CHENG CHOON HUAT Date: J.Jl/o 3/ �o I
TABLE OF CONTENTS
ABSTRACT ABSTRAK ACKNOWLEDGEMENTS APPROVAL SHEETS DECLARATION FORM TABLE OF CONTENTS LIST OF TABLES LIST OF FIGURES LIST OF ABBREVIATIONS
CHAPTER
1 INTRODUCTION 1 . 1 Background of World Fats and Oils Market
1 . 1 . 1 World Production, Consumption and Trade of Palm Oil 1 . 1 . 1 . 1 Production 1 . 1 . 1 .2 Consumption and Import 1 . 1 . 1 .3 Export
1 .2 Background of Malaysian Palm Oil Industry 1 .2. 1 Planted Area 1 .2.2 Production 1 .2.3 Exports
1 .3 Background of Indonesian Palm Oil Industry 1 .3 . 1 Planted Area 1 .3 .2 Production 1 .3 .3 Exports
1 .4 Prices 1 .5 Problem Statement 1 .6 Objectives of the Study 1.7 Significance of the Study 1.8 Organisation of the Study
2 LITERATURE REVIEW 2. 1 Definitions and Measurement of Competitiveness
2. 1 . 1 Neo-classical Economics 2. 1 .2 Industrial Organisation Economics 2. 1 .3 Strategic Management
2.2 Conceptual Framework for Assessing Competitiveness 2.3 Empirical Evidence
2.3 . 1 Revealed Comparative Advantage 2.3.2 Constant Market Share
Page
ii iv VI
vii ix x
xii xiv xv
1 1 4 4 6
1 0 1 1 1 1 1 3 1 5 1 8 1 8 1 9 2 1 24 28 29 29 30
3 1 3 1 32 34 35 37 38 38 43
x
xi
2.3 .3 Shift-Share Technique 58
3 METHODOLOGY 64 3 . 1 Revealed Comparative Advantage 64
3. 1 . 1 Export Performance Ratio 64 3 . 1 .2 Net ExportlTotal Trade Ratio 66
3 .2 Constant Market Share 66 3.2. 1 Model Specification 68 3.2. 1 . 1 World Trade Effect 68 3.2. 1 .2 Market Distribution Effect 70 3.2. 1 .3 Competitiveness Effect 71
3.3 Shift-Share Technique 73 3.3 .1 Computation Technique 74 3 .3. 1 . 1 Actual Change in Market' s Import 74 3 .3 . 1 .2 Total Growth Rate of Market' s Import 75 3 .3 . 1 .3 Expected Value of Market' s Import 76 3 .3 . 1 .4 Expected Change in Market' s Import 76 3.3 . 1 .5 Net Shift in Market's Import 76 3 .3 . 1 .6 Total Absolute Net Shift 78 3 .3 . 1 .7 Percentage Net Shift in Market's Import 78
3.4 Data 79 3.5 Time Frame Employed 79
4 RESULTS AND DISCUSSION 81 4. 1 Revealed Comparative Advantage 81
4. 1 . 1 Export Performance Ratio 82 4. 1 .2 Net Exportffotal Trade Ratio 83
4.2 Constant Market Share 85 4.3 Shift-Share Analysis 92
5 SUMMARY AND POLICY IMPLICATIONS 96 5 . 1 Summary of Findings 96 5.2 Policy Implications 98 5 .3 Limitation of the Study 1 01
BffiLIOGRAPHY 102 APPENDICES 109 BIODATA OF AUTHOR 120
XII
LIST OF TABLES
Tabile Title Page
1 . 1 Oils and Fats- Production and Consumption, 1 994 & 1998 ('000 tonnes)
1 .2 Prices of Selected Oils and Fats, 1 980 - 1 999 (USD/tonne) 2
1 .3 World Major Producers of Palm Oil, 1 980- 1 998 ('000 tonnes) 5
1 .4 World Major Consumers of Palm Oil, 1 980- 1 998 ('000 tonnes) 7
1 .5 World Major Importers of Palm Oil, 1 980- 1998 ('000 tonnes) 8
1 .6 World Major Exporters of Palm Oil, 1 980- 1998 ('000 tonnes) 1 1
1 .7 Malaysia: Distribution of Oil Palm Planted Area by Category, 1 980- 1 998 (hectares) 12
1 .8 Malaysia: Palm Oil Production and Growth, 1 979- 1998 14
1 .9 Malaysia: CPO Production by Category of Holdings, 1 980- 1999 ('000 tonnes) 1 5
1 . 1 0 Malaysia: Palm Oil Exports and Growth, 1 979- 1 998 1 6
1 . 1 1 Malaysia: Major Palm Oil Export Destinations, 1 980 - 1 998 (tonnes) 1 7
1 . 1 2 Indonesia: Distribution of Oil Palm Planted Area by Category, 1 9 1 980- 1998 ('000 hectares)
1 . 1 3 Indonesia: Palm Oil Production and Growth, 1 979- 1 998 20
1 . 14 Indonesia: FFB Production by Category of Holdings, 1 980- 1998 21 ('000 tonnes)
1 . 1 5 Indonesia: Palm Oil Exports and Growth, 1 979- 1 998 22
1 . 1 6 Indonesia: Major Palm Oil Export Destinations, 1 985 - 1 998 ('000 tonnes) 23
1 . 1 7 Correlation between Major Oils and Fats Prices 25
XIII
4. 1 Malaysia: Export Performance Ratios for Palm Oil between Three Sub-Periods 82
4.2 Indonesia: Export Performance Ratios for Palm Oil between Three Sub-Periods 83
4.3 Malaysia: Net ExportITotal Trade Ratio for Palm Oil between Three Sub-Periods 84
4.4 Indonesia: Net ExportITotal Trade Ratio for Palm Oil between Three Sub-Periods 84
4.5 Decomposition of Malaysia's Palm Oil Export GainlLoss between Three Sub-Periods 90
4.6 Decomposition of Indonesia's Palm Oil Export GainlLoss between Three Sub-Periods 9 1
4.7 Malaysia: Shift-Share Analysis of Palm Oil Exports between Two Sub-Periods, 1987-92 and 1993-98 93
4.8 Indonesia: Shift-Share Analysis of Palm Oil Exports between Two Sub-Periods, 1987-92 and 1993-98 94
A l Malaysia and World: Export of Palm Oil, 1987- 1998 (Tonnes) 1 1 0
A2 Malaysia and World: Total Export, 1987- 1998 (Million USD) 1 1 0
A3 Indonesia and World: Export of Palm Oil, 1987- 1998 (Tonnes) I I I
A4 Indonesia and World: Total Export, 1 987- 1998 (Million USD) 1 1 1
A5 Malaysia: Import and Export of Palm Oil, 1 987- 1998 (Tonnes) 1 1 2
A6 Indonesia: Import and Export of Palm Oil, 1987- 1998 (Tonnes) 112
A7 Malaysia's Palm Oil Market Share, 1 987-90, 1 99 1 -94, 1995-98 1 1 3
A8 Indonesia's Palm Oil Market Share, 1987-90, 1991-94, 1 995-98 114
A9 Malaysia's Export of Palm Oil by Destination, 1988- 1998 (Tonnes) 1 15
A10 Indonesia's Export of Palm Oil by Destination, 1988- 1998 (Tonnes) 1 1 6
LIST OF FIGURES
Figure Title
1 . 1 Average Prices of Three Groups of Fats and Oils, 1 980 - 1999 CUSD/tonne)
1 .2 Relationship between Crude Palm Oil and Soybean Oil Prices, 1980-1 999 (USD/tonne)
xiv
Page
3
27
AFTA
ASEAN
BIRO
CB
CIF
CIS
CMEA
CMS
CPO
CWAD
CWRS
EEC
EU
FELCRA
FELDA
FOB
HAD
HRS
HRVv
IAE
lIT
IMF
LIST OF ABBREVIATIONS
= ASEAN Free Trade Area
= Association of South-East Asian Nation
= Business Intelligence Report
= Caribbean Basin
= Cost, Insurance and Freight
= Commonwealth of Independent States
= Common Market Exporting Association
= Constant Market Share
= Crude Palm Oil
= Canadian Western Amber Durum
= Canadian Western Red Spring
= European Economic Community
= European Union
= Federal Land Consolidation and Rehabilitation Authority
= Federal Land Development Authority
= Free on Board
= Hard Amber Durum
= Hard Red Spring
= Hard Red Winter
= Industrially Advanced Economics
= Intra-Industry Trade
= International Monetary Fund
xv
LDC
MPOB
MPOPC
NA]�TA
NES
NW
OECD
PIR
PO CPA
RCA
RISDA
R&D
SCP
SITe
TQM
UK
UNIDO
US
USSR
WTO
XRCA
= Less Developed Country
= Malaysian Palm Oil Board
= Malaysian Palm Oil Promotion Council
= North American Free Trade Area
= Nucleus Estate Smallholders
= North-West
= Organisation for Economic Cooperation and Development
= Pekebunan Inti Rakyat
= Palm Oil Credit Payment Arrangement
= Revealed Comparative Advantage
= Rubber Industry Smallholders Development Authority
= Research and Development
= Structure, Conduct and Performance
= Standard International Trade Classification
= Total Quality Management
= United Kingdom
= United Nation International Development Organisation
= United State of America
= Union of Soviet Socialist Republics
= World Trade Organisation
= Export Index of Revealed Comparative Advantage
xvi
CHAPTER 1
INTRODUCTION
1.1 Background of World Fats and Oils Market
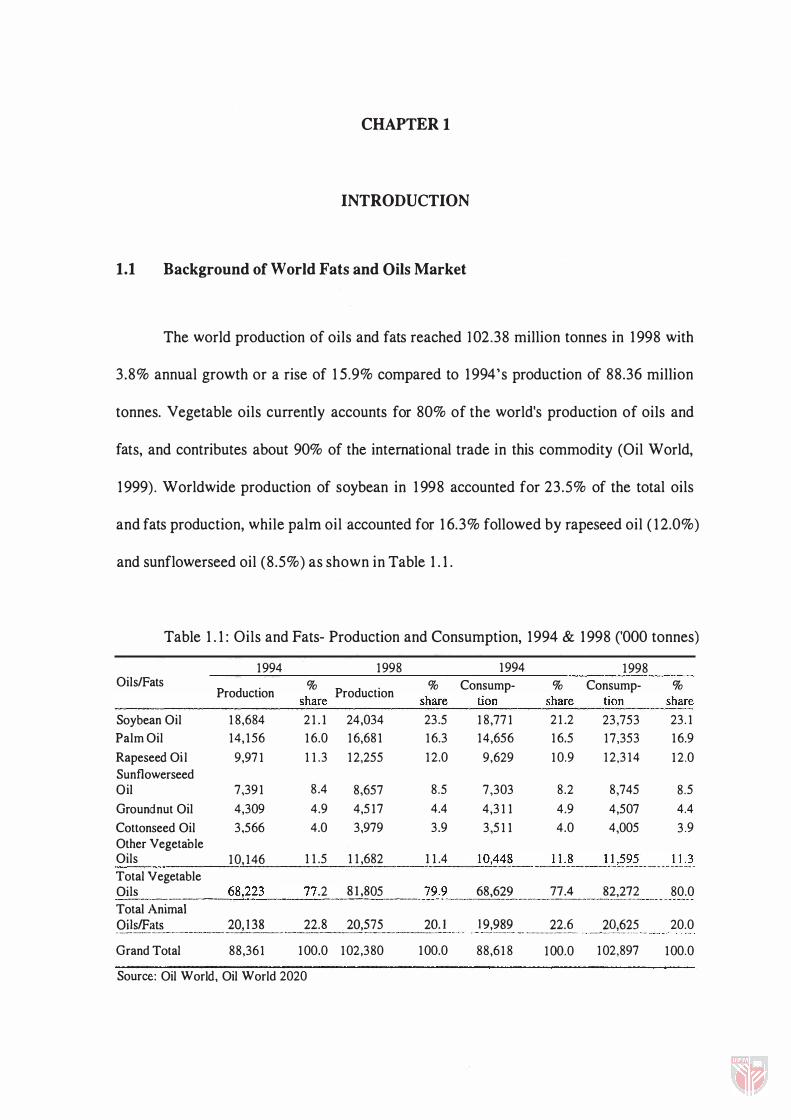
The world production of oils and fats reached 102.38 million tonnes in 1 998 with
3.8% annual growth or a rise of 1 5 .9% compared to 1 994's production of 88.36 million
tonnes. Vegetable oils currently accounts for 80% of the world's production of oils and
fats, and contributes about 90% of the international trade in this commodity (Oil World,
1 999) . Worldwide production of soybean in 1 998 accounted for 23.5% of the total oils
and fats production, while palm oil accounted for 1 6.3% followed by rapeseed oil ( 1 2.0%)
and sunflowerseed oil (8.5%) as shown in Table 1 . 1 .
Table 1 . 1 : Oils and Fats- Production and Consumption, 1994 & 1998 ('000 tonnes)
1994 1998 1994 1998 OilslFats % % Consump- % Consump- % Production h Production s are share tion share tion share
----------------��----------�----��----��---
Soybean Oil Palm Oil Rapeseed Oil Sunflowerseed Oil Groundnut Oil Cottonseed Oil Other Vegetable
18,684 14,156
9,971
7,391 4,309 3,566
Oils 10,146 Total Vegetable
21.1 24,034 16.0 16,681 11.3 12,255
8.4 8,657 4.9 4,517 4.0 3,979
11.5 11,682
23.5 16.3 12.0
8.5 4.4 3.9
11.4
18,771 14,656
9,629
7,303 4,311 3,511
21.2 16.5 10.9
8.2 4.9 4.0
23,753 17,353 12,314
8,745 4,507 4,005
23.1 16.9 12.0
8.5 4.4 3.9
gj}� . .... __ . __ . ___ .. ____ �8,223 ._ .. _J7 .2_ . .. _ ... ��05. __ ._._ . . __ ... ?.�:.� . .. .. ...... �!.��2 .. ....... . _ . .?1.:.! ........... ?���??... 80.0
Total Animal Qi!�.I.f..:���........ . . . ...... __ ?Q!.}.��_......... ....._.��:_s._ .. ... ..... �92?2?_._ .. . . _._ . ... �Q· I Grand Total 88,361 100.0 102,380 100.0
Source: Oil World, Oil World 2020
I?!??? .. ................. ��:.�.... . ....... �9A�? .... . 88,618 100.0 102,897
20.0
100.0
2
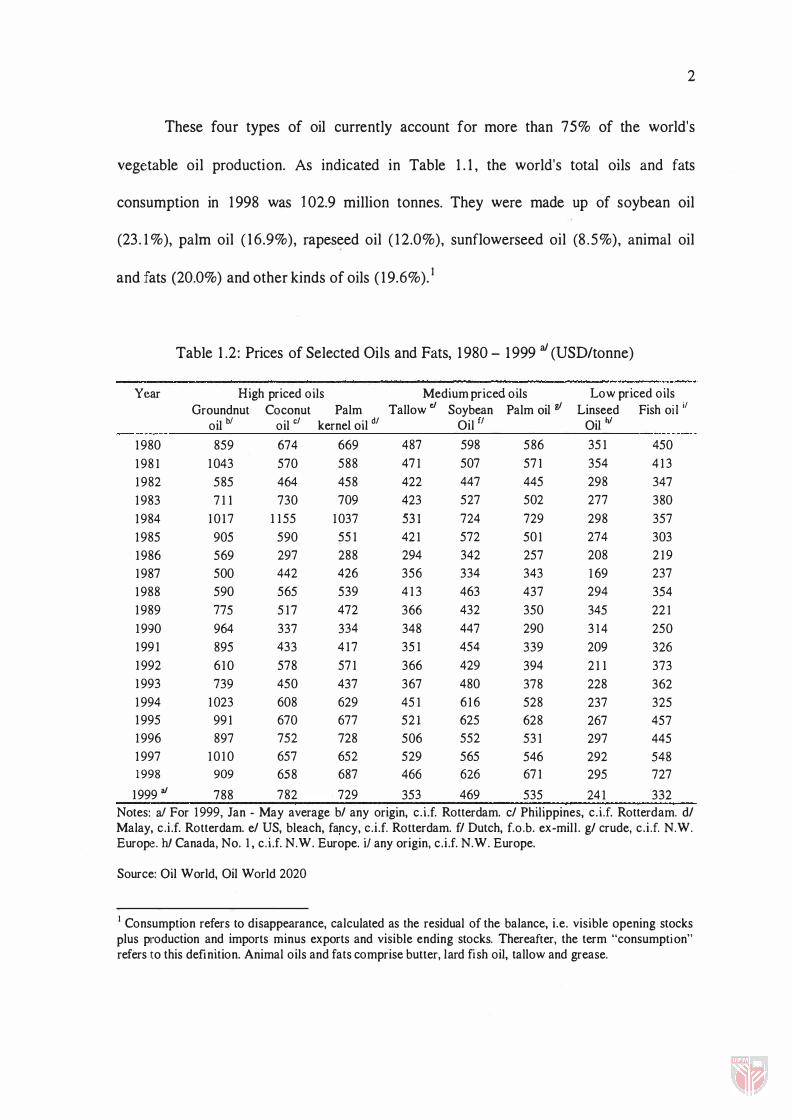
These four types of oil currently account for more than 75% of the world's
vegetable oil production. As indicated in Table 1 . 1 , the world's total oils and fats
consumption in 1 998 was 102.9 million tonnes. They were made up of soybean oil
(23 . 1 %), palm oil ( 16.9%), rapeseed oil ( 1 2.0%), sunflowerseed oil (8 .5%), animal oil
and fats (20.0%) and other kinds of oils ( 1 9.6%).1
Table 1 .2 : Prices of Selected Oils and Fats, 1 980 - 1999 aJ (USD/tonne)
Yt�ar High priced oils Medium priced oils Low priced oils
1980 1981 1982 1983 1984 1985 1986 1987 1988 1989 1990 1991 1992 1993 1994 1995 1996 1997 1998
1999 at
Groundnut oil hi
859 1043
585 711
1017 905 569 500 590 775 964 895 610 739
1023 991 897
1010 909 788
Coconut oil cl
674 570 464 730
1155 590 297 442 565 517 337 433 578 450 608 670 752 657 658
782
Palm kernel oil dl
669 588 458 709
1037 551 288 426 539 472 334 417 571 437 629 677 728 652 687
729
Tallowe/
487 471 422 423 531 421 294 356 413 366 348 351 366 367 451 521 506 529 466
353
Soybean Oil fl
598 507 447 527 724 572 342 334 463 432 447 454 429 480 616 625 552 565 626
469
Palm oil gI
586 571 445 502 729 501 257 343 437 350 290 339 394 378 528 628 531 546 671
535
Linseed Oil hi
351 354 298 277 298 274 208 169 294 345 314 209 211 228 237 267 297 292 295
241
Fish oil il
450 413 347 380 357 303 219 237 354 221 250 326 373 362 325 457 445 548 727
332 Notes: aI For 1999, Jan - May average bl any origin, c.i.f. Rotterdam. cl Philippines, c.i .f. Rotterdam. dl Malay, c.i .f. Rotterdam. el US, bleach, fancy, c.i .f. Rotterdam. fl Dutch, f.o.b. ex-mill . gl crude, c.i .f. N.W. Europe. hi Canada, No. 1, c.i .f. N.W. Europe. iJ any origin, c.i .f. N.W. Europe.
Source: Oil World, Oil World 2020
I Consumption refers to disappearance, calculated as the residual of the balance, i.e. visible opening stocks plus production and imports minus exports and visible ending stocks. Thereafter, the term "consumption" refers to this definition. Animal oils and fats comprise butter, lard fish oil, tallow and grease.
3
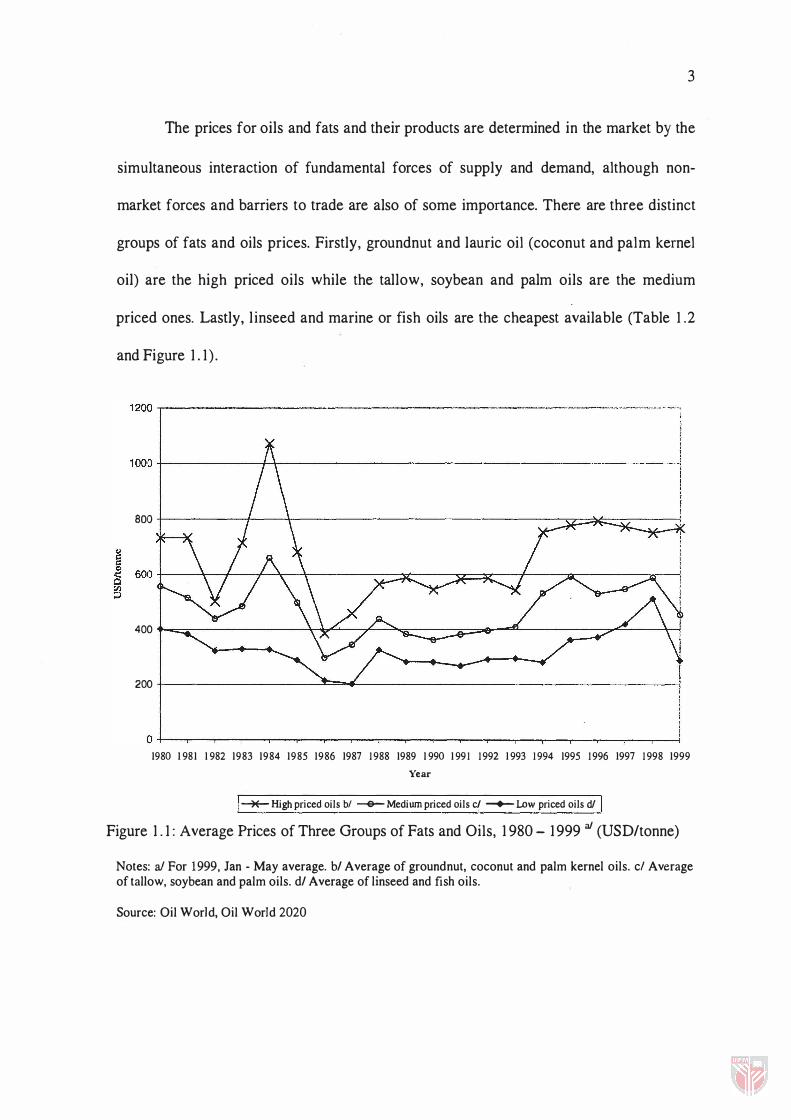
The prices for oils and fats and their products are determined in the market by the
simultaneous interaction of fundamental forces of supply and demand, although non-
market forces and barriers to trade are also of some importance. There are three distinct
groups of fats and oils prices. Firstly, groundnut and lauric oil (coconut and palm kernel
oil) are the high priced oils while the tallow, soybean and palm oils are the medium
priced ones. Lastly, l inseed and marine or fish oils are the cheapest available (Table 1 .2
and Figure 1 . 1 ) .
1200�----------------------------------------------------·--·-·---,,······�
1000+-----------��------------------------------------------�
aoo t--------r--ir-------------------------------s;z::;::;*::::.:::;v-----j
400 +-=-------���_r-�._---=:;;;;;;E..._"""'-----------'7""�-_\_-!
200 -1----------------'= ...... --------------------------1
()+-�--�--r__T--�--r-�--���_r--��--�--T_�--�--��-� 1980 1 981 1 982 1983 1984 1985 1986 1987 1988 1989 1 990 1991 1992 1993 1994 1995 1996 1997 1998 1999
Year
� High priced oils bl -e- Medium priced oils cl -+- Low priced oils dI
Figure 1 . 1 : Average Prices of Three Groups of Fats and Oils, 1 980 - 1999 at (USD/tonne)
Notes: aI For 1999, Jan - May average. bl Average of ground nut, coconut and palm kernel oils. c/ Average of tallow, soybean and palm oils. dl Average of linseed and fish oils.
Source: Oil W orid, Oil W orid 2020
1.1.1 World Production, Consumption and Trade of Palm Oil
4
Palm oil is one of the major sources of supply in the world market for oils and fats.
Palm oil has to compete in a market containing some thirteen principal vegetable oils and
oilseeds, two types of marine oils and three categories of animal fats. These oils and fats
are used for both edible and non-edible purposes. Palm oil is the second most important
oil in the market after soybean oil, and has maintained its contribution of around 16- 1 8%
to total world production for the period of 1994 to 1 998.2
1.1.1.1 Production
Crude palm oil (CPO) is one of the important commodities in the world trade.
According to Oil World 2020, the world production of oil and fats reached 102.38 million
tonnes in 1998. Of the amount, 1 6.3% ( 16.68 million tonnes) was from the production of
palm oil. The palm oil production in 1998 plummeted 6.5% compared to the 17.84
million tonnes in the year 1 997. This fall was due to the drought in most part of the world,
particularly in Malaysia and Indonesia, the world's biggest producers of palm oil.
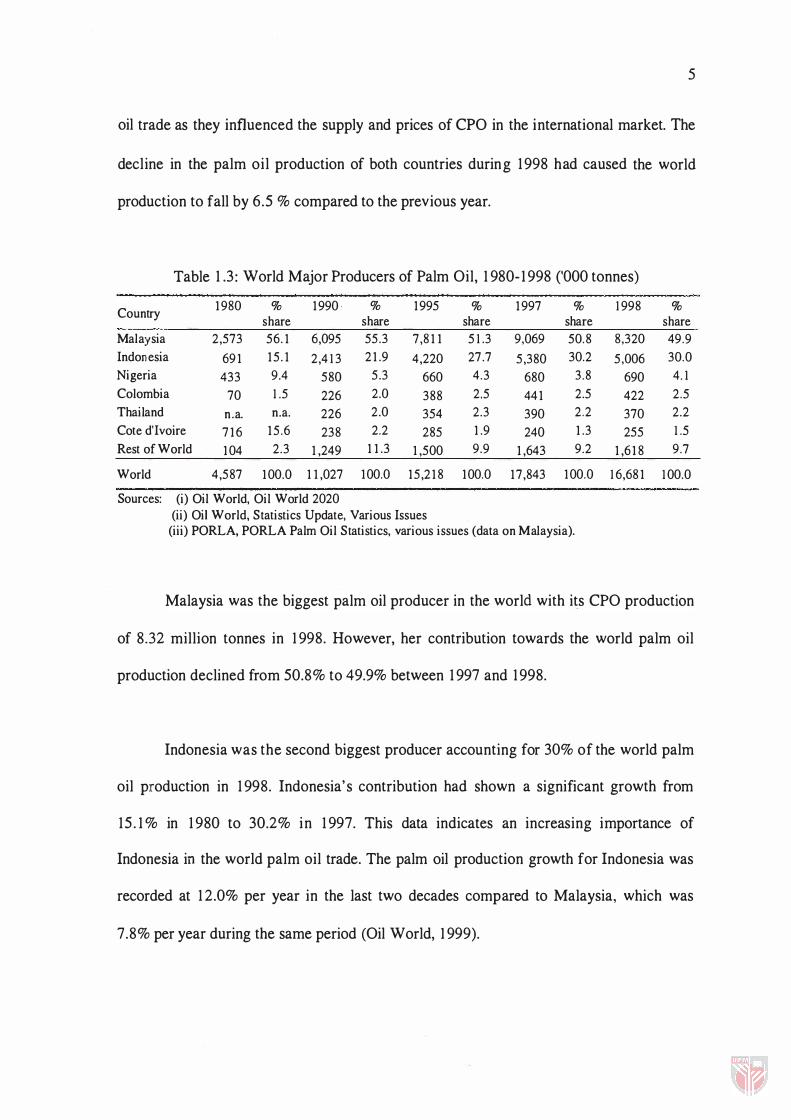
The top five crude palm oil (CPO) producers (Malaysia, Indonesia, Nigeria
Colombia, and Thailand) contributed 14.80 million tonnes or 88.7% of the world
production in 1 998 (Table 1 .3). Both Malaysia and Indonesia accounted for about 80% of
the world production. Hence, both countries are major market players in the world palm
2 Palm oil refers to crude and processed palm oils (not including palm kernel oil). Thereafter, the term "palm oil" refers to this definition.
5
oil trade as they influenced the supply and prices of CPO in the international market. The
decline in the palm oil production of both countries during 1 998 had caused the world
production to fall by 6.5 % compared to the previous year.
Table 1 .3 : World Major Producers of Palm Oil, 1 980- 1 998 ('000 tonnes)
Country 1980 % 1990· % 1995 % 1997 % 1998 % share share share share share
Malaysia 2,573 56.1 6,095 55.3 7,811 51.3 9,069 50.8 8,320 49.9 Indonesia 691 15.1 2,413 21.9 4,220 27.7 5,380 30.2 5,006 30.0 Nigeria 433 9.4 580 5.3 660 4.3 680 3.8 690 4.1 Colombia 70 1.5 226 2.0 388 2.5 441 2.5 422 2.5 Thailand n .a. n.a. 226 2.0 354 2.3 390 2.2 370 2.2 Cote d'Ivoire 716 15.6 238 2.2 285 1.9 240 1.3 255 1.5 Rest of World 104 2.3 1,249 11.3 1,500 9.9 1,643 9.2 1,618 9.7
World 4,587 100.0 11,027 100.0 15,218 100.0 17,843 100.0 16,681 100.0
Sources: (i) Oil World, Oil World 2020 (ii) Oil World, Statistics Update, Various Issues
(iii) PORLA, PORLA Palm Oil Statistics, various issues (data on Malaysia).
Malaysia was the biggest palm oil producer in the world with its CPO production
of 8.32 million tonnes in 1 998. However, her contribution towards the world palm oil
production declined from 50.8% to 49.9% between 1 997 and 1 998.
Indonesia was the second biggest producer accounting for 30% of the world palm
oil production in 1 998. Indonesia's contribution had shown a significant growth from
15 . 1 % in 1 980 to 30.2% in 1 997. This data indicates an increasing importance of
Indonesia in the world palm oil trade. The palm oil production growth for Indonesia was
recorded at 1 2.0% per year in the last two decades compared to Malaysia, which was
7.8% per year during the same period (Oil World, 1 999).
6
Production of CPO in Nigeria reached 690,000 tonnes in 1 998. The country's
CPO production growth however is relatively low, i .e. it grew at 3 .5% per year between
1979 and 1 998 (Oil World, 1999). Nigeria's share of the world production plummeted
from 9.4% ( 1 980) to 4 . 1 % ( 1 998). The country' s CPO production was utilised for
domestic consumption. Similarly, about all of the 370,000 tonnes of CPO produced by
Thailand was channelled to domestic consumption. Thailand's contribution to the world
production was considered small, i .e. it accounted for about 2.2%. Columbia, which
produced 422,000 tonnes of CPO, exported about 1 7% of its domestic production while
the remaining was for domestic consumption.
1.1.1.2 Consumption and Import
The world consumption of oils and fats reached 102.90 million tonnes in 1 998, of
which palm oil accounted for about 1 6.9%. During the last 20 years, the palm oil
consumption growth was registered at 8 .4% per year (Oil World, 1 999). The
consumption level in 1 998 was higher than the production, reaching 17 .35 million tonnes
compared to 1 6.68 million tonnes produced in the same year. In other words, it rose
355.7% compared to the consumption level in 1979. which was only 3.8 1 million tonnes.
Palm oil world consumption reached its peak in 1 997 with a total of 1 7.74 million tonnes.
The high level of palm oil consumption was caused by the high demand in the
United States and Latin America, which are also the biggest soybean oil producers. The
7
relatively cheaper palm oil price compared to the soybean was one of the major factors
that encouraged the increase in demand for this product.
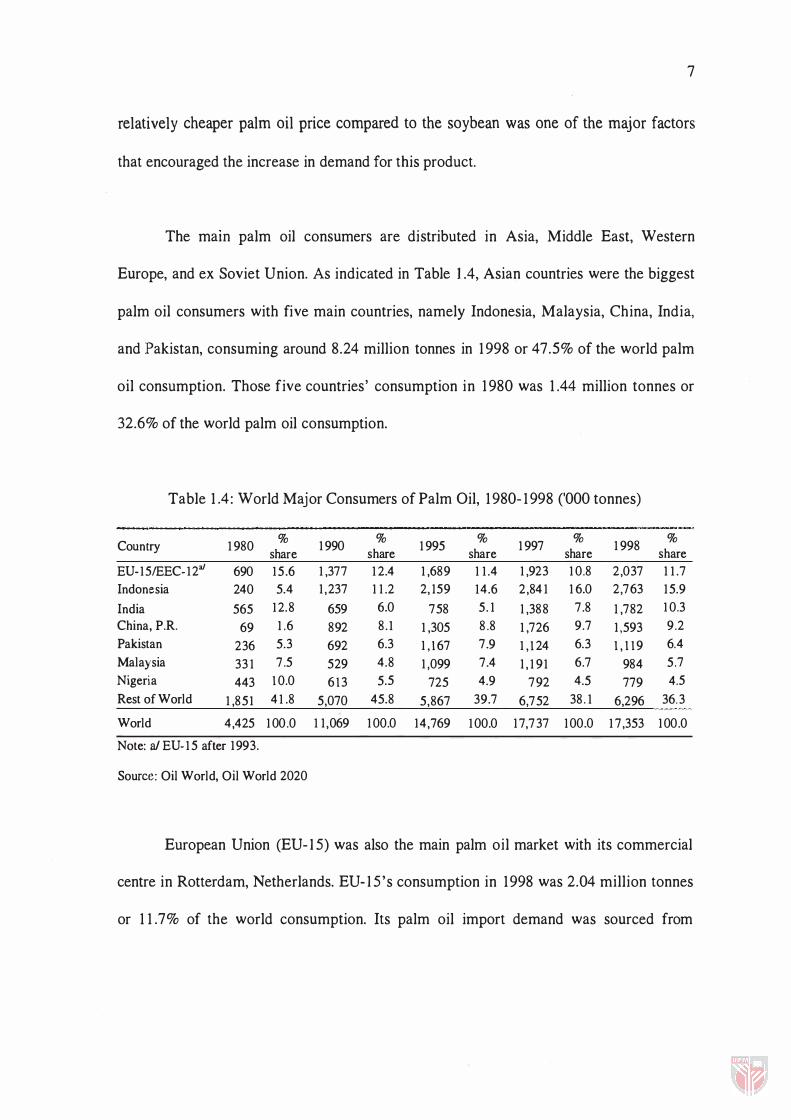
The mam palm oil consumers are distributed in Asia, Middle East, Western
Europe, and ex Soviet Union. As indicated in Table lA, Asian countries were the biggest
palm oil consumers with five main countries, namely Indonesia, Malaysia, China, India,
and Pakistan, consuming around 8.24 million tonnes in 1 998 or 47.5% of the world palm
oil consumption. Those five countries' consumption in 1 980 was 1 044 million tonnes or
32.6% of the world palm oil consumption.
Table 1 04: World Major Consumers of Palm Oil, 1 980- 1 998 ('000 tonnes)
Country 1980 % 1990 % 1995 % 1997 % 1998 % share share share share share
EU-15IEEC-12a1 690 15.6 1,377 1 2.4 1,689 1 1.4 1,923 10.8 2,037 1 1.7 Indonesia 240 5.4 1 , 237 1 1 .2 2, 159 14.6 2,84 1 16.0 2,763 15.9 India 565 12.8 659 6.0 758 5. 1 1 ,388 7.8 1 ,782 10.3 China, P.R. 69 1 .6 892 8.1 1,305 8.8 1,726 9.7 1 ,593 9.2 Pakistan 236 5.3 692 6.3 1 ,1 67 7.9 1, 1 24 6.3 1 , 1 1 9 6.4 Malaysia 331 7.5 529 4.8 1,099 7.4 1 ,191 6.7 984 5 .7 Nigeria 443 1 0.0 6 1 3 5.5 725 4.9 792 4.5 779 4.5 Rest of World 1,851 41.8 5,070 45.8 5,867 39.7 6,752 38. 1 6,296 36.3
World 4,425 1 00.0 11 ,069 100.0 14,769 100.0 1 7,737 1 00.0 17,353 1 00.0
Note: aI EU-15 after 1993.
Source: Oil World, Oil World 2020
European Union (EU- I S) was also the main palm oil market with its commercial
centre in Rotterdam, Netherlands. EU- I S's consumption in 1998 was 2.04 million tonnes
or 1 1 .7% of the world consumption. Its palm oil import demand was sourced from
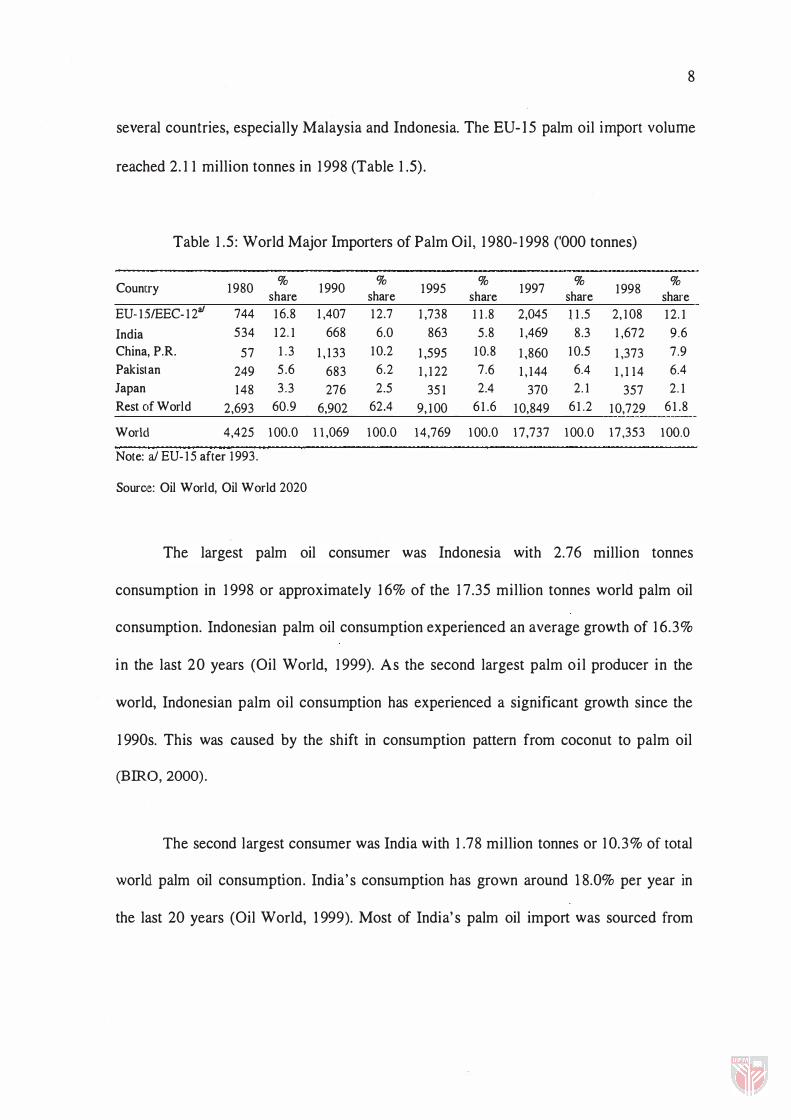
8
several countries, especially Malaysia and Indonesia. The EU-I5 palm oil import volume
reached 2. 1 1 million tonnes in 1 998 (Table 1 .5).
Table 1 .5 : World Major Importers of Palm Oil, 1 980- 1 998 ('000 tonnes)
Country 1980 % 1990 %
1995 %
1997 %
1998 %
share share share share share EU-1:5IEEC-12a1 744 16.8 1,407 12.7 1,738 11.8 2,045 )1.5 2,108 12.1
India 534 12.1 668 6.0 863 5.8 1,469 8.3 1,672 9.6 China, P.R. 57 1.3 1,133 10.2 1,595 10.8 1,860 10.5 1,373 7.9 Pakistan 249 5.6 683 6.2 1,122 7.6 1,144 6.4 1,114 6.4 Japan 148 3.3 276 2.5 351 2.4 370 2.1 357 2.1 Rest of World 2,693 60.9 6,902 62.4 9,100 61.6 10,849 61.2 10,729 61.8
World 4,425 100.0 11,069 100.0 14,769 100.0 17,737 100.0 17,353 100.0
Note: a/ EU-15 after 1993.
Source: Oil World, Oil World 2020
The largest palm oil consumer was Indonesia with 2.76 million tonnes
consumption in 1 998 or approximately 1 6% of the 1 7.35 million tonnes world palm oil
consumption. Indonesian palm oil consumption experienced an average growth of 1 6.3%
in the last 20 years (Oil World, 1 999). As the second largest palm oi l producer in the
world, Indonesian palm oil consumption has experienced a significant growth since the
1 990s. This was caused by the shift in consumption pattern from coconut to palm oil
(BIRO, 2000).
The second largest consumer was India with 1 .78 million tonnes or 1 0.3% of total
world. palm oil consumption. India's consumption has grown around 18.0% per year in
the last 20 years (Oil World, 1 999). Most of India' s palm oil import was sourced from


