Page 1
promoting access to White Rose research papers
White Rose Research Online [email protected]
Universities of Leeds, Sheffield and York http://eprints.whiterose.ac.uk/
This is an author produced version of a paper published in Transportation.
White Rose Research Online URL for this paper: http://eprints.whiterose.ac.uk/75336/
Published paper: Schmöcker, J-D, Hatori, T and Watling, D (2013) Dynamic process model of mass effects on travel demand. Transportation. 1 – 26. http://dx.doi.org/10.1007/s11116-013-9460-y
Page 2
1
Dynamic Process Model of Mass Effects on Travel Demand
Jan-Dirk Schmöcker, Department of Urban Management, Kyoto University, Japan,
[email protected]
Tsuyoshi Hatori, Department of Civil and Environmental Engineering, Ehime University, Japan,
[email protected]
David Watling, Institute for Transport Studies, University of Leeds, UK, [email protected]
Abstract
Whereas transportation planners commonly predict the negative impacts of mass transportation,
there is increasing empirical evidence of the existence of positive mass effects, whereby increased
use of a mode by the ‘mass’ will generally increase its attractiveness for future travellers. In this
paper we consider the dynamic impact of such an effect on the problem of travel demand
forecasting, with particular regards to social network effects. Our proposed modelling approach is
inspired by literature from social physics, evolutionary game theory and marketing. For simplicity
of exposition, our model is specified for a scenario in which (a) there is a binary choice between
two mobility lifestyles, referred to as car-oriented and transit-oriented, and (b) there are two
population groups, where one is the “leading” or “innovative” population group and the other the
“following” or “imitating” population group. This latter distinction follows the rather well-known
Bass model from the marketing literature (1969). We develop the transition probabilities and
transition dynamics. We illustrate with a numerical case study that despite lower intrinsic utility
for the transit lifestyle, significant changes towards this lifestyle can be achieved by considering
congestion, service improvements and mass effects. We further illustrate that mass effects can be
positive or negative. In all cases we explore the sensitivity of our conclusions to the assumed
parameter values.
Key words: Mass effects, travel demand, long range forecasting, Bass model, social networks,
stochastic process model
Page 3
2
1. Introduction
Over the past decades, town and transportation planners have utilised a large range of policy
measures in order to influence the travel decisions of individuals towards more sustainable modes.
Foremost among these have been the so-called “hard” measures, such as pricing of the less
sustainable modes as well as investments in the infrastructure of the more sustainable modes (e.g.
Stopher, 1994; Hensher and Chung, 2011). In order to justify and appropriately target such policies
in advance, a range of sophisticated, price-sensitive travel demand models have been developed
in order to forecast the likely economic and societal benefits. However, there has been a growing
awareness among policy-makers that hard measures are not on their own sufficient; for example,
the pricing measures may be politically sensitive, and (especially in periods of economic austerity)
the scope of the infrastructure investments may be too limited given the scarce availability of
funding.
Such considerations have led to the increasing importance of so-called “soft” measures:
communicative, persuasive measures to convince individuals or groups about the need for the
modal shift (e.g. Bamberg et al, 2011; Richter et al, 2011; Thørgersen, 2007). Evidence for the
increasing policy importance of such soft measures can be seen in the growing interest in “Travel
Feedback Programmes” or more generally “Mobility Management” such as TravelSmart in
Australia (Zhang et al, 2012) or SmarterChoices in the U.K. (Cairns et al, 2008). Again, travel
demand forecasting has a key role, for example in deciding how to target the measures to achieve
the desired policy consequences, or how to optimally design and time any complementary hard
measures in an integrated package. However, while the modelling of hard measures is now a
relatively mature and well-understood subject (Boyce and Williams, 2003), the tools for modelling
soft measures are much less advanced, given the much shorter time that they have featured on
the policy agenda and given the problem in capturing difficult-to-quantify effects. A particular
challenge for modelling the impact of soft measures is that their effectiveness depends on
changing travellers’ attitudes. Soft measures may be seen as having their origin in environmental
psychology, and as such they do not appeal directly to the existence of a “perceived (and easy to
model) utility function”, but to changes in various psychological determinants that form
behavioural intention. Following such a line of reasoning, Anable et al (2012), for example, predict
Page 4
3
future energy and mobility scenarios based on changes in attitudes, avoiding the need to translate
attitudes into “static utilities” (that determine decisions) by developing a reasonable "storyline".
The present paper will seek to explore a feature that we consider to be common to many such soft
measures, namely that they implicitly aim for some kind of positive, social mass effect, reflecting
the emerging role of social networks as a stimulus for travel behaviour decisions (Axhausen, 2008;
Carrasco et al, 2008). That is, from the policy-maker’s perspective, one persuades a few to change
their behaviour initially in order to encourage a larger number of people to follow later. This has
two clear implications: (a) the problem we consider is inherently dynamic, the relevant forecasting
question is: ‘how does demand change with time?’, not ‘what is the demand?’ and (b) the decision
of an individual at any point in time is dependent on the prior decisions of other individuals. This is
not to suggest that travel demand forecasting has never considered dynamic problems. Indeed
some thirty years ago, anticipating well the future growth in research interest in dynamic demand
forecasting, Clarke et al (1982) suggested a three-way classification of micro-dynamics (detailed
scheduling within the day), macro-dynamic modifiers (incorporating habit and lags) and macro-
dynamic processes (life processes, from birth to death). This classification reflects the general
focus of subsequent travel demand modelling developments, whereby demand is seen essentially
as the sum of individualistic processes (aside from perhaps at the household level). The problem of
forecasting demand dynamics under social mass effects, however, does not fit into such a
classification, as it does not decompose into individualistic dynamic processes.
The main aims of the present paper are, firstly, to propose a potential approach for representing
such mass effects among travellers through an extension of existing travel demand forecasting
methods. Our second objective is then to use this mathematical description to explore the
dynamics of such mass effects in some hypothetical scenarios. While we believe that considering
social mass effects is particularly important to encourage sustainable transport developments, we
recognise at the same time that they have the potential to lead to unsustainable feedbacks, and
the study of this issue forms part of our second objective.
Although the case study explored in this paper is based on some hypothetical scenarios, we
believe it provides insights into policy issues for encouraging the shift toward sustainable travel
modes. We believe our proposed approach is useful to analyse externalities between policy
Page 5
4
measures, i.e., political externalities, in which one policy measure has positive or negative impacts
on the effects of other measures. As will be shown in this paper, an introduction of a
communicative measure might have the potential to subvert the effects of other measures, such
as road pricing or service improvements, by strengthening conformity effects excessively. In
addition, it is shown that a policy measure targeting one group might have “spill-over” effects on
the other group.
The structure of the paper is as follows. The review of Section 2 has two elements: firstly, we
review evidence for the existence of positive mass effects, and as a result of this discussion seek to
pinpoint the particular phenomena that we aim to capture in the present paper. Secondly, we
analyse previous modelling approaches for similar phenomena, both in the transportation
literature and elsewhere. This review is used to inform our model formulation in Section 3, where
we specify a dynamic forecasting model for users choosing between two ‘mobility lifestyles’.
Section 4 analyses the proposed approach in more detail, through numerical examples and by
establishing limiting cases, which provide a ‘positioning’ of the work relative to the seminal work
of Bass from the marketing literature. We further explore, through a fairly extensive case study,
the sensitivity of the dynamic effects of the model to assumed values of the input parameters. In
the absence of data to calibrate our model, our objective is to illustrate the potential importance
of considering trend effects for transport policy, and so our focus is on exploring qualitative
features of the model. In Section 5, we discuss the potential policy impacts and issues for
calibration that arise from adopting such a modelling approach. Finally, Section 6 concludes the
paper by discussing its contribution as well as shortcomings, and identifies paths for further
research.
2. Mass effects: Evidence and Potential Modelling Approaches
2.1. The evidence for positive mass effects within real-life transportation systems
Although the present paper is concerned with modelling approaches, we begin our review not
with models but with real-life transportation systems, and ask the questions: do mass effects
really exist, and if so what kinds of mass effect are there?
Page 6
5
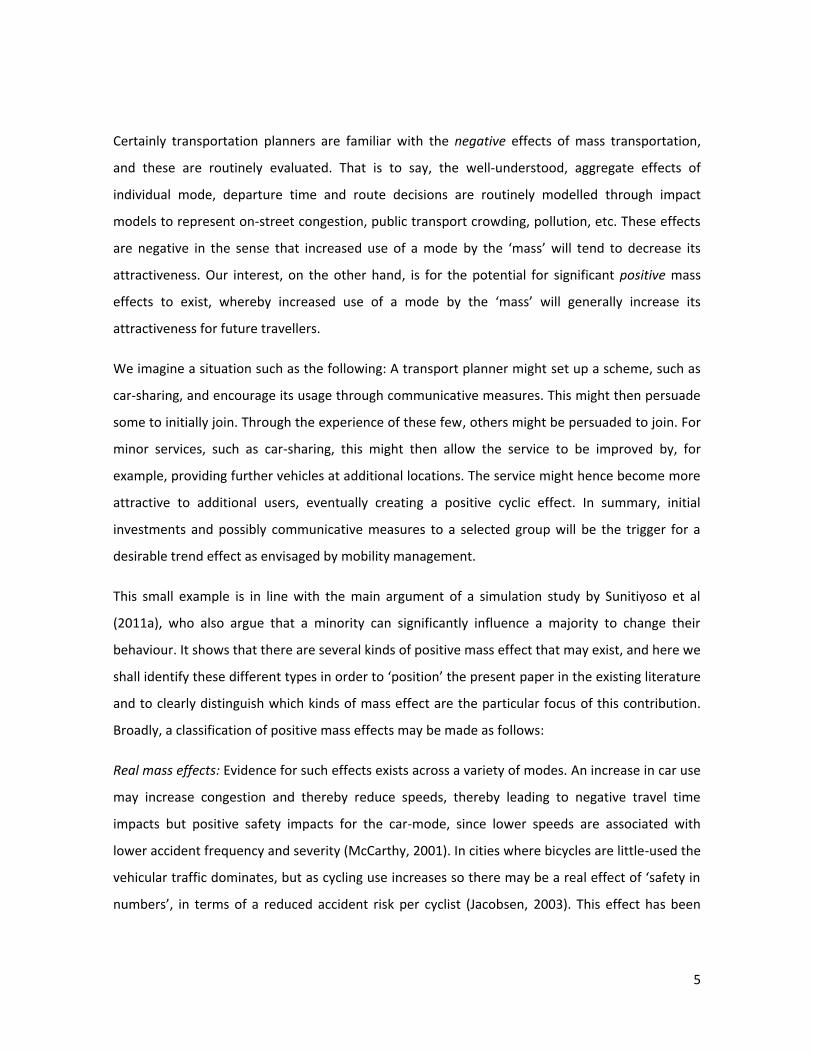
Certainly transportation planners are familiar with the negative effects of mass transportation,
and these are routinely evaluated. That is to say, the well-understood, aggregate effects of
individual mode, departure time and route decisions are routinely modelled through impact
models to represent on-street congestion, public transport crowding, pollution, etc. These effects
are negative in the sense that increased use of a mode by the ‘mass’ will tend to decrease its
attractiveness. Our interest, on the other hand, is for the potential for significant positive mass
effects to exist, whereby increased use of a mode by the ‘mass’ will generally increase its
attractiveness for future travellers.
We imagine a situation such as the following: A transport planner might set up a scheme, such as
car-sharing, and encourage its usage through communicative measures. This might then persuade
some to initially join. Through the experience of these few, others might be persuaded to join. For
minor services, such as car-sharing, this might then allow the service to be improved by, for
example, providing further vehicles at additional locations. The service might hence become more
attractive to additional users, eventually creating a positive cyclic effect. In summary, initial
investments and possibly communicative measures to a selected group will be the trigger for a
desirable trend effect as envisaged by mobility management.
This small example is in line with the main argument of a simulation study by Sunitiyoso et al
(2011a), who also argue that a minority can significantly influence a majority to change their
behaviour. It shows that there are several kinds of positive mass effect that may exist, and here we
shall identify these different types in order to ‘position’ the present paper in the existing literature
and to clearly distinguish which kinds of mass effect are the particular focus of this contribution.
Broadly, a classification of positive mass effects may be made as follows:
Real mass effects: Evidence for such effects exists across a variety of modes. An increase in car use
may increase congestion and thereby reduce speeds, thereby leading to negative travel time
impacts but positive safety impacts for the car-mode, since lower speeds are associated with
lower accident frequency and severity (McCarthy, 2001). In cities where bicycles are little-used the
vehicular traffic dominates, but as cycling use increases so there may be a real effect of ‘safety in
numbers’, in terms of a reduced accident risk per cyclist (Jacobsen, 2003). This effect has been
Page 7
6
seen to extend to pedestrians (Leden, 2002), implying that there is also a real positive effect of
increased use of modes involving a walk stage.
Perceived mass effects: Walking in a relatively empty or low density part of a city can give a feeling
of insecurity beyond the actual safety risks (Cho et al, 2009). Increasing use of walk-related modes
can therefore have a significant positive effect on perceptions of safety. This ‘perceptual’ effect is
potentially in addition to any real mass effects; it may be highlighted by linking it to improvements
in the aesthetic environment (a kind of link to the ‘consequential’ effects mentioned below).
Consequential mass effects: Travellers are not the only actors making decisions in a transportation
system, though often models and modellers assume this to be the case. If the decisions of other
actors are included, then a variety of positive mass effects may exist as a consequence of the
decisions of other actors. Increased use of public transport may lead to economies of scale that
may be passed on to travellers by public transport operators in terms of reduced bus fares or
increased frequencies (Mohring, 1972). In planning a staged implementation of a mode-specific
scheme over time, the actual implementation of future stages may be contingent on the public
support gained from the success of earlier stages in encouraging increased use of that mode
(Ngoduy et al, 2013), thus giving rise to what is in effect another form of positive mass effect.
Information mass effects: Conventional demand modelling assumes that individuals have both
perfect and complete knowledge of the options available. While random disturbance terms are
often used to capture traveller heterogeneity and/or the inability of the modeller to observe all
the factors that motivate traveller decisions, a quite different dimension is the level of
incompleteness and misinformation that travellers may possess. This is particularly the case for
alternatives that have been never or rarely used by some individuals, i.e. previously non-chosen
modes. The greater use of a mode will in turn mean a greater penetration in the travelling
population of those with experience in using a mode, and thereby a great chance of a non-user to
have a social connection with a user of that mode (Blickstein & Hanson, 2001; Páez & Scott, 2007;
Arentze & Timmermans, 2008). In automated information gathering (e.g. intelligent transport
systems), then vehicles may be used as probes, and a greater use of the mode gives potential for a
greater sample rate, wider coverage and therefore improved information (Shladover et al, 2007;
Herrera et al, 2010).
Page 8
7
The above grouping might be said to classify mass effects according to their “mode of action”.
Through this proposed classification of mass effects, we wish to emphasise that mass effects are
possibly significant in transport or mobility decisions of individuals not just through social
interaction. However, this latter kind of mass effect, which in the above classification is an
example of an information mass effect, has possibly received most attention in recent literature
and is reviewed in more detail in the following section. Sunitiyoso et al (2011a) summarise some
of the empirical findings and classify types of social interactions into further subcategories based
on their directness of interaction (interdependent situation, observation and communication.)
It seems likely that much of the information travellers derive about their transport options,
especially for non-chosen modes, will be from word-of-mouth, and may follow (and reinforce) the
general negative or positive perceptions of a mode within an individual’s social group (Bartle,
2011; Sutinyoso et al, 2011b). While interactions between household members are considered in
activity-based approaches, we are in this paper more interested in the wider influences across
social groups and households which we believe are not yet well represented in existing modelling
approaches, despite various studies confirming their importance for travel decisions. For example
the U.K.’s Department for Transport recently published their “behavioural insights toolkit” in
which they also stress that transport choices by individuals are influenced directly by various
norms, which, in our categorisation, might be seen as one important aspect of the “information
mass effect” (Department for Transport, 2011). The report further provides a summary of the
main underlying theories that can explain how behaviour is influenced by norms. One important
social psychological model with several transport applications is the Theory of Planned Behaviour
(Ajzen, 1991), which proposes that subjective norms are an important determinant of behavioural
intentations. As well as describing theories of behavioural changes, this has also inspired the
above-mentioned travel feedback programmes. This report, as well as that of Abou-Zeid et al (in
press), describes the role of norms on mobility decisions in more detail.
There are furthermore a number of recent examples with real data that appear noteworthy:
Goetzke and Rave (2011) explain differences in bicycle usage in German cities with social network
effects that could be due to any of the above modes of action. They use the aggregate bicycle
modal split as an instrumental variable to estimate an individual’s probability of choosing to use
Page 9
8
the bicycle mode. Taking aggregate bicycle modal split as a proxy for the social network effect,
they find that this is indeed a significant factor for mode choice for shopping and recreational trips.
Walker et al (2011) discuss the problem of endogeneity in the estimation of social network effects
(or field effects) in more detail, and suggest a different correction method. With mode choice data
from the Netherlands they also find significant field effects for the mode choice for work trips.
Weinberger and Goetzke (2011) aim to control for the above mentioned endogeneity by
accounting for average behaviour in peer groups. They then show that the percentage of
households without cars in a neighbourhood can explain ownership decisions. Their results
suggest that social network effects or “peer pressure” reduce the effect of income, education and
household size. In fact, they find a negative sign for income when taking into account peer
pressure, and suggest that a likely explanation is that cars play a more significant role as a status
symbol in poorer families.
These examples illustrate the importance of positive mass effects. As argued by the authors they
suggest these are based on social networks, i.e. information mass effects. However, as the
discussion on endogeneity effects shows, such effects are difficult to distinguish from other mass
effects that are also possibly at work at the same time, in particular consequential mass effects.
Furthermore, the approaches in the above study are used to explain and quantify the importance
of mass effects, but do not treat the dynamic process explicitly and are therefore probably less
suitable as a basis to forecast the development of future demand.
2.2. Modelling mass effects
In some fields of transportation, there is already a growing body of work on modelling the
dynamics of mass transportation. One such field is dynamic traffic network modelling, which
focuses on day-to-day dynamic models to represent the effects of congestion and user learning of
the choice attributes (Cascetta and Cantarella, 1995). Although the focus of such approaches has
been exclusively on negative mass effects, it is not inconceivable that such approaches might be
adapted to represent positive mass effects in the future, perhaps building on some of the ideas we
discuss later (Section 5). The key question we must answer, though, is: how might we represent
positive mass effects in a model?
Page 10
9
If we turn attention to the marketing literature, then we see that (in constrast) trend and word-of-
mouth effects are well-known. In a rather widely-known paper from this field, Bass (1969)
observed that the uptake of new products such as washing machines and dish washers can be
explained through a model with two population groups, referred to as “innovators” and
“imitators”. The innovators are typically imagined to be a small population group who are willing
to invest in the new product. After time, “imitators” follow by also purchasing these products,
creating significant sales until market satisfaction is reached. Bass’s model suggests that the
number of persons owning a product at any one time is a significant factor in the decision of
imitators to purchase the product at that time.
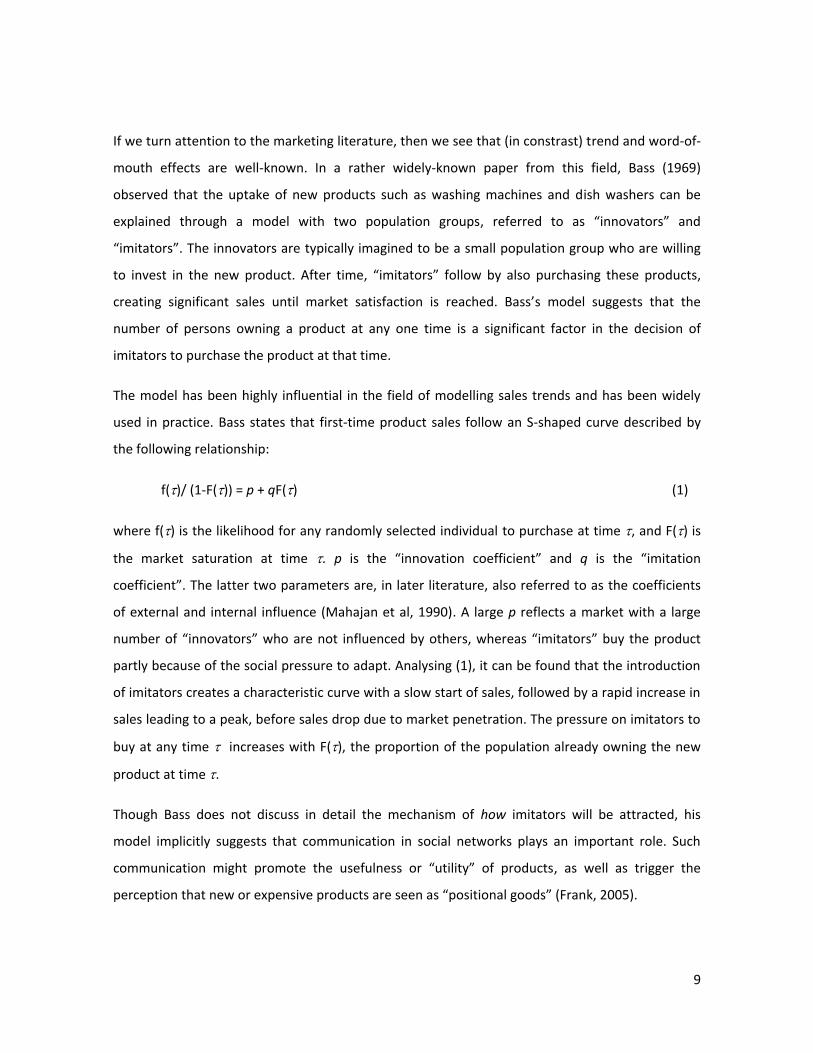
The model has been highly influential in the field of modelling sales trends and has been widely
used in practice. Bass states that first-time product sales follow an S-shaped curve described by
the following relationship:
f()/ (1-F()) = p + qF() (1)
where f() is the likelihood for any randomly selected individual to purchase at time , and F() is
the market saturation at time . p is the “innovation coefficient” and q is the “imitation
coefficient”. The latter two parameters are, in later literature, also referred to as the coefficients
of external and internal influence (Mahajan et al, 1990). A large p reflects a market with a large
number of “innovators” who are not influenced by others, whereas “imitators” buy the product
partly because of the social pressure to adapt. Analysing (1), it can be found that the introduction
of imitators creates a characteristic curve with a slow start of sales, followed by a rapid increase in
sales leading to a peak, before sales drop due to market penetration. The pressure on imitators to
buy at any time increases with F(), the proportion of the population already owning the new
product at time .
Though Bass does not discuss in detail the mechanism of how imitators will be attracted, his
model implicitly suggests that communication in social networks plays an important role. Such
communication might promote the usefulness or “utility” of products, as well as trigger the
perception that new or expensive products are seen as “positional goods” (Frank, 2005).
Page 11
10
These communication effects within social networks might at first seem to be uncontrollable, but
they are formally exploited by marketing through various forms, in particular the internet. For
example, Sparks and Browning (2011) discuss the importance of online reviews for hotel bookings,
while Jalilvand et al (2011) discuss the extent to which electronic communication has overcome
some limitations of conventional word-of-mouth effects, the latter being constrained to occur
typically between persons who know each other.
From this literature, we can conclude that there is agreement that social network or trend effects
are important to be considered for decision-making in general, and for consumer purchases in
particular. A great deal of work in economics and evolutionary game theory has hence studied
various sorts of dynamic models incorporating network effects. The dynamic models describe the
long-run process of social interactions through which agents revise their behaviour over time.
They can be distinguished depending on the specifications of agents’ revision procedures, termed
their revision protocol by Sandholm (2011). Some of the most commonly-studied dynamics are
replicator, (perturbed) best response, Brown - von Neumann - Nash imitation and mutator
dynamics, which correspond to different behavioural assumptions about agents’ decision
procedures (see Hofbauer and Sigmund, 2003; Sandholm, 2011). Although the main focus of the
literature seems to be on an evolutionary justification of equilibria in games, such as Nash
equilibrium, the modelling approaches have been applied to the study of social network effects in
various fields, so as to capture diffusion processes of certain types of behaviours or technologies in
population. This has included applications to considerate smoking behaviour (Nyborg and Rege,
2003), common-pool resource uses (Sethi and Somanathan, 1996), market share of products
(Cantner et al, 2010), and innovation and technological change (Safarzynska, van den Bergh, 2011).
However, there are few applications within the transportation research field, Yang and Zhang
(2009) being one of the exceptions in introducing evolutionary dynamic games to the modelling of
traffic flow patterns.
The dynamics to be studied later in the present paper correspond to a version of logit dynamics in
the evolutionary game theory literature. The logit dynamics approach, which was introduced by
Fudenberg and Levine (1998) and Hofbauer and Sandholm (2002; 2007), is formulated by
assuming the logit model as each individual’s behavioural principal. Although the logit model has
Page 12
11
been theoretically justified and also extensively used in empirical work, this form of dynamics has
been rarely applied to model diffusion of behaviour, and not (to our knowledge) travel behaviour.
Although our approach therefore has links to evolutionary game theory, we shall focus more on its
emergence from a body of literature related to system analysis in physics. Here, we see an overlap
between the above, evolutionary game literature, and the physics literature utilising the so-called
quasi-mean value equations of the master equation approach. Nakayama and Nakayama (2004)
note that ’statistical physics can provide powerful methods for studying social phenomena with
interaction’. Similar to the work we shall present, Nakayama and Nakayama utilise the logit model
for describing transition probabilities based on perceived utilities of choice, with these utilities
including both attraction and repulsion elements towards a choice, depending on how many
people have already adopted this option. They investigate time evolution as well as system
bifurcation points for different parameter settings. In contrast to the work we shall present, they
do not distinguish different population groups nor do they distinguish congestion and mass effects.
Our model development is in parts influenced by ideas described in the book “Sociodynamics” by
Weidlich (2000). In his book he describes approaches for quantitative analysis of stochastic
phenomena originally developed to describe natural phenomena. In particular, our analysis is
inspired by the migration problem described in Chapter 4.3 of Weidlich (2000), but with some
important differences in the model specification, as we shall describe in the following section.
3. Problem description
3.1. General notation
It is first useful to clarify the kind of transportation situation we are envisaging with our model.
Specifically we are considering a long term decision such as, for example, whether to join a car
sharing scheme, whether to buy an eco-friendly car, or whether to start using a bicycle. This may
be distinguished from the emphasis of mode choice models, for example, where the question is
whether individuals in a specific transport situation will choose a particular mode for that situation.
Page 13
12
Rather than mode choice, then, our focus will be on mode uptake (as in Watling, 2010), or in even
more general terms the choice of mobility lifestyle.
Although we believe our approach can be readily applied to the choice between any number of
mobility lifestyles, for any number of ‘population groups’ (as defined below), in order to
communicate the key ideas we shall in this paper restrict attention to the simplest case, of the
choice between two mobility lifestyles, for two population groups. We shall denote the two
mobility lifestyles by c and t and the two population groups by λ and φ. Broadly, since we are in
fact imagining a policy situation in which the objective is to promote more sustainable transport
modes, then we may think that c stands for car and t for transit, but one might more generally
consider c as the prevailing unsustainable mode and t as the new sustainable mode. Similarly, λ
stands for the “leading” population group and φ for the “following”, but one might more generally
interpret λ as innovators as in the Bass model; that is to say, those who are more willing or find it
easier to experiment with new forms of mobility, and are possibly convinced by persuasive policy
measures. Followers are more likely to be influenced by the decisions of others and often make up
the mass of the population. Alternatively, one might interpret and simply as two different
population groups with different utility functions, with the members within the two groups
influenced to different degrees by persons from their own group and the other group. Our
question will be primarily to understand at what stage a large amount of the population will be
likely to consider switching to the mode promoted by the policy-makers, i.e. mode t.
Though we discuss the meaning of further variables throughout our paper, we provide the reader
here with an overview of all the notation used for easier reference:
A:{ λ, φ}: Set of population groups, λ: leading, trendsetting group, φ: following group
Λ, Φ: Size of population groups λ and φ respectively
L: {t,c}: Set of possible mobility lifestyles, t: transit oriented, c: car oriented
( ): Expected number of persons in group α with mobility life style i in time interval
( ) Utility of mobility lifestyle i for group in time interval
Page 14
13
Intrinsic utility of mobility lifestyle i for subgroup
General possibility to move from mobility lifestyle i to j for population subgroup
( ) Proportion of population type that moves from mobility lifestyle i to j in time
interval
( ) Expected number of people from population type that move from mobility
lifestyle i to j in time interval
We note that ( ) and
( ) could alternatively have been defined as individual and aggregate
transition probabilities respectively, leading to a stochastic process model formulation, in which
we would model the time-evolution of the probabilistic distribution of the states in the dynamic
process. In our work, however, we interpret and
as proportions rather than probabilities,
leading to a deterministic process model; effectively, it can be interpreted that we assume that the
dynamics may be captured approximately by the time-evolution of the expected values, assuming
a uni-modal probability distribution of the stochastic process and invoking a ‘law of large numbers’
argument. Weidlich (2000) describes this as the assumption that “taking the weighted mean over
the hopping processes of a bundle of stochastic trajectories from a given point (
) … leads
to the equations for the preferential mean direction and mean velocity by which the trajectory-
bundle proceeds” (p. 62).
From the notation it follows that the state of the population is described by
{ ( )
( ) ( )
( )} . Since
( )
( ) (2)
( )
( ) (3)
then these four state variables could in principle be fully described with only two unknown
variables ( ) and
( ); however, we have retained reference to all four variables in our model
definition below, as this seems a clearer way of explaining the model. We are interested in the
evolution of these variables over time.
Page 15
14
3.2. Utilities for mobility lifestyle decisions
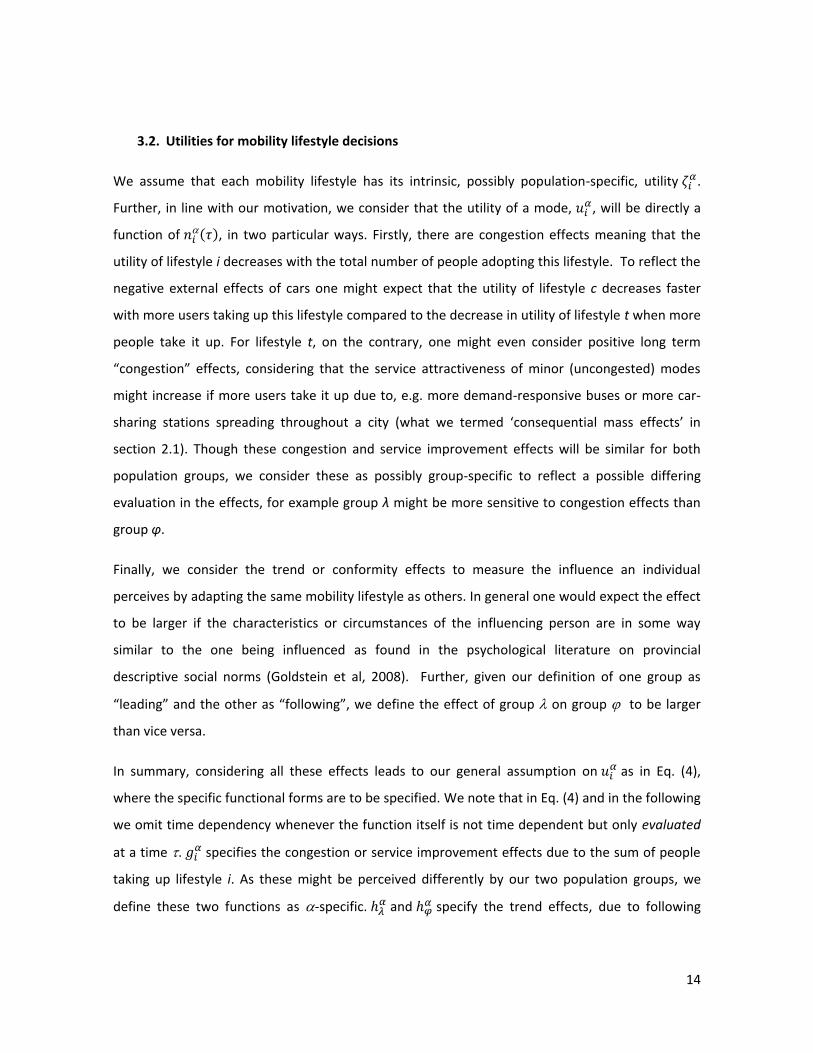
We assume that each mobility lifestyle has its intrinsic, possibly population-specific, utility .
Further, in line with our motivation, we consider that the utility of a mode, , will be directly a
function of ( ), in two particular ways. Firstly, there are congestion effects meaning that the
utility of lifestyle i decreases with the total number of people adopting this lifestyle. To reflect the
negative external effects of cars one might expect that the utility of lifestyle c decreases faster
with more users taking up this lifestyle compared to the decrease in utility of lifestyle t when more
people take it up. For lifestyle t, on the contrary, one might even consider positive long term
“congestion” effects, considering that the service attractiveness of minor (uncongested) modes
might increase if more users take it up due to, e.g. more demand-responsive buses or more car-
sharing stations spreading throughout a city (what we termed ‘consequential mass effects’ in
section 2.1). Though these congestion and service improvement effects will be similar for both
population groups, we consider these as possibly group-specific to reflect a possible differing
evaluation in the effects, for example group λ might be more sensitive to congestion effects than
group φ.
Finally, we consider the trend or conformity effects to measure the influence an individual
perceives by adapting the same mobility lifestyle as others. In general one would expect the effect
to be larger if the characteristics or circumstances of the influencing person are in some way
similar to the one being influenced as found in the psychological literature on provincial
descriptive social norms (Goldstein et al, 2008). Further, given our definition of one group as
“leading” and the other as “following”, we define the effect of group on group to be larger
than vice versa.
In summary, considering all these effects leads to our general assumption on as in Eq. (4),
where the specific functional forms are to be specified. We note that in Eq. (4) and in the following
we omit time dependency whenever the function itself is not time dependent but only evaluated
at a time . specifies the congestion or service improvement effects due to the sum of people
taking up lifestyle i. As these might be perceived differently by our two population groups, we
define these two functions as -specific. and
specify the trend effects, due to following
Page 16
15
people in group and respectively. With this notation it follows also that specifies the trend
effects due to following people in “my group” when = 𝛽 and “the other group” when 𝛽
respectively. We emphasise that this trend effect is not mode-specific, it simply tends to reinforce
the decision of the majority. Function then combines the group-specific and mode-specific
effects while considering the intrinsic utility . Note that the migration problem as set out in
Weidlich also includes an intrinsic utility and trend effect, but does not include anything analogous
to our mode-specific effect (which in his migration model would have been a location-specific
effect, i.e. in our terms is omitted from Weidlich’s model). Weidlich further assumes linear-in-
parameter functions for , ,
and . For transport applications this linearity assumption
might seldom be appropriate, as we discuss later, and so provide a more general notation which
also permits non-linear forms.
(
) (
(
)
( )
( )) for = {,}; i = {c,t} (4)
3.3. Transitions during one time interval
To reflect the general likelihood of changing the mobility status (within a certain time period) we
further introduce parameters . We might expect such parameters to be, for example,
dependent on income, as we might assume that a higher income will tend to allow people to more
easily adopt and adapt to a different lifestyle. With these definitions, the one-step transition
proportions between mobility lifestyles can be defined. Weidlich assumes an exponential form of
transition proportions from i to j as
(
)
( (
)
(
))
for , = {,}; i,j = {c,t} with ij (5)
While this form ensures positiveness of transition proportions, it does not guarantee that they are
less than or equal to 1, though this can be avoided by assuming relatively small values for the
parameters . The form chosen by Weidlich further assumes “intelligent” individuals in that they
Page 17
16
consider the utility of mode j after they have moved into this state i.e. (
), but
otherwise the formulation does not seem to be behaviourally justified. In the current contribution,
however, we shall instead use transition proportions based on the logit model, as there is a
stronger theoretical justification (see e.g. Ben-Akiva and Lerman, 1985). Furthermore, we assume
that individuals only consider the present conditions of both lifestyles in their choice, i.e. decision
makers are myopic in that they do not foresee the impact of their decision. This leads to the
following functional form for our transition proportions:
(
)
(
(
))
( (
)) (
(
))
( (
)
(
))
for = {,}; i,j = {c,t} with ij (6)
We note that (6) is a form of the dogit model. Bordley (1990) describes the dogit model as a way
of modelling customer choice in which customers are to some extent loyal to the previous product
they bought. For travel behavioural decisions loyality might rather be explained with habitual
behaviour and the difficulties associated with fitting changes into daily schedules with various
constraints. Therefore, it is reasonable to assume that a fraction ( ) of travellers are “loyal”
to their previous lifestyle, and a fraction consider a change in lifestyle. That this functional form
is a reasonable assumption is given some support by Whelan (2007). Whelan modelled car
ownership developments in the U.K. and found that the dogit model in general provides good
model fits.
We emphasise that in (6) changes from lifestyle c to t and vice versa are both possible, i.e. both
( ) and
( ) can be nonzero. In contrast to the original approach by Bass (1969), this might
hence be described as “two Bass models in tandem”. Setting or
to zero reduces our
approach to one similar to the original Bass model.
The group proportions can now be used to define the aggregate transition rates or expected
number of transitions within each group, , by considering that there are
( ) persons within
each population group that could make a transition from i to j:
Page 18
17
( )
( ) (
( ) ( )
( ) ( )) for = {,}; i,j = {c,t} with ij (7)
In our case there are hence the |A|*|L|= 4 possible state transitions
{ ( )
( ) ( )
( )}. For example a transition from an initial state (
) to
(
) has an aggregate transition probability of
=
and the inverse transition
back to the initial state can be executed by an additional individual so that =
(
).
3.4. Transition Dynamics
Equation (8) follows from (7) and our model set up as a deterministic one. It describes the
expected change in the mobility lifestyles by subtracting the aggregated outflow from each
mobility lifestyle from the aggregated inflow.
( )
( ) ( ) for = {,}; i,j = {c,t} with ij (8)
Assuming the special case of symmetric transition proportions in (6) i.e.
the
expected change in persons from population group with mobility lifestyle t can also also be
written as Eq. (9). This formulation is equivalent to the perturbed best response dynamics used in
evolutionary game theory, and since it is derived by assuming Eq. 6 it also illustrates a connection
to the logit model commonly used in transport demand modelling.
( )
[
( (
( ) ( ))
( ( )
( )) )
( )]
[ (
( ( )
( )))
( (
( ) ( ))) (
( ( )
( )))
( )] for = {,} (9)
If we make a discretisation in time of the above model, then, in line with (8), we obtain the
following difference equation for the change in the population state over time.
( )
( ) ( )
( ) for = {,}; i,j = {c,t} with ij (10)
Page 19
18
4. Illustrative Example
4.1. Limiting cases
As shown in our literature review, dynamic evolutionary processes have been prominent in various
disciplines, but especially the deterministic Bass model is a seminal work that has been applied to
model user uptake of new products. To clarify the scope of our model in this section we illustrate
similarities to and differences from the deterministic Bass model. We take parameter settings
from those typically reported in Bass (1969) noting that these might not be realistic for travel
behavioural decisions. In this section our focus is limited to a comparison of the general shape of
the functional form obtained and possible interpretation of the variables.
The models cannot be mathematically derived from each other, even assuming limiting cases,
which can be seen by comparing Eq. (1) with Eqs (6) and (8). Whereas the Bass model is based on a
linear relationship between probability of purchase (change in mobility lifestyle) and number of
previous buyers, our model is based on the assumption that each traveller changes his/her
lifestyle according to a logit function based on the choice utilities.
In order to draw this comparison we translate product sales from the Bass model into
transit uptake in our transportation system. To ignore the “tandem model” of returning to the
previous car-dependent mobility lifestyle we set
. The Bass model further has only
three variables. The first such variable is m, which relates to market size and total sales. We set
. Secondly, p, the innovative factor, or probability of an initial purchase at = 0. We
set p = 0.02 in line with common values reported in Bass (1969) reflecting the innovation potential
in the population, i.e. the population who purchases new products without influence of any
internal pressure. Translated into our model we set ( ) and meaning that all
“leaders” change their lifestyle immediately. This illustrates one property of our model in that it
can assume that leaders can also change their behaviour over time. The final parameter in the
Bass model is the imitation factor q. In our model this factor should be reflected with the function
(
) not with the mass effect functions
( ) and
( ) . This is because the
functions encourage trends towards both the car and transit similar to social norms, i.e. significant
Page 20
19
functions in a system with few transit- but many car-users will prevent a move towards transit.
This again illustrates a difference between the two models. In our model the functions enforce
social norms whereas in the Bass model the parameter q describes imitation (to purchase),
regardless of the attraction to the current situation (of being in a state of not having the product).
Following again studies reported in Bass (1969) we set q =0.3 and “equivalently” assume a linear
-function as in (20) with
and
.
With
0 for = {,} and ( ) ( ) our utility function (4) reduces to
(
)
(
)
(
) for = {,} (11)
Finally, we note that our dogit parameter has no equivalence in the Bass model. By
setting it to 0.1 we obtain the graphs below, which illustrate that there are differences in the
models but that also with our models we can obtain the characteristic S-shaped curves observed
by Bass for many product sales. The Bass model achieves this with far less parameters, though.
While a low-parameter model would generally be favoured for prediction, the additional
parameters in our model allow the potential to link to important policy factors, by describing the
interaction between leaders and followers, by distinguishing imitation from normative effects, and
by controlling the speed of the purchase/ mode change.
Page 21
20
Parameter settings:
;
;
3
Figure 1 Illustration of deterministic Bass model
Parameter settings:
2; ;
( ) ;
( ) ;
;
(
)
Figure 2 Application of model with parameters similar to Bass model
4.2. Scenarios
While our example is artificial, we aim to create it so as to illustrate some plausible features that
might be observed in reality. With this in mind, our first task is to consider the relative size of the
trend-setting and following groups. In our example, we suppose that , which we believe to
be a reasonable assumptions for our interest of promoting a new mobility lifestyle or an initially
less-used mode through “a few leaders”. Leaders might, for example, denote those in the
Page 22
21
population that are directly influenced by soft transport policy measures such as “mobility
management”. We assume in the following a ratio of 4 followers per leader though it might often
be larger unless mass media are utilised for the promotion of the sustainable mode For brevity we
do not report case studies with other population compositions but remark that the ratio of the
two groups does have an impact on the final population state, if negative and/or positive feedback
is considered.
In line with our objective to describe the potential impact of trends for long-range transport
planning, let us assume a time interval duration of one year. We further assume for
both population groups and transition in both directions, in other words this means, given
, we expect 0.5% of the population to change their mobility status within one time
interval. Though this percentage might appear low, we would argue that a larger value is
unrealistic. In a metropolitan city of a developed country where arguably the benefits of having a
car for many are similar to not having a car, this would mean that 50 out of 1000 households per
year change their status from having a car to having none or vice versa. Obviously a lower bound
for this parameter is , corresponding to a fixed, unchangeable mobility status of the
population.
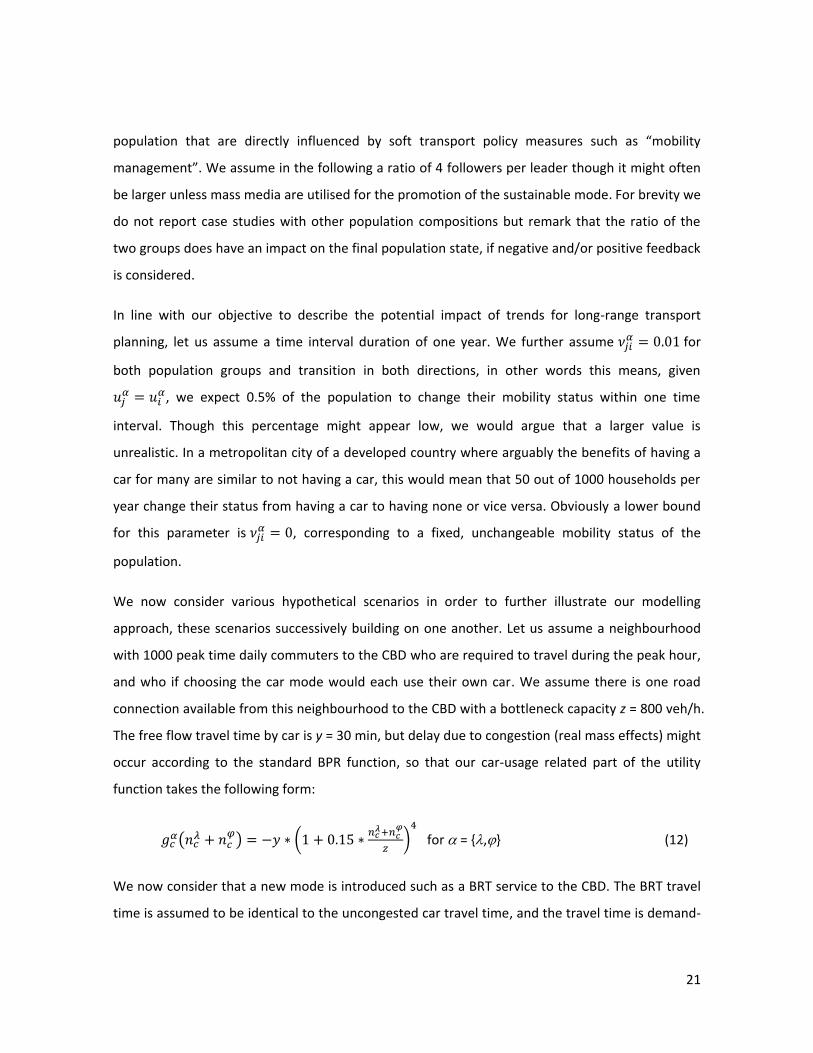
We now consider various hypothetical scenarios in order to further illustrate our modelling
approach, these scenarios successively building on one another. Let us assume a neighbourhood
with 1000 peak time daily commuters to the CBD who are required to travel during the peak hour,
and who if choosing the car mode would each use their own car. We assume there is one road
connection available from this neighbourhood to the CBD with a bottleneck capacity z = 800 veh/h.
The free flow travel time by car is y = 30 min, but delay due to congestion (real mass effects) might
occur according to the standard BPR function, so that our car-usage related part of the utility
function takes the following form:
(
) (
)
for = {,} (12)
We now consider that a new mode is introduced such as a BRT service to the CBD. The BRT travel
time is assumed to be identical to the uncongested car travel time, and the travel time is demand-
Page 23
22
independent. Using BRT requires, however, some additional time x for access, boarding and egress
which we set to 10min. In line with our discussion on “consequential mass effects” we assume
though that the service might improve over time through more frequent services and more stops
if more users can be gained. We therefore assume that for the transit mode usage related part of
the utility function:
(
)
( (
)) for = {,} (13)
The parameter describes the sensitivity of the function to the demand. In case of
> 0 the
additional time required for the new mode is a decreasing function of , with large demand
meaning that eventually the travel time reduces to the undelayed travel time of the car. We
further assume that the intrinsic utility of the new mode is higher for leaders to express that they
are more likely to use the new mode and set
The intrinsic utility for car is set to
10 units for both population groups. We assume a simple addition of intrinsic utility, travel times
and mass effect so that the car has a small perceived advantage of the equivalent of 2min and
4min for leaders and followers respectively if all mass effects are ignored. Regarding the
informational mass effect we make the assumption that
(
)
for , = {,} (14)
where is a trend parameter describing the tendency to assimilate/follow the commuting
decisions of persons from subgroup for people from subgroup .
In the following tests, we report the findings from using the parameter settings shown in Table 1,
abbreviated as Scenarios 1 to 7. We illustrate our scenarios with Figures 3 to 9. On the x-axis we
illustrate the dynamics for () and on the y-axis that for
(). In the figures we show the
results of Eq. (10) solved for mode uptake t for different initial states of the population: each trend
line is a plot of the evolution of the ( ()
()) pair over time steps from
different starting points ( ( )
( )), the trajectory illustrated as a continuous line. We plot
1000 time steps for each trend line, at which point all had converged to a fixed point (but not
necessarily all trend lines to the same fixed point). If each time step were to represent 1 year, then
Page 24
23
obviously the stable points might not be reached within the typical planning horizons considered
for transport policies, meaning that the trajectories are possibly as important as the convergent
points. As that trajectory which emerges from an initial state with no/few transit users is most
interesting for our case, this trendline is highlighted. If the other trendlines converge all to the
same point, this would provide numerical evidence indicative of global stability of the solution,
whereby the same solution is reached independent of the initial population state.
Table 1 Parameter Settings in the scenarios
Fixed
S1 S2 S3 S4 S5 S6 S7
10 8
0 0.1
0 0.05
0 0.005 0.01 0.02
In the base scenario S1 (Figure 3) we assume that the car has a higher intrinsic utility of
, and that there are no consequential or informational mass effects. Congestion
reduces the utility for the car but we find that not many commuters are likely to change mode as
we find a stable situation at (
). At this point the BRT travel time is 40
minutes compared to 39.7 minutes for the car. Considering intrinsic utilities this means that the
car utility is 2.3 units higher for leaders and 4.3 units higher for followers at the stable point. We
remark that our stable dynamic solution does not have to be a Wardrop equilibrium solution.
Rather a dynamic stable solution means that (8) equals zero.)
In a second scenario illustrated in Figure 4 we consider that consequential mass effects occur in
the form of a reduction in the additional time required for using BRT per unit of demand, and set
= 0.1 in Eq. (22). This leads to a stable point at ( 128,
155). Interestingly, following
the highlighted trajectory from ( ( ) 0 ;
( ) 0), we see first an increase in usage from
Page 25
24
both leaders and followers, but after time a slight reduction in usage by the followers as a majority
of the leaders start using the BRT.
In a third scenario we add an ‘information mass effect’ in the form of = 0.05 (Figure 5). This
means that for every 20 leaders taking a mode, the followers perceive this as equivalent to an
increase in utility of 1 minute. Compared to Figure 4 this leads to some change in the final stable
point obtained ( 108,
204), with now more followers using the BRT; this is due to the
fact that the majority of leaders choose BRT, which in turn attracts followers to also swap mode.
However, possibly more importantly, the trajectory until this solution is obtained is very different
from the previous scenario. In the current case we find that at first only leaders take up transit,
but once a “critical mass” starts using BRT, then also followers are likely to consider using the new
mode.
In S4, illustrated in Figure 6, we modify the scenario above to consider the case with = 0.005.
We set this parameter lower in the present scenario to reflect the fact that there are more
followers, and therefore a single follower might not have as much an impact as a leader. The
stable point moves to ( 125,
161) and the negative effect on the followers can be
explained with the mass of followers taking car. We further observe that followers take up BRT
even later: until the point at which around 100 leaders take BRT, almost no follower can be
convinced.
In Figure 7 we consider the introduction of a TDM measure, such as road pricing or a petrol tax
increase, aimed at reducing the utility of the car. We model this with a deduction in the intrinsic
car utility for both population groups from 10 to 8 units (equivalent to 2 minutes). This has a
significant effect on the followers as our stable point now moves to ( 115,
426). We
note that the system takes a much longer time to settle down. Furthermore, we find that in this
system state – where the utility between the two modes is very similar – the system becomes very
sensitive to information mass effects. Removal of information mass effects leads to a significantly
lower proportion of followers using the new mode (not illustrated due to space limitations).
Doubling to 0.01 leads to all followers using the new mode (Figure 8). A further increase leads
to unstable solutions as illustrated in Figure 9 with = 0.02. Depending on the starting point
Page 26
25
different stable points are reached. Starting from a no user situation, the point ( 196,
13) is most likely to be reached. For a new mode it means that it might be very difficult to obtain
significant market shares, as it is virtually only innovators that will change to BRT.
Figure 3 Base Scenario (S1)
0
100
200
300
400
500
600
700
800
0 20 40 60 80 100 120 140 160 180 200
Follo
we
rs w
ith
"Tr
ansi
t o
rie
nte
d li
fest
yle
"
Leaders with "transit oriented lifestyle"
Page 27
26
Figure 4 S1+ service improvements effects (S2)
Figure 5 S2 + Leader Trend effect (S3)
0
100
200
300
400
500
600
700
800
0 20 40 60 80 100 120 140 160 180 200
Follo
we
rs w
ith
"Tr
ansi
t o
rie
nte
d li
fest
yle
"
Leaders with "transit oriented lifestyle"
0
100
200
300
400
500
600
700
800
0 20 40 60 80 100 120 140 160 180 200
Follo
we
rs w
ith
"Tr
ansi
t o
rie
nte
d li
fest
yle
"
Leaders with "transit oriented lifestyle"
Page 28
27
Figure 6 S3 + Mass Trend effect (S4)
Figure 7 S4 + TDM measure (S5)
0
100
200
300
400
500
600
700
800
0 20 40 60 80 100 120 140 160 180 200
Follo
we
rs w
ith
"Tr
ansi
t o
rie
nte
d li
fest
yle
"
Leaders with "transit oriented lifestyle"
0
100
200
300
400
500
600
700
800
0 20 40 60 80 100 120 140 160 180 200
Follo
we
rs w
ith
"Tr
ansi
t o
rie
nte
d li
fest
yle
"
Leaders with "transit oriented lifestyle"
Page 29
28
Figure 8 S5 + Mass Trend Effect increased to = 0.01 (S6)
Figure 9 S6 + Mass Trend Effect increased to = 0.02 (S7)
0
100
200
300
400
500
600
700
800
0 20 40 60 80 100 120 140 160 180 200
Follo
we
rs w
ith
"Tr
ansi
t o
rie
nte
d li
fest
yle
"
Leaders with "transit oriented lifestyle"
0
100
200
300
400
500
600
700
800
0 20 40 60 80 100 120 140 160 180 200
Follo
we
rs w
ith
"Tr
ansi
t o
rie
nte
d li
fest
yle
"
Leaders with "transit oriented lifestyle"
Page 30
29
5. Policy Implications and Calibration Issues
5.1 Policy Implications
The findings that were obtained from the numerical examples reported in Section 4 cannot be
directly applied to practical situations and policy making, since the parameter values, functional
forms and scenarios assumed were entirely fictitious. However, we believe that these results do
provide some important indicative implications that could be taken into consideration when
developing future policy measures to promote the shift toward a new travel mode. Firstly, our
examples show that policy measures have an impact on the trajectory of population dynamics as
well as the final state to which the trajectory converges. Trajectories are especially important to
consider for transport planning with long term effects, since convergent states might never be
obtained. Secondly, the case study with a series of scenarios highlights the influence of political
externalities, where the effects of different measures are mutually interrelated. In particular, as
indicated in the result of scenario S6, the introduction of a communicative measure encouraging
interdependence among followers was seen to lead to an unexpected result, subverting the
effects of other measures such as road pricing and service improvements. Thirdly, the current
examples illustrate that the effects of a policy measure targeting one group may not be limited to
that group, and can spill over to affect other groups. In our experiments we found that
strengthening follower mass trends (S4, S6, S7) or leader mass trends (S3) could have a positive or
negative impact on the other group. The overall results suggest that in order to use ‘mass effects’
as a tool to achieve a significant modal shift, a good combination and coordination of different
policy measures is needed, with a better understanding of policy effects on the dynamics of the
process, especially policy externalities and spillover effects to non-targeted groups. From our
experiments we have shown that such a combination of measures might include a communicative
measure with pricing and service improvements.
5.2 Calibration Issues
The purpose of the present paper has been to set out a possible approach by which the dynamics
of mass effects may be represented in transportation systems, and to explore the implications of
Page 31
30
following such an approach. The assumptions, functional forms and examples we have considered
have been hypothetical; our aim has been to set out one candidate approach, which could in the
future be tested against alternative specifications, given the availability of suitable ‘tools’ for
empirical analysis (by which we include survey methods, data sources and calibration techniques).
The question then arises as to whether such tools already exist, or at least whether there is cause
to believe they could be developed in the future. In aiming to answer such a question, we will
consider the wider (as yet undefined) class of models that might be defined in the future to
represent mass effects, and will draw on parallels in other fields.
As explained in section 2.1, our use of the term ‘mass effects’ covers a wide range of possible
phenomena, and it seems that quite different approaches to modelling (and hence model
calibration) may be appropriate in the different contexts. In a situation in which we only have
what we have termed ‘real mass effects’, then it seems that an ‘engineering solution’ may be
possible. In this case the conformity effects (as described in section 3.2) would not be so important,
and so such terms may be neglected, and our interest may be solely on the extent to which the
utility depends directly on
. This function itself may be time-independent, and so standard
transferable relationships might be developed for different phenomena; the dynamics then arise
from the feedback of the collective effects of the individual travel decisions.
This is strongly analogous to the way in which time independent relationships representing traffic
network congestion have been embedded within dynamic process models of decision-making (e.g.
Cantarella & Cascetta, 1995), whereby travellers ‘learn’ of the collective impacts through direct
experience, and the impacts motivate their subsequent choices. . The main difference is that here
we are looking for positive rather than negative “network effects”. Thus the function (.) in the
utility expression (4) might, for example, reflect the observed relationships between increased
motor vehicle use and decreased accident risk per person (Smeed 1949; Adams, 1987, McCarthy,
2001) or the analogous relationships seen for walking and cycling (Jacobsen, 2003; Robinson,
2005).
Turning attention to the category that we termed ‘perceived mass effects’ in section 2.1, it would
seem that in some cases these could be treated by an extension of the approach described above
for ‘real mass effects’. For example, if we could assume that perception meant a subjective or mis-
Page 32
31
perception of a real effect, then we might extend the interpretation of the function (.) given
above to suggest that it is a composite function reflecting not only the real effect, but also the
valuation of that effect by an individual from the group in question. Such a valuation could be
estimated by conventional means (e.g. revealed or stated preference) since it only reflects the
individual’s valuation, all the mass effect is wrapped up in the engineering function which
represents the real effect. However, our argument that individual valuation might be separated
from mass effects will only hold in some cases. On the contrary, for long range planning one might
consider that valuations should be social context specific. In this spirit, Manrai and Manrai (1995)
show that values of time differ between cultures and that migrants can adapt. Similarly, people
who experience significant improvements in their transport system might start valuing transport
system aspects such as congestion differently over time. In such cases we cannot consider
individual valuation as distinct from the mass effect, and more likely for calibration we will have to
turn to the kinds of theories discussed below under ‘information mass effects’.
There are other cases which seem even less simple than this. For example, the aesthetics of some
street environment may well both affect and be affected by the number of individuals choosing a
mode to travel through that environment, yet there is probably no equivalent notion of a ‘real
effect’ that can be quantitatively estimated through engineering functions. On the other hand, if it
is possible to suggest relationships between broad levels of mode use and qualitative descriptors
of the aesthetics, then again it may be possible to compose this with the valuation of the aesthetic
qualities. While this is not such a common use of the survey methods used in transport, there is
still certainly a significant amount of potentially relevant literature on the valuation of aesthetics
(e.g. Ewing, 2001; Garrod et al, 2002; Ewing et al, 2005; Cao et al, 2009; Broach et al, 2012;
Wahlgren and Schantz, 2012), several of which also relate modal volumes to such valuations.
Turning to the third category identified in section 2.1, namely consequential mass effects, we may
again think of (.) as a composite function with individual valuation of the factors (as above), but
in this case combined with a function representing the actions of some other agent. Such an agent
may, for example, be a public transport operator which is able to adjust frequencies and fares in
response to patronage (e.g. Cantarella et al, 2012). There is considerable evidence of suitable
functions to represent economies of scale in public transport provision (Berechman and Giuliano,
Page 33
32
1985; Farsi et al, 2007; Di Giacomo and Ottoz, 2010), which if provided by a public, welfare-
maximising operator (or strongly-regulated private company) might be passed on as benefits to
travellers, and this chain of causes might be reflected in the function (.).
Finally, turning attention to the class of ‘information mass effects’, this class is distinctive in being
highly dependent on the conformity or social effects in (4), rather than on the mass effects as
reflected only through (.). This is the area in which our model is perhaps most tentative, as
quantitative approaches to such effects are still in their infancy. Nevertheless several theoretical
approaches which admit statistical estimation have been proposed in the literature, and a number
of these have been applied and functional forms estimated (though not in the present
transportation context). Brock and Durlauf (2001) proposed an extension to the conventional
random utility model by including an additional, additive function to the usual individual utility and
random component, which they called the ‘social utility’. They proposed several parametric forms
for the social utility function, and explored the theoretical implications for equilibrium and stability.
Fukuda and Morichi (2007) subsequently applied this approach in an econometric analysis of
illegal bicycle parking in Tokyo.
Topa (2001), on the other hand, proposed a discrete-time markov process model for representing
the exchange of information across social networks. An estimation procedure was proposed and a
model estimated based on data concerned with the spread of information about job openings in a
social network. Nakajima (2007), in a study which our approach perhaps most closely resembles,
also followed a markov process approach, developed from a definition of utility which included an
additive conformity effect. Statistical estimation procedures were proposed, and the resulting
dynamic model estimated in application to data on peer effects in the decision to take up smoking.
In addition to these reported applications, strong theoretical frameworks for analysing social
interactions are emerging, and in this respect we would especially point to the works of Manski
(2004) and Maccheroni et al (2012), both of which would seem to have considerable potential for
future exploitation within the context considered in the present paper, and each of which provide
formal frameworks in which we may specify and estimate models, given the availability of suitable
data.
Page 34
33
6. Conclusions
In this paper we discussed the potential importance of mass effects for travel demand forecasting.
Based on previous literature, we have assumed that various mass effects might lead to positive or
negative trends that could significantly influence travel demand over time (such as the uptake of
sustainable modes). We describe the mobility decisions of individuals in this paper hence as a
dynamic process, considering positive and negative feedback from other travellers as well as the
transport system itself. We have proposed that such mass effects may be particularly relevant to
demand forecasting applications over longer time-scales, and in the context of promoting
presently little-used or new travel modes.
In order to illustrate and examine this approach, we have presented a hypothetical model in which
individuals belonging to one of two population groups, termed “leader” and “follower”, have the
choice between two lifestyle options, referred to as car-oriented and transit-oriented. Though our
model is clearly too simple for direct applications, we believe that already with such a simple
model our case study illustrates and raises the profile of some important aspects that are known
and have been discussed in the literature, but, to our knowledge, have not been included in travel
demand modelling approaches.
We illustrate with our case study that despite lower intrinsic utility for transit, significant changes
towards transit can be achieved by considering congestion, service improvements and trend
effects. We further illustrate that mass effects do not always have to be positive. Unsustainable
mass effects, such as the perception of the car as a status symbol might be difficult to be
overcome and can make it difficult for new (attractive) modes to obtain significant market shares.
This result is also in line with findings by Sunitiyoso et al (2011b) who show with a simulation study
that social learning can lead to positive or negative effects. Our study considers not only
information mass effects but also consequential mass effects, in the form of transit service
improvements. This illustrates that the combination of mass effects together with service
improvements might be the formula to achieve the best results.
There are several functional forms and parameters in our model that would need calibration in
order to apply this method to real-life case studies, and in Section 5.2 we have reviewed and
Page 35
34
discussed the potential for calibrating such approaches. Several parameters might further be
described as policy variables. In particular might be interpreted as being related to TDM
measures; in such an interpretation, might be related to usage-based charging of non-
sustainable modes, such as petrol taxes, and might be related to the service improvement of a
sustainable mode in line with an increasing demand for that mode.
Our work clearly could be extended in various directions. A number of model simplifications in our
case study are apparent and might need to be addressed depending on the application. An
obvious extension would be to consider more than two choices and, possibly more importantly,
more than two population groups. We also did not consider any geographical considerations or
discuss particular forms of social networks. Furthermore, mass effect functions are not necessarily
constant over time as we noted in our discussion on calibration of perceived mass effects.
Even with this simplified model some modifications could be tested though and theoretical
advances made. The current analysis does not include a theoretical stability analysis; such an
analysis in the future might explore the sensitivity of the stability to the parameter settings as well
as the probability distribution of different (stable or unstable) population states. Achieving the
latter is the aim of the “master equation approach”. Initial tests suggests that in our analysis most
solutions are stable though a mathematical proof appears difficult to achieve with our logit
formulation of transition probabilities. Connected to this, and possibly even more important to
know for transport planners, are possible system bifurcation points as presented in the “fashion
model” by Nakayama and Nakayama (2004) for a simplified utility function where the population
is not divided into groups. We leave this also open for further work.
Finally, regarding our presumed choice behaviour, we assume a logit model for transition
probabilities and showed this is equivalent to the perturbed best response used in the
evolutionary game theory literature. Alternative assumptions on agent behaviour are possible, and
we believe that in particular replicator dynamics might be an alternative worthy of further
exploration. Replicator dynamics assume that an agent either sticks to the current choice or
changes (with some probability) to the choice of an agent (s)he meets. Therefore replicator
dynamics do not assume knowledge of non-chosen alternatives, which might be particularly
Page 36
35
appropriate for modelling the uptake of new transport schemes with which the modelled
population has not yet had much experience.
References
Abou-Zeid, M., Schmöcker, J.-D., Belgiawan, P.F. and Fujii, S. (In press). Mass Effects and Mobility
Decisions. Accepted for publication to Transportation Letters: The International Journal of
Transportation Research.
Adams, J. (1987). Smeed's Law: some further thoughts. Traffic Engineering and Control 28, 70–73.
Ajzen, I. (1991). The theory of planned behavior. Organizational Behavior and Human Decision
Processes, 50, 179-211.
Anable, J., Brand, C., Tran, M. and Eyre, N. (2012). “Modelling transport energy demand: A socio-
technical approach.” Energy Policy. 41, 125-138.
Axhausen, K.W. (2008). Social Networks, mobility biographies, and travel: survey challenges.
Environment and Planning B, 35, 981-996.
Arentze T. and Timmermans H. (2008). Social networks, social interactions, and activity-travel
behaviour: a framework for microsimulation. Environment & Planning B 35, 1012-1027.
Bamberg, S., Fujii, S., Friman, M. and Gärling, T. (2011). Behaviour theory and soft transport policy
measures. Transport Policy, 18(1), 228-235.
Bartle, C. (2011). Spreading the Word, A social-psychological exploration of word-of-mouth
traveller information in the digital age. PhD Thesis, University of West of England. Available from
<http://www.transport.uwe.ac.uk/reports/bartle_2011_thesis.pdf> [Accessed April 2012].
Bass, F.M., (1969). A New Product Growth for Model Consumer Durables. Management Science
Vol 50, No.12 Supplement, December 2004, 1825-1832.
Ben-Akiva, M. and Lerman, S.R. (1985). Discrete Choice Analysis: Theory and Applications to Travel
Demand. MIT Press, London, England.
Page 37
36
Berechman, J. and Giuliano, G. (1985). Economies of scale in bus transit: A review of concepts and
evidence. Transportation 12, 313-332.
Blickstein S and Hanson S (2001). Critical mass: forging a politics of sustainable mobility in the
information age. Transportation 28, 347-362.
Bordley, R.F. (1990). The dogit model is applicable even without perfectly captive buyers.
Transportation Research B, 24(4), 315-323.
Boyce, D.E. and Williams, H.C.W.L. (2003). Urban Travel Forecasting in the USA and the UK. In:
Methods and Models in Transport and Telecommunications: Cross Atlantic Perspectives, A.
Reggiani and L. Schintler (eds), Springer, Berlin, 2005, 25-44.
Broach, J., Dill, J. and Gliebe, J. (2012). Where do cyclists ride? A route choice model developed
with revealed preference GPS data. Transportation Research A, in press.
Brock, W.A. and Durlauf S.N. (2001). Discrete Choice with Social Interactons. Review of Economic
Studies 68, 235-260.
Cairns, S., Sloman, L., Newson, C., Anable, J., Kirkbride, A. and Goodwin, P. (2008). Smarter
Choices: Assessing the Potential to Achieve Traffic Reduction Using ‘Soft Measures’. Transport
Reviews, 28(5), 593-618.
Cantarella, G.E and Cascetta, E. (1995). Dynamic Process and Equilibrium in Transportation
Networks: Towards a Unifying Theory. Transportation Science 29, 305-329.
Cantarella, G.E., Velonà, P. and Watling, D.P. (2012). Day-to-day dynamics and equilibrium stability
in a two-mode transport system with responsive bus operator strategies. Submitted for
publication.
Cantner U., Krüger, J. and Söllner, R. (2010). Product Quality, Product Price and Share Dynamics in
the German Compact Car Market. Jena Economic Research Papers, 024-2010.
Cao, X., Mokhtarian, P.L. and Handy, S.L. (2009). No Particular Place to Go: An Empirical Analysis
of Travel for the Sake of Travel. Environment and Behavior 41,233-257.
Page 38
37
Carrasco, J.A., Hogan, B., Wellman, B. and Miller, E. (2008). Collecting social network data to study
social activity-travel behavior: an egocentric approachEnvironment and Planning B: Planning and
Design, 35, 961-980.
Cho G, Rodríguez D A and Khattak A J (2009). The role of the built environment in explaining
relationships between perceived and actual pedestrian and bicyclist safety. Accident Analysis &
Prevention 41, 692–702.
Clarke M, Dix M and Goodwin P (1982). Some issues of dynamics in forecasting travel behaviour –
a discussion paper. Transportation 11, 153-172.
Department for Transport (2011). Behavioural Insights Toolkit. Produced by Social Research and
Evaluation division. Available online from < http://assets.dft.gov.uk/publications/behavioural-
insights-toolkit/toolkit.pdf> [Accessed October 2012].
Di Giacomo, M. and Ottoz, E. (2010). The Relevance of Scale and Scope Economies in the Provision
of Urban and Intercity Bus Transport. Journal of Transport Economics and Policy 44, 161-187.
Ettema, D.F. and Timmermans, H.J.P. (1997). Activity-Based Approaches to Travel Analysis.
Emerald Group Publishing.
Ewing, R. (2001).Using a Visual Preference Survey in Transit Design. Public Works Management
Policy 5, 270-280.
Ewing, R., King, M.R., Raudenbush, S. and Clemente, O.J. (2005). Turning Highways into Main
Streets: Two Innovations in Planning Methodology. Journal of the American Planning Association
71, 269-282.
Farsi, M., Fetz, A. and Filippini, M. (2007). Economies of Scale and Scope in Local Public
Transportation. Journal of Transport Economics and Policy 41, 345-361.
Frank, R. (2005). Positional Externalities Cause Large and Preventable Welfare Losses. American
Economic Review, 95(2), 137-141.
Page 39
38
Fukuda, D. and Morichi, S. (2007). Incorporating aggregate behaviour in an individual’s discrete
choice: An application to analysing illegal bicyle parking behaviour. Transportation Research A 41,
313-325.
Garrod, G.D., Scarpa, R. and Willis, K.G. (2002). Estimating the Benefits of Traffic Calming on
Through Routes: A Choice Experiment Approach. Journal of Transport Economics and Policy 36,
211-231.
Goetzke, F. and Rave, T. (2011). Bicycle Use in Germany: Explaining Differences between
Municipalities with Social Network Effects. Urban Studies, 48(2), 427-437.
Goldstein, JH, Cialdini, R J and Griskevicius, V (2008). A Room with a Viewpoint: Using Social Norms
to Motivate Environmental Conservation in Hotels. Journal of Consumer Research , Vol. 35, No. 3,
pp. 472-482
Hensher, D. and Chung, D. (2011). Road infrastructure and institutional reform: tolling and pricing.
In: International Handbook of Network Industries, Edt. Finger, M. and Künneke, R.W., Edward
Elgar Publishing, Chapter 15, 252-268
Herrera J C, Work D B, Herring R, Ban X, Jacobson Q & Bayen A M (2010). Evaluation of traffic data
obtained via GPS-enabled mobile phones: The Mobile Century field experiment. Transportation
Research C 18, 568–583.
Hofbauer, J. and Sigmund, K. (2003). Evolutionary Game Dynamics. Bulletin of the American
Mathematical Society, 40, 479-519.
Jacobsen P L (2003). Safety in numbers: more walkers and bicyclists, safer walking and bicycling.
Injury Prevention 9: 205–209.
Jalilvand, M.R., Esfahani, S.S. and Samiei, N. (2011). Electronic Word-of-Mouth: Challenges and
Opportunities. Procedia Computer Science, 3, 42-46.
Leden L. (2002). Pedestrian risk decreases with pedestrian flow. A case study based on data from
signalized intersections in Hamilton, Ontario. Accident Analysis and Prevention 34: 457–464.
Page 40
39
Maccheroni, F., Marinacci, M. and Rustichini, A. (2012). Social Decision Theory: Choosing Within
and Between Groups. Review of Economic Studies, in press.
Mahajan, V., Muller, E. and Srivastava, R. K. (1990). “New product diffusion models in marketing: A
review and directions for research.” Journal of Marketing. 54(1), 1-26.
Manrai, L.A. and Manrai, A.K. (1995). Effects of Cultural-Context, Gender, and Acculturation on
Perceptions of Work versus Social/Leisure Time Usage. Journal of Business Research 32(2), 115-
128.
Manski, C.F. (2004). Social Learning from Private Experiences: The Dynamics of the Selection
Problem. Review of Economic Studies 71, 443-458.
McCarthy P (2001). Effect of speed limits on speed distributions and highway safety: a survey of
recent literature. Transport Reviews 21, 31-50.
Mohring H. (1972). Optimization and Scale Economies in Urban Bus Transportation. American
Economic Review 62, 591-604.
Nakajima, R. (2007). Measuring Peer Effects on Youth Smoking Behaviour. Review of Economic
Studies 74, 897-935.
Nakayama, S. and Nakayama, Y. (2004). A Fashion model with social interaction. Physica A 337,
625-634.
Ngoduy D., Watling D., Timms P. and Tight M. (2013). Dynamic Bayesian belief network to model
the development of walking and cycling schemes. International Journal of Sustainable
Transportation 7(5), 366-388.
Nyborg, K. and Rege, M. (2003). On social norms: the evolution of considerate smoking behavior.
Journal of Economic Behavior & Organization, 52(3), 323-340.
Ortuzar, J. and Willumsen, L. G. (1994). Modelling Transport. Wiley: Chichester.
Páez A & Scott D M (2007). Social influence on travel behavior: a simulation example of the
decision to telecommute. Environment & Planning A 39, 647 – 665.
Page 41
40
Richter, J., Friman, M. and Gärling, T. (2011). Soft Transport Policy Measures. Gaps in Knowledge.
International Journal of Sustainable Transportation, 5(4), 199-215.
Robinson, D. (2005). Safety in numbers in Australia: More walkers and bicyclists, safer walking and
cycling. Health Promotion Journal Australia 16, 47–51.
Sandholm, W.H. (2011). Population Games and Evolutionary Dynamics. MIT Press: Cambridge.
Sethi, R. and Somanathan, E. (1996). The evolution of social norms in common property resource
use. American Economic Review, 86(4), 766–789.
Shladover S. E., Polatkan G., Sengupta R., Van der Werf J., Ergen M. and Bougler B. (2007).
Dependence of Cooperative Vehicle System Performance on Market Penetration. Transportation
Research Record 2000, 121-127.
Sloman, L., Cairns, S., Newson, C., Anable, J., Pridmore, A. and Goodwin, P. (2010). Effects of
Smarter Choices Programmes in the Sustainable Travel Towns. Department for Transport.
Smeed, R. J. (1949). Some statistical aspects of road safety research. Journal of the Royal Statistical
Society A 112, 1-34.
Stopher, P.R. (2004). Reducing Road Congestion: A reality check. Transport Policy, 11(2), 117-131.
Sparks, B.A. and Browning, V. (2011). The impact of online reviews on hotel booking intentions
and perception of trust. Tourism Management, 32, 1310-1323.
Sunitiyoso, Y., Avineri, E. and Chatterjee, K. (2011a). The effect of social interactions on travel
behaviour: An exploratory study using a laboratory experiment. Transportation Research Part A,
45(1), 332-345.
Sunitiyoso, Y., Avineri, E. and Chatterjee, K. (2011b). On the potential for recognising of social
interaction and social learning in modelling travellers’ change of behaviour under uncertainty,
Transportmetrica, 7(1), 5-30.
Thørgersen, J. (2007) Social Marketing of Alternative Transportation Modes. In Threats from Car
Traffic to the Quality of Urban Life, Edt. Gärling, T. and Steg, L., Elsevier, Chapter 23, 367-382.
Page 42
41
Topa, G. (2001). Social interactions, Local Spillovers and Unemployment. Review of Economic
Studies 68, 261-295.
Wahlgren, L. and Schantz, P. (2012). Exploring bikeability in a metropolitan setting: stimulating and
hindering factors in commuting route environments. BMC Public Health 12, 168.
Walker, J. L., Ehlers, E., Banerjee, I., and Dugundji, E. R. (2011). “Correcting for endogeneity in
behavioral choice models with social influence variables.” Transportation Research Part A. 45(4),
362-374.
Watling, D. (2010). Dynamic Process Models for Long-Range Transportation Planning. Presented at
DTA2010, the 3rd International Symposium on Dynamic Traffic Assignment, Takayama, Japan, 29–
31 July 2010.
Weidlich, R. (2000). Sociodynamics. Dover Publications, Mineola, New York.
Weinberger, R. and Goetzke F. (2011). Drivers of Auto Ownership: The Role of Past Experience and
Peer Pressure. In: Auto Motives – Understanding Car Use Behaviours. Edited by Lucas K.
Blumenberg, E. and Weinberge R., Emerald Group Publishing.
Whelan, G. (2007). Modelling Car Ownership in Great Britain. Transportation Research A, 41,205-
219.
Zhang, Y., Stopher, P. and Halling, B. (2012). Evaluation of south-Australia's TravelSmart project:
Changes in community's attitudes to travel. Transportation Policy. In press.
Page 43
42
Author Biographies Jan-Dirk Schmöcker is an Associate Professor in the Department of Urban Management at Kyoto University since 2010. Previously he held positions at Tokyo Institute of Technology and Imperial College London where he also obtained his PhD. This paper has been motivated by a number of projects on the impact of social influences on decision making. His other current main research interests include public transport assignment, route choice and connections to network reliability. In this journal he previously published on travel behaviour of older persons. Tsuyoshi Hatori is an Associate Professor in the Department of Civil and Environmental Engineering at Ehime University since 2011. Before he worked at Tokyo Institute of Technology and he received his PhD from Kyoto University in 2006. His research interests are mainly related to game theoretical modelling of conflict analysis and social psychological approaches to promote pro-social behaviour by addressing problems of social dilemmas and consensus building around social decision making. David Watling is Centenary Professor of Transport Analysis at the Institute for Transport Studies, University of Leeds, a post he has held since the chair’s instigation in 2004. A mathematician and statistician by training, his research is concerned with the development of mathematical modelling and analysis techniques to address problems across the transportation field, especially those concerning networks. More recently, he has developed a strong interest in developing qualitative and quantitative methods for modelling, imagining and planning long-term transport futures.