23
1

1

2

3

4
Better Buses Action Plan
• Improve bus speeds by 25%
• Install 10-15 miles of new bus
lanes per year
• Improve 5 miles of existing bus
lanes per year
• Support MTA Bus Network
Redesign efforts with borough
bus priority plans

5
Bus Priority Corridors
• NYC DOT analyzed Bronx
corridors to determine where
bus lanes and other bus
priority are most needed
• University Ave was identified
as a top Bronx corridor
• High ranking due to:
‒ High ridership & high
volume of buses
‒ Slow and unreliable bus
service
‒ Important cross-
borough connections

6
Community Engagement to Date
Outreach
Community Board 7
• November 2019 – Full Board: MTA Bronx Bus Redesign
• April 2020 – Transportation Committee: Potential treatments
for University Ave – North
• July 2021 – Virtual meeting with CB 5 District Manager + CB 7
Committee Chair: Revised potential treatments

7
•
•
•
•
•

8
Bus Speeds
Issues Identified Along University
Ave: Slow Bus Speeds
• Average southbound bus
speeds during AM peak
(7AM – 10AM) range from
5.4 – 7.1 mph
Source: MTA

9
Bus Speeds
Issues Identified Along University
Ave: Slow Bus Speeds
• Average northbound bus
speeds during PM (3PM – 7PM)
peak range from 4.2 – 5.8 mph
Source: MTA
CB 5
Source: MTA

10
24% (nearly 1.6 million) of adult New
Yorkers ride a bike regularly
540,000 daily cycling commuting trips
in 2019+116% growth (2008-2018)
+35% growth (2013-2018)
15% of New Yorkers use bike share(Mobility Survey, 2018)
Citi Bike regularly serves over 80,000
trips per day; 19.5 million trips in 2020

11
Vision Zero Priority Area
University Ave, E Tremont Ave to E 181st StInjury Summary, 2014-2018 (5 years)
Total
Injuries
Severe
InjuriesFatalities KSI
Pedestrian 24 1 1 2
Bicyclists 12 1 0 1
Motor Vehicle
Occupant 161 2 1 3
Total 197 4 2 6
Fatalities, 01/01/2014 – 01/07/2021: 3
● 197 people have been injured,
including 4 severely, and 2 killed
in 0.6 miles
● This section of University Ave
ranks in the top 33% for killed or
severely injured (KSI) in all of the
Bronx
● In 2020, 22 cyclists were killed
citywide; 8 were killed in the Bronx

12
Protected Bike Lanes Before and After Crash Data, 2007 - 2017
-15%
3%
-21%-15%
Data from 25 separate protected bicycle lane projects installed from 2007-2014 with 3 years of after data. Includes
portions of 1 Ave, 2 Ave, 8 Ave, 9 Ave, Broadway, Columbus Ave, Hudson St, Lafayette St / 4 Ave, Sands St, Allen/Pike
St, Kent Ave, Prospect Park West, Flushing Ave, Bruckner Blvd & Longfellow Ave, Imlay St / Conover St, Paerdegat Ave.
Only sections of projects that included protected bike lanes were analyzed. Source: NYPD AIS/TAMS Crash Database
Broadway, BX
Multi-agency effort to reduce
traffic fatalities and injuries

13
Analysis of fatalities key factors (2014-Present):• 60% of fatalities happened at intersections; 23% involved a
vehicle turn; 16% involved a driver’s failure to yield the right of way
• Nearly 90% of fatalities happened on streets without bike lanes
Citywide Protected Bicycle Lane (PBL) Network • Build 30 miles of protected bicycle lane annually, guided by a
PBL vision document.
Better Design:• Implement new design standards based on national &
international best practices to enhance safety at intersections.
• Continue piloting new designs with rigorous safety analysis
Education and Outreach:• Launch next phase of Vision Zero public awareness campaign,
educating drivers with a focus on cyclist safety — and expand the
“Get There” bicycle encouragement/rules of the road campaign
• Educate all street users about safe truck operation on city streets
• Increase helmet giveaways and helmet use encouragement.

14
• Challenging street grid with few direct
through routes. Minimal bike facilities.
• University Ave provides critical
connection between protected bike lanes
on University Ave (south of Tremont Ave)
and Aqueduct Walk
• Connection to major destinations
including the Washington Ave Br and
Bronx Community College
• Future connections to the Fordham
Area Bike Network
• University Ave is highlighted as a priority
corridors in Connecting Communities: A
Vision for the Harlem River Bridges report
released in 2016

15
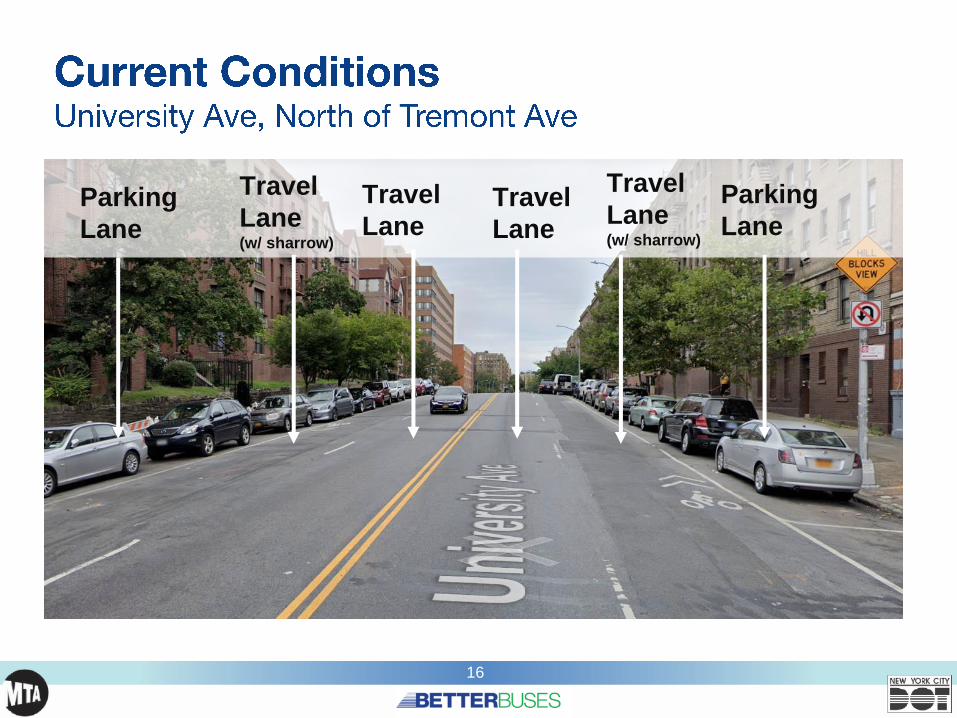
16
Parking
Lane
Travel
Lane (w/ sharrow)
Travel
Lane
Parking
Lane
Travel
Lane (w/ sharrow)
Travel
Lane

17
• Bikes diverted
to Aqueduct
Walk
• Sharrows to
be removed
• Install offset
bus lanes in
each direction
• Segment
~4500 (0.9
miles)

18
• Two-way bike path on eastern curb
• 1 bus lane + 1 travel lane in each direction
• Segment ~780 ft (2 blocks)

19
• Two-way bike path on
eastern curb
• Dedicated bus lanes in
each direction
• Concrete boarding
island at northbound
bus stops
• Parking lane on the
western curb is
remaining width is
under 11’
• Segment ~1800 ft
(0.34 miles)

20
•
•
•
•
•

21

2222
•
•
•
•
•
•
•

23
NYC DOT NYC DOT nyc_dot NYC DOT


