30
SBi 2010:23 University Buildings and Energy Labelling Directives for and benchmarking of energy demand CREDIT Case DK04
SBi 2010:23
University Buildings and Energy LabellingDirectives for and benchmarking of energy demandCREDIT Case DK04


SBi 2010:23 Danish Building Research Institute, Aalborg University · 2010
University Buildings and Energy Labelling Directives for and benchmarking of energy demand
CREDIT case DK04
Anne Kathrine Frandsen Niels Haldor Bertelsen Kim Haugbølle Ib Steen Olsen
Title University Building and Energy Labelling Subtitle Directives for and benchmarking of energy demand SBi 2010:23 Serial title CREDIT Case DK04 Edition 1 edition Year 2010 Authors Anne Kathrine Frandsen, Niels Haldor Bertelsen, Kim Haugbølle, Ib Steen Olsen Language English Pages 26 References Page 26 Key words University buildings, energy labelling, building, enterprises, benchmarking ISBN 978-87-563-1433-6 Photos/drawings Cover Energimærkningsordningen, Energistyrelsen Publisher Statens Byggeforskningsinstitut
Danish Building Research Institute Dr. Neergaards Vej 15, DK-2970 Hørsholm E-mail [email protected] www.sbi.dk
Extracts may be reproduced but only with reference to source: Frandsen, A. K. et al. (2010). University Building and Energy Labelling. Directives for and benchmarking of energy demand. CREDIT Case DK04 (SBi 2010:23). Hørsholm: Danish Building Research Institute, Aalborg University.
3
Contents
Contents ..........................................................................................................3 Preface ............................................................................................................4 Summary .........................................................................................................5 1. Introduction and objectives..........................................................................7
1.1 Objectives of CREDIT...........................................................................7 1.2 Background, purpose and focus of the case study ..............................8 1.3 Research design and methods applied in the case study ....................8
2. Buildings – assessments in construction or real estate processes...........10 2.1 The actual building, building parts and processes .............................10 2.2 The applied assessments and tools in the processes........................11 2.3 Cost and performance indicators applied in the processes................12 2.4 Relation to different enterprises and national benchmarking .............12 2.5 Visions and innovation for future improvements.................................13
3. Enterprises – assessments and indicators internally applied ...................14 3.1 The actual enterprise, company and firm ...........................................14 3.2 Assessments and tools in the enterprise............................................15 3.3 Costs and performance indicators applied in the enterprise ..............15 3.4 Relation to building cases and national benchmarking ......................16 3.5 Visions and innovation for future improvements.................................17
4. National benchmarking – indicators, assessment and organisation.........18 4.1 The actual benchmarking organisation and its purpose.....................18 4.2 Assessments applied in the benchmarking organisation ...................19 4.3 Cost and performance indicators applied in benchmarking ...............19 4.4 Relation to enterprises, building projects and real estate...................21 4.5 Visions and innovations for future improvements...............................21
5. Discussions and conclusions ....................................................................23 5.1 Lessons learned in construction and real estate processes and recommendations for WP4 .......................................................................23 5.2 Lessons learned in enterprises, companies and firma and recommendations for WP5 .......................................................................24 5.3 Lessons learned in national benchmarking organisations and recommendations for WP 6 ......................................................................25
Reference......................................................................................................26
4
Preface
This report describes the results of a case study undertaken as part of the Nordic/Baltic project CREDIT: Construction and Real Estate – Developing Indicators for Transparency. The case study is part of the work in work pack-age 4-6 with respect to project assessment tools, application in firms and na-tional benchmarking systems. CREDIT includes the most prominent research institutes within benchmark-ing and performance indicators in construction and real estate, namely SBi/AAU (Denmark), VTT (Finland), Lund University (Sweden) and SINTEF (Norway). Further, three associated partners have joined CREDIT. The three associated partners are the Icelandic Center for Innovation (Iceland), Tallinn University of Technology (Estonia) and Vilnius Gediminas Technical Univer-sity (Lithuania). The project has been managed by a steering committee consisting of the fol-lowing persons: – Kim Haugbølle, SBi/AAU (project owner). – Niels Haldor Bertelsen, SBi/AAU (project coordinator). – Pekka Huovila, VTT. – Päivi Hietanen, Senate Properties – Ole Jørgen Karud, SINTEF. – Magnus Hvam, SKANSKA. – Bengt Hansson, Lund University. – Kristian Widén, Lund University. The project group wishes to thank our industrial partners and all the con-tributors to the case studies. In particular, the project group wishes to thank the four Nordic funding agencies that sponsored the project as part of the ERABUILD collaborative research funding scheme: The Nordic Innovation Centre (NICe), TEKES in Finland, FORMAS in Sweden and the Danish En-terprise and Construction Authority (Erhvervs- og Byggestyrelsen) in Den-mark. Danish Building Research Institute, Aalborg University Department of Construction and Health August 2010 Niels-Jørgen Aagaard Research director
5
Summary
This report describes a case study of how energy efficiency is furthered by directives in the University and Property Agency (UBST) and by the public mandatory energy label system EMO on building, enterprise level.
Buildings (WP4) At building level (WP4) the assessment is based on a set of indicators de-fined by the SBi guideline 213 and SBi energy calculation programme Be06 that the Danish building regulations refer to. The indicators are 3.1- Category of building, 4.1- Category of building parts, 4.4 -Thermal quality , and 7.1 – resources in CREDIT Indicators Classification. The assessments are done after briefing, design, construction and handing over and FM in relation to CREDIT Carpenter model by energy consultant (impartial third part). The assessments and the documentation are used in different ways depending on when in the process the assessments and documentation is carried out. In the initial phases (briefing and design) they are used as a point of departure for testing alternative solutions. Later in the process the assessments are used for control.
The case shows: – That there are available methods and tools for the quality management of
buildings energy efficiency and experience in using these methods (the use of SBi guideline 213 and be 06 has been mandatory in the planning process since the latest Danish building regulations (BR 08) came in 2008).
– That there are methods of applying the calculations in the planning proc-ess. Though UBST are changing the directives, they do not change the application method (the documentation and implementation and that it is a third part (energy consultant) that is making the assessment).
– That the level of detail is something to be aware of. UBST are leaving out the orientation points in their new directives acknowledging that there are many ways of achieving a high level of energy efficiency in buildings.
Enterprise (WP5) At enterprise level the report looks at the three methods and tools applied by UBST in relation to energy management that cover the whole building proc-ess from briefing to the use and facility management. – The UBST directives for energy efficient building are a quality manage-
ment tool (in relation to CREDIT Carpenter model before and after brief-ing, after design, construction and once during FM).
– EMO label UBST uses as a planning tool in the renovation and mainte-nance (FM in CREDIT Carpenter model).
– A energy monitoring tool 'My energy' that allows them and the person re-sponsible in the particular building to follow the consumption room by room and observe irregularities and defects (FM in CREDIT Carpenter model). The registrations are used as a basis for calculating energy cost and budgets on the individual buildings and on the ministry as a whole and as submission data to EIS.
The indicators in UBST directives and EMO are basically the same defined by the SBi guideline 213 and SBi the calculation programme Be 06 (the indi-cators in relation to CREDIT indicator classification see under WP4)
6
The indicator in 'my energy' relates to 7.1 resources in CREDIT indicator classification. The case shows: – It is not yet possible to conclude how the directives works as a quality
management tool for UBST because the experience with the UBST direc-tives for energy efficient building is only from the initial phases of the building process. But one thing is worth mentioning. The directives are al-ready being revised, because it is too detailed in relation to the point of orientation and because the ambitions for the energy efficiency level are not high enough. These points at the importance of being aware of what the level of detail that is relevant in such tools.
– That EMO label and the included report with the suggestions for im-provements regarding energy efficiency form a useful tool for UBST in their planning of energy renovations and maintenance of their buildings.
– That tools and systems that only registers the resource consumption in relation to square meters (such as 'my energy' and EIS) apparently are lacking other information in order to be relevant for benchmarking re-source consume between buildings. UBST do not compare the consump-tion of one building with another in their portfolio registered in 'My energy' or with other state buildings registered in EIS.
National benchmarking (WP6) At system level the report looks at EMO - a public mandatory energy label-ling system that covers all building that exceed 60 m², but only half of the covered building are labelled. The assessment methods are the same as in UBST directives; SBI guideline 213 and the calculation programme Be 06. Input data is in the CREDIT indicator classification 3.1- Category of building, 4.1- Category of building parts, 4.4 -Thermal quality based on drawings and on site inspections of the building in order to see the building parts' and ma-terials' heat capacity, transmission. Output data is the calculated level of re-source consumption in kWh per m² (In CREDIT indicator classification 7.1 – resource) levelled in 7 classes (A1-G) together with a written report with sug-gestions for energy saving improvements. The assessment of the building is made by an authorized energy consultant, paid by the owner based on an inspection of the building, drawings and specifications of the building and building parts. In relation to CREDIT the case shows: – That there are well established indicators on energy demand and con-
sumption in the sector that are applicable in relation to benchmarking. – Points at the problem involved in a mandatory system that is without
sanctions when building owners do not meet their obligations. – The weaknesses in a system that is based on the incentive the owner
gets from the labelling report on his building, if the profitability of the sug-gestions in these reports is not significant.
7
1. Introduction and objectives
This chapter describes the objectives of the CREDIT project, the back-ground, scope and purpose of the case study of search engines for private homes, and the research design of the study.
1.1 Objectives of CREDIT
Sir Winston Churchill once said, “We shape our buildings, afterwards our buildings shape us” (28th Oct 1943). This quotation underlines how strong a building can influence an occupier or a user. Providing complex public facili-ties for example hospitals, schools, universities and libraries that are able to meet both the internal and external stakeholders’ needs and requirements is not without complications. The aims and demands of different stakeholders within a project can sometimes create conflict with each other’s interest. Un-derstanding the needs and requirements of these stakeholders are essential to remain competitive in today’s market. A client that pays attention to the needs of the end-users will be rewarded with a high-performance property. Simultaneously, this shift seeks to solve many ills associated with inade-quate building conditions and resulting in poor building function. Due to the amount of both public and private money being invested in deliv-ering public and private facilities, strong actions must be adopted. Collabora-tion with the relevant stakeholders will help building owners in identifying the required performance indicators to create high-performance facilities. The project aims to define a model for the implementation of performance re-quirements, which ensure the fulfilment of the various types of users’ and stakeholders’ needs and demands. The model shall also allow for the con-tinuous measuring of the effectiveness of the used requirements and the model as such so that it may be improved as more knowledge and experi-ence of it is achieved. Following the themes of the ERABUILD call closely, the aim of CREDIT is to improve transparency on value creation in real estate and construction. Thus, the objectives of CREDIT are: – To capture end user needs and requirements in order to identify and
quantify – where possible – value creation in real estate and construction. – To develop compliance assessment and verification methods. – To define and develop benchmarking methods and building performance
indicators in real estate and construction. – To set out recommendations for benchmarking internationally key building
performance indicators. Consequently, the deliverables of CREDIT are: – 1. The establishment of a network of Nordic and Baltic researchers for
benchmarking and performance indicators through frequent interactions in workshops across the Nordic and Baltic countries.
– 2. A State-of-the-Art report, that will identify and critically examine a num-ber of existing tools, databases, mandatory reporting, approaches and benchmarking schemes to capture and measure end-user needs, client and public requirements on performance and value creation.
8
– 3. A strategic management and decision making tool to guide the defini-tion and development of benchmarking methods and building perform-ance indicators in different business cases.
– 4. A comprehensive performance assessment and management tool with associated key performance indicators to capture end-user requirements and to continuously measure and verify the compliance of performance throughout the lifecycle of an actual building project and linked to building information models.
– 5. Recommendations as to how sectoral and/or national indexes for per-formance indicators can be designed in order to allow for international benchmarking of construction and real estate.
– 6. Dissemination of the lessons learned and tools developed through news articles, press releases, workshops with actors in the real estate and construction cluster etc.
1.2 Background, purpose and focus of the case study
The Danish University and Property Agency (UBST) has introduced new di-rectives regarding energy efficiency in new buildings. The employment of these new directives will be tested and evaluated during the planning of a university building in Kolding, University of Southern Denmark. All the buildings UBST administrates are included in the Energimærknings- ordningen EMO (Energy Labeling Scheme), a national labelling system that assesses the energy demand in all buildings that exceed 60 m². The purpose of this particular study on energy consumption in university buildings is to: – See how the specification and directive are assessed through the plan-
ning process – See how the indicators and management of the EMO match the UBST di-
rectives. – See how UBST uses EMO in their daily management of the portfolio of
buildings and how they monitor the energy consumption in all their build-ings.
– Analyse the implications of implementing benchmarking by using a gov-ernmentally driven key figure system
1.3 Research design and methods applied in the case study
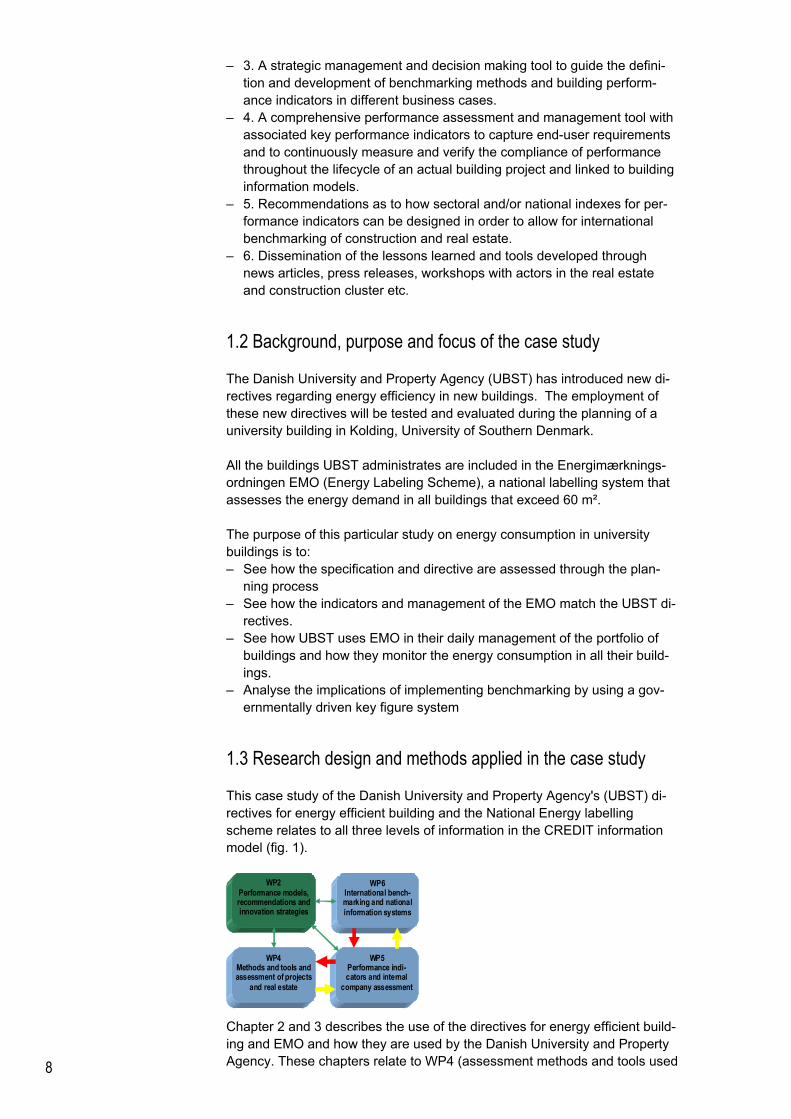
This case study of the Danish University and Property Agency's (UBST) di-rectives for energy efficient building and the National Energy labelling scheme relates to all three levels of information in the CREDIT information model (fig. 1).
WP4 Methods and tools and assessment of projects
and real estate
WP6 International bench-marking and national information systems
WP2 Performance models, recommendations and innovation strategies
WP5 Performance indi-cators and internal
company assessment
Chapter 2 and 3 describes the use of the directives for energy efficient build-ing and EMO and how they are used by the Danish University and Property Agency. These chapters relate to WP4 (assessment methods and tools used
9
in assessments on projects and real estate) and WP5 (Performance indica-tors and internal company assessment) in the CREDIT information model. Chapter 4 describes the Energy labelling system and is relevant in relation to WP6 (International benchmarking and national information systems).
Data and method The case study uses two types of data: – Qualitative research interviews with 2 persons – chief consultant Jens
Rømer Olsen from the Danish University and Property Agency and secre-tariat director Kaj Borggren from the FEM-secretariat (the common secre-tariat for inspection and labelling systems)
– Documentary material from UBST, SBi and Energy labelling system's website.
(Aggerholm et al, 2008), (Aggerholm & Grau, 2005), (UBST, 2009), (UBST & Syddansk Universitet, 2008), (Energistyrelsen, 2008), (Energistyrelsen, 2009), (FEM-skretariatet, 2008), (Togeby et al, 2008).
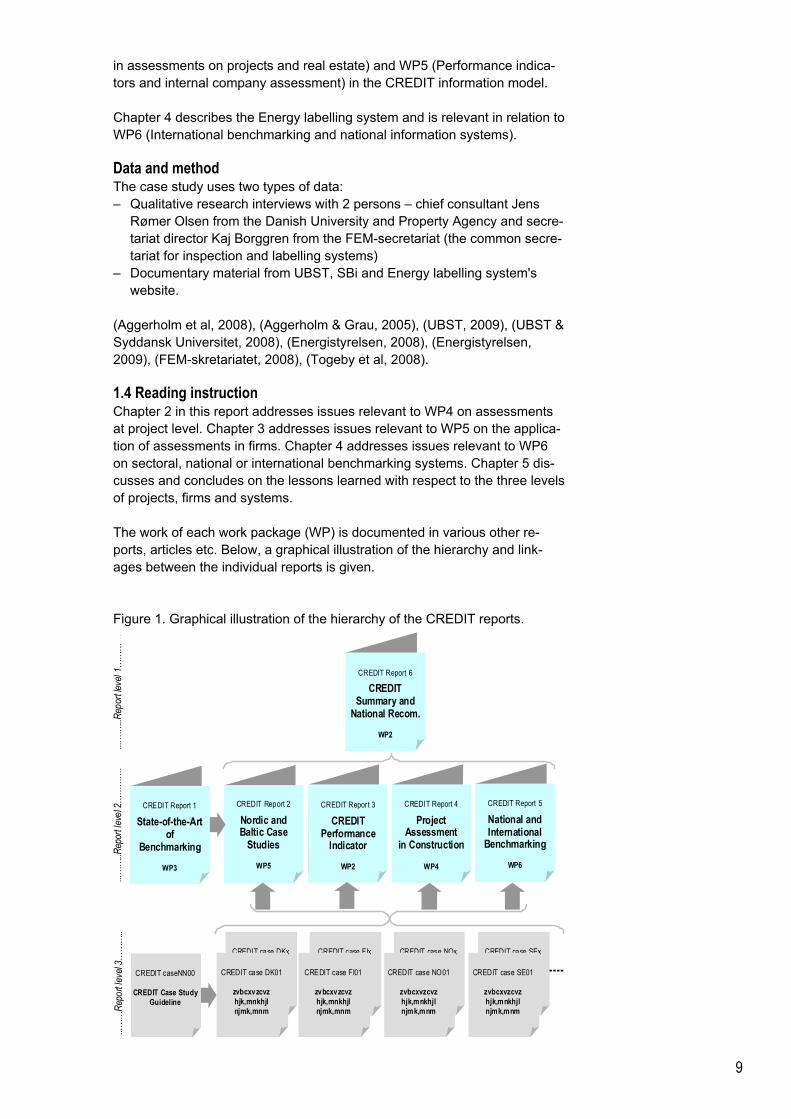
1.4 Reading instruction Chapter 2 in this report addresses issues relevant to WP4 on assessments at project level. Chapter 3 addresses issues relevant to WP5 on the applica-tion of assessments in firms. Chapter 4 addresses issues relevant to WP6 on sectoral, national or international benchmarking systems. Chapter 5 dis-cusses and concludes on the lessons learned with respect to the three levels of projects, firms and systems. The work of each work package (WP) is documented in various other re-ports, articles etc. Below, a graphical illustration of the hierarchy and link-ages between the individual reports is given. Figure 1. Graphical illustration of the hierarchy of the CREDIT reports.
CREDIT Report 1
State-of-the-Art of
Benchmarking
WP3
CREDIT Report 2
Nordic and Baltic Case
Studies
WP5
CREDIT Report 6
CREDIT Summary and
National Recom.
WP2
CREDIT case DKx
zvbcxvzcvz hjk ,mnkhjl njmk,mnm
CREDIT case SEx
zvbcxvzcvz hjk,mnkhjl njmk,mnm
CREDIT case NOx
zvbcxvzcvz hjk,mnkhjl njmk,mnm
CREDIT case FIx
zvbcxvzcvz hjk,mnkhjl njmk,mnm
CREDIT case DK01
zvbcxvzcvz hjk,mnkhjl njmk,mnm
CREDIT case FI01
zvbcxvzcvz hjk,mnkhjl njmk,mnm
CREDIT case SE01
zvbcxvzcvz hjk,mnkhjl njmk,mnm
CREDIT case NO01
zvbcxvzcvz hjk,mnkhjl njmk,mnm
....…
…..R
epor
t leve
l 1…
……
…
...…
…..R
epor
t lev
el 2
……
……
. ...
……
Rep
ort l
evel
3…
……
..
CREDIT Report 3
CREDIT Performance
Indicator
WP2
CREDIT caseNN00
CREDIT Case Study
Guideline
CREDIT Report 4
Project Assessment
in Construction
WP4
CREDIT Report 5
National and International
Benchmarking
WP6

10
2. Buildings – assessments in construction or real estate processes
In this chapter The Danish University and Property agency's directives for energy efficient building are described, with focus on the assessment method and tool and the indicators used in the assessment.
2.1 The actual building, building parts and processes
The competition about the University building in Kolding, a part of the Uni-versity of Southern Denmark, started in July 2008 and the winning project was published in October 2008. The building is planned to be finished by the summer 2013. The building in question is a university building for teaching, project meet-ings for the students, offices for researchers and teachers, administration, café, library, auditoriums. To minimize the energy consumption of the build-ing is a special concern in this project to a new built university building, and calculations and evaluations of the estimated energy consumption are made after every phase of the project, from the briefing to the handing over. Figure 2. Plan of the planned University building in Kolding, Henning Larsen Architects A/S
11
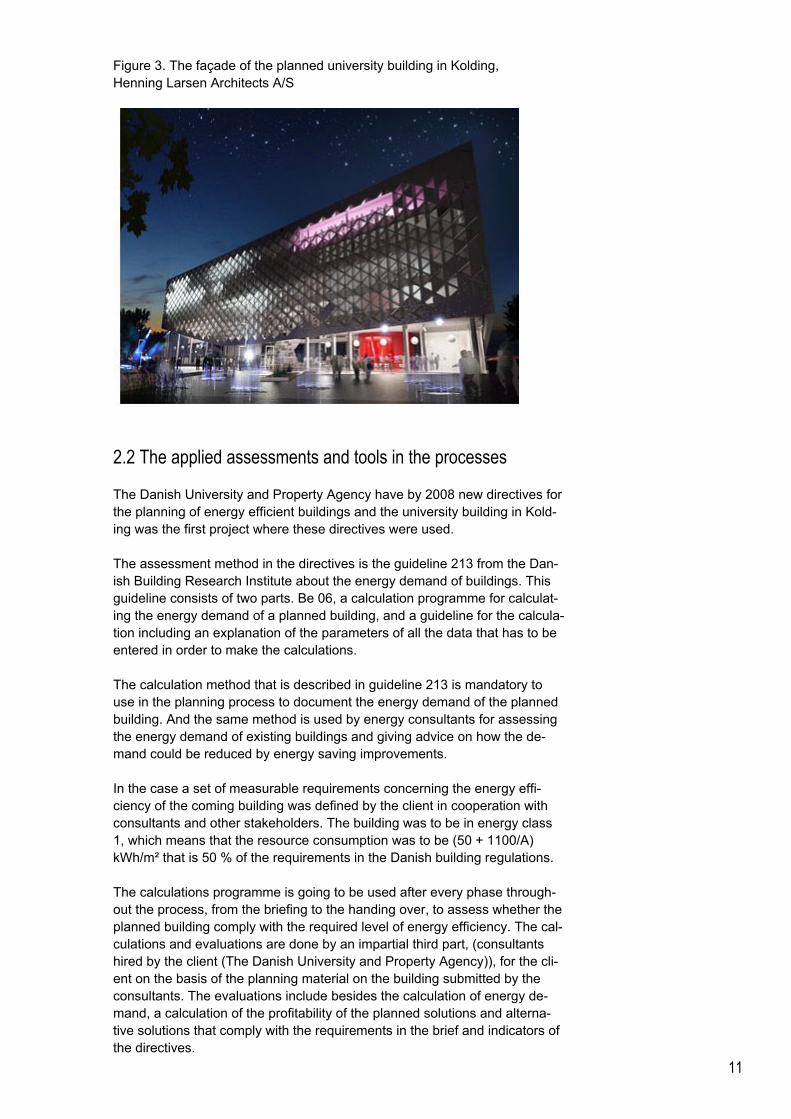
Figure 3. The façade of the planned university building in Kolding, Henning Larsen Architects A/S
2.2 The applied assessments and tools in the processes
The Danish University and Property Agency have by 2008 new directives for the planning of energy efficient buildings and the university building in Kold-ing was the first project where these directives were used. The assessment method in the directives is the guideline 213 from the Dan-ish Building Research Institute about the energy demand of buildings. This guideline consists of two parts. Be 06, a calculation programme for calculat-ing the energy demand of a planned building, and a guideline for the calcula-tion including an explanation of the parameters of all the data that has to be entered in order to make the calculations. The calculation method that is described in guideline 213 is mandatory to use in the planning process to document the energy demand of the planned building. And the same method is used by energy consultants for assessing the energy demand of existing buildings and giving advice on how the de-mand could be reduced by energy saving improvements. In the case a set of measurable requirements concerning the energy effi-ciency of the coming building was defined by the client in cooperation with consultants and other stakeholders. The building was to be in energy class 1, which means that the resource consumption was to be (50 + 1100/A) kWh/m² that is 50 % of the requirements in the Danish building regulations. The calculations programme is going to be used after every phase through-out the process, from the briefing to the handing over, to assess whether the planned building comply with the required level of energy efficiency. The cal-culations and evaluations are done by an impartial third part, (consultants hired by the client (The Danish University and Property Agency)), for the cli-ent on the basis of the planning material on the building submitted by the consultants. The evaluations include besides the calculation of energy de-mand, a calculation of the profitability of the planned solutions and alterna-tive solutions that comply with the requirements in the brief and indicators of the directives.
12
The assessments and the documentation are used a bit different depending on when in the process the assessments and documentation is done. 1 The level of efficiency is defined through the briefing process and is
documented in the brief. 2 The assessment of the first proposals submitted by the consultants is
discussed on a workshop with the client, users and experts besides the consultants presenting their proposal. The best alternative regarding en-ergy efficiency is chosen on the basis of this workshop.
3 After the design phase, a third assessment is made. This time the as-sessment and documentation include alternative solutions that could op-timize the energy efficiency of the planned building or the profitability of the solutions.
4 As a part of the handing over, it is assessed whether the completed building comply with the agreed level of energy efficiency.
5 The actual consumption of energy is registered through the first year of occupancy.
2.3 Cost and performance indicators applied in the processes
The indicators used in the assessment of energy efficiency are the energy demand limits defined in three classes of energy demand in the Danish building regulations 2008. The classes are defined by the overall energy demand of the building di-vided with the heated area of the building. The general energy demand level for offices, schools institutions and other buildings is 95 kWh pr. m² + 2200 kWh divided with m² heated area. Energy demand level 2 is 75 % of the general energy demand level, Energy demand level 1 is 50 % of the general energy demand level. The set of key figures that defines of the energy demand of the building are the indicators in the energy efficiency labelling system EMO. They concern the energy demand for heating the building, hot water, cooling, ventilation and if necessary lighting. (More details see chapter 4.3) The indicators in registered or assessed in order to assess the energy efficiency of the build-ing are 3.1- Category of building, 4.1- Category of building parts, 4.4 -Thermal quality , and 7.1 – resource use in CREDIT Indicators Classification.
2.4 Relation to different enterprises and national benchmarking
It is mandatory for The Danish University and Property Agency (UBST) to have all the buildings in their portfolio labelled with the national energy label EMO. The UBST's directives for energy efficient building are based on the key indicators as well as the calculation programmes developed and used to in the sector to asses whether new buildings comply with the demands in the buildings regulations and that is used in EMO to assess the calculated en-ergy efficiency of a building. The Danish University and Property Agency (UBST) has a large portfolio of teaching and university buildings both as owners and as facility managers. The operation of these many buildings gives access to information about the energy demand and consumption of the many buildings. This information is mandatory to collect and deliver to the national energy monitoring system
13
(EIS) for all buildings run or owned by the state. The knowledge gained by monitoring the energy consumption and having the buildings energy demand labelled, makes it possible to know how specific functions of a building such as e.g. laboratories, affect the energy consumption, a knowledge that is used in the briefing process making the decision about what level of energy efficiency the new building has to reach. Both the estimated and the actual costs of the new university building that is planned to have a energy demand of 50 kWh per square meter (energy level 1 in the Danish Building regulations 2008) will be used as a guidance for the expenses for increased energy efficiency in building, both within the Danish University and Property Agency and by the consultants.
2.5 Visions and innovation for future improvements
The objective with the Directives for energy efficient building is to establish an experience with different solutions for energy efficient building and gain knowledge about whether the level of ambition is reachable and it raises the costs? Such a knowledge is valuable for the UBST themselves as well as for other public authorities in charge of public buildings. The Danish University and Property Agency's (UBST) directive for energy ef-ficient buildings is according to Jens Rømer Olsen judged too detailed and elaborated by themselves. Therefore it is going to be replaced by new direc-tives (Energy Strategy of the Danish University and Property Agency 2009 - 2028), before it has been used all the way through a building project. Mainly it is the level of ambition is increased that is changed as well as the level of detail from the directive to the energy strategy acknowledging that a level of energy consumption of a building can be reached in many different ways. The assessment tool Be06 is the same in the new energy strategy as it was in the directives for energy efficient buildings. The assessment method is also the same with calculations of the energy demand of the planned build-ing made after every phase in the building process from the brief to the handing over done by an impartial third part. Another aim with establishing a system for assessing the energy demand in a planned building through the building process is to gain experience and knowledge about assessment methods. A knowledge UBST will use to es-tablish assessments in the building process of other performance parame-ters of a planned building.
14
3. Enterprises – assessments and indicators internally applied
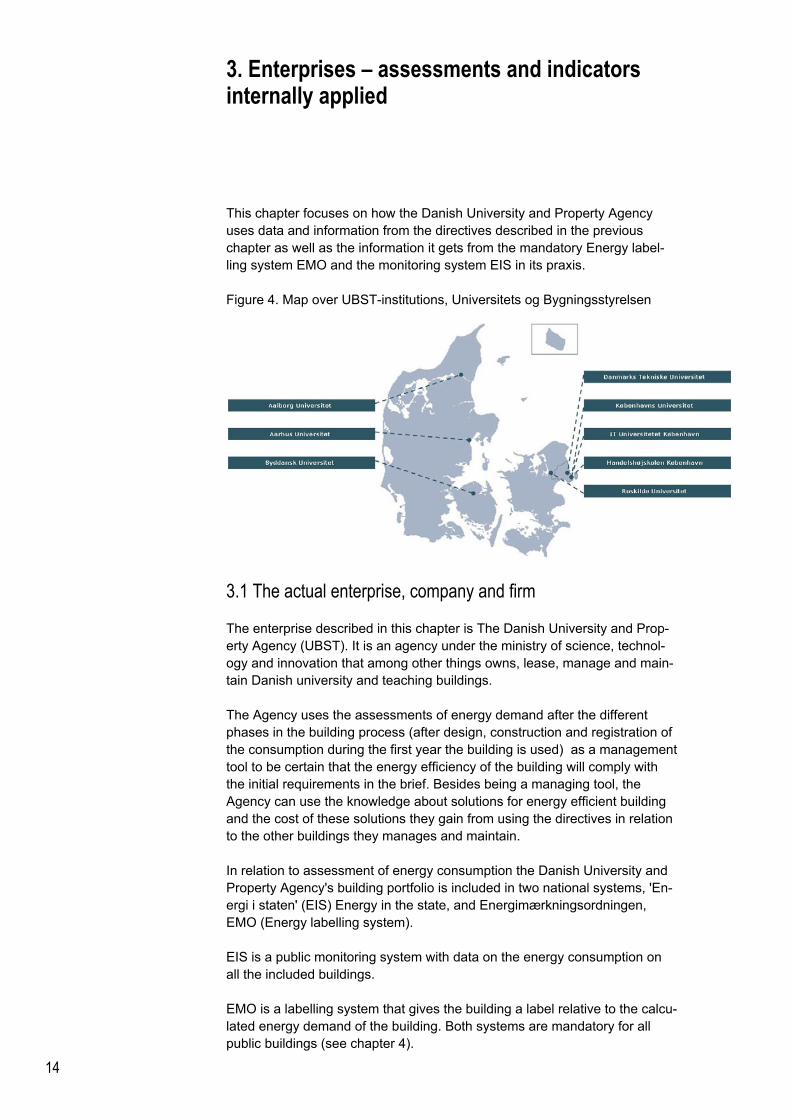
This chapter focuses on how the Danish University and Property Agency uses data and information from the directives described in the previous chapter as well as the information it gets from the mandatory Energy label-ling system EMO and the monitoring system EIS in its praxis. Figure 4. Map over UBST-institutions, Universitets og Bygningsstyrelsen
3.1 The actual enterprise, company and firm
The enterprise described in this chapter is The Danish University and Prop-erty Agency (UBST). It is an agency under the ministry of science, technol-ogy and innovation that among other things owns, lease, manage and main-tain Danish university and teaching buildings. The Agency uses the assessments of energy demand after the different phases in the building process (after design, construction and registration of the consumption during the first year the building is used) as a management tool to be certain that the energy efficiency of the building will comply with the initial requirements in the brief. Besides being a managing tool, the Agency can use the knowledge about solutions for energy efficient building and the cost of these solutions they gain from using the directives in relation to the other buildings they manages and maintain. In relation to assessment of energy consumption the Danish University and Property Agency's building portfolio is included in two national systems, 'En-ergi i staten' (EIS) Energy in the state, and Energimærkningsordningen, EMO (Energy labelling system). EIS is a public monitoring system with data on the energy consumption on all the included buildings. EMO is a labelling system that gives the building a label relative to the calcu-lated energy demand of the building. Both systems are mandatory for all public buildings (see chapter 4).
15
UBST uses the labels and the reports from EMO on how the energy effi-ciency of the buildings can be improved as a tool to plan the maintenance and improvements of the buildings. The data delivered to EIS, is data UBST collect anyway in order to monitor the energy consumption of the buildings in their portfolio.
3.2 Assessments and tools in the enterprise
The Danish University and Property Agency (UBST) uses three methods as-sessing and monitoring the energy efficiency and energy consumption of the buildings in their portfolio. The calculation programme for energy demand of buildings Be06 is used in the planning and construction phase of a building as a tool to assess whether the planned building comply with the required level of energy effi-ciency. The assessments of energy demand on Kolding and other building projects made in accordance with the directives for energy efficient building are made for the agency by an authorized energy consultant not involved in the build-ing project. The results are documented in a report along with suggestions for more profitable solutions. The assessments and the documentation are used a bit different depending on when in the building process the assess-ments and documentation is done (see chapter 2.2) UBST are in the middle of implementing an automatic monitoring tool 'min energi' (my energy), that makes it possible to follow a building’s resource consumption day by day on a display on a site on the internet. This tool is connected to the meters in the different buildings and makes it possible to monitor the energy consumption, room by room; in every building the agency owns and/or manages. It is used by the person who operates the actual building as a tool to register and reveal sudden unusual consumption or other irregularities as well as a tool for the agency to register the total amount of consumed energy, and how it distributed over the year. Once every year the data registered in 'min energi' is delivered to Energy in the State (EIS). Besides this monitoring system, the buildings in the portfolio of UBST are in-cluded in 'Energimærkningsordningen' EMO (Energy labelling system). EMO is a governmentally driven system that labels the energy demand of a build-ing, and it is mandatory for every building that exceeds 60 m² to be labelled in the system (see chapter 4). This label is given every fifth year, and is documented in a report, delivered to the agency made by an authorized en-ergy consultant hired by the agency. The demand of the building is calcu-lated with Be06, the energy calculation programme that is applied in UBST directives for energy efficient building is applied.
3.3 Costs and performance indicators applied in the enterprise
When planning a building the indicators used assessing the energy effi-ciency are the energy demand limits defined in three classes of energy de-mand in the Danish building regulations 2008. The classes are defined by the overall energy demand of the building di-vided with the heated area of the building.
16
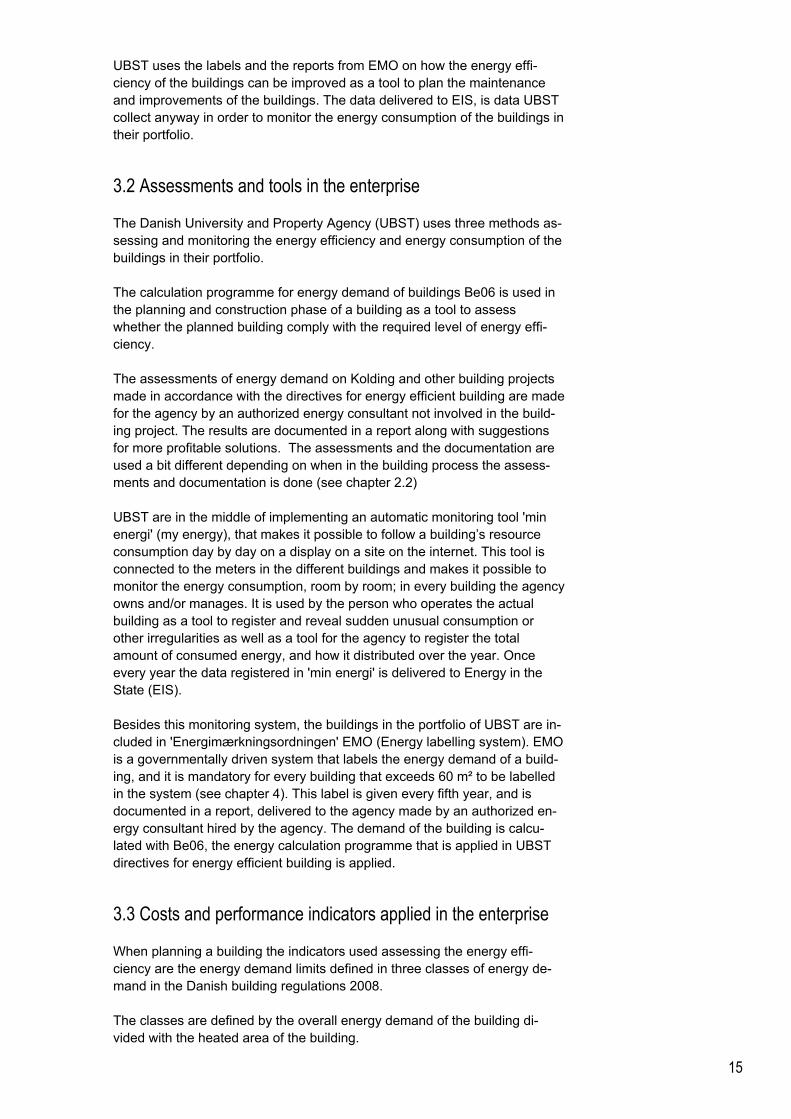
The general energy demand level for offices, schools institutions and other buildings is 95 kWh pr. m² + 2200 kWh divided with m² heated area. Energy demand level 2 is 75 % of the general energy demand level, energy demand level 1 is 50 % of the general energy demand level. The set of key figures that defines of the energy demand of the building are basically the indicators in the energy efficiency labelling system EMO. They concern the energy demand for heating the building, hot water, cooling, ven-tilation and if necessary lighting. (More details see chapter 4.3) The indica-tors in registered or assessed in order to assess the energy efficiency of the building are 3.1- Category of building, 4.1- Category of building parts, 4.4 -Thermal quality , and 7.1 – resource use in CREDIT Indicators Classification. The indicators in the energy efficiency labelling system EMO concern the energy demand for heating the building, hot water, cooling, ventilation and if necessary lighting. These indicators are calculated with the calculation pro-gramme Be 06 the same calculation programme that is used in the planning and construction process. The calculations of these indicators are made on the basis of the specific properties of the materials in the building envelope regarding heat capacity and transmission. (See chapter 4 for more informa-tion about EMO). Figure 5. 'MinEnergi' display - reading the meter at the computer, MinEner-giData
The indicators that are registered in 'MinEnergi' are the consumption of heat, water and electricity. The indicators of Energy in the State (EIS) are based on registrations of the consumption of electricity, water, heating, in every building and institution and the square meters of the building, the heated square meters of the build-ing and the heating system and the type of resources these systems use. On the basis of these registrations, the key figures below are calculated: – Electricity pr. square meter – Cubic meter water per square meter – Heating kWh per square meter – Degrees correlated with consume of heating kWh – The degrees per day that are under a mean temperature per day of 17
degrees Celsius.
3.4 Relation to building cases and national benchmarking
The Danish University and Property Agency (UBST) uses the report from the Energy labelling system EMO as an incorporated tool in the organisation
17
planning maintenance and energy renovation. In these reports the energy consultants present suggestions for improvements that will enhance the en-ergy efficiency and reduce the consumption. These suggestions are used as a point of departure in the planning of maintenance. On top of that, the EMO key indicators and calculation system has been a point of departure for the development of the Directives for energy efficient building from UBST. The information that soon only will be gathered by the automatic monitoring tool 'My energy', is basically defined by the registration input UBST has to deliver to EIS, though the level of detail is higher than the demand for the in-put to EIS. The registrations in 'my energy' are used as a tool to monitor the energy con-sume on the individual building and reveal irregularities in the consumption. On top of that the registrations are used as a tool to calculate and budget the resource consumption costs for the individual building and for the ministry as a whole. UBST do not often use the registrations to compare the consump-tion of different buildings, they do not see that as relevant. Nor do they use the key figures on resource consumption on all state buildings from EIS.
3.5 Visions and innovation for future improvements
According to Jens Rømer Olsen the vision with the directives is to reach a high level of energy efficiency in UBST's future buildings as well as to show to other parts of the administration of national buildings that these high levels of energy efficiency are possible to reach even without a big increase of the construction costs. This will even more be the case with the future directives that will be based on UBST energy strategy 2009 – 2028 with increased am-bitions for the level of energy efficiency. The directives for energy efficient building are a part of a series of initiatives from UBST that also include directives for indoor climate. These initiatives are followed up by user surveys on indoor climate in order to gain knowledge of how the indoor spaces are perceived by the users of the buildings The specified registrations of energy consumption both on processes that is related to the functions of the building and to running the building makes it possible to se where the big consumption of energy is. A knowledge that is valuable in the planning process of new buildings because it makes it possi-ble to make requirements for the energy demand in the future buildings that is achievable and realistic taking the demand of the specific functions into account. Even more specified measures that will make it possible to follow the con-sumption room by room will be established in the near future. The Danish University and property agency thinks that the handbook for en-ergy consultants that makes the EMO report is not thorough enough. There-fore a section about ventilation is left out and is replaced by the circular on indoor climate and ventilation of the 1 of January 2008, when the agency procure the task of EMO assessment and reporting.

18
4. National benchmarking – indicators, assessment and organisation
This chapter focuses on the organisation, assessment method and tools and indicators of the Energy labelling system EMO, a national mandatory label-ling system. In its current form EMO has been functioning in three years, but it is built on former versions, that with many revisions go back to 1979.
4.1 The actual benchmarking organisation and its purpose
In 1996 a law of furtherance of energy and water saving in buildings was passed. This law provides that all buildings must have a label regarding the energy demand of the building. Small buildings that are under 1500 m² the energy label and an energy plan are required when the building is put up for sale. An energy label and an energy plan are required for buildings that are over 1500 m², and are required to be revised every year. These requirements were the background for establishing the energy management system (En-ergiledelsesordningen, ELO) the preceding system to the current Energy la-belling system. The law of 1996 was revised with a new law of furtherance of energy sav-ings in buildings of June 2005, and this revision is the specific basis for es-tablishing the new system the Energy labelling system EMO. The law of 2005 provides that all buildings must have an energy label reflecting the state of the building regarding energy and the energy demand of the building including heating, hot water, cooling, ventilation and if necessary lighting and sometimes water consumption. While ELO only covered buildings that exceed 1500 m², EMO covers all building, though for single-family-houses or apartments the label is only re-quested when it is put up for sale. Another difference between the old sys-tem ELO and new system EMO is that the element of energy management and the annual follow up on plans for improvement that was a part of ELO is removed in EMO. The purpose of the EMO system is like the systems (ELO and EM) that pre-cede it, to draw attention to the consumption of energy in buildings and fur-ther savings and reduce the energy demand both in public and in private buildings. This is done through monitoring and communicating the energy demand. EMO has been working since 2006. The owner of the building pays for the consultant who makes the assessment, calculations and report that is the basis for the label. The system covers all buildings that are bigger than 60 m² and it is manda-tory to obtain a label every fifth year for public and commercial buildings. The label covers both new built and existing buildings, but the focus is on energy demand and consumes using and operating the building.
19
The use of the label varies very much between the different owners of the buildings and building types. An evaluation of all energy saving initiatives made in 2008 shows that the ef-fect of the label and the report is not significant. Owners of single-family houses without EMO label make as many energy saving improvements as owners with an EMO label. A look at EMO labels given to public and commercial buildings between 2006 and 2008, shows that half of the buildings got the same label as they got last time. Over half of the buildings that are covered by the system are not labelled though it is mandatory, and there are no sanctions for not get-ting a label. Therefore the evaluation concludes that the system does not have the desired effect (Togeby, M. et al., 2008) (see more about the evaluation in 4.5). EMO is administered by the common secretariat for inspection and labelling systems (FEM-sekretariatet) placed at the Danish technological institute. FEM secretariat educates the energy consultants that perform the labelling, When the labelling end report is executed FEM secretariat control that the consultant and his firm is authorized, and that the data about the building in question are in accordance with the BBR register. It is the owners of the buildings that pay the authorized energy consultant to make the assessment and suggestions for improvements that the label con-sists of. The consultants come typically from architectural or engineering firms.
4.2 Assessments applied in the benchmarking organisation
The data for the EMO label and report is collected and calculated by author-ized energy consultants, educated for the task by FEM – secretariat (see 4.1). The data is collected from: – the BBR (building and housing register) – the owner or organisation that houses the building – registrations of consume of energy, water and operational conditions of
energy consuming installations – the drawing material and specifications on the building, building parts and
materials – an inspections of the house made on site. The calculation of the energy demand of the buildings is based on SBi guideline 213 and the calculation programme Be 06. The actual calculation can be made in different commercial energy labelling programmes that have Be 06 incorporated as 'calculation engine'. Data as well as the calculation is gathered by the consultant in a report that includes the label and calculations and suggestions for energy saving im-provements. It is a report that only covers the individual building and is meant as a tool for the owner or administrator in the planning of the mainte-nance.
4.3 Cost and performance indicators applied in benchmarking
The indicators in the energy efficiency labelling system EMO concern:

20
– Contributions to the energy demand (heating, electricity for running the building, temperatures that exceed the limit for the temperature)
– The net energy demand (heating the space, warm water, cooling) – Selected electricity demands (lighting, heating the space, heating warm
water, heating pump, ventilators, pumps, cooling) – Loss of heating in the installation (heating the space, warm water) – Output from special sources (solar heat, heat pump, solar cells). The data that is entered in the Be 06 programme in order to calculate these key figures are: – The building type (detached house, row houses, blocks) as well as the
function it houses (offices, schools or teaching, day-care, hospitals and so on).
– Heated floor area – Heat capacity – Hours of use per day. – Type of energy supply – The building envelope (exterior walls, roof, floors, and other surfaces,
foundations and joints by the windows, windows and doors including the orientation, grade and glass area of the window)
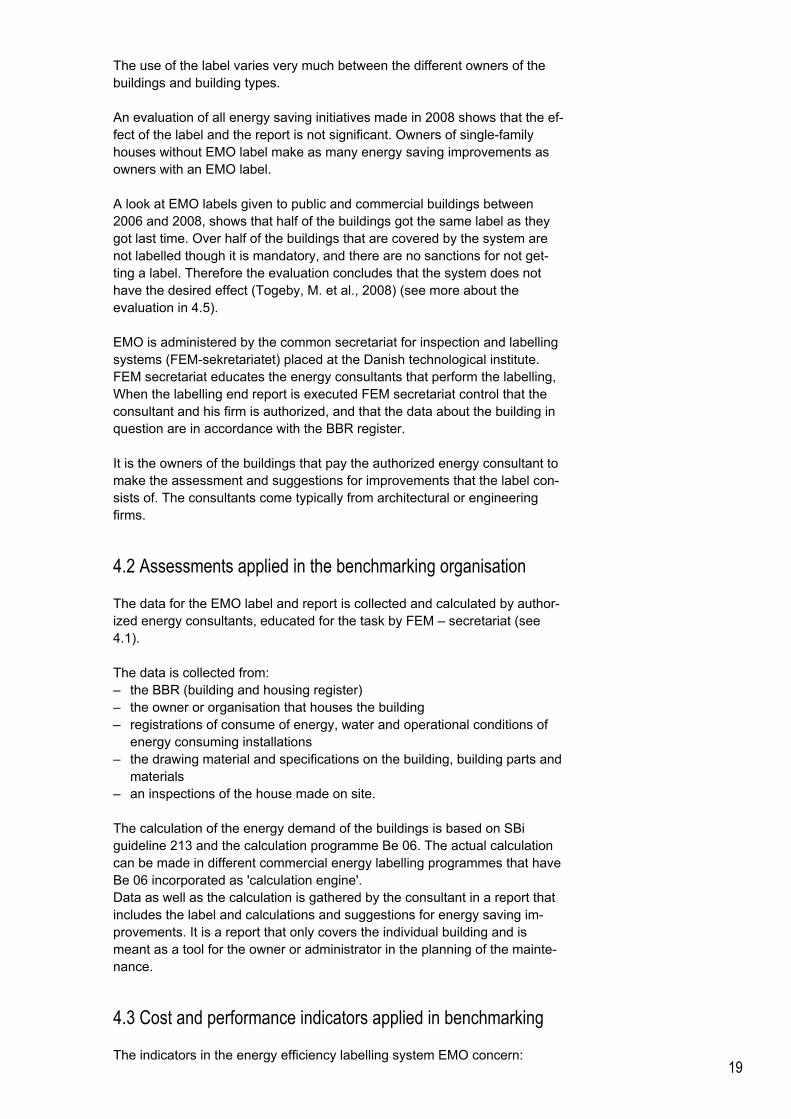
– The transmission area – The transmission coefficient – The factor of temperature. The EMO indicators relate to 3.1- Category of building, 4.1- Category of building parts, 4.4 -Thermal quality, and 7.1 – resource use in the CREDIT indicator classification. These indicators (input data) are summed up in a label, a general indicator (output data) for the energy demand for the specific building. A building can get a label on a scale that ranges from A1 to G. Figure 6. The EMO scale, Energistyrelsen
The label A1 is given to the building with a very high level of energy effi-ciency that conforms to the strictest requirements (office buildings and insti-tution 50 kWh per m² + 1100 kWh divided with m² heated area, for dwellings 35 kWh per m² + 1100 divided kWh with m² heated area), label A2 for the second best (offices and institutions 70 kWh per m² + 1600 kWh divided with m² heated area, dwellings 50 kWh per m² + 1600 kWh divided with m² heated area). Label B is given to the building that conforms to the general requirements in the Danish building regulations (offices and institutions 95 kWh per m² + 2200 kWh divided with m² heated area, dwellings 70 kWh per
21
m² + 2200 kWh divided with m² heated area). The label G is the purest level of energy efficiency (offices and institutions 265 kWh per m² + 6500 kWh di-vided with m² heated area, dwellings 240 kWh per m² + 6500 kWh divided with m² heated area). Figure 7. Table of limit value for family housing for each the levels in the la-belling system, Bilag til Håndbog for energikonsulenter
4.4 Relation to enterprises, building projects and real estate
The EMO label and report is an assessment of the individual building and is meant as a tool to get an overview of the energy efficiency of the building for the owner or enterprise that is responsible for operating and maintaining the building. Besides the calculation of the current energy demand of the build-ing, the report gives specific suggestions for improvements and calculates the profitability of these improvements. This input about improvements can be used in the strategic pre-project phase or as general considerations in the maintenance. FEM secretariat's database of energy labeled buildings has by 2008 been linked to OIS database, a public database where information on build-ings/real estate in Denmark is gathered. Here the building owner can see the energy label his house has got and it will be possible for the public to see whether a building is labeled or not. The energy suppliers can see whether a building has a bad energy label when suggesting saving proposals. EMO is governmentally initiated, and a mandatory system. Likewise are the developed assessment methods and tools governmental initiatives.
4.5 Visions and innovations for future improvements
The objective with EMO is to establish increased attention on the energy consumption and thereby initiate energy saving improvements and renova-tions. By the end of 2008 an evaluation of all the Danish energy saving initiatives was published in a report, among these the Energy labelling system EMO. The report concludes that EMO is not cost efficient in its current form: – Though it is mandatory for all buildings with an area that exceed 60 m²,
more than half of the buildings that ought to be labelled, are not. There are no sanctions for not labelling one's building.
– The evaluation assesses the system as expensive because the label is based on a consultant's analysis of every building on the basis of an in-spection of the building and building drawings and specifications rather than on data that can be extracted from meters and other registrations.
22
– A survey done in 2002 (by AKF, to be published in 2008) among single-family houses showed that there was no difference between houses with an energy label and house without regarding the energy consumption and the number of energy renovations.
– Among the 1546 large buildings that had been labelled from 2006 to 2008, 837 (54 %) had got the same label as their last label. This means that the suggestions for improvements have not been followed, or that the suggestions have not been significant enough to change the energy label form one level to another.
The evaluation points out the meeting of obligation, data collection and the quality of the energy saving suggestions as weaknesses of the system, that ought to be looked at in a revision of the system. The Danish Energy Agency has planned a series of improvements of EMO on the basis of this evaluation. These include among other things: – The labels will be made public for free including the data that forms the
basis for the giving the label and active information about the label will be given to target group (building owners, craftsmen, contractors, consult-ants and finance institutions).
– The labelling will be differentiated; with a more thorough inspection of old building where the potential energy savings will be bigger, and a less thorough inspection of new buildings.
– Also the interval between the labelling will be differentiated; the label given to an energy efficient building will last longer than the label given to a building that is not energy efficient.
The task of the common secretariat for inspection and labelling systems (FEM-sekretariatet) will become more focused on quality management of the work done by the energy consultants as well as play a more facilitating role in relations to the energy consultants’ work.
23
5. Discussions and conclusions
This chapter discusses the lessons learned with the assessment methods and tools and the indicators of both the UBST's directives for energy efficient building and the energy labelling system EMO
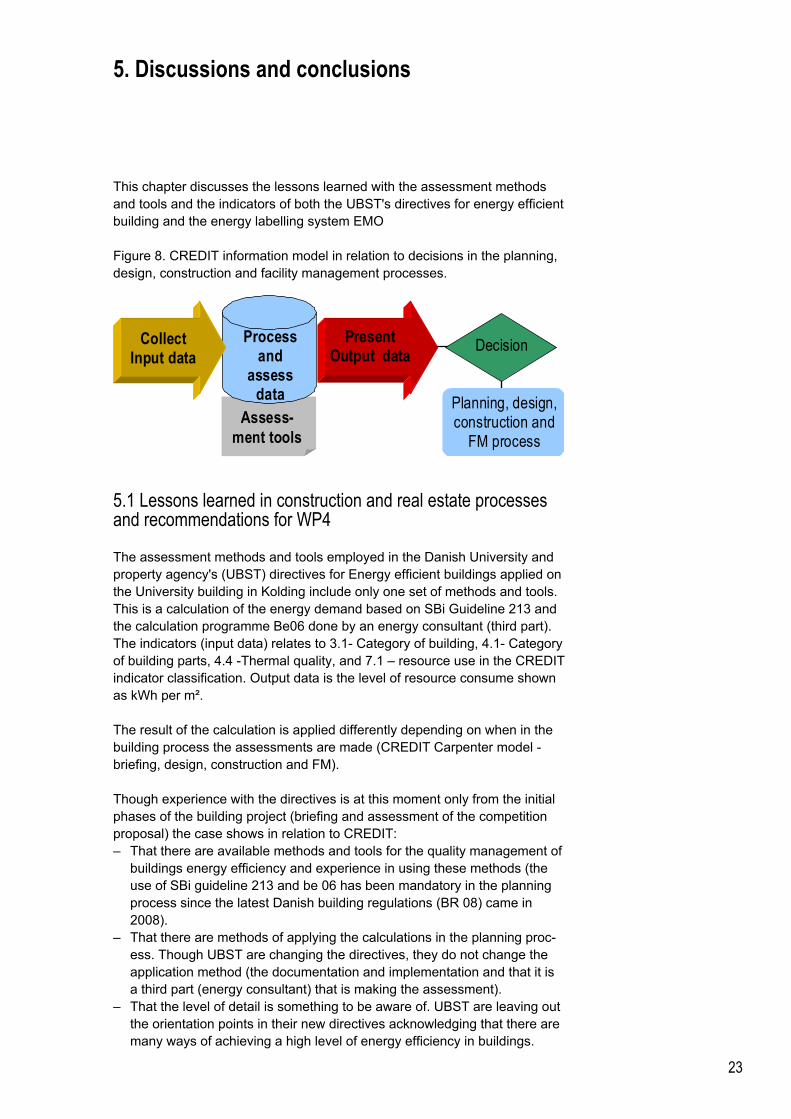
Figure 8. CREDIT information model in relation to decisions in the planning, design, construction and facility management processes.
5.1 Lessons learned in construction and real estate processes and recommendations for WP4
The assessment methods and tools employed in the Danish University and property agency's (UBST) directives for Energy efficient buildings applied on the University building in Kolding include only one set of methods and tools. This is a calculation of the energy demand based on SBi Guideline 213 and the calculation programme Be06 done by an energy consultant (third part). The indicators (input data) relates to 3.1- Category of building, 4.1- Category of building parts, 4.4 -Thermal quality, and 7.1 – resource use in the CREDIT indicator classification. Output data is the level of resource consume shown as kWh per m². The result of the calculation is applied differently depending on when in the building process the assessments are made (CREDIT Carpenter model - briefing, design, construction and FM). Though experience with the directives is at this moment only from the initial phases of the building project (briefing and assessment of the competition proposal) the case shows in relation to CREDIT: – That there are available methods and tools for the quality management of
buildings energy efficiency and experience in using these methods (the use of SBi guideline 213 and be 06 has been mandatory in the planning process since the latest Danish building regulations (BR 08) came in 2008).
– That there are methods of applying the calculations in the planning proc-ess. Though UBST are changing the directives, they do not change the application method (the documentation and implementation and that it is a third part (energy consultant) that is making the assessment).
– That the level of detail is something to be aware of. UBST are leaving out the orientation points in their new directives acknowledging that there are many ways of achieving a high level of energy efficiency in buildings.
Assess-ment tools
Present Output data
Process and
assess data
Decision
Planning, design, construction and
FM process
Collect Input data
24
5.2 Lessons learned in enterprises, companies and firma and recommendations for WP5
The Danish University and property agency's (UBST) use three sets as-sessment method and tools in their management of energy consumption in their building portfolio; UBST's directives for energy efficient building, 'My Energy', and the national energy labelling system EMO. The assessments methods and tools are basically the same in UBST's direc-tives and in EMO, SBi guideline 213 and Be06. The indicators (input data) relate to 3.1- Category of building, 4.1- Category of building parts, 4.4 -Thermal quality, and 7.1 – resource use in the CREDIT indicator classifica-tion. Output data is the calculated level of resource consume shown as kWh per m². The UBST directives and EMO differs when it comes to the documentation and implementation. The directives are a quality management tool intended for the planning and building process. Here the assessments are made after every phase in proc-ess (CREDIT Carpenter model - briefing, design, construction and FM). In the initial phases made along with suggestions for other solutions, in the later phases as mere control. EMO is intended as a renovation and maintenance tool. The assessments are done during FM and are supplemented with suggestions to energy sav-ing improvements of the building in question. 'My energy' is a tool to monitor the heating, water and electricity consump-tion in every building (relates to 7.1 resource consume in CREDIT indicator classification) and is applied to register energy consume and reveal irregu-larities in the consumption. The case shows: – It is not possible to conclude how the directives works as a quality man-
agement tool for UBST because the experience with the UBST directives for energy efficient building is only from the initial phases of the building process. But one thing is worth mentioning. The directives are already be-ing revised, because it is too detailed in relation to the point of orientation and because the ambitions for the energy efficiency level are not high enough. These points at the importance of being aware of what the level of detail that is relevant in such tools.
– That EMO label and the included report with the suggestions for im-provements regarding energy efficiency is a useful to for UBST in their planning of energy renovations and maintenance of their buildings.
– That tools and systems that only registers the resource consumption in relation to square meters (such as 'my energy' and EIS) apparently are lacking other information in order to be relevant for benchmarking re-source consume between buildings. UBST do not compare the consump-tion of one building with another in their portfolio registered in 'My energy' or with other state buildings registered in EIS. UBST uses only 'My En-ergy' as a monitoring tool. The registrations are used as a basis for calcu-lating energy cost and budgets on the individual buildings and on the min-istry as a whole as well as they are used for the submission of data to EIS.
25
5.3 Lessons learned in national benchmarking organisations and recommendations for WP 6
The EMO label system is a revised version of former systems (ELO, EM) and is intended for the individual building owner or administrator as a tool for the planning of renovation and maintenance. The calculation and assessment methods are well incorporated in the sector because the calculation tools (Be06) are the same that since the last version of the Danish building regulations came out in 2008 has been used in the planning phases to certain that the planned building comply to the require-ments of the Danish building regulations. The indicators (input data)used in EMO relates to 3.1- Category of building, 4.1- Category of building parts, 4.4 -Thermal quality, and 7.1 – resource use in the CREDIT indicator classifica-tion. Output data - the label is a letter (A1 – G) that is linked to the level of resource consume as kWh per m². Initiative to establish EMO labelling system was governmental and it is a mandatory public non-profit system (in relation to CREDIT benchmarking ty-pology) though the actual task of calculating/giving the labels is done by pri-vately paid consultants. An evaluation of all the Danish energy saving initiatives was published in a report among these EMO, questions whether the system is cost efficient. The evaluation points out three weaknesses of the system that ought to be looked at in a revision of the system: – The owners meeting of obligation (only half of the building that are cov-
ered by EMO do actually have a label), – The comprehensive data collection and analysis (based on the consult-
ants inspection of the building as well as drawings and specifications of the building and building parts),
– The quality of the suggestions that is part of the label of the system (many buildings get the same label again after 5 years, which indicates that the suggestions are not significant enough).
In relation to CREDIT this case shows: – That there are well established indicators on energy demand and con-
sumption in the sector that are applicable in relation to benchmarking. – Points at the problematic in having a mandatory system without sanctions
when building owners do not meet their obligations. – The weaknesses in having a system that is based on the incentive the
owner gets from the labelling report of his building, if the profitability of the suggestions in these reports is not significant.
26
Reference
Aggerholm, S., Grau, K.E. (2005). Bygningers energibehov, (SBi-anvisning 213) Hørsholm: Statens Byggeforskningsinstitut Aalborg Universitet. Aggerholm, S., et al. (2008). UBST-Energivejledning: Planlægning af ener-gieffektivt byggeri, København: Universitets- og Bygningsstyrelsen. Energistyrelsen. (2008). Håndbog for Energikonsulenter 2008 ver. 2, Kø-benhavn: Energistyrelsen. Energistyrelsen. (2009). Aktivering af energimærkningsordning, notat. Kø-benhavn: Energistyrelsen. FEM-skretariatet. (2008). FEM-sekretariatets Årsberetning 2007. Køben-havn: Energistyrelsen. Togeby (ed.) et al. (2008). En vej til flere og billigere energibesparelser. Kø-benhavn: Energistyrelsen. Universitets og Bygningsstyrelsen. (2008. Syddansk Universitet Kolding, Projektkonkurrence om nybyggeri til Syddansk Universitet Kolding, Køben-havn: Ministeriet for Videnskab, Teknologi og Udvikling. Universitets og bygningsstyrelsen. (2009). UBST energistrategi 2009-2028 (Udkast 29/1 2009) København: Ministeriet for Videnskab, Teknologi og Ud-vikling.

This report describes the result of a case study of three different energy management tools and the assessment methods and indicators that are applied in them. The study was undertaken as a part of the Nordic and Baltic project CREDIT: Construction and Real Estate – Develo-ping Indicators for Transparency. The analysis is aiming at three levels: the project or building, the enterprise and the national benchmarking system. The study concludes that there are indicators in rela-tion to energy that can be applicable in CREDIT. Further, it points at the importance of incentive for the user as well as sanctions against those who does not meet their obligations.
1st edition, 2010ISBN 978-87-563-1433-6


