1-84 University of Alberta Master of Science in Internetworking (MINT) MINT 709 Project Report An Investigation of CAC in UMTS Cellular Networks Submitted to: Dr. Ehab S. Elmallah Department of Computing Science Submitted by: Asim Naqvi snaqvi at ualberta dot ca
Transcript
1-84
University of Alberta
Master of Science in Internetworking (MINT)
MINT 709 Project Report
An Investigation of CAC in UMTS Cellular Networks
Submitted to:
Dr. Ehab S. Elmallah Department of Computing Science
Submitted by:
Asim Naqvi snaqvi at ualberta dot ca
2-84
Abstract The successful deployment of UMTS (Universal Mobile Telecommunication System)
Cellular Network is heavily dependent on CAC (Call Admission Control) which plays a
major role in ensuring QoS (Quality of Service) to be achieved. This report is based on
the investigation of CAC (Call Admission Control) including the different parameters of
RNC (Radio Network Control) Admission Control such as uplink and downlink loading
factors, Scheduling Weights, and some attributes of Node-B (Base Station) like Resource
Allocation/Retention Priority. Also evaluates the performance of CAC by using the
OPNET™ Modeler ver11.5 based on the self made simulation models. And construct the
Static Scenario by considering the two QoS traffic classes; streaming and Background.
And analyze the relation between offered load and throughput.
Index Terms: UMTS, CAC, RNC, Loading Factors, Throughput, OPNET™
Preface This report is submitted in partial fulfillment of the requirement for the course of MINT
(Masters in Internetworking) at the Department of Computing Science and Department of
Electrical & Computer Engineering, University of Alberta. The work presented here has
been carried out at the Department of Computing Science, during the period from July
2006 to December 2006 under the supervision of Prof. Dr. Ehab S Elmallah.
Production note: This report has been written using Microsoft Word 2003, Microsoft
Excel 2003, ACDSee 9.0, Adobe PDF Maker 7.8 and all simulation results were obtained
from self-made models using OPNET™ Modeler ver11.5 to design, implement, and test a
network system level simulation environment to allow investigators to study the issues.
3-84
Acknowledgements First of all, I would like to express my sincere acknowledgement to my supervisor Prof.
Dr. Ehab S. Elmallah, at the Department of Computing Science, University of Alberta.
Dr. Elmallah has been acting not only as an enthusiastic tutor but also as an always
available discussion partner of my studies in this last year of Masters. I do appreciate our
stimulating discussions and his insightful advises on various aspects of my work.
I am indebted to Prof. Dr. Mike MacGregor at Department of Computing Science for
initiating and continuous encouragement during my Masters. Dr. MacGregor is also a
Director of MINT (Master of Science in Internetworking), which is now successful
degree program of University of Alberta because of his hard efforts. I am also grateful to
all my colleagues at the MINT especially Juned Noonari and Adnan Rafique.
Last, but not least, especially I would like to thank my wife Sherene, for her patience and
fulltime work at home in supporting my M.Sc. studies. Also love to my dearest son Zain.
I feel indebted to my mother for endless love and understanding. My father will feel
proud of my Masters that I finally get it. I also thank my brother Maisum and sister Farwa
for decades-lasting understanding and support. I devote this report to whole family of
mine.
Edmonton, Dec. 2006 Asim Naqvi
4-84
List of Abbreviations
3G 3rd Generation 3GPP 3rd Generation Partnership Project AC Admission Control ACK Acknowledge AGCH Access Grant Channel AP Access Point AMR Adaptive Multi Rate AUC Authentication Center BCCH Broadcast Control Channel BLER Block Error Rate BR Blocking Rate BS Base Station BSC Base Station Controller BSS Basic Station System BSSGP BSS GPRS Application Protocol BTS Base Station Transceiver System CAC Call Admission Control CDMA Code Division Multiple Access CIR Carrier to Interface Ratio CN Core Network CPICH Common Pilot Channel CS Circuit-Switched DL Downlink DTX Discontinuous Transmission FTP File Transfer Protocol GGSN Gateway GPRS Support Node GLR Gateway Location Register GMM GPRS Mobility Management GMU Global Management Unit GoS Grade of Service GPRS General Packet Radio Service GSM Global System for Mobile Communications GTP GPRS Traffic Tunneling GUI Graphical User Interface HLR Home Location Register HO Handover IMEI International Mobile Station Equipment Identity IMEISV IMEI and Software Number IMSI International Mobile Subscriber Identity IP Internet Protocol Iu UMTS interface between Access Network and Core Network ITMU Interface Traffic Monitoring Unit KPI Key Performance Indicator LA Location Area
5-84
LAH Location Area Handover LC Load Control LLC Logical Link Control LS Location Server MAC Medium Access Control ME Mobile Equipment MIF Management Information File MM Mobility Management MMS Multimedia Message Service MOC Mobile Originated Call MS Mobile Station MSC Mobile Switching Center MSISDN Mobile Station ISDN MT Mobile Terminal MTC Mobile Terminated Call MU Mobile User NPDB Number Portability Data Base NRT Non-real Time OMC Operations and Maintenance Center OVSF Orthogonal Variable Spreading Factor P-TMSI Packet Temporary Mobile Subscriber Identity PDCH Packet Data Channel PDP Packet Data Protocol PDU Packet Data Unit PS Packet-Switched QoS Quality of Service RAB Radio Access Bearer RACH Random Access Channel RAN Radio Access Network RLC Radio Link Control RMT Resource Management Technique RMU Resource Management Unit RNC Radio Network Controller RNS Radio Network Subsystems RRC Radio Resource Control RRM Radio Resource Management SDCCH Stand Alone Dedicated Control Channel SGSN Serving GPRS Support Node SIR Signal to Interference Ratio SMS Short Message Service STS Simulation Time Step TBF Transport Block Flow TBI Transport Block Indicator TCH Traffic Channel TCP Transmission Control Protocol TDD Time Division Duplex
6-84
TLLI Temporary Logical Link Identity TMSI Temporary Mobile Subscriber Identity TS Time Slot UDP User Datagram Protocol UE User Equipment UL Uplink UMTS Universal Mobile Telecommunications System USIM UMTS Subscriber Identity Module USF Uplink Stage Flag UTRAN UMTS Terrestrial Radio Access Network Uu UMTS Air Interface VLR Visitor Location Register W-CDMA Wideband CDMA WWW World Wide Web
7-84
List of Figures/Tables Figure 2-1 UMTS System Overview …………………………………………………. 12 Figure 2-2 UTRAN Architecture …………………………………………………….. 16 Figure 2-3 UE Functions …………………………………………...………………… 18 Figure 3-1 Uplink load curve and the estimation of the interference increase due to a new user …………………………………………………………………………….…. 23 Figure 4-1 UMTS Network System Level Simulation …………………………….... 26 Figure 5-1 UMTS Network Scenario Simulation ………………………………...…. 34 Figure 5-2 UMTS RNC Parameters ……………………………...………………….. 35 Figure 5-3 UMTS Node-B Parameters ………………………………………………. 36 Figure 5-4 UMTS UE Parameters ……………………………………...………….… 37 Figure 5-5 UMTS Choosing Result Parameters …………………………………….. 39 Figure 5-6 RNC Statistics with Offered Load 1.5 ………………...………………… 40 Figure 5-7 RNC and UE_1 Statistics ………………………………………...………. 41 Figure 5-8 RNC Statistics with Offered Load 3.0 and running duration 10mins … 42 Figure 5-9 RNC Statistics per TRCHNL ……………………………………………. 43 Figure 5-10 UE_0 Statistics …………………………………...……………………… 44 Figure 5-11 UE_1 Statistics ………………………………………...………………… 45 Figure 5-12 Node-B Total DL and UL Throughput (bits/sec) Statistics ………...… 46 Figure 5-13 Node-B DL Throughput (bits/sec) vs RNC Transmit Load (bits/sec) .. 46 Figure 5-14 RNC Total Transmit Load (bits/sec), RNC Total Received Throughput (bits/sec), UE_0 Total Received Throughput (bits/sec), and UE_1 Total Received Throughput (bits/sec) ……………………………………………………………….... 47 Figure 5-15 UE_0 (Per QoS) End-end end Delay (sec) and RAN DL Delay (sec) … 48 Figure 5-16 Node-B to RNC point-to-point throughput (bits/sec) for UL and DL .. 49 Figure 5-17 Node-B to RNC point-to-point Utilization ………………………...…... 49 Figure 5-18 Node-B to RNC average in point-to-point queuing delay …………….. 50 Figure 5-19 FTP Traffic average sent and received (bytes/sec) ……………………. 50 Table 5-1 Average summary of Node Statistics (part 1) ………………………….... 51 Table 5-2 Average summary of Node Statistics (part 2) ………………………...…. 51 Table 5-3 Average summary of Node Statistics (part 3) ………………………...…. 52
8-84
Contents Abstract ………………………………………………………………………………… 2 Preface ………………………………………………………………………………….. 2 Acknowledgement ……………………………………………………………………… 3 List of Abbreviations …………………………………………………………………... 4 List of Figures/Tables ………………………………………………………………….. 7 Contents ………………………………………………………………………………… 8 1. Introduction …………………………………………………………………….. 9 2. UMTS Architectural Overview ……………………………………………… 12
2.1 Core Network …………………………………………………………. 13 2.2 UMTS Terrestrial Radio Access Network …………………………... 15 2.3 User Equipment ………………………………………………………. 17
3. CAC Strategies ……………………………………………………………….. 20
3.1 CAC in UMTS Network ……………………………………………… 21 3.1.1 Interference based CAC ……………………………………………… 22 3.1.2 Throughput based CAC ……………………………………………… 23 3.2 Load Control in UMTS Network ……………………………………. 24
4. UMTS Environment for CAC Analysis in OPNET™ Modeler ver11.5 …... 26
4.1 UMTS Model Assumptions for OPNET™ ...………………………... 27 4.1.1 Basic CAC Control Parameters …………………………………….... 27 4.1.2 System Performance Parameters ……………………………………. 28 4.1.3 Traffic Parameters ……………………………………………………. 29 4.1.4 Mobility Parameters ………………………………………………….. 29 4.2 Model Attributes ……………………………………………………… 30 4.2.1 RNC Attributes ……………………………………………………….. 30 4.2.2 Node-B Attributes …………………………………………………….. 31
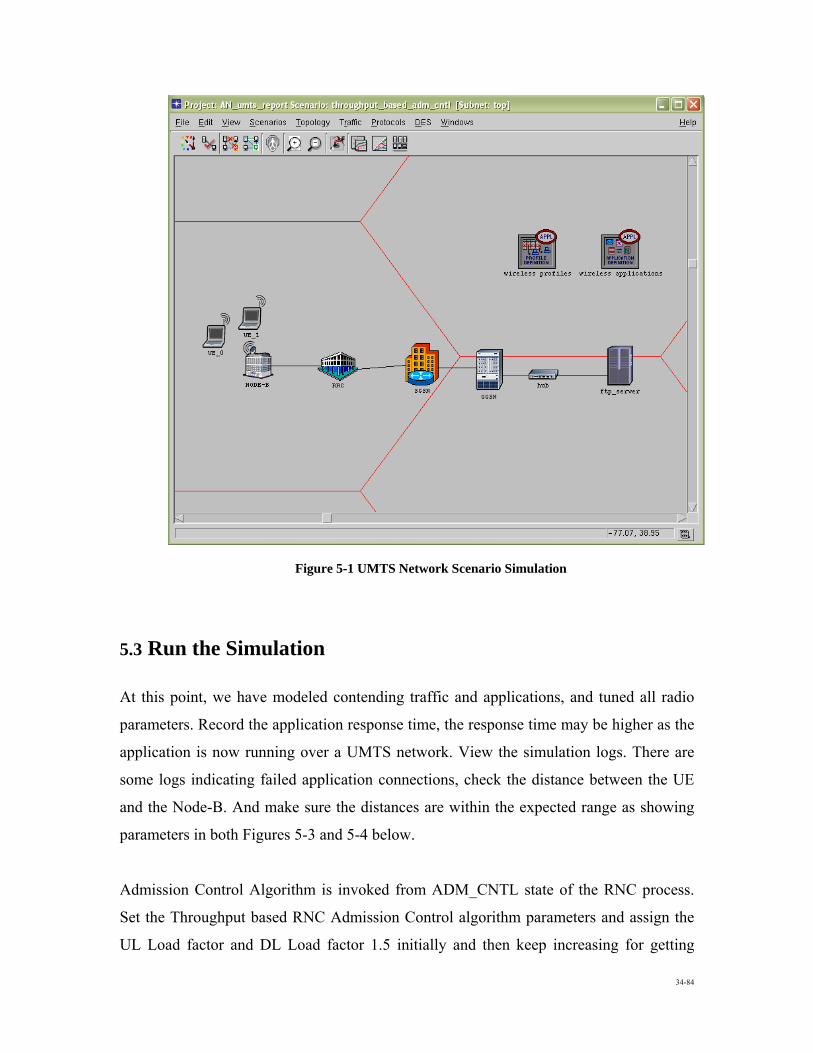
5. Examining the Effect of loading factor on System Performance ………….. 32
5.1 Model the UMTS Network Environment …………………………… 32 5.2 Model the Effect using Static Scenario ……………………………… 33 5.3 Run the Simulation …………………………………………………… 34 5.3.1 Opting Statistics ………………………………………………………. 38 5.4 Analyze Results ……………………………………………………….. 40 5.5 Summary ………………………………………………………………. 53
6. Conclusion …………………………………………………………………….. 54
6.1 Significant Results ……………………………………………………. 54 7. References …………………………………………………………………….. 55 Appendix A Simulation Web Generate Report …………………………………… 58 Appendix B OPNET™ Modeler ver 11.5 UMTS Attributes …………………….. 71
9-84
1. Introduction
The mobile communication networks are continuously expanding not only in the terms of
size but also in the terms of traffic and services that are provided and supported. Also, the
new generation mobile telecommunication platform like the UMTS which are considered
to be the fundamental elements for the foreseen 4G (4th Generation) networks with the
superior broadband capabilities in data services, will further increase the demand for
telecommunication resources and produce new type of traffic profiles. The need for
supporting various applications and services in the broadband and complex cellular radio
environment like the UMTS (Universal Mobile Telecommunications Systems) is one of
the main reasons for introducing much more intelligent and complex CAC (Call
Admission Control) techniques.
The goal of 3G (3rd Generation) mobile communication systems is the delivery of
multimedia services to the user in the mobile domain. This requires the provision of user
data rates that are substantially higher than those provided by today’s 2G (2nd Generation)
networks.
3G cellular services are now offered in a number of countries around the world.
Multimedia applications with various bit rates and QoS (Quality of Service) requirements
have steadily become to dominate the wireless communication environment.
UMTS technology has been established as one of the main air interface for 3G mobile
systems standardized by 3GPP (3rd Generation Partnership Project). UMTS is envisioned
as the successor to GSM (Global System for Mobile Communications). UMTS also
referred to as WCDMA (Wideband Code Division Multiple Access), is one of the most
significant advances in the evolution of telecommunications into 3G networks. UMTS
allows many more applications to be introduced to a worldwide base of users and
provides a vital link between today’s multiple GSM systems and the ultimate single
worldwide standard for all mobile telecommunications, IMT-2000 (International Mobile
Telecommunications–2000).
10-84
UMTS supports up to 11Mbps data transfer rates in theory, although at the moment users
in deployed networks can expect a performance up to 384kbps for R99 handsets, and 1-
2Mbps for HSDPA (High-Speed Downlink Packet Access) handsets in the downlink
connection. This is still much greater than the 14.4kbps of a single GSM error-corrected
CS (Circuit Switched) data channel or multiple 14.4kbps channels in HSCSD (High-
Speed Circuit-Switched Data) and in competition to other network technologies such as
CDMA-2000, PHS (Personal Handy-phone System) or WLAN (Wireless LAN) offers
access to the WWW (World Wide Web) and other data services on mobile devices.
UMTS offers tele-services (like sms or speech) and bearer services, which provide the
capability for information transfer between AP (Access Points). It is possible to negotiate
and renegotiate the characteristics of a bearer service at session or connection
establishment and during ongoing session or connection. Bearer services have different
QoS parameters for maximum transfer delay, delay variation and bit error rate. UMTS
provides a broad range of network services. Each service is mapped to a certain QoS
traffic class, i.e.:
i. Conversational (voice, video telephony, video gaming)
ii. Streaming (multimedia, video on demand, web cast)
iii. Interactive (web browsing, network gaming, database access)
iv. Background (email, sms, downloading)
The main describing factor between these QoS classes is how delay sensitive the traffic
is: Conversational class is meant for traffic which is very delay sensitive while
Background is the most delay insensitive traffic class.
Conversational and Streaming classes are mainly intended to be used to carry real-time
traffic flows. The main divider between them is how delay sensitive the traffic is.
Conversational real-time services, like video telephony, are the most delay sensitive
applications and those data streams should be carried in Conversational class.
11-84
Interactive and Background classes are mainly meant to be used by traditional Internet
applications like WWW, Email, Telnet, FTP and News. Due to looser delay
requirements, compare to conversational and streaming classes, both provide better error
rate by means of channel coding and retransmission. The main difference between
Interactive and Background is that Interactive class is mainly used by interactive
applications, e.g. interactive Email or interactive web browsing, while Background class
is meant for background traffic, e.g. background download of Emails or background file
downloading. Responsiveness of the interactive applications is ensured by separating
interactive and background applications. Traffic in the Interactive class has higher
priority in scheduling than Background class traffic, so background applications use
transmission resources only when interactive applications do not need them. This is very
important in wireless environment where the bandwidth is low compared to fixed
networks.
In UMTS radio interface, CAC (Call Admission Control) is a more complex problem
than in 2G systems. As a matter of fact, the capacity of each call is not limited by the
number of available radio channels, but it depends on the interference levels on each
radio link of the network. This allows a more flexible use of radio resources and a
dynamic adaptation to different traffic distributions.
In UMTS networks the soft capacity concept applies, each new call increases the
interference level of all other ongoing calls, affecting their quality. Therefore it is very
important to control the access to the network in a suitable way.
Blocking and dropping are used to prevent the system from an outage situation but their
probability of occurrence is greatly reduced. Reserved bandwidth is used thoroughly as a
means of improving overall QoS. A CAC mechanism decides whether a RAB (Radio
Access Bearer) request should be accepted or rejected.
12-84
2. UMTS Architectural Overview
UMTS network based on three major architectural components/interacting domains,
which are following; as well shown in Figure 2-1 below;
i. CN (Core Network),
ii. UTRAN (UMTS Terrestrial Radio Access Network), and
iii. UE (User Equipment)
And the external networks, it could be traditional PSTN (Public Switched Telephone
Network), ISDN (Integrated Services Digital Network), or IP-based network, depending
on type of the service.
Figure 2-1 UMTS System Overview
The UE (User Equipment) can consist of the MT (Mobile Terminal), the TE (Terminal
Equipment), and the SIM (Subscriber Identity Module). The UTRAN is comprised of the
Node-B (Base Station) and the RNC (Radio Network Controller). The RNC is in charge
of the overall control of logical resources provided by the Node-Bs. The RNC manages
the air interface resources between its Node-Bs and their associated UEs. The Node-B
provides logical resources, corresponding to the resources of one or more cells, to the
RNC. It is responsible for the radio transmission and reception in the cells it controls. A
Node-B can control several cells, managing the network air interface for its associated
UEs. It is responsible for relaying packets between the UEs and its controlling RNC. The
Node-B is also responsible for assisting the RNC with radio resource management
through the NBAP (Node-B Application Protocol) signaling messages. The SGSN
13-84
(Serving GPRS support node) keeps track of the location of individual UEs and performs
security functions and access control. The GGSN (Gateway GPRS support node)
encapsulates packets received from external packet networks (IP) and routes them to the
SGSN.
It is necessary for a network to know the approximate location in order to be able to page
UE. Here is the list of system areas from largest to smallest;
UMTS systems (including satellite)
PLMN (Public Land Mobile Network)
MSC/VLR (Mobile services Switching Center/Visitor Location Register) or
SGSN
Location Area
Routing Area (PS domain)
UTRAN Registration Area (PS domain)
Cell
Sub cell
2.1 CN (Core Network)
The CN provides mobility management, session management and transport for Internet
Protocol packet services in UMTS networks. The CN is divided in CS (Circuit Switched)
and PS (Packet Switched) domains.
The ATM (Asynchronous Transfer Mode) is defined for UMTS core transmission. AAL2
(ATM Adaptation Layer type 2) handles circuit switched connection and packet
connection protocol AAL5 is designed for data delivery.
Both GSM and UMTS use a common packet domain CN to provide PS services. The
packet domain is designed to support several qualities of service levels to allow efficient
data transfer of application traffic ranging from non real-time, intermittent and bursty
14-84
data to real-time voice and video. The SGSN is the node that is serving the UE. It
supports GPRS for UMTS via the Iu interface. The SGSN performs location
management, security, and access control functions for the UEs. The GGSN provides
inter-working with external packet switched networks, and is connected with SGSNs via
the ATM-based interface, Gn. It contains routing information for PS-attached users. This
routing information is used to tunnel data to the UEs current point of attachment (i.e., the
SGSN).
The common CS elements of CN include the MSC/VLR (Mobile Switching
Center/Visitor Location Register), the HLR (Home Location Register), the CGF
(Charging Gateway Functionality), and the EIR (Equipment Identity Register). The
MSC/VLR is used to provide efficient coordination of PS and CS services (i.e., combined
GPRS and non-GPRS location updates). The HLR contains GSM and UMTS subscriber
information. The CGF collects charging records from the SGSNs and GGSNs. The EIR
stores information about user equipment identity.
In order to access the PS services, a UE must make its presence known to the network by
performing a GPRS attach. This makes the UE available via the SGSN for notification of
incoming PS data. In order to send and receive PS data, the UE must activate the Packet
Data Protocol (PDP) context that it wants to use. This operation makes the UE known to
its GGSN and to the external data networks through this gateway. User data is transferred
transparently between the UE and the external data networks with a method known as
encapsulation and tunneling. Data packets are equipped with PS-specific protocol
information and transferred between the UE and the GGSN. This transparent transfer
method enables easy introduction of additional inter-working protocols in the future.
The architecture of the CN may change when new services and features are introduced.
NPDB (Number Portability Data Base) will be used to enable user to change the network
while keeping their old phone number. GLR (Gateway Location Register) may be used to
optimize the subscriber handling between network boundaries. MSC, VLR and SGSN
can merge to become a UMTS MSC.
15-84
2.2 UTRAN (UMTS Terrestrial Radio Access Network)
UTRAN has been defined as an access network. It means that the radio interface
independent functions, essentially call control and mobility management, are outside the
scope of the UTRAN specifications and handled by the core network. UTRAN has
inherited its centralized network architecture with a quite complex central RNC (Radio
Network Controller) and simple Node-B from the 2G GSM system. A Node-B may serve
one or multiple cells.
About fifteen years ago, this basic architecture was designed for GSM to provide wireless
access to the CS, voice-oriented telecommunications network (PSTN). Though in the
meantime the network architecture has been extended to packet data services GPRS
(Global Packet Radio Service), the provision of IP services over GPRS protocols seems
unnecessarily complex. This situation has not improved much by introduction of the 3G
UMTS system, since for sake of a smooth migration, the 3GPP standards bodies decided
not to change network architectures and protocols dramatically. So it is still up to later
releases to cope with the difficulties of evolving 3G networks to optimized IP
environments.
As a central instance, UTRAN manages the provisioning of all necessary bearer services
for control and user traffic in order to establish the RAB (Radio Access Bearer) between
UE and CN.
The UTRAN permits under certain circumstances, the use of multiple radio links across
multiple cells in support of a single UTRAN–UE connection (termed soft handover).
These links may exist across different Node-Bs in neighboring RNCs, in which case the
necessary signaling and data transfers occur across the Iur interface. The Iur also
participates in mobility switching (hard handover) where switching between Iu (UMTS
interface between Access Network and CN) instances occurs. The figure below shows a
simplified version of the protocols running between a UE and the UTRAN. Transport
channels carry control plane or user plane data between the UE and RNC, mapping onto
16-84
physical channels on the air (Uu) interface (allocated by the RRC (Radio Resource
Control) layer) and ATM AAL2 connections over the Iub interface.
Figure 2-2 UTRAN Architecture An important point to note is that on the network side the MAC (Medium Access
Control) layer and RLC (Radio Link Control) layer reside in the RNC, which is where
most of the UTRAN intelligence is concentrated. The FP (Frame Protocol) is responsible
for the relaying of transport channels between the UE and the RNC via the Node B.
The main functions of Node-B are:
Air interface Transmission/Reception
Modulation / Demodulation
CDMA Physical Channel Coding
Micro Diversity
Error Handling
Closed loop power control
17-84
The main functions of RNC are:
RRC (Radio Resource Control)
Admission Control
Channel Allocation
Power Control Settings
Handover Control
Macro Diversity
Ciphering
Segmentation/Reassembly
Broadcast Signaling
Open Loop Power Control
2.3 UE (User Equipment)
The UMTS UE is based on the same principles as the GSM MS, the separation
between ME and the USIM (UMTS Subscriber Identity Module) card. Beneath
Figure 2-3 shows the UE functions. The UE is the counterpart to the various network
elements in many functions and procedures.
18-84
Figure 2-3 UE Functions
UE work as an air interface counter part for Node-B and have many different types of
identities. Most of these identity types of UMTS are taken directly from GSM
specifications. Here are some:
IMSI (International Mobile Subscriber Identity)
TMSI (Temporary Mobile Subscriber Identity)
P-TMSI (Packet Temporary Mobile Subscriber Identity)
TLLI (Temporary Logical Link Identity)
MSISDN (Mobile Station ISDN)
IMEI (International Mobile Station Equipment Identity)
IMEISV (International Mobile Station Equipment Identity and Software Number)
19-84
UMTS MS or UE can operate in one of three modes of operation:
PS/CS mode of operation: The MS is attached to both the PS domain and CS
domain, and the MS is capable of simultaneously operating PS services and CS
services.
PS mode of operation: The MS is attached to the PS domain only and may only
operate services of the PS domain. However, this does not prevent CS-like
services to be offered over the PS domain like VoIP.
CS mode of operation: The MS is attached to the CS domain only and may only
operate services of the CS domain.
20-84
3. CAC Strategies
As a substantive function of traffic control, CAC has been intensively investigated from
both data communication and telecommunication communities. The objective of CAC
schemes is to accommodate in an optimal way, a maximum number of connection
requests and at the same time, maintain the agreed QoS for existing connections. This is
done by managing the available network resources and allocating them according to a
particular strategy, among the users [15].
Conventional CAC strategies in wire line networks are complete sharing, complete
partitioning and threshold. In the complete sharing strategy, calls of all classes share the
bandwidth resources. Whereas in the complete partitioning strategy, bandwidth for each
class is exclusively reserved. In the threshold strategy, a newly arriving call is blocked if
the number of calls of each class is greater than a predefined threshold [16]. In an IP
network CAC could be collectively considered with policing, shaping and resource
allocation [18].
For a CDMA based system like UMTS, the CAC strategies can be roughly classified into
two approaches as discussed in Holma, H., Toskala, A. “WCDMA for UMTS” Radio
Access for Third Generation Mobile Communications. New York: John Willey & Sons,
2000
Measurement-based CAC: a new call is rejected if the number of ongoing
connections has already reached system limit.
Interference-based CAC: a new call is rejected if the observed interference level
exceeds a predefined threshold.
The Interference-based CAC uses SIR (Signal-to-Interference Ratio) to ensure that the
interference created after adding a new call does not exceed a pre-specified threshold [19,
20], and it is more often adopted in the literature. Usually, the interference from other
21-84
existing connections within the same cell and the neighboring cells are considered in SIR
calculation. One can also consider CAC in a system comprising of hierarchical cells [21].
In order to verify the performance of various CAC strategies, blocking probability for
new calls and outage probability of existing calls are commonly used as the criteria for
decision making. Since dropping a call is more annoying for a user than being blocked as
a new call, GoS (Grade of Service), which is equal to the sum of the blocking probability
plus ten times of the dropping probability, is utilized for performance evaluation. More
recent work defined a more complex GoS by weighting the blocking probability, handoff
failure and QoS loss in the summation [22].
In a practical system, the CAC function involves both UL (uplink) and DL (downlink)
interference calculation and decision making. A new call should only be admitted if it
passes both DL and UL admission algorithm [23, Chapter 7]. While most CAC schemes
appeared in the literature are focusing on UL, research results on downlink CAC schemes
are relatively fewer [25]. Like many other studies, the CAC scheme proposed in this
thesis also considers only uplink traffic.
As UMTS services are characteristic of high bandwidth, multiple QoS requirements and
asymmetric traffic, we have to face a heterogeneous traffic environment. The delay
tolerance could also be considered in a CAC scheme. Basically, delay tolerable traffic
class can be treated differently from delay stringent traffic class.
3.1 CAC in UMTS Network
CAC and Load Control are processes, which prevent UMTS air interface overloading. In
this network, overloading may cause dropping calls, decreasing of QoS, etc.
CAC algorithm is placed in RNC. Its task is to admit or deny new subscriber access into
the network. Permit is based on current state of air interface and type of service requested
by user.
22-84
CAC must be performed for both of uplink and downlink. When both algorithms are
passed, new connection can be established.
The CAC algorithm has to estimate the increasing of the resources usage the new user
would cause. It is quite difficult, because a new user can also affect the resource
consumption of existing users. The more of cell load means the more of load increase by
new user. It is illustrated below in Figure 3-1.
3.1.1 Interference based CAC
As discussed above this CAC strategy may be used for both uplink and downlink.
However, the directions must be considered separately.
In the uplink a new user is admitted if a new total interference level is under the threshold
value:
Itotal_old + ΔI < Ithreshold (1)
Important task is estimation of interference increase ΔI, which is caused by new user.
Two different methods of this estimation are shown below. Both take into account the
load curve mentioned in Figure 3-1 and load factor of the new connection presented
underneath in Equation (2):
ΔL = 1 / 1 + (W / (v. Eb/N
0 . R)) (2)
Where
W is the chip rate,
R is the bit rate of new user,
Eb/N
0 is the assumed E
b/N
0 of the new connection, and
υ is the assumed voice activity of the new connection
23-84
The first one is the derivative method. It is based on the derivative of uplink interference
with respect to the uplink load factor which can be calculated as follows:
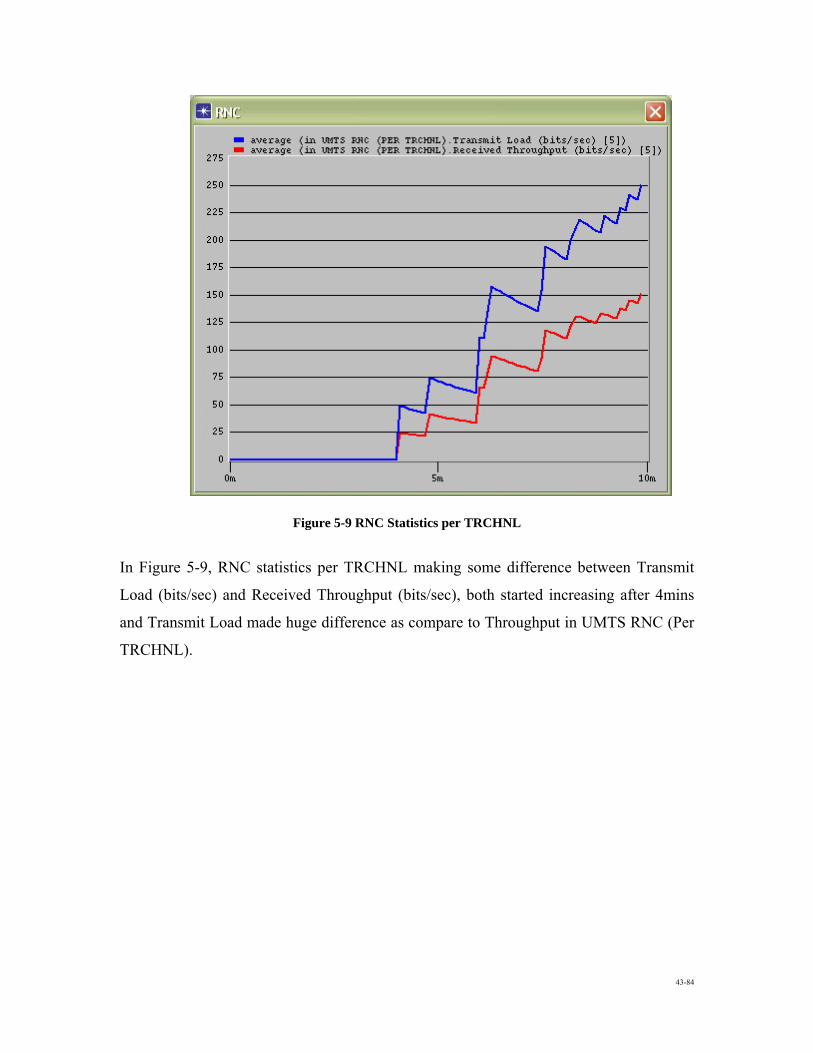
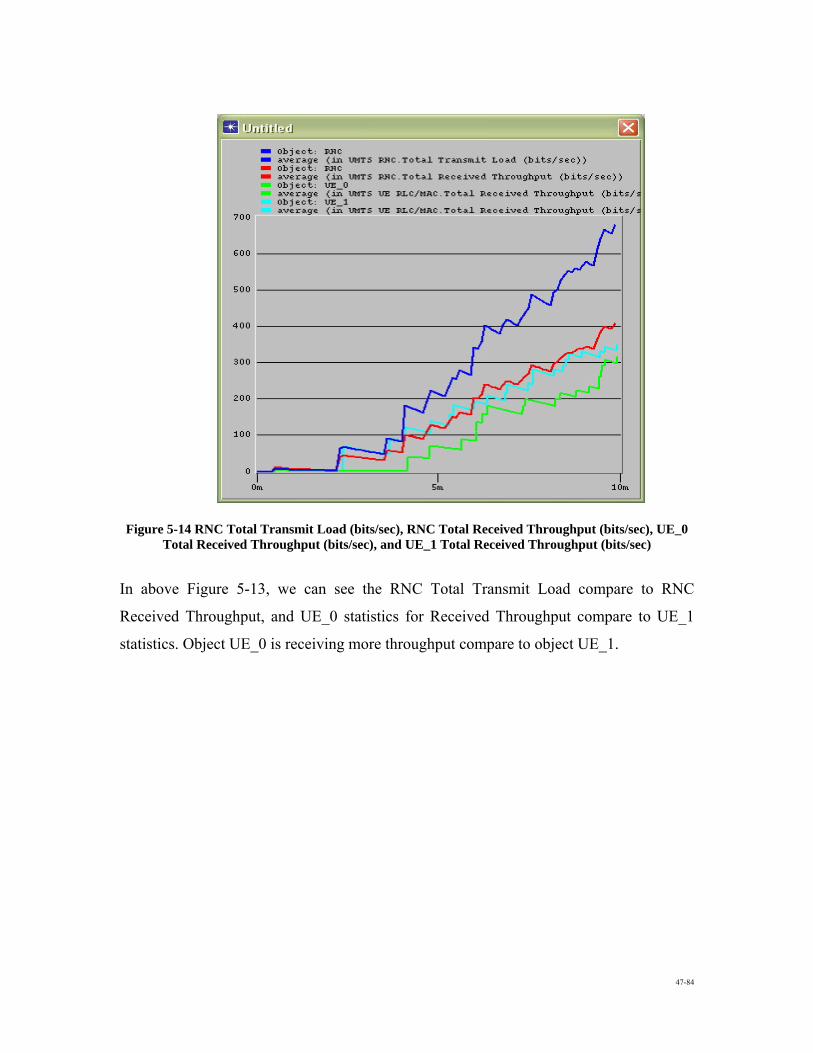
Figure 5-14 RNC Total Transmit Load (bits/sec), RNC Total Received Throughput (bits/sec), UE_0 Total Received Throughput (bits/sec), and UE_1 Total Received Throughput (bits/sec)
In above Figure 5-13, we can see the RNC Total Transmit Load compare to RNC
Received Throughput, and UE_0 statistics for Received Throughput compare to UE_1
statistics. Object UE_0 is receiving more throughput compare to object UE_1.
48-84
Figure 5-15 UE_0 (Per QoS) End-end end Delay (sec) and RAN DL Delay (sec)
In above Figure 5-14 illustrate the average graph of End-to-end and RAN DL Delay basis
on per QoS for UE_0, having very slightly difference in delay.
49-84
Figure 5-16 Node-B to RNC point-to-point throughput (bits/sec) for UL and DL
Figure 5-17 Node-B to RNC point-to-point Utilization
50-84
Figure 5-18 Node-B to RNC average in point-to-point queuing delay
Figure 5-19 FTP Traffic average sent and received (bytes/sec)
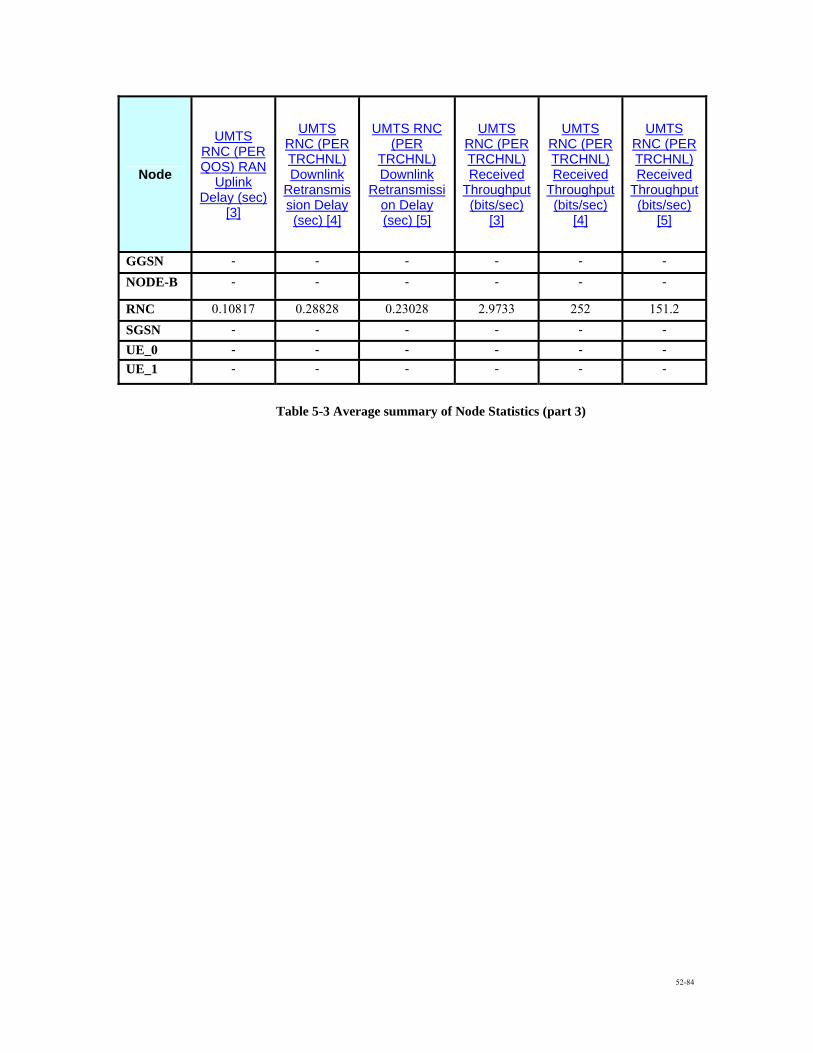
Table 5-3 Average summary of Node Statistics (part 3)
53-84
5.5 Summary The UMTS simulation environment successfully modeled a UMTS network. The
enhancements to the OPNET™ model library created an environment to investigate the
issues and tradeoffs for the CAC in UMTS networks. The model worked well for
investigating UMTS offered load and throughput.
The model has a limitation in the way the UMTS network allocates DCH channels. The
RNC allocated only one DCH channel for a data session, even when it was the only data
session in progress, thus wasting available resources.
The model worked well for studying application performance. It provided an
environment for studying application performance for a variety of traffic loads. The
model demonstrated that the users accessing the UMTS access network experienced
significantly reduced application delays for a range of normal operating conditions. It
demonstrated that the UMTS access network scaled well for both DL throughput and
offered load.
54-84
6. Conclusion In 1990s the telecommunications industry in North America experienced significant
growth for both cellular telephone and internet usage. In consequence both Internet
access and cellular telephones have become common household commodities. Attempts
to integrate data services into cellular networks have brought the limitations of both the
internet and the cellular network into sharp focus. The Internet’s best effort model cannot
support the real time constraints of a voice conversation. While, the low data rates of
cellular telephone network are not sufficient for web-browsing or large file transfers.
Research is in process to improve both the cellular telephone network and the internet.
Emerging 3G Wireless Networks will focus on supporting data traffic with increased data
rates. The report and simulation presented in this document focused on investigating the
CAC in UMTS Networks.
6.1 Significant Results The purpose of this report effort is to design, implement, and test a network system level
simulation environment to allow investigators to study the issues for CAC into UMTS.
The key contribution of this report is to augment the current OPNET™ model library by
creating Throughput based Admission Control in UMTS.
The simulation environment was designed in OPNET Modeler™ ver11.5 using a top-
down design approach. The UMTS Network was designed at the node level using both
built-in OPNET™ and user-defined processes, the details of this design were covered in
Section 4 above. The validation process compared simulation and theoretical results to
ensure that the simulation environment was representative a real system. The simulation
environment was tested under different scenarios, as described in Section 5.
55-84
7. References [01] OPNET™ Modeler http://www.opnet.com/products/modeler [02] 3GPP, “Universal Mobile Telecommunication System (UMTS); QoS Concept
and Architecture”, TS 23.107 v.3.5.0, http://www.3gpp.org, 1999
[03] Y. Fang, Yi Zhang, “CAC Schemes and Performance Analysis in Wireless Mobile Networks”, IEEE Transactions on Vehicular Technology, Vol. 51, No. 2, March 2002
[05] E. Elmallah, N. Naseer, H. Hassanein, A. Oliver, “QoS-Aware CAC in WCDMA
Wireless Networks“
[06] E. Elmallah, N. Naseer, H. Hassanein, A. Oliver, “Uplink QoS-Aware Admission Control in WCDMA Networks with Class-Based Power Sharing”, IEEE International Conference on QoS in Heterogeneous Wired/Wireless Networks (QShine), Dallas Texas, Oct. 2004, pp. 10-17
[07] H. Holma, A. Toskala, “WCDMA for UMTS; Radio Access for Third Generation
[10] “UMTS: Application Networkability and Capacity Planning”, Methodologies and
Case Studies, OPNET™ Technologies Inc.
[11] “UMTS; Quality of Service (QoS) concept and architecture”, 3GPP TS 23.107 version 6.4.0 Release 6, 2006-03
[12] F. Yong Li, “Quality of Service, Traffic Conditioning and Resource Management
in Universal Mobile Telecommunication System (UMTS)”, Dept. of Telematics, Norwegian University of Science and Technology, Jan. 2003
[13] A. Capone, S. Redana, “CAC Techniques for UMTS”, Piazza L. da Vinci 32,
20133 Milan, Italy [14] A. Capone, S. Redana, “Received Power based CAC Techniques for UMTS
Uplink”, Piazza L. da Vinci 32, 20133 Milan, Italy
56-84
[15] N. Dimitriou, G. Sfikas, and R. Tafazolli, “Quality of Service for Multimedia CDMA,” IEEE Communications Magazine, vol. 38, pp. 88–94, July 2000.
[16] J. Choi, T. Kwon, Y. Choi, and M. Naghshineh, “Call Admission Control for
Multimedia Services in Mobile Cellular Networks: A Markov Decision Approach,” in Proc. IEEE International Symposium on Computers and Communications, (New York, USA), pp. 282–286, Aug. 2000.
[17] Y. Ishikawa and N. Umeda, “Capacity Design and Performance of Call
Admission Control in Cellular CDMA Systems,” IEEE Journal on Selected Areas in Communications, vol. 15, pp. 1627–1635, Oct. 1997.
[18] R. Yavatkar, D. Pendarakis, and R. Guerin, “A Framework for Policy-based
Admission Control,” RFC 2753, IETF, Jan. 2000. [19] A. M. Viterbi and A. J. Viterbi, “Erlang Capacity of a Power Controlled CDMA
Sytem,” IEEE Journal on Selected Areas in Communications, vol. 11, pp. 892–900, Aug. 1993.
[20] Z. Liu and M. E. Zarki, “SIR-Based Call Admission Control for DS-CDMA
Cellular Systems,” IEEE Journal on Selected Areas in Communications, vol. 12, pp. 638–644, May 1994.
[21] T. T. Pham, A. Perkis, and F. Y. Li, “Call Admission Control Algorithm for
Multichannel Users in Hierarchical Cellular Systems,” in Proc. IEEE International Conference on Third Generation Wireless and Beyond, (San Francisco, USA), June 2001.
[22] V. Phan-Van and S. Glisic, “Radio Resource Management in CDMA Cellular
Segements of Multidemia Wireless IP Networks,” in Proc. The 4th International Symposium on Wireless Personal Mutimedia Communications, (Aalborg, Denmark), pp. 57–73, Sept. 2001.
[23] R. Prasad,W. Mohr, andW. Kon¨auser (ed.), Third Generation Mobile
Communication System. London: Artech House, 2000. [24] T. Shan and O.W.W. Yang, “Improving Resource Utilization for the Rate-
Controlled Traffic Flows in High Speed Networks,” in Proc. IEEE International Conference on Communications, (Vancouver, Canada), pp. 864–868, June 1999.
[25] C. Mihailescu, X. Lagrange, and P. Godlewski, “Radio Resource Management for
Packet Transmission in UMTS WCDMA System,” in Proc. IEEE Vehicular Technology Conference, (Amsterdam, The Netherlands), pp. 573–577, Sept. 1999.
57-84
[26] S. Choi and K. G. Shin, “An Uplink CDMA System Architecture with Diverse QoS Guarantees for Heterogeneous Traffic,” IEEE/ACM Transactions on Networking, vol. 7, pp. 616–628, Oct. 1999.
[27] C. Chao and W. Chen, “Connection Admission Control for Mobile Multiple-Class
Personal Communications Networks,” IEEE Journal on Selected Areas in Communications, vol. 15, pp. 1618–1626, Oct. 1997.
[28] Y. Guo and H. Chaskar, “Class-Based Quality of Service over Air Interface in 4G
Mobile Networks,” IEEE Communications Magazine, vol. 40, pp. 132–137, May 2002.
[29] S. Kim, T. Kwon, and Y. Choi, “Call Admission Control for Prioritized Adaptive
Multimedia Services in Wireless/Mobile Networks,” in Proc. IEEE Vehicular TechnologyConference, (Tokyo, Japan), pp. 1536–1540, May 2000.
[30] F. Y. Li and N. Stol, “A Priority-oriented Call Admission Control Paradigm with
QoS Re-negotiation for Multimedia Services in UMTS,” in Proc. IEEE Vehicular Technology Conference, (Rhodos, Greece), pp. 2021–2025, May 2001.
[31] T-K. Liu and J. A. Silvester, “Joint Admission/Congestion Control for Wireless
CDMA Systems Supporting Integrated Services,” IEEE Journal on Selected Areas in Communications, vol. 16, pp. 845–857, Aug. 1998.
[32] D. Shen and C. Ji, “Admission Control of Multimedia Traffic for Third
Generation CDMA Network,” in Proc. IEEE Conference on Computer Communications, (Tel-Aviv, Israel), pp. 1077–1086, Mar. 2000.
[33] Z. Ruzicka, S. Hanus, “Admission Control and Load Control in UMTS Network”,
Institute of Radio Electronics, Brno University of Technology
58-84
Appendix A Simulation Web Generate Report
OPNET Simulations Results
Reports are available for the following projects:
AN_umts_adm_cntl
Reports for the following scenarios of the project "AN_umts_adm_cntl" are available:
throughput_based_adm_cntl
59-84
Project: AN_umts_adm_cntl Report: User Selected
Scenario: throughput_based_adm_cntl
Title: Global Statistics Summary
Ftp
Statistic Average Maximum Minimum
Ftp Download Response Time (sec) 0.9684 1.3027 0.7126 Ftp Traffic Received (bytes/sec) 100.80 756.00 0.00 Ftp Traffic Sent (bytes/sec) 100.80 756.00 0.00