University of Birmingham Effects of flow constriction on foamed viscous shear-thinning fluids downstream of a continuous multi rotor-stator foaming device Jabarkhyl, Saifullah; Zhu, Shiping; Barigou, Mostafa DOI: https://doi.org/10.1016/j.jfoodeng.2020.110341 Citation for published version (Harvard): Jabarkhyl, S, Zhu, S & Barigou, M 2020, 'Effects of flow constriction on foamed viscous shear-thinning fluids downstream of a continuous multi rotor-stator foaming device', Journal of Food Engineering, vol. 292, 110341. https://doi.org/10.1016/j.jfoodeng.2020.110341 Link to publication on Research at Birmingham portal General rights Unless a licence is specified above, all rights (including copyright and moral rights) in this document are retained by the authors and/or the copyright holders. The express permission of the copyright holder must be obtained for any use of this material other than for purposes permitted by law. • Users may freely distribute the URL that is used to identify this publication. • Users may download and/or print one copy of the publication from the University of Birmingham research portal for the purpose of private study or non-commercial research. • User may use extracts from the document in line with the concept of ‘fair dealing’ under the Copyright, Designs and Patents Act 1988 (?) • Users may not further distribute the material nor use it for the purposes of commercial gain. Where a licence is displayed above, please note the terms and conditions of the licence govern your use of this document. When citing, please reference the published version. Take down policy While the University of Birmingham exercises care and attention in making items available there are rare occasions when an item has been uploaded in error or has been deemed to be commercially or otherwise sensitive. If you believe that this is the case for this document, please contact [email protected] providing details and we will remove access to the work immediately and investigate. Download date: 20. Jan. 2022
Transcript
University of Birmingham
Effects of flow constriction on foamed viscousshear-thinning fluids downstream of a continuousmulti rotor-stator foaming deviceJabarkhyl, Saifullah; Zhu, Shiping; Barigou, Mostafa
Citation for published version (Harvard):Jabarkhyl, S, Zhu, S & Barigou, M 2020, 'Effects of flow constriction on foamed viscous shear-thinning fluidsdownstream of a continuous multi rotor-stator foaming device', Journal of Food Engineering, vol. 292, 110341.https://doi.org/10.1016/j.jfoodeng.2020.110341
Link to publication on Research at Birmingham portal
General rightsUnless a licence is specified above, all rights (including copyright and moral rights) in this document are retained by the authors and/or thecopyright holders. The express permission of the copyright holder must be obtained for any use of this material other than for purposespermitted by law.
•Users may freely distribute the URL that is used to identify this publication.•Users may download and/or print one copy of the publication from the University of Birmingham research portal for the purpose of privatestudy or non-commercial research.•User may use extracts from the document in line with the concept of ‘fair dealing’ under the Copyright, Designs and Patents Act 1988 (?)•Users may not further distribute the material nor use it for the purposes of commercial gain.
Where a licence is displayed above, please note the terms and conditions of the licence govern your use of this document.
When citing, please reference the published version.
Take down policyWhile the University of Birmingham exercises care and attention in making items available there are rare occasions when an item has beenuploaded in error or has been deemed to be commercially or otherwise sensitive.
If you believe that this is the case for this document, please contact [email protected] providing details and we will remove access tothe work immediately and investigate.
MF4 and MF5, whose composition and physical properties are summarised in Table 1. Foams were 141
generated by aerating the model fluids in a pilot-scale continuous multi rotor-stator unit (Megatron FM 142
12- 50/2 HR) depicted in Fig. 1. The geometrical dimensions of the 12 rotor-stator pairs positioned in 143
series inside the foam generator are provided in Table 2. A Julabo F-25 cooling system enabled the 144
foam temperature at the outlet of the foaming unit to be kept approximately equal to the inlet feed 145
temperature (20 °C). Foams of different textures were obtained by using combinations of liquid and air 146
flowrates within the range 2.5 – 5.0 L h-1 and 0.1 – 12.5 L hr-1, respectively. Further details of the 147
5
protocols adopted for the preparation of the model fluids and foams can be found in our previous work 148
(Jabarkhyl et al., 2020a, Jabarkhyl et al., 2020b). 149
150
2.2 Foam characterisation 151
The foams produced were characterised by determining their air volume fraction, their bubble size 152
distribution and their rheological properties. 153
154
2.2.1 Air volume fraction 155
The foam air fraction (e) was experimentally determined by collecting foam samples of known volume 156
at the outlet of the foam generator and measuring the mass of liquid within. The foaming process aims 157
to maximise e and achieve the maximum theoretical value �����
, defined in terms of the pressure-158
dependent volumetric air flowrate ����� and liquid volumetric flowrate QL, as: 159
160
����� = ����
���� � (1) 161
162
The effects of pressure are taken into account through the ideal gas law, thus: 163
164
�� = �� ������ �����
� � 165
166
where FE is the foam expansion ratio dependent on pressure, air and liquid flowrate in the mixing-head 167
chamber and ��������
is the equivalent air volume fraction at atmospheric pressure Patm. 168
169
Another important parameter is the average residence time, , inside the mixing-head chamber of the 170
foam generator (Fig. 1) which can be estimated using the foam volumetric flowrate (Vfoam) and the 171
volume of the mixing-head chamber (V = 85 mL), thus: 172
173
� = ������
= �� �
��� 174
175
2.2.2 Foam bubble size distribution 176
A foam sample of about 5 ml was carefully placed inside a plastic drinking straw using a pipette and 177
sealed prior to scanning. X-ray micro-Computed Tomography measurements were performed on a 178
Skyscan instrument (Skyscan 1172, Bruker, Belgium) operating at a source voltage of 80 kV and current 179
of 98 μA, with an image resolution of 3.78 µm pixel-1 × 5.78 µm pixel-1. No filter was used since foam 180
has a low density and a low attenuation coefficient. Each sample was scanned over 180 degrees in 181
6
discrete steps of 0.4 degree with a frame averaging of 4 to acquire up to 1200 radiographic images of 182
1048 × 2000 pixels. The scan duration was limited to less than 20 min to avoid any significant effects 183
arising from gravity drainage of the foam. A computer recorded the images for subsequent 184
reconstruction using NRecon software (Bruker micro-CT, Belgium), based on the principle of filtered 185
back-projection utilising the method of cone-beam reconstruction. At least three samples of the same 186
foam were scanned to obtain statistically significant results. Depending on the scanning parameters 187
implemented, the reconstruction procedure took approximately 5 10 min. Finally, the projection 188
images were uploaded to a CTan software (Bruker micro-CT, Belgium) for detailed image analysis. 189
The technique provides non-invasively a high-resolution 3D model of the microstructure of a stable 190
foam, from which the bubble size distribution and various descriptive statistics are derived including 191
the Sauter mean bubble diameter (D32) defined as: 192
193
��� = ∑ �� �!
∑ �� �" (4) 194
195
where n is the number of bubbles of diameter d in class size i. The technique and its protocol have been 196
described in more detail in our previous works (Lim and Barigou, 2004, Barigou and Douaire, 2013, 197
Jabarkhyl et al., 2020a). 198
199
2.2.3 Rheological properties of model fluids and foams 200
The oscillatory rheology of the foams studied was characterised at 25 °C using a 40 mm parallel-plate 201
geometry with a gap of 2.0 mm fitted on a controlled stress/strain rheometer (Discovery HR-2, Hybrid 202
Rheometer, TA, USA). Amplitude sweep tests with % strain varying in the range 0.01 to 1000% were 203
conducted at 1 Hz frequency to determine the viscoelastic moduli �#$, #$$). The use of roughened plates 204
(58 µm equivalent grit size) enabled the elimination of slip. Measurements were repeated at least three 205
times using fresh samples and an average obtained. The measurement time was kept short to avoid 206
foam drainage effects. More details on the rheometry procedures adopted can be found in our previous 207
work (Jabarkhyl et al., 2020b). 208
209
2.3 Foam flow through an orifice constriction 210
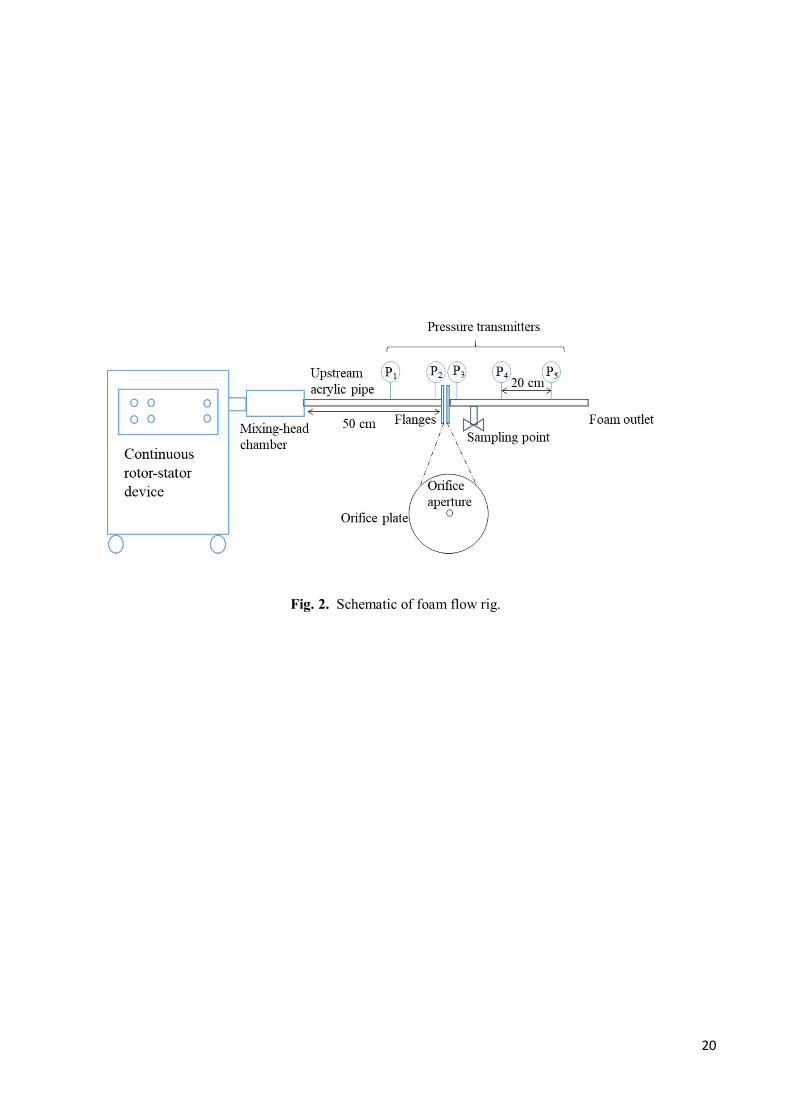
The foam flow rig consisted of two lengths of acrylic pipe of 30 mm diameter and 0.5 m length 211
connected by bolted flanges, as schematically represented in Fig. 2. Digital pressure transducers 212
(Druck, UK) connected to a computer via a data logger (PicoLog 1000 Series), were installed along the 213
flow pipe including at the inlet and at the exit of the constriction for pressure drop measurements. A 214
thin stainless-steel orifice plate (1.5 mm thick) was inserted between the two flanges to act as a 215
constriction to the foam flow. The orifice sizes investigated were: Do = 0.4, 0.5, 0.6, 0.8 and 1.8 mm 216
7
diameter corresponding, respectively, to orifice-pipe area ratios of Ao/A = 0.00020; 0.00032; 0.00046; 217
0.00082; 0.00413). A foam sampling point was fitted at the exit of the constriction. 218
219
In a typical experiment, foam generated by the continuous rotor-stator device is fed directly into the 220
flow pipe. Foam samples are collected at the exit of the constriction for off-line analysis using an X-221
ray micro-CT technique to determine the bubble size distribution. At this point, the foam pressure 222
would have dropped to nearly atmospheric and sampling at the wall does not introduce any significant 223
effects on the foam microstructure. Upstream of the constriction, however, the foam pressure is high 224
and wall sampling would cause expansion of the foam. Hence, the foam is photographed in-situ at the 225
pipe wall using a digital camera fitted onto a Leica microscope with a variable zoom lens, and the 226
bubble size distribution determined via image analysis using ImageJ software. Typically, a sample of 227
at least 500 bubbles is used and only bubbles in the centre of an image are analysed to avoid curvature 228
effects. It should be pointed out, however, that imaging at the wall does not yield accurate information 229
on the full 3D microstructure of the foam and is only used as a rough indication of the bubble size when 230
other means of visualisation are not possible (Deshpande and Barigou, 2000, Deshpande and Barigou, 231
2001a, Deshpande and Barigou, 2001b). Before taking measurements, the foam is allowed to flow 232
through the constricted pipe for up to 20 min until steady state conditions are reached, i.e. when pressure 233
readings and volume fraction of the foam collected at the exit of the pipe stabilise. 234
235
2.4 Foam static stability 236
Foam static stability was determined by monitoring, at a constant temperature of 50°C over a period of 237
several weeks, liquid drainage in 50 mL samples collected at relevant points of the flow system. Thus, 238
transients of drained liquid were obtained for all experimental conditions investigated. In each case, 239
three samples were analysed and an average obtained. 240
241
2.5 Statistical analysis 242
All measurements were performed in triplicate. A one-way analysis of variance (ANOVA) was 243
conducted using the well-known Minitab statistical software, and a Tukey’s pairwise comparison test 244
was performed to find statistically significant results (i.e. p < 0.05). Results are reported as mean values 245
± standard deviation in Tables 3 6. 246
247
3. Results and discussion 248
3.1 Aeration efficiency 249
Aeration efficiency ( = e/th) is an important feature of the foam generation process which indicates 250
the ability to incorporate all of the available gas into the foaming liquid to make a homogeneous foam. 251
Thus, optimum aeration is achieved when the theoretical and experimental values of volume gas 252
8
fraction are equal (Eq. (1)). At atmospheric pressure, i.e. when the foam flow rig is not connected to 253
the rotor-stator device and the generated foam is simply discharged to atmosphere, maximum aeration 254
efficiency was achieved for all model fluids at most rotor speeds when the G/L ratio (ratio of air to 255
liquid volumetric flowrate) was set to 1.0, 1.5 and 2.0, corresponding respectively to �������� =256
0.50, 0.60 and 0.67. These conditions were also achieved when the foam flow rig was connected to 257
the foam generator unit and flow took place through the short straight pipe without a constriction; in 258
this case the pressure inside the mixing-head chamber was close to atmospheric given that the linear 259
pressure drop in the pipe was small (~ 0.1 bar), as shown in Table 3. Such a low pressure drop along 260
the pipe did not have any significant effects on the microstructure of the flowing foam including bubble 261
size and gas holdup. 262
263
In the presence of a flow constriction, maximum aeration efficiency was only achieved when the 264
pressure drop ΔPc across the constriction was below 1.0 bar, independent of the G/L ratio used (Table 265
3). The reduction in aeration efficiency with increasing pressure drop may be attributed to the relatively 266
large increase in bubble size across the constriction caused by bubble coalescence - note that bubble 267
expansion through the constriction accounts for only a relatively small part (~ 20%) of this increase in 268
bubble size. 269
270
3.2 Effects of processing parameters on bubble size distribution 271
3.2.1 Effects of residence time 272
Whilst it is well known that increasing the rotor speed reduces bubble size (Jabarkhyl et al., 2020a, 273
Mary et al., 2013, Müller-Fischer,Suppiger and Windhab, 2007b), the effects of residence time and G/L 274
ratio are not always clearly identified. For example, Muller-Fischer, Suppiger & Windhab (2007b) 275
reported that a longer residence time led to a smaller bubble size, whereas Mary et al. did not observe 276
a clear trend. Such conflicting reports may be due to differences in foaming solutions (Newtonian, non-277
Newtonian), processing parameters and hydrodynamic conditions (rotor speed, pressure and G/L ratio, 278
laminar flow, turbulent flow), imaging procedures (online, off-line) and different rotor-stator 279
geometries; in addition, the cross-influence of residence time and dispersion viscosity is not taken into 280
account in most cases (Müller-Fischer,Suppiger and Windhab, 2007b, Mary et al., 2013). 281
282
In this study, for a fixed G/L ratio, doubling the residence time led to a significant reduction in bubble 283
size, as shown in Fig. 3, the extent of reduction being a function of G/L ratio and N. The smaller the 284
G/L ratio, the greater the influence of residence time on the bubble size distribution (BSD) and, hence, 285
on D32. Increasing the G/L ratio (i.e. increasing e) and leads to a narrower, more uniform BSD; the 286
effects of reduce as the G/L ratio and N increase. These observations can be explained in terms of 287
bubble breakage and coalescence frequency inside the mixing-head chamber. At smaller G/L ratios, 288
9
the probability of bubble coalescence is low and bubble breakage is predominant and, hence, a longer 289
residence time results in a smaller bubble size. At higher G/L ratios, the larger bubble number density 290
leads to an equilibrium between bubble breakage and coalescence, which reduces the effect of . Under 291
all conditions, the effect of diminishes with increasing N. It should also be pointed out that substantial 292
variations in are required to generate any noticeable effects on bubble size. 293
294
3.2.2 Effects of air volume fraction 295
Typical results depicting the effects of air volume fraction on bubble size for a fixed residence time ( 296
= 40 s) are shown in Fig. 4. The BSD is more or less the same for G/L ≤ 1.0, however, the BSD 297
becomes much narrower and more uniform for G/L ≥ 1.5. The data fall into two distinct regions: (i) a 298
region of constant D32 corresponding to low and medium e values; and (ii) a region of sharp decline in 299
D32 at higher gas volume fractions. Müller-Fischer, Suppiger and Windhab (2007b) using a similar 300
rotor-stator device, but a different non-Newtonian fluid formulation and operating at much higher rotor 301
speeds and a much shorter residence time, reported the same plateau region beyond which, however, D32 302
increases sharply as a function of e. The rise in bubble size was attributed to the increased coalescence 303
rate because of the higher rotor speeds and the higher e values they used as well as the significant time 304
lag between foam sampling and bubble size measurement using a light microscope (Müller-305
Fischer,Suppiger and Windhab, 2007b). The latter effect was obviated here because of the high stability 306
of the foams (Jabarkhyl et al., 2020a) and the use of fast X-ray micro-CT analysis. There is no 307
significant effect on BSD for G/L < 1.0, however, the BSD becomes much more uniform for G/L ≥ 1.5. 308
309
3.3 Foam flow through a short straight pipe 310
Initial foam flow experiments were conducted through a short straight pipe without constriction. Using 311
foams generated from the different model fluids (Table 1), varying the foam flowrate in the range 7.5 312
– 16.0 L hr-1 by varying the G/L ratio from 0.5 to 2.0, engendered a maximum pressure drop along the 313
pipe of about 0.1 bar. Such a pressure drop was too low to cause any significant effects on the foam 314
microstructure and texture along the pipe. These foams exhibit high static and quasi-static stability 315
(Jabarkhyl et al., 2020a). 316
317
3.4 Foam flow through a straight pipe with an orifice constriction 318
3.4.1 Effects of G/L ratio 319
The diameter of the orifice constriction was varied in the range 0.5 – 1.8 mm to achieve different 320
pressure drops in the foam flow (Table 3). X-ray micro-CT images showing the microstructure of foams 321
generated from MF2 flowing with and without a flow constriction are depicted in Fig. 5a. In the absence 322
of a flow constriction, the foams exhibit a fine texture characterised by a narrow BSD with a peak at 323
100 µm and the vast majority of bubbles being less than 200 µm. In contrast, in the presence of a flow 324
10
constriction the BSD is much wider and the foam texture much coarser with bubble sizes up to 600 µm 325
being observed. Though the relative frequency of the larger bubbles is small, they do contribute 326
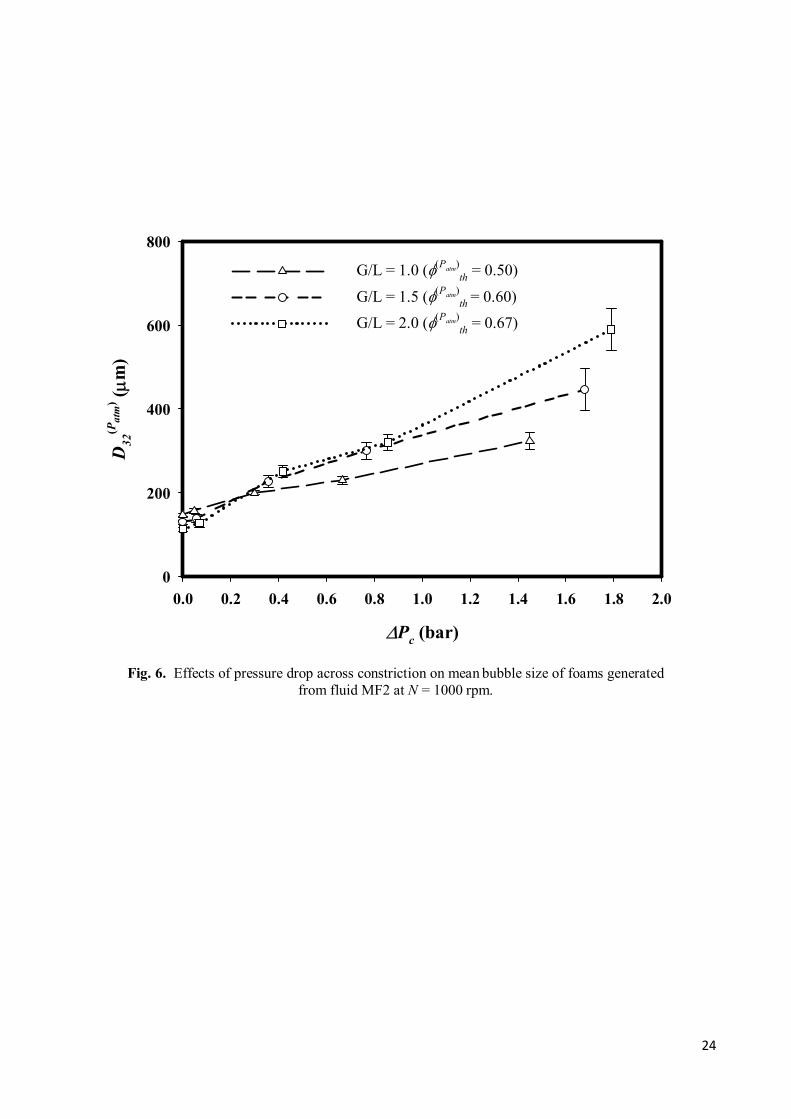
significantly to the Sauter mean diameter, as shown in Fig. 6. 327
328
Over the range of conditions investigated, the mean bubble size measured at the exit of the constriction 329
increased approximately linearly as a function of ΔPc, as shown in Fig. 6. In a short straight pipe (data 330
points corresponding to approximately zero pressure drop), the G/L ratio has a relatively small effect 331
on D32. Upstream of the constriction, the mean bubble size is independent, within experimental error, 332
of the orifice size used, as revealed by the data presented in Table 3. A reduction in orifice size 333
corresponds to an increase in pressure inside the mixing-head chamber, the effect of which seems to be 334
cancelled by a longer residence time leading to a constant mean bubble size. An identical maximum 335
bubble size is expected, provided the air volume fraction and the residence time are kept constant inside 336
the mixing-head chamber, independent of the applied static pressure, since the critical Weber number 337
is independent of pressure (Müller-Fischer, Suppiger and Windhab, 2007b). 338
339
A higher G/L ratio, i.e. a higher gas holdup, causes a significantly larger increase in D32, reflected in a 340
greater slope of the linear trend. Qualitatively similar findings were reported by Müller-Fischer and 341
coworkers for different foam formulations and flow conditions (Müller-Fischer,Suppiger and Windhab, 342
2007b, Müller-Fischer and Windhab, 2005). The results appear to suggest that at low pressure drops, 343
the foam is able to squeeze through the constriction without incurring significant structural damage. As 344
ΔPc increases, the foam texture becomes coarser due to increased bubble coalescence. This effect seems 345
to be even more significant for dryer foams probably because of the higher bubble density and thinner 346
liquid films. To illustrate the severity of the foam degradation that can occur, flow experiments were 347
conducted through an even narrower 0.4 mm orifice creating a much higher pressure drop of 2.5 bar, 348
and the results are depicted in Fig. 7. The BSD becomes much wider and positively skewed. In this 349
case, there was an almost 5 fold increase in the D32 from ~ 130 to ~ 600 μm. 350
351
These results serve to demonstrate that even such statically highly stable foams, do incur significant 352
structural transformations as a result of dynamic interactions with processing equipment. Hence, the 353
transport and processing of these structured fluids should avoid high pressure drops and should be 354
conducted as far as possible under conditions of pressure close to atmospheric. 355
356
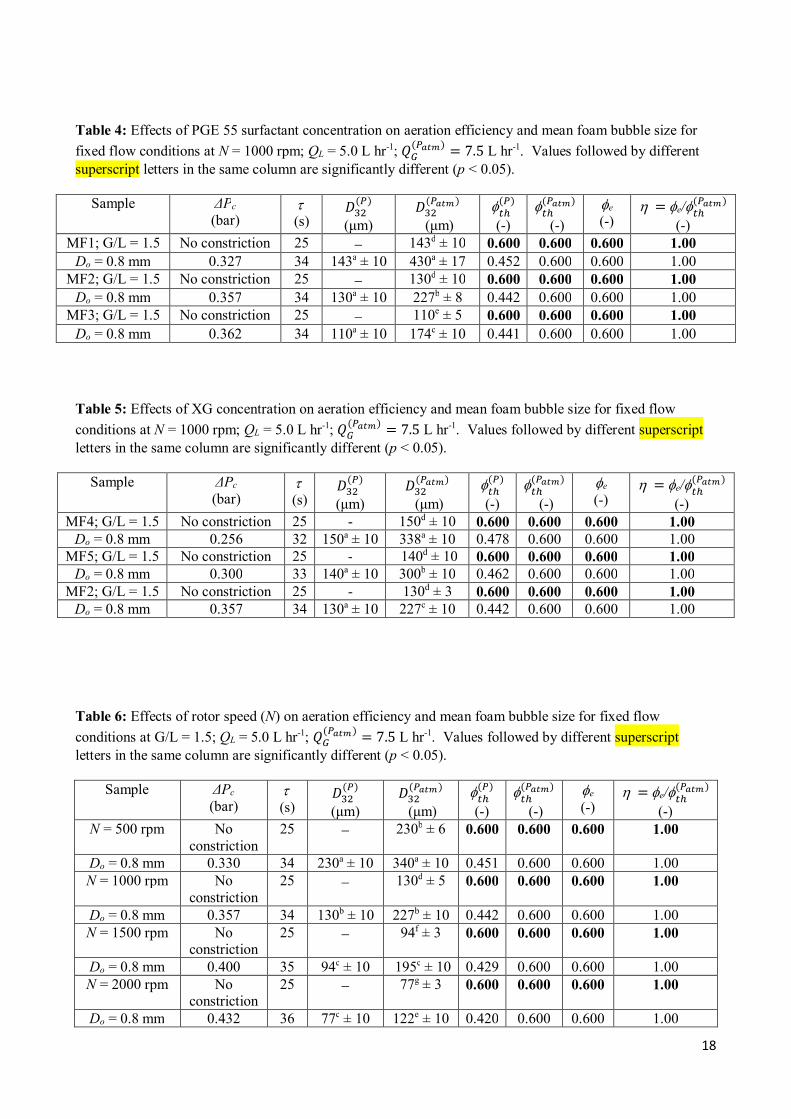
3.4.2 Effects of PGE 55 surfactant concentration 357
Flow experiments were conducted through a short straight pipe first without and then with a constriction 358
(0.8 mm orifice plate) at G/L = 1.5, using foams generated from fluids MF1, MF2 and MF3 containing 359
respectively, 0.2, 0.5 and 1.0 wt% PGE 55 surfactant, but the same XG concentration (0.5 wt%). It 360
should be pointed out that the cac (critical aggregation concentration) of PGE 55 is very low (0.00001 361
11
wt%), such that the concentrations used here are orders of magnitude higher (Gupta et al., 2016). In 362
this case, maximum aeration efficiency was achieved under all conditions, as shown in Table 4. Whilst 363
the pressure drop across the constriction is, within experimental error, the same for the three fluids, the 364
relative increase in mean bubble size is greatest for fluid MF1 with the lowest PGE 55 content and 365
reduces as the PGE 55 concentration increases for MF2 and MF3, as shown in Fig. 8. 366
367
Foams generated in the absence of a flow constriction have a relatively narrow BSD and have a peak at 368
around 100 µm. Flow through the constriction, however, leads in all cases to a much broader positively 369
skewed BSD. The effects are considerably more severe for fluid MF1 than MF2 and MF3. A possible 370
reason for this may be due to the excess PGE 55 multilamellar vesicles available at higher 371
concentrations to stabilise gas-liquid interfaces, clog plateau borders and thin films and, thus, slow 372
down liquid drainage and inhibit film rupture and bubble coalescence (Jabarkhyl et al., 2020a). 373
374
Duerr-Auster et al. (2008) who studied the effects of pH on the foamability of PGE 55 solutions inside 375
a kitchen mixer, found that the adsorption kinetics of PGE 55 improved leading to much enhanced 376
foamability when the pH was reduced from 7 to 3. They attributed this improvement to the partial 377
destruction of PGE 55 multilamellar vesicles, thereby exposing a higher fraction of the hydrophobic 378
bilayer core to the air-water interface. They also found that acidity increased the rate of bubble 379
coalescence under static conditions by dramatically reducing coalescence time (Duerr-Auster et al., 380
2008). 381
382
In this study, foams generated from fluid MF2 at pH 3 and pH 7 and G/L ratios of 1.0, 1.5 and 2.0 were 383
allowed to flow through a short straight pipe with and without a 0.8 mm orifice plate fitted, but no 384
significant effects were observed on either pressure drop or bubble size (data not shown). In this case, 385
the improved adsorption kinetics of the PGE 55 surfactant was not sufficient to influence bubble 386
coalescence during flow. Flow through the pipe with or without the constriction is relatively very fast 387
and there is probably insufficient time for the diffusion of multilamellar vesicles of PGE 55 to have an 388
effect. 389
390
3.4.3 Effects of xanthan gum concentration 391
The above flow experiments were repeated at G/L = 1.5 to study the effects of varying the concentration 392
of xanthan gum using foams generated from fluids MF4, MF5 and MF2 containing respectively, 0.25, 393
0.35 and 0.50 wt% XG, but the same PGE 55 concentration (0.5 wt%). In this case, maximum aeration 394
efficiency was achieved under all conditions, as shown in Table 5. Foams generated in the absence of 395
a flow constriction have a relatively narrow BSD and have a peak at around 100 µm. Flow through the 396
constriction, however, leads in all cases to a right shift in the BSDs which become much broader and 397
positively skewed. The effects are most severe for fluid MF4. The pressure drop across the constriction 398
12
increases as a function of XG concentration, but the relative increase in mean bubble size is greatest for 399
fluid MF4 with the lowest XG content and reduces as the XG concentration increases for MF5 and 400
MF2, as shown in Fig. 9. The coarser foam texture at lower XG concentrations is probably due to the 401
lower liquid viscosity causing weaker foam stability because of faster drainage, shorter thin liquid 402
lifetime and higher rate of bubble coalescence. 403
404
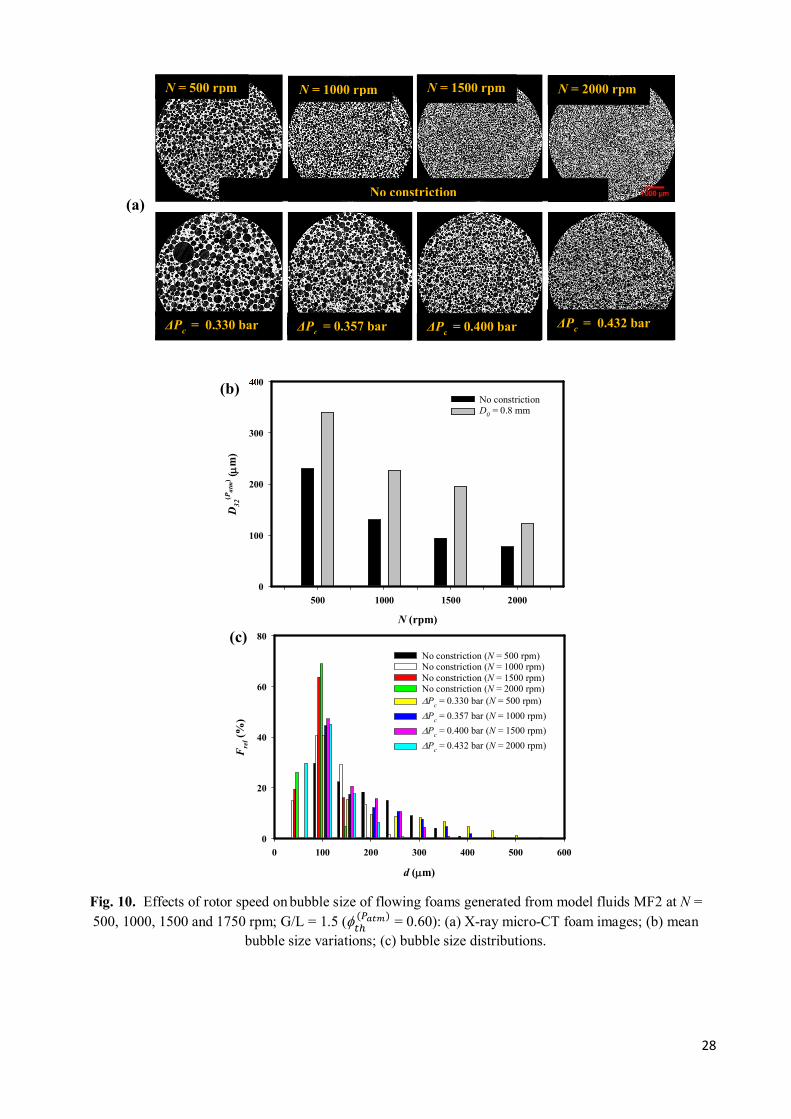
3.4.4 Effects of rotor speed 405
Similarly, flow experiments were again performed at G/L = 1.5 but varying the rotor speed, viz N = 406
500, 1000, 1500 and 2000 rpm, using foams generated from fluid MF2. Maximum aeration efficiency 407
was achieved at all conditions investigated as shown in Table 6. Increasing N over this range led to a 408
modest increase in pressure drop across the constriction which can be explained by the finer foams 409
generated (i.e. more complex thin liquid film network) which dissipate more energy in flow (Jabarkhyl 410
et al., 2020b). Flow through the constriction causes, in all cases, a considerable rise in the mean bubble 411
size, as shown in Fig. 10. The relative increase in D32, however, is lowest for N = 2000 rpm probably 412
because of the much finer foam texture; in general, the finer the bubble size, the less the damage incurred 413
through a constriction. 414
415
3.5 Foam elasticity and static stability 416
3.5.1 Foam elasticity 417
Oscillatory tests were performed in the linear viscoelastic region to probe the unperturbed foam 418
structure. The storage modulus �#$� is a function of air volume fraction and bubble size distribution. 419
For very wet foams (< ~ 0.50) bubble size distribution has negligible effects on �#$� (Jabarkhyl et 420
al., 2020b). Typical #$ measurements for foams generated from fluid MF2 at G/L = 1.5 and N = 1000 421
rpm are shown in Fig. 11. #$ is the highest for foam generated under ambient condition since this foam 422
has a very fine texture. In contrast, #$ decreases as the pressure drop incurred across the orifice 423
constriction increases, owing to the coarser texture of the emerging foam and the loss of air at the 424
highest pressure drop shown (Table 3). 425
426
3.5.2 Foam drainage 427
The raw foams generated in the rotor-stator device are statically extremely stable at room temperature 428
on a timescale of months (Jabarkhyl et al., 2020a). To assess the effects of the interaction with the 429
constriction on the foam static stability, 50 ml foam samples were collected at the outlet of the flow 430
pipe with and without a constriction. The sealed samples were then stored at a controlled temperature 431
of 50 ̊C to enhance drainage and, consequently, shorten the foam lifetime and reduce experimental 432
monitoring time. Typical foam drainage transients and foam half-life estimates for foams generated 433
from fluid MF2 at G/L = 1.5 and N = 1000 rpm are shown in Fig. 12. Foams flowing in a short straight 434
13
pipe without incurring a significant pressure drop have a finer texture which provides more resistance 435
to liquid flow and, hence, they exhibit the slowest drainage time and the longest half-life. In contrast, 436
the half-life is significantly reduced for foams having passed through the orifice constriction which have 437
a coarser texture and may also contain less air as a result (Table 3). Results show that the higher the 438
pressure drop incurred, the less the foam stability. 439
440
4 Conclusions 441
Foams generated from viscous shear-thinning fluids in a continuous multi rotor-stator device exhibit 442
long term static stability on the order of months due to their fine texture consisting of a uniform bubble 443
size distribution and the high viscosity of their base liquid. Flow through a short straight pipe incurs a 444
low pressure drop and produces no tangible effects on foam structure, thus, preserving the original 445
bubble size and static stability of the foam. At low pressure drops, foams are able to squeeze through 446
a narrow orifice constriction without incurring significant structural transformations. At higher pressure 447
drops, flow through the constriction causes significant bubble coalescence and, in some cases, loss of 448
air volume leading to much coarser and much less stable foam. Increased surfactant content, liquid 449
viscosity and rotor speed reduce bubble coalescence and help preserve foam structure during dynamic 450
interaction with a flow constriction. 451
452
Acknowledgements 453
Funding from EPSRC (Grant EP/N002075/1) and Unilever Colworth (UK) is gratefully acknowledged. 454
Saifullah Jabarkhyl’s PhD was funded by an EPSRC-Unilever studentship. 455
456
457
Notation 458
d bubble diameter (m) 459
D0 orifice plate diameter (m) 460
D32 Sauter mean diameter (m) 461
���������
Sauter mean diameter at atmospheric pressure (m) 462
������
Sauter mean diameter at pressure P (m) 463
Frel relative frequency (%) 464
#$ storage modulus (Pa) 465
G/L ratio of volumetric flowrate of air to liquid (-) 466
MF1 model fluid 1 467
MF2 model fluid 2 468
MF3 model fluid 3 469
MF4 model fluid 4 470
14
MF5 model fluid 5 471
N rotational speed (s-1) 472
p level of statistical significance 473
ΔPc Pressure loss across constriction (Pa) 474
PGE 55 polyglycerol ester of fatty acid (-) 475
XG xanthan gum (-) 476
477
Greek symbols 478
air volume fraction (-) 479
e experimental air volume fraction (-) 480
���
theoretical air volume fraction at pressure P (-) 481
������ theoretical air volume fraction at atmospheric pressure (-) 482
/0 shear rate (s-1) 483
shear stress (Pa) 484
fluid density (kg m-3) 485
486
References 487
BADVE, M. & BARIGOU, M. 2020. Local description of foam flow, deformation and pressure drop in 488
narrow constricted channels. International Journal of Multiphase Flow, 128, 103279. 489
BALERIN, C., AYMARD, P., DUCEPT, F., VASLIN, S. & CUVELIER, G. 2007. Effect of formulation and 490
processing factors on the properties of liquid food foams. Journal of Food Engineering, 78, 491
802-809. 492
BARIGOU, M. & DOUAIRE, M. 2013. 9 - X-ray micro-computed tomography for resolving food 493 microstructures. In: MORRIS, V. J. & GROVES, K. (eds.) Food Microstructures. Woodhead 494
Publishing. 495
CALVERT, J. R. 1988. The flow of foam through constrictions. International Journal of Heat and Fluid 496
Flow, 9, 69-73. 497
CALVERT, J. R. & NEZHATI, K. 1987. Bubble size effects in foams. International Journal of Heat and 498
Fluid Flow, 8, 102-106. 499
COX, A. R., ALDRED, D. L. & RUSSELL, A. B. 2009. Exceptional stability of food foams using class II 500
CURSCHELLAS, C., KOHLBRECHER, J., GEUE, T., FISCHER, P., SCHMITT, B., ROUVET, M., WINDHAB, E. J. 502
& LIMBACH, H. J. 2013. Foams Stabilized by Multilamellar Polyglycerol Ester Self-Assemblies. 503
Langmuir, 29, 38-49. 504
CURSCHELLAS, C., NAGY, K., WINDHAB, E. & LIMBACH, H. J. 2013b. Characteristics of polyglycerol 505
ester and its different fractions. Journal of Colloid and Interface Science, 393, 182-191. 506
DESHPANDE, N. S. & BARIGOU, M. 2000. The flow of gas–liquid foams in vertical pipes. Chemical 507
Engineering Science, 55, 4297-4309. 508
DESHPANDE, N. S. & BARIGOU, M. 2001a. Foam flow phenomena in sudden expansions and 509
contractions. International Journal of Multiphase Flow, 27, 1463-1477. 510
DESHPANDE, N. S. & BARIGOU, M. 2001b. The flow of gas–liquid foams through pipe fittings. 511
International Journal of Heat and Fluid Flow, 22, 94-101. 512
DICKINSON, E. 2010. Food emulsions and foams: Stabilization by particles. Current Opinion in Colloid 513 & Interface Science, 15, 40-49. 514
15
DICKINSON, E., ETTELAIE, R., MURRAY, B. S. & DU, Z. 2002. Kinetics of disproportionation of air 515
bubbles beneath a planar air-water interface stabilized by food proteins. J Colloid Interface 516
Sci, 252, 202-13. 517
DUERR-AUSTER, N., EISELE, T., WEPF, R., GUNDE, R. & WINDHAB, E. J. 2008. Influence of pH on 518
colloidal properties and surface activity of polyglycerol fatty acid ester vesicles. Journal of 519
Colloid and Interface Science, 327, 446-450. 520
DUERR-AUSTER, N., KOHLBRECHER, J., ZUERCHER, T., GUNDE, R., FISCHER, P. & WINDHAB, E. 2007. 521
Microstructure and Stability of a Lamellar Liquid Crystalline and Gel Phase Formed by a 522
Polyglycerol Ester Mixture in Dilute Aqueous Solution. Langmuir, 23, 12827-12834. 523 ELLIS, A. L., NORTON, A. B., MILLS, T. B. & NORTON, I. T. 2017. Stabilisation of foams by agar gel 524
particles. Food Hydrocolloids, 73, 222-228. 525
GUPTA, M., HOOGHTEN, R. V., FISCHER, P., GUNES, D. Z. & VERMANT, J. 2016. Limiting coalescence 526
LIM, K. S. & BARIGOU, M. 2004. X-ray micro-computed tomography of cellular food products. Food 538
Research International, 37, 1001-1012. 539
MARY, G., MEZDOUR, S., DELAPLACE, G., LAUHON, R., CUVELIER, G. & DUCEPT, F. 2013. Modelling of 540
the continuous foaming operation by dimensional analysis. Chemical Engineering Research 541
and Design, 91, 2579-2586. 542
MÜLLER-FISCHER, N., SUPPIGER, D. & WINDHAB, E. J. 2007b. Impact of static pressure and 543 volumetric energy input on the microstructure of food foam whipped in a rotor–stator 544
device. Journal of Food Engineering, 80, 306-316. 545
MÜLLER-FISCHER, N. & WINDHAB, E. J. 2005. Influence of process parameters on microstructure of 546
food foam whipped in a rotor–stator device within a wide static pressure range. Colloids and 547
Surfaces A: Physicochemical and Engineering Aspects, 263, 353-362. 548
MURRAY, B. S., DICKINSON, E., GRANSARD, C. & SÖDERBERG, I. 2006. Effect of thickeners on the 549
coalescence of protein-stabilized air bubbles undergoing a pressure drop. Food 550
Hydrocolloids, 20, 114-123. 551
ZAYAS, J. F. 1997. Foaming Properties of Proteins. In: ZAYAS, J. F. (ed.) Functionality of Proteins in 552
Food. Berlin, Heidelberg: Springer Berlin Heidelberg. 553
554
555
16
Table 1. Model fluids composition and properties.
Model fluid PGE 55
(wt%)
XG
(wt%)
Sugar
(wt%)
(kg m-3)
σe
(mN m-1)
MF1 0.2 0.50 25 1080 39
MF2 0.5 0.50 25 1080 38
MF3 1.0 0.50 25 1080 37
MF4 0.5 0.25 25 1080 38
MF5 0.5 0.35 25 1080 38
Table 2. Geometrical dimensions of continuous rotor-stator device.
Parameter Symbol (unit) Value
Diameter of annulus mixing space L (mm) 5.00
Number of pins on rotor I (-) 13.00
Number of rotor-stator pairs h (-) 12.00
Distance between rotor-stator s (mm) 1.00
Height of rotor/stator pin q (mm) 2.50
Width of rotor pin o (mm) 4.70
Rotor diameter D (mm) 50.00
Distance between rotor pins z (mm) 12.08
17
Table 3: Typical results of aeration efficiency and mean foam bubble size for different flow conditions obtained with fluid MF2 at N = 1000 rpm; QL = 5.0 L
hr-1; �������� = 5.0, 7.5 and 10.0 L hr-1. Values followed by different superscript letters in the same column are significantly different (p < 0.05).
Sample ΔPc (bar)
(s)
������
(μm)
���������
(μm)
�����
(-)
��������
(-)
e
(-) = e/��
������
(-)
G/L = 1.0 No constriction
31 147h ± 3 0.500 0.500 0.500 1.00
Do = 1.8 mm 0.047 32 147a ± 3 157g ± 5 0.477 0.500 0.500 1.00
Do = 0.8 mm 0.300 38 147a ± 5 200f ± 5 0.385 0.500 0.500 1.00
Do = 0.6 mm 0.880 45 147a ± 7 230e ± 10 0.266 0.500 0.500 1.00
Do = 0.5 mm 1.450 49 147a ± 13 323c ± 20 0.204 0.500 0.460 0.92
G/L = 1.5 No
constriction
25 130i ± 3 0.600 0.600 0.600 1.00
Do = 1.8 mm 0.058 27 130b ± 5 138h ± 5 0.567 0.600 0.600 1.00
Do = 0.8 mm 0.357 34 130b ± 5 227e ± 10 0.442 0.600 0.600 1.00
Do = 0.6 mm 0.956 43 130b ± 11 300c ± 20 0.307 0.600 0.600 1.00
Do = 0.5 mm 1.680 48 130b ± 13 447b ± 50 0.224 0.600 0.560 0.93
Do = 0.4 mm 2.500 56 130b ± 10 580a ± 50 0.171 0.600 0.540 0.90
G/L = 2.0 No constriction
20 113j ± 3 0.670 0.670 0.670 1.00
Do = 1.8 mm 0.069 23 113c ± 5 127i ± 5 0.627 0.670 0.670 1.00
Do = 0.8 mm 0.417 32 113c ± 5 251d ± 5 0.473 0.670 0.670 1.00
Do = 0.6 mm 1.120 42 113c ± 13 320c ± 20 0.316 0.670 0.640 0.96
Do = 0.5 mm 1.790 47 113c ± 10 590a ± 50 0.236 0.670 0.610 0.91
18
Table 4: Effects of PGE 55 surfactant concentration on aeration efficiency and mean foam bubble size for
fixed flow conditions at N = 1000 rpm; QL = 5.0 L hr-1; �������� = 7.5 L hr-1. Values followed by different
superscript letters in the same column are significantly different (p < 0.05).
Do = 0.8 mm 0.357 34 130a ± 10 227c ± 10 0.442 0.600 0.600 1.00
Table 6: Effects of rotor speed (N) on aeration efficiency and mean foam bubble size for fixed flow
conditions at G/L = 1.5; QL = 5.0 L hr-1; �������� = 7.5 L hr-1. Values followed by different superscript
letters in the same column are significantly different (p < 0.05).
Sample ΔPc
(bar) (s)
������
(μm)
���������
(μm)
�����
(-)
��������
(-)
e
(-) = e/��
������
(-)
N = 500 rpm No
constriction
25 230b ± 6 0.600 0.600 0.600 1.00
Do = 0.8 mm 0.330 34 230a ± 10 340a ± 10 0.451 0.600 0.600 1.00
N = 1000 rpm No
constriction
25 130d ± 5 0.600 0.600 0.600 1.00
Do = 0.8 mm 0.357 34 130b ± 10 227b ± 10 0.442 0.600 0.600 1.00
N = 1500 rpm No constriction
25 94f ± 3 0.600 0.600 0.600 1.00
Do = 0.8 mm 0.400 35 94c ± 10 195c ± 10 0.429 0.600 0.600 1.00
N = 2000 rpm No constriction
25 77g ± 3 0.600 0.600 0.600 1.00
Do = 0.8 mm 0.432 36 77c ± 10 122e ± 10 0.420 0.600 0.600 1.00
19
Fig. 1. Foam generator: (a) pilot-scale continuous rotor-stator unit; (b) schematic of mixing-head chamber; (c) stator; (d) rotor. The device consists of 12 rotor-stator pairs in series where, respectively, the rotor and
stator have diameters of 50 and 52 mm each. Every rotor and stator has 13 pins (4.7 × 4.6 × 2.5 mm) with
square ends and the gap between the rotor and stator is 1.0 mm.
(c)
(d)
(a)
(b)
20
Fig. 2. Schematic of foam flow rig.
21
Fig. 3. Effects of residence time on bubble size of foams generated from fluid MF2: (a) G/L = 1.0 (e =
0.52); (b) G/L = 1.5 (e = 0.62); and (c) G/L = 2.0 (e = 0.72).
22
Fig. 4. Effects of air volume fraction on bubble size of foams generated from fluid MF2:
N = 1000 rpm; = 40 s.
23
Fig. 5. Effects of pressure drop across constriction on foam microstructure generated from fluid MF2 at N =
1000 rpm, G/L = 1.0 ( ��������
= 0.50), G/L = 1.5 ( ��������
= 0.60), G/L = 2.0 ( ��������
= 0.67): (a) Typical X-
ray micro-CT foam images; and (b) bubble size distributions.
d (mm)
0 100 200 300 400 500 600 700 800
Frel (
%)
0
10
20
30
40
50
60
No constriction
DPc = 0.058 bar
DPc = 0.357 bar
DPc = 0.956 bar
DPc = 1.680 bar
G/L = 1.0 G/L = 1.5
No constriction No constriction
ΔPc
= 1.880 bar ΔPc
= 2.120 bar ΔPc
= 1.956 bar
G/L = 2.0
No constriction
(a)
(b)
24
Fig. 6. Effects of pressure drop across constriction on mean bubble size of foams generated
from fluid MF2 at N = 1000 rpm.
DPc (bar)
0.0 0.2 0.4 0.6 0.8 1.0 1.2 1.4 1.6 1.8 2.0
D3
2
(Pa
tm) (m
m)
0
200
400
600
800
G/L = 1.0 (P
atm)
th= 0.50)
G/L = 1.5 (P
atm)
th
= 0.60)
G/L = 2.0 (P
atm)
th = 0.67)
25
Fig. 7. Effects of pressure drop across constriction on bubble size of foams generated from MF2 at N = 1000