UNIVERSITY OF BOLOGNA ____________________ Ph. D. Program in “ Biodiversity and Evolution” (XIX cycle) BIO/08 - Anthropology MOLECULAR VARIABILITY OF LACTASE PERSISTENCE IN EURASIAN POPULATIONS Cristina Fabbri Coordinator: Supervisor: Prof. Giovanni Cristofolini Prof. Davide Pettener Academic Dissertation, 2007 I
Transcript
UNIVERSITY OF BOLOGNA ____________________
Ph. D. Program in
“ Biodiversity and Evolution” (XIX cycle)
BIO/08 - Anthropology
MOLECULAR VARIABILITY OF LACTASE
PERSISTENCE IN EURASIAN POPULATIONS
Cristina Fabbri
Coordinator: Supervisor:
Prof. Giovanni Cristofolini Prof. Davide Pettener
Academic Dissertation, 2007
I
TABLE OF CONTENTS
1. Introduction
1.1 Lactase persistence 1
1.2 Lactase persistence distribution and adaptative hypotheses 2
1.3 Molecular basis of lactase persistence 5
1.4 Genetic evidence of selection 7
1.5 Lactase regulation 9
1.6 Multiple origins of lactase persistence 10
1.7 Lactase persistence in Italian populations 12
2. Aim of the study 13
3. Materials and methods
3.1 Population samples 15
3.2 Lab methods 19
3.2.1 DNA extraction 19
3.2.2 SNPs genotyping 20
3.2.3 STRs genotyping 23
3.3 Statistic analyses 25
3.3.1 Allele and genotype frequencies 25
3.3.2 RxC exact test 25
3.3.3 Haplotype inferences 25
3.3.4 Intra-population genetic variability 26
3.3.5 Phylogenetic analysis 26
3.3.6 Inter-population genetic variability 27
3.3.7 Genetic distances 27
3.3.8 Age estimation of T-13910 allele 27
3.3.9 Neutrality tests 29
II
4. Results
4.1 Allele and genotype frequencies at C/T–13910 and G/A-22118 loci
in Italian populations 30
4.2 Relationship between T-13910 and A-22018 alleles 32
4.3 Allele and genotype frequencies at C/T–13910 and G/A-22118 loci
in Asian populations 33
4.4 Frequency of the SNP and STR haplotypes 34
4.5 Microsatellite variation within the SNPs haplotypes 35
4.6 Phylogenetic analysis of TA lineages 38
4.7 Analyses of inter-population variability within TA lineages 43
4.8 Estimation of the age of the T-13910 allele 45
4.9 Neutrality test 46
5. Discussion and Conclusions 47
6. References 55
7. Supplementary materials 63
Acknowledgments
III
INTRODUCTION
1.1 Lactase persistence
The ability to digest milk lactose depends on the activity of lactase-phlorizin
hydrolase (LPH) (EC 3.2.1.23/62) enzyme that is exclusively expressed in the small
intestine (Mantei et al. 1988). Lactose is the major carbohydrate in mammalian milk and
it has to be hydrolyzed in the monosaccharide glucose and galactose to be easily
assimilated into the bloodstream and used as a source of energy (Figure 1.1). Human
milk has the highest lactose content (7%), cow milk contains 4.8% of lactose.
Figure 1.1 Lactose molecule composed of a galactose unit and a glucose unit
In most mammals, lactase activity is maximum after birth and remains high
during infancy; it declines rapidly after the weaning phase and this down regulation
determines a reduced capacity to digest lactose and has been interpreted as a shifts
towards adult diet (Flatz 1987).
The ability to digest lactose is a variable genetic trait in human populations, in
fact two distinct phenotypes are present: non-persistence and persistence. The ancestral
lactase non-persistence phenotype is characterized by lactase activity decline and it is
common to most human populations. The derived lactase persistence phenotype
presents high levels of activity also during adulthood (Flatz 1987).
Lactase-persistence subjects are able to consume large amount of fresh milk
without complications; on the contrary people with low levels of lactase activity may
develop adverse symptoms, such as abdominal pain, flatulence and diarrhoea. This
occurs because lactose is not efficiently hydrolysed in the small intestine and reaches
the large intestine where it is fermented by enteric bacteria. However, many non-
1
persistence individuals can drink milk without experiencing symptoms associated with
milk intolerance; they can adjust the dietary intake of milk to their individual tolerance
threshold or they can eat milk products, like cheese and yoghurt, containing low level of
lactose, or even bacteria that secrete lactase themselves. Vice versa there are some co-
factors that may influence the severity of symptoms: velocity of gastric emptying,
individual differences in prostaglandin synthesis, colonic bacteria and colonic
irritability (Flatz 1987).
1.2 Lactase persistence distribution and adaptative hypotheses
Lactase persistence frequency varies considerably among human populations.
The phenotype distribution has been determined directly by small-intestinal
biopsies or indirectly by physiological lactose tolerant tests that measure individual
lactose digestion capacity; the “Breath Hydrogen Determination” test (BH2T) measures
the level of hydrogen derived from metabolism of lactose by colonic bacteria in non-
persistence subjects, and the “Blood Glucose Determination” test measures the increase
in blood glucose concentration, both after the oral assumption of a lactose load of 50 g.
(Dahlqvist 1964; Sahi 1974; Metz et al. 1975; Arola 1994).
The persistence trait is highly prevalent among Northern Europeans, with values
>90%, and gradually decreases toward the South and the East. Values are intermediate
(30-70%) in the Middle East, around the Mediterranean and in South and Central Asia
and low in native Americans, Pacific islanders and in Southeast Asia. Of particular
interest are pastoralist groups having a milk-drink culture of sub-Saharian Africa and
Arabia, which typically have higher frequencies of lactase persistence than their
neighbouring non-pastoralist groups (Flatz 1987; Sahi 1994; Swallow 2003) (Figure
1.2).
The unusual geographic distribution of this trait , as well as its association with
the cultural habit of consuming milk (Holden & Mace 1997), has led to the proposal of
several selective hypotheses. Natural selection could has played a major role in shaping
the actual persistence distribution since the development of cattle domestication during
the Neolithic Transition ~7,500-9,000 years ago.
2
Figure 1.2 Worldwide lactase persistence (in blue) and non-persistence (in white) frequency
distribution, based on physiological data (reviewed in Jobling et al. 2003) Different hypotheses are summarised below:
1) The gene-culture coevolutionary hypothesis: lactase persistence distribution is
the result of a recent selection pressure associated with the pastoralism advantages of
the assumption of fresh milk in adulthood. Individuals with lactase persistence were
able to use all the nutrients of milk throughout life, therefore, they were stronger, better
equipped to survive and possibly had more children (Simoons 1969; Simoons 1970;
Johnson et al. 1974; Flatz & Rotthauwe 1977).
2) Calcium absorption: this hypothesis has been proposed to explain the high
value of lactase persistence in Northern Europe (Flatz & Rotthauwe 1973). Cause of the
low solar irradiation and the low nutritional supply of vitamin D, a major absorption of
calcium contained in milk could reduce rickets and pelvic deformities in persistence
subjects. Nevertheless, Simoons (2001) showed that lactase non-persistence people can
absorb calcium as lactase persistence one.
3) Source of water in desert zone: milk provides important additional fluid
particularly in arid region; for some desert nomads milk may be the only source of
water, for this reason lactose intolerance symptoms can be disadvantageous (Cook,
1978).
3
In contrast, the “reverse cause argument” suggests dairying was adopted precisely
by those populations that could digest lactose, in this case the genetic change would
have preceded the development of pastoralism (reviewed in Aoki 2001).
The gene-culture coevolution hypothesis was strongly supported when a high
diversity in cattle milk protein genes and lactase persistence distribution was
demonstrated to coincide in Europe (Beja-Pereira et al. 2003). The study found
substantial geographic coincidence between high diversity between cattle milk genes
and high frequency of present-day lactase persistence in the areas where the first
European Neolithic milk dependent groups have been developed (>5,000 years ago)
(Zvelebil 2000) (Figure 1.3).
Figure 1.3 Geographic distribution of lactase persistence mutation in contemporary Europeans;
the hotter the colour the highest the frequency. The dashed black line indicates the limits of the geographic distribution of early Neolithic cattle pastoralist inferred from archaeological data (Beja-Pereira et al. 2003).
On the other hand a recent study identified two genes TRPV6 and TPRV5, on
chromosome 7q, that have been under strong selection pressure in Northern Europe.
The fact these genes play an important role in kidney, intestine and placenta calcium
absorption, together with the same lactase persistence frequency distribution, suggest
that increased calcium absorption may have been the driving force behind selection for
lactase persistence in Northern Europe (Akey et al. 2004)
4
1.3 Molecular basis of lactase persistence
Lactase persistence is inherited as an autosomal dominant trait. Activity levels of
lactase in adults show a trimodal distribution pattern that suggests three genotypes:
homozygotes for the persistence allele having lactase persistence, recessive
homozygotes having lactase non-persistence and heterozygotes having lactase
persistence but with intermediate level of enzyme activity.
Lactase enzyme is codified by LCT gene (NM_002299), mapped to the long arm
of chromosome 2q21, composed of 17 exons and approximately 50 kb long (Kruse et al.
1988; Harvey et al. 1993) (Figure 1.4). There is one kb promoter region preceding LCT
(Boll et al. 1991). The gene encodes an mRNA transcript of 6,274bp and the primary
translation product is 1,927 amino acids long (Mantei et al. 1988).
Many single nucleotide polymorphisms (SNPs) have been discovered within LCT
gene and in the surrounding region but none of them was shown to be the causative
variant of lactase persistence; however four globally common haplotypes A, B, C and U
have been identified (Boll et al. 1991; Lloyd et al.1992; Harvey et al. 1995; Hollox et al.
2001; Poulter et al. 2003). Haplotype A is the most common in Northern Europe (86%)
and decreases toward South (36%) following lactase persistence distribution. This
association is not only geographic, it has been confirmed by physiological tests and
estimations of mRNA transcript in the small intestine of lactase persistence individuals
that resulted belonging to haplotype A (Harvey et al. 1998; Swallow 2003).
Only few years ago, in a study of linkage disequilibrium (LD) in Finnish families,
two polymorphisms were discovered upstream the lactase gene: C/T-13910 (rs4988235)
and G/A-22018 (rs182549). Both substitutions are located within introns of the adjacent
MCM6 gene, involved in the cell cycle, respectively 14kb and 22kb upstream from the
initiation codon of LCT gene. The derived alleles T-13910 and A-22018 were found,
respectively, totally and highly associated to lactase persistence phenotype (Enattah et
al. 2002) (Figure 1.4). This different association depends on the genealogical relation
between the two polymorphisms, that were originated according to C-G, C-A, T-A
phylogenetic sequence (Poulter et al. 2003; Swallow 2003) (Figure 1.5).
Further studies demonstrated both T-13910 and A-22018 reside within a very
large region of Linkage Disequilibrium (see next section for more details on LD)
spanning 1Mb and particularly they occur only on the background of a very extended
haplotype A (Poulter et al. 2003; Swallow 2003).
5
The presence of T-13910 allele on extended region of LD, makes it possible that it
could be the causative mutation or it could be linked to an undetected variant located in
the same region (Poulter et al. 2003; Bersaglieri et al. 2004).
Figure 1.4 (a) Overview of chromosome 2, the position of the genes of interest is indicated in red. (b) Enlargement of one Mb region (chr2:135903814..136903813) containing LCT, MCM6 and other neighbour genes; for each gene the complete name, the NM reference number, and the direction of transcription (yellow arrows) are reported. This picture is from the Hapmap site, www.hapmap.org, release 21a/phasell Jan2007. (c) LCT and MCM6 gene structures; the number indicate the exons and the above violet line the final protein. These pictures are from http://genewindow.nci.nih.gov . The positions of the two mutations, C/T-13910 and G/A-22018 associated to lactase persistence, are indicated by black arrows; they lie respectively within the 13rd and 9th introns of MCM6 gene.
Centre-North 5 Bologna 95 low6 Palazzuolo sul Senio (FI) 33 medium7 Alfero (FC) 41 high8 Alta Val Savio (FC) 37 medium
tot 206
Centre-South 9 Tocco da Casauria (PE) 38 medium10 Roma 30 low11 Norma (LT) 30 medium12 Benevento 30 low
tot 128
South and islands 13 Messapi 23 medium14 Albidona (CS) 52 high15 Roseto Capo Spulico (CS) 27 medium16 Belvedere Marittimo (CS) 28 medium17 Siracusa 29 low18 Gallura 37 medium
tot 196
total Italy 749 Table 3.1 List of the Italian populations sampled, grouped for geographical area; for each
population the sample size (N) and the isolation degree are indicated.
DNA was obtained from buccal swabs using a brush or from 3 cc. of blood,
thanks to local AVIS (Volunteer Italian Blood donors Association) groups’
collaboration for Val di Scalve (BG), Udine, Castelmassa (RO), Bologna, Palazzuolo
sul Senio (FI), Alfero (FC), Alta Val Savio (FC), Albidona (CS), Roseto Capo Spulico
(CS), Siracusa and Gallura (Sardinia) samples. The origin of each sample was verified
by bio-demographic information on the last three generations.
Ladini of Trentino, Norma (LT), Benevento, Messapi of Puglia, Belvedere
Marittimo (CS), Tocco da Casauria (PE) and Roma samples have been collected by prof
G. Destro-Bisol’s group (“La Sapienza” University, Rome); Tocco da Casauria and
Roma data have been already published in Coelho et al. (2005).
16
The Middle East sample consist of 49 Kurdish subjects coming from Iraq, Iran,
Syria and Turkey that actually live in Italy, and of 22 subjects of Persian ethnicity;
Persian samples were collected in the South-West region of Iran called Fars (Figure 3.2
and Table 3.2).
Sample collection was realized in 2003-2004 and bio-demographic information
was obtained for each subject. DNA was obtained from buccal swabs using a brush.
Figure 3.2 Geographic position of Middle Eastern samples. The extension of the Kurdish region
across Iraq, Iran, Syria and Turkey is represented in green. The red point indicates the South-West region of Iran where Persian samples were collected.
The Central Asia sample is composed of two Kirghiz groups from Sary-Tash
(65) and Talas (79), 48 Uighurs and 105 Kazakhs, for a total of 297 samples (Figure 3.3
and Table 3.2). Sary-Tash is an isolated high-altitude village (3,200 m above sea level)
in the Pamir mountains in the South of the country, while the Talas valley (900 m above
sea level) is in the Northern part of Kirghizstan, close to Kazakhstan and Uzbekistan.
The Uighurs were sampled in the village of Penjim (600 m above sea level) in the East
of Kazakhstan, close to Chinese border. Kazakh samples were collected in villages of
the Kegen valley, a high plain 2,100 m above sea level. Their subsistence economy is
based mainly on goat, sheep, horse and yak breeding and agriculture.
Blood-samples were collected within the CAHAP (Central Asia High Altitude
People) project during two expeditions (1993, 1994) in Kirghizstan and Kazakhstan.
17
Figure 3.3 Geographic position of Central Asia samples: the Kirghiz groups from Sary-Tash (in
light blue) and Talas (in green), the Uighurs (in yellow) and the Kazakhs (in red).
Area Population N
Middle East Kurds (Kur) 49Persians (Per) 22tot 71
Central Asia:Kirghizstan Kirghizes of SaryTash (KSa) 65Kirghizstan Kirghizes of Talas (KTa) 79Kazakhstan Uighurs (Uig) 48Kazakhstan Kazakhs (Kaz) 105
tot 297 Table 3.2 List of the Middle Eastern and Central Asia samples with relative sample sizes (N); the
short names used in the test are gives in parentheses.
18
3.2 Lab methods
3.2.1 DNA extraction
DNA was extracted from blood following “Salting Out” (A) protocol, while for
extraction from buccal swabs we follow “kit Qiamp” (Qiagen) protocol (B) or a
modified “Salting Out” protocol (C).
A. “Salting Out” protocol for DNA extraction from blood:
• Move unfrozen blood to sterile 15 ml tubes, add 12 ml RCLB (Red Cell Lising
Buffer), vortex, centrifuge 10 min at 3,000 rpm, discard supernatant playing attention to
conserve the pellet; repeat 3-4 times till the pellet not release colour.
• Add 3 ml WCLB (White Cell Lising Buffer), vortex, add 25 μl Proteinase K
(20 mg/ml) and 25 μl SDS 20%; vortex and incubate 1 hour at 55°C.
• Add 1.7 ml Sodium Acetate 3M pH 5.2, agitate manually and centrifuge 10
min at 3000 rpm; move supernatant to new 15 ml tubes.
• Add the same volume of Isopropyl alcohol, agitate softly; you could see the
DNA “jelly-fish”, the finally amount of sterile water depends on jelly-fish dimension.
Centrifuge 10 min at 3,000 rpm.
• Discard supernatant and add 3 ml ethanol 80%, vortex and centrifuge 10 min
at 3,000 rpm.
• Discard supernatant, turn upside down the tubes and leave dry on absorbent
paper for 2 hours.
• Resuspend DNA in sterile water.
B. protocol for DNA extraction from buccal swabs by “Kit QIAamp DNA
miniKit 50”, QIAGEN
This method is based on specific columns (QIAamp Spin Column) with a silica-
gel membrane able to absorb DNA.
• Place the brush in a 1.5 ml tube, add 1 ml sterile water and agitate the brush
before discarding it. Centrifuge 3-4 min at 13,000 rpm. Remove supernatant without the
pellet.
• Add 200 μl sterile water, 20 μl Proteinase K and 200 μl buffer AL. Vortex
and incubate 10 min at 56° C.
• Add 200 μl ethanol 96-100%, briefly centrifuge and move the solution to the
QIAamp Spin Column (in a 2 ml collection tube).
19
• Add 500 μl buffer AW1, centrifuge 1 min at 8,000 rpm, discard the tube
containing the filtrate and add a new 2 ml collection tube.
• Add 500 μl buffer AW2 centrifuge 3 min at 13,000 rpm and discard the tube
containing the filtrate.
• Place the QIAamp Spin Column in a clean 1.5 ml tube, add 200 μl buffer AE,
incubate at room temperature for 1 min and centrifuge 1 min at 8,000 rpm.
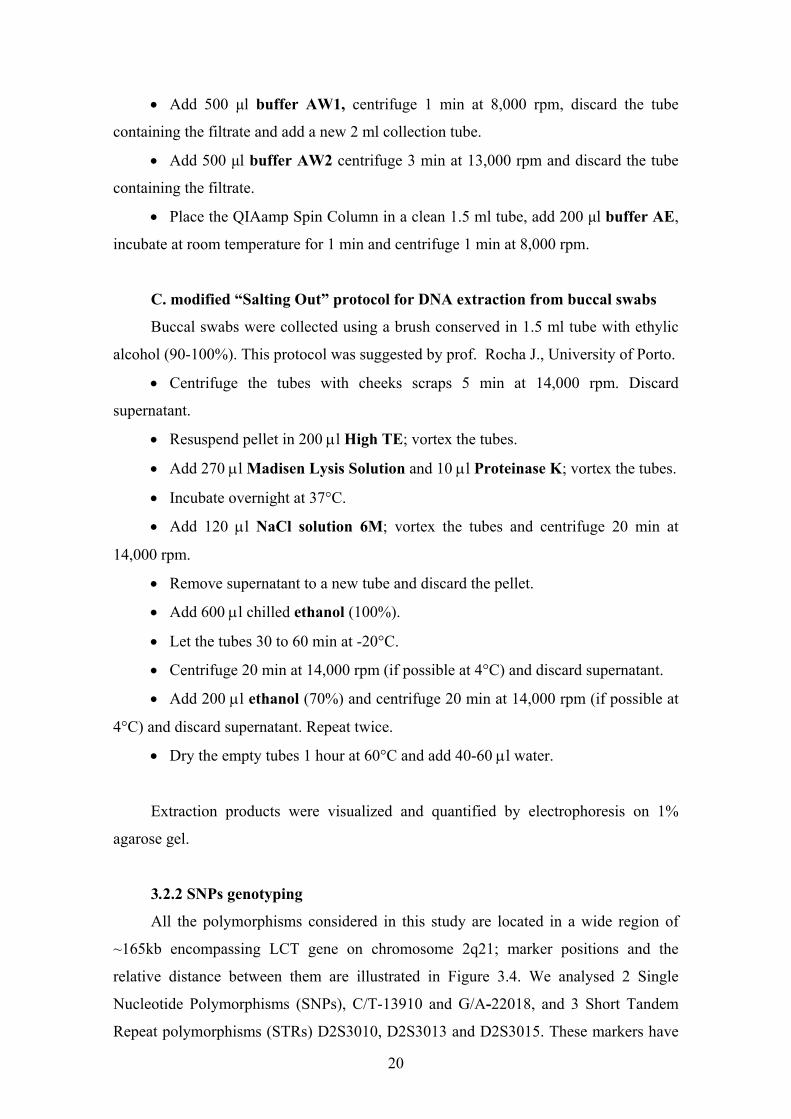
C. modified “Salting Out” protocol for DNA extraction from buccal swabs
Buccal swabs were collected using a brush conserved in 1.5 ml tube with ethylic
alcohol (90-100%). This protocol was suggested by prof. Rocha J., University of Porto.
• Centrifuge the tubes with cheeks scraps 5 min at 14,000 rpm. Discard
supernatant.
• Resuspend pellet in 200 μl High TE; vortex the tubes.
• Add 270 μl Madisen Lysis Solution and 10 μl Proteinase K; vortex the tubes.
• Incubate overnight at 37°C.
• Add 120 μl NaCl solution 6M; vortex the tubes and centrifuge 20 min at
14,000 rpm.
• Remove supernatant to a new tube and discard the pellet.
• Add 600 μl chilled ethanol (100%).
• Let the tubes 30 to 60 min at -20°C.
• Centrifuge 20 min at 14,000 rpm (if possible at 4°C) and discard supernatant.
• Add 200 μl ethanol (70%) and centrifuge 20 min at 14,000 rpm (if possible at
4°C) and discard supernatant. Repeat twice.
• Dry the empty tubes 1 hour at 60°C and add 40-60 μl water.
Extraction products were visualized and quantified by electrophoresis on 1%
agarose gel.
3.2.2 SNPs genotyping
All the polymorphisms considered in this study are located in a wide region of
~165kb encompassing LCT gene on chromosome 2q21; marker positions and the
relative distance between them are illustrated in Figure 3.4. We analysed 2 Single
Nucleotide Polymorphisms (SNPs), C/T-13910 and G/A-22018, and 3 Short Tandem
Repeat polymorphisms (STRs) D2S3010, D2S3013 and D2S3015. These markers have
20
different mutation rates, the multiallelic STRs are fast evolving markers there will be
used to study the level of diversity within the haplotypes defined by the two more stable
SNPs.
Figure 3.4 Schematic representation of the genomic region including LCT and MCM6 genes
with the relative positions of the 2 SNPs (C/T13910 and G/A22018) and the 3 microsatellite (D2S3010, D2S3013 and D2S3015) typed in this study.
The first part of the study is based on the genotyping of the two SNPs C/T-13910
and G/A-22018, associated to lactase persistence in Eurasian populations. Both biallelic
markers were typed in Italian, Middle Eastern and Central Asian samples using
Polymerase Chain Reaction (PCR), followed by digestion with specific restriction
enzymes (Coelho et al. 2005).
Here we reported the amplified sequences including the polymorphic loci (in red),
forward and reverse primers are in bold characters and short sequences recognised by
D2S3013-F 5'-GAG AAT ATA GTC ATA AAC TAT GTT-3'D2S3013-R 5'-ATT TTG GAT TAT ATA TGC TTT CTT G-3'
D2S3015-F 5'-CCT GTA GTC CCA GCT AAT TTC-3'D2S3015-R 5'-CAG AGA AGT TTT GTT TGT GGA-3'
A concentration volume (μl) B concentration volume (μl)H2O 4.276 H2O 4.776dNTPs 0.2 mM 1 dNTPs 0.2 mM 1D2S3013 F 0.5 μM 1.25 D2S3010 F 0.5 μM 1.25D2S3013 R 0.5 μM 1.25 D2S3010 R 0.5 μM 1.25D2S3015 F 0.1μM 0.25 MgCl2 1.5 mM 0.375D2S3015 R 0.1 μM 0.25 BUFFER 1X 1.25MgCl2 1.5 mM 0.375 Taq 2U 0.1BUFFER 1X 1.25 tot 10Taq 2U 0.1tot 10
Table 3.4 Final concentrations and volumes of the PCR mix components, for the
D2S3013/D2S3015 duplex PCR (A) and for D2S3010 simplex PCR (B).
In both PCRs, samples were denaturated for 5 min at 94°C, followed by 35 cycles
of 94°C for 1 min, 56°C for 1 min and 72°C for 1 min, followed by 10 min a final
extension at 72°C.
Figure 3.6 An example of pattern obtained after the separation of an amplification product of the
D2S3013/D2S3015 duplex PCR by ABI PRISM® 310 Genetic Analyser. In blue the alleles at locus D2S3013; in green the alleles at locus D2S3015.
24
3.3 Statistic analyses
3.3.1 Allele and genotype frequencies
Both allele and genotype frequencies were determined by direct counting.
Assuming Hardy-Weinberg equilibrium, in absence of the action of evolutive
forces, such as mutation, gene flow, genetic drift and natural selection, genotypic
frequencies are constant through generations. The null hypothesis of equilibrium is
tested; the p value express the probability that differences between the expected and
observed frequencies were random. When p<0.05 the null hypothesis is rejected,
because differences are too strong to be random. Genotype frequencies for each biallelic
marker were tested for deviation from Hardy-Weinberg equilibrium using a test
analogous to Fisher’s exact test, implemented in the software Arlequin 3.01 (Excoffier
et al. 2005) Bonferroni correction was applied to non-equilibrium loci; it is a statistical
correction for multiple testing: α/K, where α is the level of “type I error” considered to
reject the null hypothesis (0.05 in our case) and K is the number of tests done.
3.3.2 RxC exact test
RxC test was used to compare allele and genotype frequency distribution among
populations. It is a Windows program for the analysis of contingency tables. Rather than
relying on asymptotic methods such as Chi-square or log-likelihood methods, RxC
employs the metropolis algorithm to obtain an unbiased estimate of the exact p-value
associated to the observed differences (Raymond & Rousset 1995).
3.3.3 Haplotype inferences
The gametic phase can be inferred starting from genotype data, using statistical
methods. To this aim we used the software Phase v.2.1 that implements a Bayesian
method for reconstructing haplotypes comparing unresolved haplotypes, with two or
more heterozygous loci, to similar resolved haplotypes, that have no ambiguous loci
(Stephens and Donnelly 2003).
The output file consists of a list of haplotypes and frequency and for each sample
the “best" haplotype reconstruction is reported. Moreover, there is a list of the
confidence probabilities associated with each phase call.
When the number of samples is very small there is little information in the data to
allow the haplotypes to be inferred and this is reflected in a relatively low phase calling
25
probability. Larger data sets will typically be much more informative about a large
proportion of phase calls, for these reason we ran all population data together. We
inferred five-locus haplotypes, considering both the SNPs and STRs markers together.
Haplotype frequencies were obtained by direct counting.
3.3.4 Intra-population genetic variability
We calculated several standard indexes of genetic variability.
Genetic variability within each microsatellite locus was estimated through
Heterozygosity (H) value, the probability that two alleles sampled at random from the
population are different in length. We calculated an average H across all loci too.
Haplotype diversity is defined as the probability that two randomly chosen
haplotypes are different in the sample:
k
H= [n/(n-1)] (1- Σ pi2)
i = 1
where n is the number of gene copies in the sample, k is the number of
haplotypes, pi is the sample frequency of the i-th haplotype. Haplotype diversity is a
direct estimation of population variability, it will be higher in a population with a great
number of alleles and lower in a population with few alleles or with only one common
allele. This index was calculated using the software Arlequin ver 3.01 (Excoffier et al.
2005).
3.3.5 Phylogenetic analysis
Phylogenetic relationships among the different five-locus haplotypes were
explored by calculating a Median Joining using Network 4.2 (Bandelt et al. 1999).
The method is based on Kruskal’s minimum spanning tree algorithm and Farris’
maximum parsimony algorithm. The first one realizes all possible trees with the
minimal value of sum of branch length (the shortest distance among the haplotypes
observed); the second creates consensus haplotypes (median vectors) to joint the trees.
The network summarizes all parsimony trees and all possible evolutionary
pathways are represented through cycles.
To better compare the haplotype distribution among populations with different
sample sizes, we calibrated the networks considering all populations of the same size
and recalculating haplotype frequencies
26
3.3.6 Inter-population genetic variability
Total inter-populations diversity (Fst) was calculated from haplotype data using
the infinite-allele model, Arlequin ver 3.01 (Excoffier et al. 2005). Fst will be 0, when
all meta-populations have the same allele frequencies (Wright 1951).
We performed an Analyses of Molecular Variance (AMOVA) to investigate the
genetic structure of populations using information on the allelic content of haplotypes,
as well as their frequencies (Excoffier et al. 1992; Schneider et al. 1999). It is possible
to test an eventual genetic structure measuring the variability at several hierarchical
level: among populations (Fst), among groups (Fct), within groups of populations (Fsc).
The number of permutations used to test the significance of covariance components and
fixation indices was 10,000, Arlequin ver 3.01 (Excoffier et al. 2005).
3.3.7 Genetic distances
Fst index was used to calculated pair-wise genetic distances between the
populations. It is an index analogue to Fst of Wright (1951) based on pair-wise
differences among halotypes. Pairwise Fst was calculated applying the Nei’s equation
(1987), Arlequin ver 3.01 (Excoffier et al. 2005). Fst statistical significance was
assessed using 10,000 bootstrap replications. The matrix obtained was standardized by
elimination of negative values summing the higher negative value to each other value.
The distance matrix was synthetically represented by a non-metric
Multidimensional Scaling (MDS). MDS is a non-metric multivariate analysis that
allows to reproduce many data, on many populations and many loci, in two or three
dimensions, reducing the loss of information. We generate MDS using the software
StatSoft ver 6 (StatSoft Italia srl, 2001) and choosing a final bi-dimensional
representation; the program gives stress values indicating the goodness of
approximation.
3.3.8 Age estimation of T-13910 allele
The method used to estimate the Time of the Most Recent Common Ancestor
(TMRCA) of the T-13910 allele is based on the simulation of the overtime decay in the
frequency of the allele originally associated with the T-13910 allele in each
microsatellite locus (Seixas et al. 2001). The modal allele length at each microsatellite
locus in the pooled sample was considered to be the ancestral. The method is based on
the intra-allelic accumulation of microsatellite diversity, assuming a stepwise mutation
27
model and using a 25-year generation time. Recombination can be taken into account,
r 0.0015 0.00016 0.00013 Table 3.5 Mutation (μ) and recombination (r) rates used for the age estimations of T-13910 allele.
m1, assuming suppression of recombination and microsatellite indirect estimation of mutation rates; m2, assuming suppression of recombination and microsatellite mutation rates calculated from a 0.001 direct average estimate; m3, mutation rates as in m1 and assuming recombination rates; m4 mutation rates as in m2 and assuming recombination rates.
3.3.9 Neutrality tests
Neutrality tests for T-13910 allele were performed using the method of Slatkin
and Bertorelle (2001), which evaluates if the observed frequency of an allele (T-13910)
is consistent with its level of variability (estimates using the three STR loci) under a
given demographic pattern, assuming neutrality. Intra-allelic variability was measured
as the minimum number of mutations (S0) observed at linked microsatellite marker loci
(Slatkin & Bertorelle 2001; Slatkin 2002) and was inferred using median-joining
networks, Network 4.2 (Bandelt et al. 1999).
For each population the number of chromosomes bearing the T-13910 allele and
the total number of chromosomes in the sample were used.
We used both sets of mutation rates used for age calculations, considering
simultaneously the 3 STR loci.
We test two different demographic models. D1 assumes a constant exponential
growth rate r=0.008 starting 900 generations ago (t) from an initial population of (N1)
103 to a final one of (N0) 1,340,000 (Pritchard et al. 1999). D2 assumes that the
effective population size increased exponentially (r=0.0146) from (N1) 104 to (N0)
5x10⁹ starting (t) 900 generations ago (Kruglyak 1999).
Neutrality is rejected when the probabilities of finding a number of mutations ≤ S0
in the microsatellite loci linked to T-13910 allele is lower than 0.001.
29
RESULTS
4.1 Allele and genotype frequencies at C/T–13910 and G/A-22118 loci in
Italian populations
Genotype frequencies at -13910 and -22018 loci observed in 749 samples
belonging to the 18 Italian populations are showed in Table 4.1. Allelic frequencies are
reported in the same table and the map (Figure 4.1) clearly represents C and T allelic (at
locus –13910) distribution within each population and within each geographic group.
total Italy 749 0.728 0.250 0.023 0.852 0.148 0.690 0.276 0.033 0.828 0.172 Table 4.1 Relative genotype (in grey colour) and allelic (in white colour) frequencies at C/T-
13910 and G/A-22118 loci observed in the 18 Italian populations. Populations are grouped for geographic areas and the sample sizes are indicated by N.
30
Figure 4.1 Map of allelic frequencies for C and T alleles at –13910 locus in Italian populations.
Numbers indicate the populations following the order in Table 4.1. The four geographic areas are separated by black lines and the total frequencies for each area are on left side of the map.
The values indicate a North-South decreasing gradient in Italy for both T-13910
and A-22018 alleles, the derived alleles associated to lactase persistence in Euro-Asiatic
populations (Enattah et al. 2002; Bersaglieri et al. 2004). This is consistent with great
part of previous estimations of lactase persistence based on physiological test, that are
reported in table 4.2 A (Marenco et al. 1970; Arrigo et al. 1980; Zuccato et al. 1983;
Burgio et al. 1984; Rinaldi et al. 1984).
N Lactase Persistence
A North 383 50%South 109 28%Sicily 100 29%tot 592
B North 89 48%Centre 65 81%South 51 59%tot 205
Table 4.2 Lactase persistence estimations based on physiological tests: in the first part (A) data confirming the North-South gradient (Marenco et al. 1970; Arrigo et al. 1980; Zuccato et al. 1983; Burgio et al. 1984; Rinaldi et al. 1984), in the second part (B) data showing the absence of the gradient and a more microgeographic variability (Cavalli-Sforza et al. 1987).
31
As we can see, both molecular and physiological data confirm the decline in
frequency toward South typical of the European continent (Flatz 1987; Swallow 2003),
but lactase persistence frequencies are higher for phenotype estimations.
The T-13910 allele exhibits frequencies ranging from 33% in Ladini, in the North
of Italy, to 3.7% in Roseto (CS), in the South, for an average estimation of lactase
persistence in Italy of 15%. Generally A-22018 allele frequencies are higher because it
represents a more ancient mutation, even if the two mutations are temporarily closed
(Poulter et al, 2003; Swallow 2003). Always in Ladini samples we found the highest
number of TT-13910 and AA-22018 homozygous.
There were no significant departures from Hardy-Weinberg equilibrium for both
loci (data not shown) in any populations, excepted in Tocco sample that resulted in
equilibrium after the Bonferroni correction for multiple testing.
4.2 Relationship between T-13910 and A-22018 alleles The relationships between T-13910 and A-22018 allele distribution within each
population were represented by a simple linear regression (Figure 4.2). We found a
substantial correspondence between the frequencies of the derived alleles, the
population positions in the graphic reflect their geographic positions and the T-13910
and A-22018 allele distribution that declines from North to South.
Figure 4.2 Simple linear regression between the frequencies of T-13910 (on the Y axis) and A-
22018 (on the X axis) derived alleles. Northern populations are in red, Centre-Northern ones are in blue, Centre-Southern ones are in pink and Southern ones are in green.
32
Interesting when we consider the entire Italian sample, the distribution of
frequencies is statistically different for both markers (p=0, RxC test), but excluding
Northern samples (Ladini, Val di Scalve, Udine and Castelmassa) the difference is no
more significant (p=0.24 for –13910 and p=0.46 for -22018, RxC test). South and
Central Italy populations result more homogeneous among them.
Considering the four geographic groups, populations within Centre-North, Centre-
South and South groups confirm their similarity (p>0,05, RxC test), while in the
Northern ones the allelic distribution at -22018 locus results significantly different
(p=0.02, RxC test). The data evidence Northern populations are more different among
them, but respect to other Italian populations too, as we can see also from their position
in the Figure 4.2.
4.3 Allele and genotype frequencies at C/T–13910 and G/A-22118 loci in
Asian populations
Table 4.3 shows the distribution of allele and genotype frequencies in the two
Asian groups considered in this study. In Middle East lactase persistence ranges from
6.8% to 14.3%; Central Asian values are lower ranging from 3.1% to 6.2% with the
highest values in the two highland populations, the Kirghiz from Sary-Tash and the
Kazakhs.
Homozygous subjects are rare: two TT-13910/AA-22018 homozygous subjects
were found in the Kurdish sample, while 3 AA-22018 homozygous are present in the
Kazakh sample.
Frequencies distribution within the two groups result homogeneous (P>0.05,
RxC). In Central Asia, no significant differences were found either among different
ethnic groups (Kirghizes- Uighurs- Kazakhs) or between low- and high-land
populations (Kirghiz from Talas and Uighurs - Kirghiz from Sary-Tash and Kazakhs).
33
N CC CT TT C T N GG GA AA G AMiddle East Kurds 49 0.755 0.204 0.041 0.857 0.143 48 0.750 0.208 0.042 0.854 0.146
Table 4.4 Frequencies of the core haplotypes defined by C/T-13910 and G/A-22018
polymorphisms in Italian, Middle Eastern and Central Asian populations; populations with * are subsamples.
The low frequency of CA intermediate haplotypes, that as the ancestral CG
haplotypes are associated to lactase non-persistence, is related to the short time
intercourse between G/A-22018 and C/T-13910 mutations (Poulter et al. 2003; Swallow
2003). The polymorphisms were originated according to C-G, C-A, T-A phylogenetic
sequence; the absence of TG haplotypes depends on the absence of recombination
between the two loci.
4.5 Microsatellite variation within the SNPs haplotypes
Microsatellite allele frequency distribution for the three population groups are
shown in Figure 4.3; we separately analyzed the distribution within the CG non-
persistence and TA persistence lineages. The distribution within each population is
represented in supplementary material, Figure S1. The estimated sizes of allele 1 in each
microsatellite are: 184bp for D2S3010; 125bp for D2S3013 and 175bp for D2S3015.
Table 4.5 A and B show heterozygosity estimations (H) for each locus and the average
for all loci within each populations and within each groups.
35
In general, the three microsatellite loci show different patterns of variation
determined by different mutation rates, but distribution patterns and heterozygosity (H)
for each locus are similar among the different population groups. CG lineages show
higher variability than TA lineages, as expected for a relative recent origin for the C-T
mutation at 13910 locus (Poulter et al. 2003; Swallow et al. 2003).
D2S3010 locus shows a bell shaped distribution and similar heterozygosity among
the populations. Within the persistence TA haplotypes the range of variability is reduce
and allele 10 is the most frequent in both Italian and Middle Eastern populations, while
allele 11 is dominant in Central Asia. Allele 11 is the modal allele in Roma sample too.
D2S3013 has a bimodal distribution with a common 7 allele within CG lineages.
The same bimodality is not observed within TA haplotypes, where the allele 21 is
modal. Interesting we found a low heterozygosity in Val di Scalve likely determined by
founder effect, allele 21 reaches a frequency of 85%.
D2S3015 locus is characterized by a lower mutation rate and presents a small
number of alleles; allele 4 is the most common within CG lineages and it is the only one
within TA lineages with the exception of allele 7, 2 chromosomes in Albidona sample,
maybe determined by recombination events.
In contrast to a previous study (Coelho et al. 2005), we found the presence of
recombinants within TA haplotype in both D2S3013 and D2S3015 loci, even if at very
low frequencies. In spite of that, all populations have the same reduced pattern within
TA lineages suggesting a single origin for all TA chromosomes from different
geographic regions. The unimodal distribution at the D2S3013 locus, determined by a
stepwise accumulation of mutations around allele 21, and the monomorphism at the
D2S3015 locus (allele 4), suggest the mutation associated to persistence occurred on a
21-4 background (Coelho et al. 2005). It is more difficult to identified the ancestral
allele at D2S3010 locus because it is more variable also within TA lineages.
36
Figure 4.3 Micorsatellite allele frequency distribution within lactase non-persistence CG (in
black) and lactase persistence TA (in white) (-13910/-22018 loci) haplotypes in Italian, Middle Eastern and Central Asian populations. N= number of chromosomes; H= heterozygosity.
37
A SC PAL ALF TO RM ACS Italy N of TA chr. 41 10 9 8 9 12 89H D2S3010 0.689 0.740 0.494 0.594 0.444 0.625 0.671H D2S3013 0.263 0.760 0.519 0.750 0.593 0.708 0.552H D2S3015 0.000 0.000 0.000 0.000 0.000 0.153 0.022avarage H 0.317 0.500 0.337 0.448 0.346 0.495 0.415
Table 4.5 Number of lactase persistence TA and lactase non-persistence CG (-13910/-22018 loci)
haplotypes, heterozygosity for each locus and average heterozygosity. (A) In Italian population: Val di Scalve SC, Palazzuolo PAL, Alfero ALF, Tocco TO, Roma RM and Albidona ACS. (B) in Asian populations: Kurds Ku, Persians Per, Kirghiz of Sary Tash KSa, Kirghiz of Talas KTa, Uighurs Uig and Kazakhs Kaz.
4.6 Phylogenetic analysis of TA lineages
We calculated median joining (MJ) networks that show the relationships between
the observed TA haplotypes and their distribution across populations. We realized
separate networks for the three continental groups (Figure 4.4, 4.5 and 4.6) and than we
compare these haplotypes to Portugal, Sao Tomè and Fulbe from Cameroon, the only
data in literature that are based on the same markers (Coelho et al. 2005) (Figure 4.7).
All TA haplotypes used in this analyses are listed in supplementary material, Table S2.
To observe the distribution patterns without being influenced by the sample sizes, we
calibrated the networks: we recalculated haplotype frequencies considering the same
population size for all populations in the network.
38
In Italian populations haplotype Hp13, determined by the modal allele for each
microsatellite 10-21-4, is the most common (38%) and it is the only one presents in all
six samples (Figure 4.4). Hp 20 differs for a single mutational step at locus D2S3010
(11-21-4) and it is mainly observed in Roma sample. Haplotype diversity vary among
populations with a medium value of 0.823 ±0.034.
N of TA chr. N of TA Hp polimorphic sites haplotype diversity S.D.SC 41 8 2 0.755 0.052PAL 10 9 2 0.978 0.054ALF 9 5 2 0.722 0.016TO 8 7 2 0.964 0.077RM 9 5 2 0.861 0.087ACS 12 6 3 0.803 0.096 Italy 89 21 3 0.823 0.034 Figure 4.4 Calibrated Median Joining Network of the TA haplotypes in six Italian populations.
Each circle represents a different haplotype, its size is proportional to its relative frequency and the presence in each population is indicated with a different color. The two most common haplotypes are shown. Standard diversity indexes are reported in the table.
39
Hp 13 is the most frequent in Middle East too (27%) and it is the only one shared
between Kurds and Persians (Figure 4.5).
N of TA chr. N of TA Hp polimorphic sites haplotype diversity S.D.
Ku 14 10 2 0.945 0.045Ir 4 3 2 0.833 0.222Mid. East 18 12 2 0.922 0.051 Figure 4.5 Calibrated Median Joining Network of the TA haplotypes in Middle Eastern
populations, each population is indicated with a different color. The most common haplotype is shown. Standard diversity indexes are reported in the table.
.
The examination of Figure 4.6 reveals that Hp8 (9-21-4) and Hp13 are the most
frequent in Central Asia populations; both haplotypes are absent in the Uighurs. Asian
samples present an higher haplotype diversity (HD=0.915 ±0.029) determined by a
relative higher number of different haplotypes with similar frequencies across
populations: 9-21-4 (19%), 10-21-4 (19%), 11-23-4 (15%) and 11-21-4 (11%).
40
N of TA chr. N of TA Hp polimorphic sites haplotype diversity S.D.
KSa 6 4 2 0.800 0.172KTa 6 6 2 1.000 0.096Uig 3 3 2 1.000 0.272Kaz 12 7 2 0.894 0.063Cent. Asia 27 13 2 0.915 0.029 Figure 4.6 Calibrated Median Joining Network of the TA haplotypes in Central Asian
populations, each population is indicated with a different color. The most common haplotypes are shown. Standard diversity indexes are reported in the table.
We compare our haplotype data to Portugal (60% of lactase persistence estimated
on the basis of C/T-13910 and G/A-22018 markers) Sao Tomè (7.8% of lactase
persistence likely due to recent admixture with Europeans) and Fulbe haplotypes (38%
of lactase persistence; this pastoralist population from Cameroon is among the few
African populations where the T-13910 allele is present, maybe introduced through
retromigrations from North-Africa) (Mulcare et al. 2004; Coelho et al. 2005). Hp13 is
confirmed to be the worldwide most frequent haplotype with an ubiquitous distribution,
followed by Hp20 and Hp8. In the Fulbe sample Hp13 reaches high frequencies (29%)
but the most common haplotypes in this African group is Hp14 10-22-4 (38%) (Figure
4.7).
41
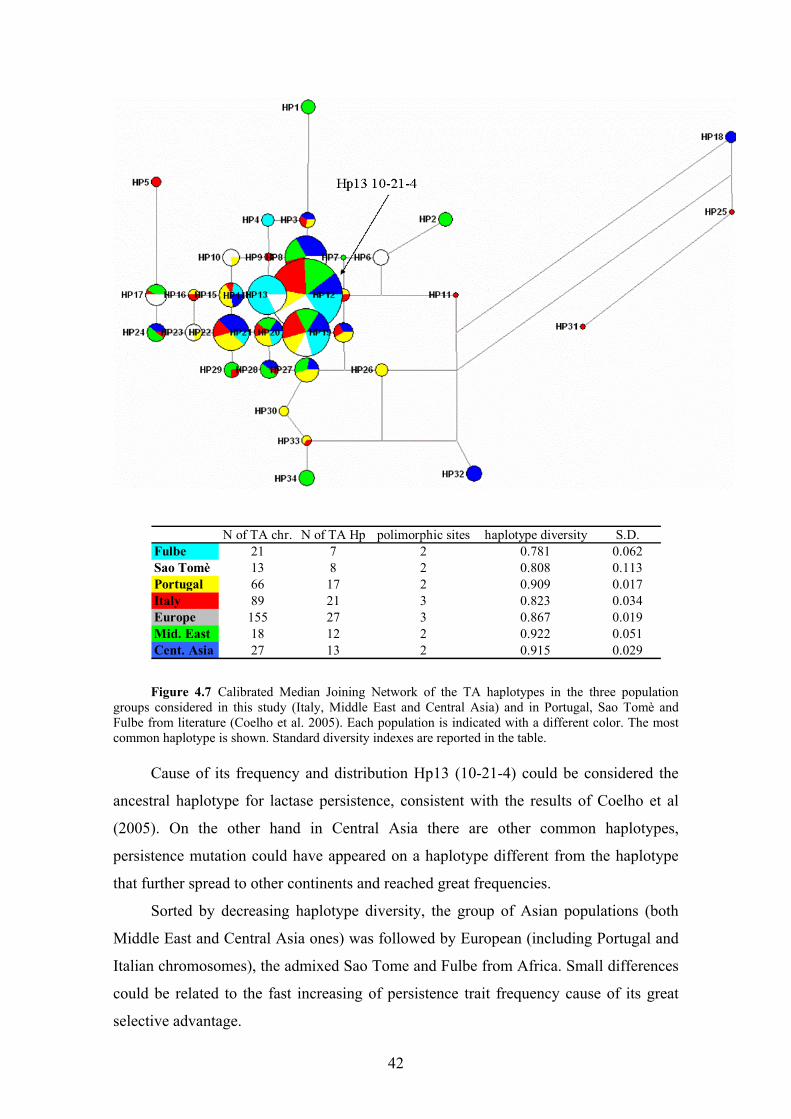
N of TA chr. N of TA Hp polimorphic sites haplotype diversity S.D.Fulbe 21 7 2 0.781 0.062Sao Tomè 13 8 2 0.808 0.113Portugal 66 17 2 0.909 0.017Italy 89 21 3 0.823 0.034Europe 155 27 3 0.867 0.019Mid. East 18 12 2 0.922 0.051Cent. Asia 27 13 2 0.915 0.029 Figure 4.7 Calibrated Median Joining Network of the TA haplotypes in the three population
groups considered in this study (Italy, Middle East and Central Asia) and in Portugal, Sao Tomè and Fulbe from literature (Coelho et al. 2005). Each population is indicated with a different color. The most common haplotype is shown. Standard diversity indexes are reported in the table.
Cause of its frequency and distribution Hp13 (10-21-4) could be considered the
ancestral haplotype for lactase persistence, consistent with the results of Coelho et al
(2005). On the other hand in Central Asia there are other common haplotypes,
persistence mutation could have appeared on a haplotype different from the haplotype
that further spread to other continents and reached great frequencies.
Sorted by decreasing haplotype diversity, the group of Asian populations (both
Middle East and Central Asia ones) was followed by European (including Portugal and
Italian chromosomes), the admixed Sao Tome and Fulbe from Africa. Small differences
could be related to the fast increasing of persistence trait frequency cause of its great
selective advantage.
42
4.7 Analyses of inter-population variability within TA lineages
Genetic pair-wise differences among the 12 populations analyzed in this study
have been visualized by a no-metric Multidimensional Scaling (MDS) (Figure 4.8).
Populations cluster for geographic area, except for ACS sample from Italy that clusters
closer to Asian populations likely for the presence of recombinant chromosomes. We
found no differences among population within Middle East and Central Asia; Italian
populations resulted less homogeneous among them (Fst=0.045, p=0.031) and this
diversity is mainly determined by SC sample: excluding this sample from North Italy
the genetic difference was no more significant (Table 4.6).
among the 12 populations. The genetic distance matrix was realized from haplotype data.
43
Fst p valueMid. East -0.019 0.561Cent. Asia -0.002 0.488Italy 0.045 0.031no SC -0.027 0.772no PAL 0.055 0.024no ALF 0.060 0.013no TO 0.054 0.014no RM 0.039 0.053no ACS 0.053 0.029Global 0.028 0.003
Table 4.6 Analyses of inter-population variability using Fst. In grey, Fst estimation in the complete Italian sample and excluding one population a time.
The analyses of molecular variance (AMOVA) in the three population groups
suggest that the portion of genetic variance allocated among populations (FST) is 0.029
(P=0.051), while no difference has been found among groups. Furthermore, the analysis
of genetic structure shows that: first the largest differences are among Italian and
Central Asian populations (Fst=0.045, p=0.028); second Middle East populations are
similar to Central Asian ones (Fst=0) and little divergent from Italian one (Fst=0.019,
p=0.057) (Table 4.7).
AMOVA p value
Italy-Mid. East-Cent. Asia Fct -0.003 0.678Fst 0.029 0.051Fsc 0.032 0.073
Italy-Mid. East Fct -0.021 0.844Fst 0.019 0.057Fsc 0.039 0.040
Italy-Cent. Asia Fct 0.009 0.462Fst 0.045 0.028Fsc 0.036 0.064
Table 4.8 Age estimations of the most recent common ancestor of the T-13910 allele; 95%
confidence intervals are gives in parentheses. Estimations were calculated assuming different mutation rates and the absence (m1 and m2) or presence (m3 and m4) of recombination.
Age estimations indicate the time since intra-allelic diversity began to accumulate
due to an increase in frequency or population expansion. The mutation results older in
Central Asia, followed by Middle East and Italy. SC sample has shown to be different
from the other Italian samples, we estimate the age without SC chromosomes and
Italian estimations results anyway younger than Middle Eastern ones (data not shown).
45
4.9 Neutrality test
To figure out if the observed patterns of variability within TA-lineages were
consistent with the standard neutral model of evolution, we performed neutrality tests
assuming different demographic models and different microsatellite mutational rates
(see materials and method section 3.3.9).
Neutrality is rejected when the probabilities of finding a number of mutations ≤ S0
in the microsatellite loci linked to T-13910 allele is lower than 0.001. Neutrality is
always rejected in the Italian sample, while in Middle Eastern and Central Asian
populations neutrality is rejected only when an higher mutational rate is assumed (m2)
for both demographic models (Table 4.9).
D1 D2
Population ni n S0 m1 m2 m1 m2Italy 89 450 40 1.21E-05 1.64E-35 1.46E-17 2.87E-80Mid. East 18 142 19 0.603 1.97E-05 0.088 1.13E-11Cent. Asia 27 234 25 0.508 2.23E-07 0.015 9.59E-18
Table 4.9 Neutrality test. Probability of finding a number of mutations ≤ S0 in the microsatellite
loci linked to T-13910 allele under two demographic models (D1-D2) and two mutational rates (m1-m2). ni is the number of chromosomes with the T-13910 allele; n the total number of chromosomes in the sample; S0 the minimum number of mutations.
46
DISCUSSION AND CONCLUSIONS
Lactase persistence is a subject of great interest because the genomic region
including LCT gene (chr 2q21), which encodes the enzyme lactase-phlorizin
hydrolase, is largely considered one of the strongest examples of positive selection
pressure (Bersaglieri et al. 2004). It also represents a good example of genetic-
environment coevolution, since the genetic trait seems to have increased in
frequency starting from the Neolithic Transitions, together with the diffusion of
dairy farming and the habit of drink milk in adulthood, that gives nutritional
advantages (Holden & Mace 1997).
From a molecular point of view, the discovery of two polymorphisms, the
C/T-13910 and the G/A-22018 - whose derived alleles are respectively totally and
highly associated to lactase persistence in Eurasian populations - represented an
important new tool of investigation (Enattah et al. 2002).
The subject of this thesis is a molecular screening of lactase persistence in
three population groups: Italians, Middle Easterns and Central Asians; followed by a
phylogeographic analysis of results in order to contribute to the reconstruction of
the evolution of lactase persistence trait across Eurasian populations.
To this aim, genetic markers with different mutational rates, located in the
region surrounding LCT gene (chr. 2), were used. Biallelic markers (SNPs)
associated to lactase persistence were important to identify lactase persistence
lineages, on the other hand microsatellite markers (STRs) were fundamental to
capture the variability within the lineages (Coelho et al. 2005). In fact, STRs are fast
evolving polymorphisms that need less time to accumulate intra-allelic variability,
an important feature in a region where positive selection has drastically reduced the
genetic variability. When an advantageous mutation rises in frequency also the
surrounding region rises in frequency; under selection pressure this process is so fast
that neither mutation or recombination has enough time to disrupt the haplotype. The
consequence is a large region of linkage disequilibrium between alleles; considering
only SNPs a larger number of markers, covering a wide genomic region would be
necessary to evidence some sources of variability.
47
The sampling strategy
In the first part of the study we assessed the distribution of lactase persistence,
typing the C/T-13910 and the G/A-22018 markers, in a total of 1117 subjects
coming from geographically and ethnically different populations within Eurasia. In
this way we contributed to improve data available in literature on molecular
persistence distribution across human populations.
We realized an extend sample collection in Italy, dividing the country in four
geographic areas and sampling 4-6 populations within each area for a total of 749
individuals. We also considered the level of isolation of samples and verified the
provenience of each subject collecting bio-demographic information on the last three
generations.
The Asian sample consists of two populations from Middle East (Kurds and
Persian from Iran), a particularly interesting region where the Neolithic Transition
process that mainly involved Europe has developed. The Central Asian sample is
composed of two Kirghiz groups from Sary-Tash and Talas, Uighurs and Kazakhs;
all populations have a nomadic pastoral origin and their economy is based mainly on
pastoralism.
Lactase persistence variability in Italy The wide Italian sample collection was necessary to improve avaible
molecular data on our country and to better analyze lactase persistence distribution,
because in previous physiological estimations different patterns were observed.
Our findings, based on T-13910 allele frequencies, were in agreement with the
physiological data that support a decreasing cline of lactase persistence from North
to South (Marenco et al. 1970; Arrigo et al. 1980; Zuccato et al. 1983; Burgio et al.
1984; Rinaldi et al. 1984). Both kinds of data revealed the same trend, but
physiological estimations of lactase persistence are higher. This could be related to
the lack of sensitivity of physiological tests that identify false negative individuals,
wrongly considered to be lactase persistent. For example in the “Breath Hydrogen
Determination” test, the level of hydrogen derived from metabolism of lactose by
colonic bacteria in non-persistent subjects could depend on the type of colonic
bacteria, that influences the quantity of hydrogen produced. Moreover, there are
some antibiotics suppressing the colonic hydrogen formation (Arola 1988; Flatz
1987).
48
The decline of lactase persistence toward South is typical of the European
continent (Flatz 1987; Swallow 2003), but Italian populations are among the
European populations with the lowest prevalence of lactase persistence (Flatz 1987).
With an average molecular estimation of 15% (frequency of T-13910 allele), Italy is
similar to other Mediterranean populations (from Morocco to Greece with a
physiological range between 9-47%; Flatz 1987). Neighbouring European
populations have physiological level of lactase persistence higher than 63% (Spain
85%, France 77%, Swiss 84%, South Germany 77%, Austria 80% and ex
Yugoslavia 63%; Flatz 1987). Lactase persistence frequencies are very high in North
and Central Europe where milk consumption has been a greater biological
advantage, both as a source of energy and as a supply of calcium (Flatz &
Rotthauwe 1973). The strong decrease in frequency in Italy could be the result of the
migration barrier of Alps (Flatz 1987) and of a more intensive gene flow with other
Mediterranean populations.
Although we didn’t reveal the so marked differences in lactase persistence
distribution found by Cavalli-Sforza (1987), we evidenced some microgeographic
variability within Italian populations. As expected, Northern populations showed
higher level of T-13910 and A-22018 alleles, but they resulted significantly different
among them and when compared to other Italian populations. One explanation could
be the presence of “genetic isolates”, such as the ethnic group of Ladini, that are
linguistically isolated, or the Val di Scalve sample, located in a geographically
isolated valley close to Bergamo. Genetic drift action, reducing genetic variability
within a population and increasing differences among populations in absence of
gene flow, could have contributed to increase the frequencies of the derived alleles.
But following our criteria of sample collection, isolated populations have been
included within each geographic area, for example Alfero (FC) that shows lower
level of persistence than the neighbouring Alta Val Savio sample (FC) and Albidona
(CS) with higher values of persistence respect to other Southern populations;
anyway the allelic distribution within these groups are homogeneous. An additional
explanation could be a greater gene flow with other European countries, where
lactase persistence is more common as described above. It’s largely known that from
a genetic point of view, Northern Italian populations are similar to Central Europe
populations, while Central and Southern populations are closer to populations from
Greece and other Mediterranean countries (Cavalli-Sforza et al. 1994). Furthermore,
49
the highest frequencies of the derived alleles within the Ladini samples are probably
related to their South Germany origin.
Lactase persistence in Asia
The frequency of lactase persistence established typing the C/T-13910
polymorphism varied widely among the two Asian groups considered in this study,
but it is in line with the decreasing frequency of the trait, that is very common in
Europe and almost non existent among East Asians (Flatz 1987; Sahi et al. 1994;
Bersaglieri et al. 2004; Enattah 2005, unpublished data).
In Middle East the frequency ranges from 14.3% in Kurds to 6.8% in Persians,
consistent with the low frequency of lactase persistent allele observed in the region
(Bersaglieri et al. 2004; Enattah 2005, unpublished data; Ingram et al. 2006). The
high value in Kurds is within the range of the region; a previous study demonstrated
that, also for other molecular markers, Kurds and other Middle Eastern populations
show similar patterns of genetic variability (Useli 2006, unpublished data).
Finally, in the four Central Asian groups we found persistence values between
3.1-6.2%. No significant differences were found either among different ethnic
groups (Kirghizes-Uighurs-Kazakhs) or between low and high altitude populations
(Kirghiz from Talas and Uighurs - Kirghiz from Sary-Tash and Kazakhs), even if
lactase persistence reaches higher frequencies in highland populations, probably as a
consequence of a strong founder effect (Perez-Lezaun et al. 1999).
Phylogeographic analyses
The T-13910 allele is associated to lactase persistence in all Eurasian
population till now tested, in agreement with epidemiological data (Enattah et al.
2002; Bersaglieri et al. 2004; Mulcare et al. 2004; Coelho et al. 2005).
In order to understand the origins and evolution of lactase persistence, we
analysed the genetic variability within the persistence lineages, defined by the
derived alleles at –13910 and –22018 loci, in three population groups coming from
different geographic areas of Eurasia, using the approach developed by Coelho et al.
(2005). This approach is based on the use of fast evolving markers (STRs) able to
capture the variability within TA lineages because they need less time to accumulate
alleles, an important feature considering they lie in a genomic region where natural
50
selection has reduced the genetic variability (Harvey et al. 1995; Poulter et al. 2003;
Bersaglieri et al. 2004; Coelho et al. 2005).
Within the persistence TA lineages the range of intra-allelic variability was
reduced respect to non-persistence CG lineages, as expected for a relative recent
origin for the T-13910 allele (Poulter et al. 2003; Swallow et al. 2003) and a
consequent reduced amount of time to accumulate new alleles. The allelic pattern
was the same within TA chromosomes from different geographic regions suggesting
a single origin for all of them. A common origin for all persistence chromosomes
was suggested by Bersaglieri (2004), that observed the T-13910 allele was found
both in Europe than in Middle East and Pakistan samples on the same genetic
background, the haplotype A.
Modal allele for each microsatellite has been clearly identified for D2S3013
(21) and D2S3015 (4) loci, while D2S3010 locus shows a higher variability and
different modal alleles in Italy and Middle East (10) and in Central Asia (11).
Phylogenetic analyses revealed the presence of a common haplotype 10-21-4 in all
populations studied in this thesis and in all European and African populations from
literature analyzed for the same set of markers (Portugal, Sao Tomè and Fulbe)
(Coelho et al. 2005). Hp 10-21-4 could be the ancestral haplotype, the allelic
background on which lactase persistence mutation occurred as already proposed by
Coelho et al. (2005). On the other hand, in Central Asian populations there are many
haplotypes with similar frequencies 9-21-4 (19%), 10-21-4 (19%), 11-23-4 (15%)
and 11-21-4 (11%); we can not exclude that the ancestral haplotype could be
different from the one (10-21-4) that further has reached the highest frequency in
other populations.
According to intra- and inter-population variability and the age estimations of
the T-13910 allele, suggesting an older presence of the C/T-13910 mutation in
Central Asia, we proposed a possible Central Asian origin for the mutation
associated to lactase persistence. The diffusion in Central Asian samples of many
haplotypes with similar frequencies and a great haplotype diversity could be
determined by an older presence of the persistent lineages. Usually ancestral
populations show a higher level of genetic diversity because the action of
evolutionary forces, such as mutation and recombination, is proportional to time
51
elapsed. Haplotype diversity values were intermediate in Europe and lower in
African samples (Coelho et al. 2005); in the latter the T-13910 allele presence is
related to a strong European admix in the Sao Tomè sample and likely introduced
through retro-migration from North Africa in the Fulbe ethnic group of Cameroon
(Mulcare et al. 2004; Coelho et al. 2005).
Interestingly, Enattah (2005, unpublished data) analysed the genetic variability
associated to lactase persistence in 37 populations from Eurasia and Africa origin
using 9 biallelic markers, and found a high frequency of the pre-persistence
haplotype (hap 4) and maximal diversity of persistence haplotypes in Central Asia
(East slope of the Urals). He proposed, using a different set of markers, the same
region (Central Asia) as the possible place of origin of the mutation associated to
lactase persistence.
Our age estimations suggest a pre-Neolithic origin of the T-13910 allele in
Central Asia, between 12,400 and 19,500 years B.P., considering more realistic
estimations that assume recombination. These estimations confirm the T-13910
allele appeared after the separation from African populations between 100,000-
50,000 years ago - explaining the absence of the T-13910 allele in Africa (Mulcare
et al. 2004; Tishkoff et al. 2006) - and before the Neolithic Transition occurred
approximately 10,000 years ago (Bersaglieri et al. 2004; Coelho et al. 2005).
The migration of individuals carrying the T allele from Central Asia to Europe
could be responsible for the diffusion across different populations of the persistent
trait. The intermediate genetic position of Middle East populations revealed by
AMOVA could depends on its intermediate geographic position and consequently
gene flow from the Mediterranean area and Central Asia. On the other hand the
genetic features of Middle East sample could be related to the genetic gradient
determined by the spread of diffusion of T-13910 allele from Asia to Europe. We
could hypothesize that lactase persistence has reached Europe following the
Neolithic Transition diffusion. The agriculture and dairying diffusion from Middle
East toward West started around 10,000 years ago; it is subject of debate if the
Neolithic expansion was a cultural diffusion of new technologies or a demic
diffusion caused by a strong demographic development (Ammerman & Cavalli-
Sforza 1984). The analysis of the first principle component by Cavalli-Sforza et al
52
(1996) shows a genetic gradient across Europe with a centre of origin in Middle
East, supporting the demic diffusion hypothesis. The gradient is consistent with
archaeological data, such as the age estimations of cereal arrival in Europe
(Diamond 1998).
The age of the T-allele in the Middle East sample (8,800-14,100 B.P.) brackets
the development of agriculture and dairying, and in Italy (6,200-10,200 B.P.) is
consistent with the introduction of pastoralism, as demonstrated by archaeological
studies (Cavalli-Sforza et al. 1994).
This possible relationship between Neolithic diffusion and lactase persistence
diffusion, was underlined by Myles et al. (2005) too. They studied allele T-13910
distribution in North-African populations and found the lactase persistence was
probably introduced together with the domestication of ovicaprids, from Near East
7,000 years B.P., as confirmed by archaeological, linguistic and Y-chromosomal
data evidences (Holl 1998; Blench 2001; Arredi et al. 2004).
Our age estimation of the T-13910 allele are also consistent with previous
ones obtained using the same method, the intra-allelic accumulation of microsatellite
diversity, (7,440-12,300 years B.P.) (Coelho et al. 2005) and by the decay of LD in
either direction from the LCT core region and intragenic recombination (2,188-
20,650 years B.P. in American European and 1,625-3,188 years B.P. in
Scandinavian populations) (Bersaglieri et al. 2004).
A recent study on ancient DNA (Burger et al. 2007) tested the C/T-13910
polymorphism in 8 early Neolithic (mostly 7,800-7,000 years ago) and 1 Mesolithic
(4,200-2,100 years ago) skeletons from Central Northeast and Southeast Europe;
they found only the ancestral allele C and concluded (even if the sample size is
small) the allele T was not present at high frequencies in Europe in early Neolithic,
before the diffusion of dairying and the development of advantageous condition.
Bersaglieri (2004) supported the strong positive selection occurred in European
populations after the separation from Asian and African American samples, because
even if the persistence mutation lies on the same haplotypes (the haplotype A), the
haplotype homozigosity is higher in European populations. From the neutrality tests
performed in this study, neutrality is always rejected in the Italian sample, while in
Middle Eastern and Central Asian populations neutrality is rejected only when an
higher mutational rate is assumed for both demographic models considered.
53
Following our hypothesis the T-13910 allele reached Middle East from Central
Asia, with a further diffusion across Europe in correspondence of the Neolithic
diffusion of agriculture and dairying. In contrast to this hypothesis, Enattah (2005,
unpublished data) suggested a later diffusion of the lactase persistence mutation: he
hypothesized an origin of the mutation among nomadic groups in the East slope of
the Urals. Due to nomadic migrations the mutation reached the Western slope of
Ural and spread to region between the Volga and the Urals, north of the Caucasus
and the Black Sea. He hypothesized this diffusion in Europe was likely related to the
expansion of pastoral nomads speaking Indo-European languages from the Kurgan
area (above the Caucasus) between 4,500-3,500 B.P (Cavalli-Sforza 1994).
Concluding remarks
The present study confirmed the presence of a decreasing gradient from North
to South of lactase persistence in Italian populations consistent with physiological
data and the persistence distribution pattern in Europe. Italian populations are among
the European populations with the lowest prevalence of lactase persistence (15%),
likely determined by the migration barrier of Alps and a more intensive gene flow
with other Mediterranean populations
The frequency of lactase persistence decreases in Middle Eastern and Central
Asian populations, in agreement with previous physiological and molecular
estimations.
Due to intra- and inter-population variability and the age estimations of the T-
allele, obtained using fast evolving markers (STRs), we proposed a possible Central
Asian origin for lactase persistence, in agreement with Enattah’s findings. The
jointed results could imply lactase persistence arrived in Europe from Central Asia
through at least two ways: the first during the Neolithic and lactase persistence
spread across Europe together with the agriculture and dairying diffusion; the second
one during the Bronze Age and is related to the expansion in Europe of pastoral
nomads speaking Indo-European languages.
54
REFERENCES
Akey JM, Eberle MA, Rieder MJ, Carlson CS, Shriver MD, Nickerson DA, Kruglyak L (2004). Population history and natural selection shape patterns of genetic variation in 132 genes. PLoS Biol., 2(10):e286.
Ammerman AJ, Cavalli-Sforza LL (1984). The Neolithic Transition and the genetics of populations in Europe. Princeton University Press, Princeton, N.J.
Aoki K (1986). A stochastic model of gene-culture coevolution suggested by the "culture historical hypothesis" for the evolution of adult lactose absorption in humans. Proc Natl Acad Sci U S A, 83:2929-33.
Aoki K (2001). Theoretical and empirical aspects of gene-culture coevolution. Theor Popul Biol 59:253–261.
Arola H, Koivula T, Jokela H, Jauhiainen M, Keyrilainene O, Ahola T, Uusitalo A, Isokoski M (1988). Comparisons of indirect diagnostic methods for hypolactasia. Scand. J. Gastroenterol., 23:351-357. Arola H (1994). Diagnosis of hypolactasia and lactose malabsorption. Scand. J. Gastroenterol; 29 suppl 202:26-35.
Arredi B, Poloni ES, Paracchini S, Zerjal T, Fathallah DM, Makrelouf M, Pascali VL, Novelletto A, Tyler-Smith C (2004). A predominantly Neolithic origin for Y-chromosomal DNA variation in North Africa. Am J Hum Genet, 75:338–345. Arrigo L, Ciangarotti S, Lantiere PB, Capponetto A, Rovida S, Bozzatti D, Detoni T, Duillo MT (1980). Indagine epidemiologica sul grado di incidenza dell’ipolattasia e dell’intolleranza al lattosio, in campioni di popolazione adulta e pediatrica, in Liguria. Rev. Soc. Ital. Sci. Aliment., 9:391-400. Bandelt HJ, Forster P, Röhl A (1999). Median-joining networks for inferring intraspecific phylogenies. Mol Biol Evol, 16:37-48. http://www.fluxus-engineering.com Beja–Pereia A, Luikart G, England PR, Bradley DG, Jann OC, Bertorelle G, Chamberlain AT, Nunes TP, Metodiev S, Ferrand N, Erhardt G (2003). Gene–culture coevolution between cattle milk protein genes and human lactase genes. Nat Genet, 35(4):311-3. Bersaglieri T, Sabeti PC, Patterson N, Vanderploeg T, Schaffner SF, Drake JA, Rhodes M, Reich DE, Hirschhorn JN (2004). Genetic signatures of strong recent positive selection at the lactase gene. Am. J. Hum. Genet., 74:1111-1120. Blench RM (2001). Types of language spread and their archaeological correlates: the example of Berber. Origini, 23:169–189.
Boll W, Wagner P, Mantei N (1991). Structure of the chromosomal gene and cDNAs coding for Lactase-Phlorizin hydrolase in humans with adult-type hypolactasia or persistence of lactase. Am. J. Hum. Genet., 48:889-902. Burger J, Kirchner M, Bramanti B, Haak W, Thomas MG (2007). Absence of the lactase-persistence-associated allele in early Neolithic Europeans. PNAS, 104(10):3726-3741. Burgio GR, Flatz G, Barbera C, Patane R, Boner A, Cajozzo C, Flatz S (1984). Prevalence of primary adult lactose malabsorption and awareness of milk intolerance in Italy. Am. J. Clin. Nutr., 39:100-104. Cavalli-Sforza LL. (1966). Population structure and human evolution. Proc R Soc Lond B Biol Sci, 164(995):362-79. Cavalli-Sforza LL (1973). Analytic review: some current problems of human population genetics. Am J Hum Genet, 25:82-104. Cavalli-Sforza LL (1996). Geni, popoli e lingue. Adelphi. Cavalli-Sforza LL, Strata A, Barone A, Cucurachi L (1987). Primary adult lactose malabsorption in Italy: regional difference in prevalence and relationship to lactose intolerance and milk consumption. Am. J. Clin. Nutr., 45:748-54. Cavalli-Sforza LL, Menozzi P, Piazza A (1994). The History and Geography of Human Genes. Princeton University Press, Princeton, New Jersey. Coelho M, Luiselli D, Bertorelle G, Lopes AI, Seixas S, Destro-Bisol G, Rocha J (2005). Microsatellite variation and evolution of human lactase persistence. Hum Genet, 117: 329–339. Cook GC (1978). Did persistence of intestinal lactase into adult life originate on the Arabian Peninsula? Man (N.S.), 13:418-27. Dahlqvist A (1964). Method for Assay of Intestinal Disaccharides. Anal Biochem, 57:18-25. Diamond J (1998). Armi, acciaio e malattie. Breve storia negli ultimi tredicimila anni. Einaudi, pp139. Enattah NS, Sahi T, Savilahti E, Terwilliger JD, Peltonen L, Järvelä I (2002). Identification of a variant associated with adult – type hyptolactasia. Nat. Genet., 30:233-37. Enattah NS (2005). Molecular genetics of lactase persistence. PhD dissertation, University of Helsinki. Unpublished data. Escher JC, De Koning ND, Van Engen CG, Arora S, Büller HA, Montgomery RK, Grand RJ (1992). Molecular basis of lactase levels in adult humans. J. Clin. Invest., 89:480-483.
Excoffier L, Smouse P, Quattro J (1992). Analysis of molecular variance inferred from metric distances among DNA haplotypes: Application to human mitochondrial DNA restriction data. Genetics, 131:479-491. Excoffier, Laval LG, Schneider S (2005). Arlequin ver. 3.0: An integrated software package for population genetics data analysis. Evolutionary Bioinformatics Online 1:47-50. http://cmpg.unibe.ch/software/arlequin3/ Flatz G, Rotthauwe HW (1973). Lactose nutrition and natural selection. Lancet, 2:76-7. Flatz G, Rotthauwe HW (1977). The human lactase polymorphism: physiology and genetics of lactose absorption and malabsorption. Prog Med Genet, 2:205-49. Flatz G (1987). Genetics of lactose digestion in humans. Adv Hum Genet, 16:1-77. Goldstein DB, Reich DE, Bradman N, Usher S, Seligsohn U, Peretz H (1999). Age estimates of two common mutations causing factor XI deficiency: recent genetic drift is not necessary for elevated disease incidence among Ashkenazi Jews. Am J Hum Genet, 64:1071–1075. Grosso G (1934). Marche: dialetti. In: Gentile G, ed. Eniclopedia Italiana. Roma, Italy: Rizzoli& C, 22:232-3. Harvey CB, Fox MF, Jeggo PA, Mantei N, Povey S, Swallow DM (1993) Regional localization of the lactase phlorizin hydrolase gene, LCT, to chromosome 2q21. Ann Hum Genet, 57 ( Pt 3):179-85. Harvey CB, Pratt WS, Islam I, Whitehouse DB, Swallow DM (1995). DNA polymorphisms in the lactase gene. Linkage disequilibrium across the 70-kb region. Eur J Hum Genet, 3:27-41. Harvey CB, Wang Y, Darmoul D, Phillips A, Mantei N, Swallow DM (1996). Characterisation of a human homologue of a yeast cell division cycle gene, MCM6, located adjacent to the 5' end of the lactase gene on chromosome 2q21. FEBS Lett, 398:135-40. Harvey CB, Hollox EJ, Poulter M, Wang Y, Rossi M, Auricchio S, Iqbal TH, Cooper BT, Barton R, Sarner M, Korpela R, Swallow DM (1998). Lactase haplotype frequencies in Caucasians: association with the lactase persistence/non-persistence polymorphism. Ann. Hum. Genet., 62:215-223. Holden C, Mace R (1997). Phylogenetic analysis of the evolution of lactase digestion in adults. Human Biology, 69:605-628. Holl AFC (1998). The dawn of African pastoralisms: an introductory note. J Anthropol Archaeol, 17:81–96. Hollox E. J., Poulter M., Zvarik M., Ferak V., Krause A., Jenkis T., Saha N., Kozlov A.I., Swallow D.M. (2001). Lactase haplotype diversity in the Old World. An. J. Hum. Genet., 68:160-172.
Ingram CJ, Elamin MF, Mulcare CA, Weale ME, Tarekegn A, Raga TO, Bekele E, Elamin FM, Thomas MG, Bradman N, Swallow DM (2006). A novel polymorphism associated with lactose tolerance in Africa: multiple causes for lactase persistence? Hum Genet.,120(6):779-88. International HapMap Consortium (2005). A haplotype map of the human genome. Nature, 437:1299-320. Jobling MA, Hurles ME, Tyler-Smith C (2003). Adaptation to diet: Lactase persistence. Features of lactase persistence. Human evolutionary genetics origins, people & disease: pp 414-421. Johnson JD, Kretchmer N, Simoons FJ (1974). Lactose malabsorption: its biology and history. Adv Pediatr, 21:197-237.
Jorde LB, Watkins WS, Bamshad MJ, Dixon ME, Ricker CE, Seielstad MT, Batzer MA (2000). The Distribution of Human Genetic Diversity: A Comparison of Mitochondrial, Autosomal, and Y-Chromosome Data. Am. J. Hum. Genet., 66:979–988.
Kong A, Gudbjartsson DF, Sainz J, Jonsdottir GM, Gudjonsson SA, Richardsson B, Sigurdardottir S, Barnard J, Hallbeck B, Masson G, Shlien A, Palsson ST, Frigge ML, Thorgeirsson TE, Gulcher JR, Stefansson K (2002). A high-resolution recombination map of the human genome. Nat Genet, 31:241–247. Kretchmer N (1971). Lactose and lactase-a historical perspective. Gastroenterology, 61:805-13. Kruglyak L (1999). Prospects for whole-genome linkage disequilibrium mapping of common disease genes. Nat Genet, 22:139–144. Kruse TA, Bolund L, Grzeschik KH, Ropers HH, Sjostrom H, Noren O, Mantei N, Semenza G (1988). The human lactase-phlorizin hydrolase gene is located on chromosome 2. FEBS Lett, 240:123-6. Lewinsky HR, Jensen TGK, Møller J, Stensballe A, Olsen J, Troelsen JT (2005). T-13910 DNA variant associated with lactase persistence interacts with Oct-1 and stimulates lactase promoter activity in vitro. Human Molecular Genetics,14(24):3945-3953. Lloyd M, Mevissen G, Fischer M, Olsen W, Goodspeed D, Genini M, Boll W, Semenza G, Mantei N (1992). Regulation of intestinal lactase in adult hypolactasia. J Clin Invest, 89:524-9. Mantei N, Villa M, Enzler T, Wacker H, Boll W, James P, Hunziker W, Semenza G (1988). Complete primary structure of human and rabbit lactase-phlorizin hydrolase: implications for biosynthesis, membrane anchoring and evolution of the enzyme. Embo J, 7:2705-13. Marenco G, Ghibaudi D, Meraviglia A (1970). Intolleranza al lattosio nell’adulto. Minerva Pediatr, 22:505-513.
Metz G, Jenkins DJ, Peters TJ, Newman A, Blendis LM (1975). Breath hydrogen as a diagnostic method for hypolactasia. Lancet, 1:1155-7. Mulcare CA, Weale ME, Jones AL, Connell B, Zeitlyn D, Tarekegn A, Swallow DM, Bradman N, Thomas MG (2004). The T allele of a single-nucleotide polymorphism 13.9 kb upstream of the lactase gene (LCT) (C-13.9 kb T) does not predict or cause the lactase-persistence phenotype in Africans. Am. J. Hum. Genet., 74 (6):1102-10. Myles S, Bouzekri N, Haverfield E, Cherkaoui M, Dugoujon JM, Ward R (2005). Genetic evidence in support to a shared Eurasian-North African dairying origin. Hum Genet, 117:34-42. Nei M (1987). Molecular Evolutionary Genetics. New York, NY: Columbia University Press, p 177. Nielsen R. (20019. Statistical tests of selective neutrality in the age of genomics. Heredity, 86:641–647 Olds LC, Sibley E (2003). Lactase persistence DNA variant enhances lactase promoter activity in vitro: functional role as a cis regulatory element. Hum Mol Genet, 12:2333-40. Pérez-Lezaun A, Calafell F, Comas D, Mateu E, Bosch E, Martínez-Arias R, Clarimón J, Fiori G, Luiselli D, Facchini F, Pettener D, Bertranpetit J (1999). Sex-specific migration patterns in Central Asian populations, revealed by analysis of Y-chromosome short tandem repeats and mtDNA. Am J Hum Genet, 65(1):208–219. Poulter M, Hollox EJ, Harvey CB, Mulcare C, Peuhkuri K, Kajander K, Sarner M, Korpela R, Swallow DM (2003). The causal element for the lactase persistence/non-persistence polymorphism is located in a 1 Mb region of linkage disequilibrium in Europeans. Annals of Human Genetics, 67:298-311. Pritchard JK, Seielstad MT, Perez-Lezaun A, Feldman MW (1999). Population growth of human Y chromosomes: a study of Y chromosome microsatellites. Mol Biol Evol, 16:1791–1798. Remenyi A, Scholer HR. Wilmanns M (2004). Combinatorial control of gene expression. Nat. Struct. Mol. Biol., 11:812–815. Rasinpera HSE, Enattah NS, Kuokkanen M, Totterman N, Lindahl H, Jarvela I, Kolho KL (2004) Genetic test, which can be used to diagnose adult-type hypolactasia in children. Gut, 53:1571-1576. Raymond ML, Rousset F (1995). An exact test for population differentiation. Evolution, 49:1280-3. http://www.marksgeneticsoftware.net/rxc.htm Rinaldi E, Albini L, Costagliola C, Derosa G, Auricchio G, Devizia B, Auricchio S (1984). High frequency of lactose absorbers among adults with idiopathic senile and presenile cataract in a population with a high prevalence of primary adult lactose malabsorption. Lancet, 1:355-357.
Ronald J, Akey JM (2005). Genome-wide scans for loci under selection in humans. Hum Genomics, 2(2):113-25. Rossi M, Maiuri L, Fusco MI, Salvati VM, Fuccio A, Auricchio S, Mantei N, Zecca L, Gloor SM, Semenza G (1997). Lactase persistence versus decline in human adults: multifactorial events are involved in down-regulation after weaning. Gastroenterology, 112:1506-14. Sabeti PC, Schaffner SF, Fry B, Lohmueller J, Varilly P, Shamovsky O, Palma A, Mikkelsen TS, Altshuler D, Lander ES (2006). Positive natural selection in the human lineage. Science, 312(5780):1614-20. Sahi T (1974). The inheritance of selective adult-type lactose malabsorption. Scand J Gastroenterol, Suppl 30:1-73. Sahi T (1994). Genetics and epidemiology of adult-type hypolactasia. Scand. J. Gastroenterol; 29 suppl 202: 7-20.
Schneider S, Excoffier L (1999). Estimation of demographic parameters from the distribution of pair-wise differences when the mutation rates vary among sites: Application to human mitochondrial DNA. Genetics, 152:1079-1089. Scrimshaw N, Murray E (1998). The acceptability of milk and milk products in populations with a high prevalence of lactose intolerance. Am J Clin Nutr, 48:1079-1159. Seixas S, Garcia O, Trovoada MJ, Santos MT, Amorim A, Rocha J (2001). Patterns of haplotype diversity within the serpin gene cluster at 14q32.1: insights into the natural history of the alpha1-antitrypsin polymorphism. Hum Genet, 108:20–30. Simoons FJ (1969). Primary adult lactose intolerance and the milking habit: a problem in biological and cultural interrelations. I. Review of the medical research. Am J Dig Dis, 14:819-36. Simoons FJ (1970). Primary adult lactose intolerance and the milking habit: a problem in biological and cultural interrelations. II. A culture historical hypothesis. Am J Dig Dis, 15:695–710. Simoons FJ (2001). Persistence of lactase activity among Northern Europeans: a weighing of evidence for the calcium absorption hypothesis. Ecology of Food and Nutrition, 40:397-469. Slatkin M, Bertorelle G (2001). The use of intra-allelic variability for testing neutrality and estimating population growth rate. Genetics, 158:865–874. Slatkin M (2002). The age of alleles. In: Slatkin M, Veuille M (eds) Modern developments in theoretical population genetics: the legacy of Gustave Male´ cot. Oxford University Press, New York, pp 233–260. StatSoft Italia srl (2001). STATISTICA, ver 6. www.statsoft.it.
Stephens M, Donnelly P (2003). A comparison of Bayesian methods for haplotype reconstruction from population genotype data. Am J Hum Genet, 73:1162-9. Swallow DM (2003). Genetics of lactase persistence and lactose intolerance. Annu. Rev. Genet., 37:197-219. Swallow DM (2006). DNA test for hypolactasia premature. Gut., 55(1):131. Takahashi K, Yamada H, Yanagida M (1994) Fission yeast minichromosome loss mutants mis cause lethal aneuploidy and replication abnormality. Mol Biol Cell, 5(10):1145-58. Takahata N (1993). Allelic genealogy and human evolution. Mol Biol Evol, 10:2–22. Tishkoff SA, Reed FA, Ranciaro A, Voight BF, Babbitt CC, Silverman JS, Powell K, Mortensen HM, Hirbo JB, Osman M, Ibrahim M, Omar SA, Lema G, Nyambo TB, Ghori J, Bumpstead S, Pritchard JK, Wray GA, Deloukas P (2006). Convergent adaptation of human lactase persistence in Africa and Europe. Nat Genet, 39(1):31-40. Troelsen JT, Olsen J, Moller J, Sjostrom H (2003) An upstream polymorphism associated with lactase persistence has increased enhancer activity. Gastroenterology, 125:1686-94. Troelsen JT (2005). Adult-type hypolactasia and regulation of lactase expression. Biochim. Biophys. Acta, 1723:19–32. Useli A. (2006). Analisi di polimorfismi autosomici, del cromosoma Y e del DMA mitocondriale in un campione di etnia Curda. PhD dissertation, University of Bologna. Unpublished data. Wall JD, Pritchard JK (2003). Haplotype blocks and linkage disequilibrium in the human genome Nat Rev Genet., 4(8):587-97. Review. Wang Y, Harvey CB, Pratt WS, Sams VR, Sarner M, Rossi M, Auricchio S, Swallow DM (1995). The lactase persistence/non-persistence polymorphism is controlled by a cis-acting element. Hum Mol Genet, 4:657-62. Wang Y, Harvey CB, Hollox EJ, Phillips AD, Poulter M, Clay P, Walker-Smith JA, Swallow DM (1998).The genetically programmed down-regulation of lactase in children. Gastroenterology, 114:1230-6. Weber JL, Wong C (1993). Mutation of human short tandem repeats. Hum Mol Genet, 2:1123–8. Wright S(1951). The genetical structure of populations. Ann eugen, 1:323-334. Xu H, Fu Y (2004). Estimating effective population size or mutation rate with microsatellites. Genetics, 166:555–563. Zabel MD, Wheeler W, Weis JJ, Weis JH (2002). Yin Yang 1, Oct1, and NFAT-4 form repeating, cyclosporin-sensitive regulatory modules within the murine CD21 intronic control region. J. Immunol., 168:3341–3350.
61
Zuccato E, Andreoletti M, Bozzani A, Marcucci F, Velio P, Bianchi P, Mussini E (1983). Respiratory excretion of hydrogen and methane in Italian subjects after ingestion of lactose and milk. Eur. J. Clin. Invest., 13:261-266. Zvelebil M (2000). Archaeogenetics: DNA and the population history of Europe. 57-70. Ed Boyle K., MacDonald Institute Cambridge, Cambridge. www.hapmap.org: homepage of Hapmap project http://genewindow.nci.nih.gov
Table S1: Distribution of phased haplotypes consisting of the C/T-13910 and G/A -22018 SNPs and microsatellites D2S3010, D2S3013 and D2S3015.
Hp D2S3010 D2S3013 -13910 -22018 D2S3015 Ksa Kta Uig Kaz Ku Per SC PAL ALF To RM ACS tot1 2 19 C G 4 12 4 7 C G 4 13 4 7 C G 7 14 4 23 C G 4 15 5 7 C G 4 2 1 36 5 19 C G 4 17 5 21 T A 4 18 5 22 C G 4 19 6 7 C G 4 3 2 110 6 19 C G 4 1 111 6 20 C G 7 1 112 6 21 C G 4 1 1 213 6 22 C G 4 1 1 2 1 514 6 23 C G 4 1 115 7 7 C A 4 1 116 7 7 C G 4 3 1 2 2 1 1 1017 7 7 C G 5 1 118 7 7 C G 7 1 119 7 7 C G 9 1 120 7 10 C G 4 1 4 521 7 18 C G 4 1 1 1 322 7 19 T A 4 1 123 7 19 C G 4 1 1 2 3 724 7 20 C G 4 2 1 1 1 525 7 21 C G 4 1 1 3 2 1 1 926 7 22 C G 4 1 1 1 1 427 7 26 C G 4 1 1 228 8 7 C G 4 1 1 1 329 8 7 C G 5 1 130 8 7 C G 7 1 1 1 2 531 8 7 C G 8 1 132 8 19 C G 4 1 2 2 4 1 1 1 1233 8 20 C G 4 1 1 1 334 8 21 T A 4 1 2 335 8 21 C G 4 1 1 1 1 1 536 8 21 C G 5 1 137 8 21 C G 6 1 138 8 22 C G 4 1 2 2 2 2 1 1039 8 23 C G 4 1 1 240 8 23 C G 5 1 141 8 24 C G 4 1 142 8 25 C G 4 1 1 1 343 8 26 T A 4 3 344 8 26 C G 4 1 145 9 7 C G 4 3 1 4
111161116
63
Hp D2S3010 D2S3013 -13910 -22018 D2S3015 Ksa Kta Uig Kaz Ku Per SC PAL ALF To RM ACS tot46 9 7 C G 6 1 1 1 347 9 7 C G 7 1 1 248 9 7 C G 8 1 1 2 2 1 749 9 9 C G 7 1 150 9 13 C G 4 1 151 9 18 C G 4 1 1 252 9 19 C G 4 1 1 1 1 453 9 20 T A 4 1 154 9 20 C G 4 3 1 2 1 2 1 1055 9 20 C G 5 1 1 1 356 9 21 T A 4 3 1 1 2 6 1 1457 9 21 C A 4 1 1 2 1 558 9 21 C G 2 1 159 9 21 C G 4 1 1 2 1 1 1 760 9 21 C G 5 1 1 1 361 9 21 C G 9 1 1 262 9 22 C A 4 1 1 263 9 22 C G 4 5 1 3 2 2 3 1 1764 9 22 C G 5 1 165 9 23 C A 4 1 1 266 9 23 C G 4 2 2 1 1 1 3 1 1 1267 9 24 C G 4 1 1 268 10 5 C G 4 1 169 10 6 C G 7 1 170 10 7 C A 7 1 171 10 7 C G 7 1 3 1 1 672 10 7 C G 8 2 3 1 2 1 1 3 1373 10 8 C G 8 1 174 10 8 C G 9 1 175 10 8 C G 10 1 176 10 11 C G 4 1 1 1 2 1 677 10 12 C G 4 1 1 278 10 17 T A 4 1 179 10 17 C A 4 2 280 10 17 C G 4 1 1 281 10 18 C G 4 1 182 10 19 C A 4 1 183 10 19 C G 4 2 1 384 10 20 T A 4 1 1 285 10 20 C G 4 1 1 1 2 1 686 10 20 C G 5 1 1 287 10 20 C G 8 1 188 10 21 T A 4 1 1 3 3 2 18 2 5 2 2 5 4489 10 21 C A 4 1 1 290 10 21 C G 4 2 1 3 1 1 1 1 1 1191 10 21 C G 5 1 1 292 10 21 C G 8 1 193 10 22 C G 2 1 194 10 22 C G 4 1 1 295 10 23 T A 4 1 1 1 396 10 23 C G 4 2 2 1 597 10 24 T A 4 1 1 298 10 25 T A 4 1 1 299 11 7 C G 6 1 1 1 3100 11 7 C G 7 2 2 6 1 5 3 1 7 1 4 32
64
Hp D2S3010 D2S3013 -13910 -22018 D2S3015 Ksa Kta Uig Kaz Ku Per SC PAL ALF To RM ACS tot101 11 7 C G 8 1 2 3102 11 8 T A 4 1 1103 11 11 C G 4 1 1104 11 12 C G 4 1 1 1 3105 11 13 C G 4 1 1 2106 11 15 C G 3 1 1107 11 17 C G 4 1 1108 11 18 C A 4 2 2109 11 19 C G 4 1 2 1 4110 11 20 T A 4 1 1 1 1 4111 11 20 C A 4 1 1112 11 20 C G 4 1 2 1 4113 11 21 T A 4 1 2 2 8 1 1 3 18114 11 21 C A 4 1 1115 11 21 C G 4 2 2 4 2 1 2 2 15116 11 22 T A 4 1 1 2 2 6117 11 22 C G 2 1 1118 11 22 C G 4 1 1 2 3 1 1 3 1 6 19119 11 23 T A 4 1 3 1 1 1 3 10120 11 23 C A 4 1 1121 11 23 C G 4 1 1 1 2 2 1 3 1 12122 11 23 C G 5 1 1123 11 23 C G 9 1 1124 11 25 T A 4 1 1 1 3125 12 5 C G 4 2 1 3126 12 6 C G 6 2 2127 12 7 T A 4 1 1128 12 7 C G 7 1 2 2 9 2 7 2 8 4 1 7 45129 12 7 C G 8 1 1 1 2 4 2 3 2 1 2 19130 12 7 C G 9 1 1 2131 12 8 C G 7 1 1132 12 11 C G 4 1 1133 12 12 C G 4 1 1134 12 13 C G 4 1 1135 12 14 C G 4 1 1136 12 18 C G 4 1 1 2137 12 19 C G 4 1 1138 12 20 C G 4 1 2 1 1 5139 12 21 T A 4 1 1 2140 12 21 C G 4 1 1 2 1 2 1 8141 12 22 T A 4 1 1 1 3142 12 22 C G 4 1 2 1 3 1 1 9143 12 23 T A 4 1 1 1 3144 12 23 C G 4 1 1 2145 12 23 C G 5 1 1 2146 12 24 C G 4 1 1147 13 7 C G 6 1 1 2148 13 7 C G 7 1 1 2 1 1 1 2 2 3 1 15149 13 7 C G 8 3 2 2 1 1 3 4 6 1 4 27150 13 7 C G 9 2 1 1 1 3 8151 13 8 C G 7 1 1152 13 11 C G 4 1 1153 13 13 C G 4 1 1 1 1 4154 13 14 C G 4 1 1 2155 13 18 C G 4 1 1
65
Hp D2S3010 D2S3013 -13910 -22018 D2S3015 Ksa Kta Uig Kaz Ku Per SC PAL ALF To RM ACS tot156 13 19 C G 4 1 1 2157 13 21 C G 4 1 1 1 1 1 5158 13 22 C G 4 2 1 3 4 3 1 14159 13 23 C G 2 1 1160 13 23 C G 4 1 1 1 1 1 5161 13 24 C G 4 1 1162 14 7 T A 7 1 1163 14 7 C G 7 1 1 2 2 2 3 4 1 1 4 4 25164 14 7 C G 8 1 1 1 1 3 7165 14 7 C G 9 1 2 1 4166 14 14 C G 4 1 1 2167 14 16 T A 4 1 1 2168 14 21 T A 4 1 1169 14 21 C G 4 1 1170 14 21 C G 5 1 1171 14 21 C G 8 1 1 2172 14 22 C G 4 1 1 1 3173 14 23 C G 4 1 3 4174 14 28 C G 4 1 1175 15 7 C G 8 1 1 3 1 4 1 1 12176 15 7 C G 9 1 1 2 4177 15 8 C G 8 1 1178 15 13 C G 4 1 1 2179 15 20 C G 4 1 1180 15 20 C G 5 1 1181 15 21 T A 4 1 1 2182 15 21 C G 4 1 1 2183 15 21 C G 5 1 1184 15 22 C G 4 1 1 2185 15 23 C G 5 1 1186 16 7 C G 7 3 1 4187 16 7 C G 8 1 1188 16 13 C G 4 2 2189 16 20 C G 4 1 1 1 2 5190 16 21 C G 4 1 1 2191 17 7 C G 8 1 1 2192 17 20 C G 4 1 1193 17 21 C G 4 1 1194 18 21 C G 4 1 1
56 60 58 60 98 44 84 66 82 74 60 84 826
66
Table S2: Distribution of TA persistence haplotypes within the populations analyzed in this study and within Portugal, Sao Tomè and Fulbe samples from literature (Coelho et al. 2005).
Hp D2S3010D2S3013 -13910 -22018 D2S3015 Ksa Kta Uig Kaz Asia Ku Per MidEast SC PAL ALF To RM ACS Italy Portugal São Tome FulbeHp1 5 21 T A 4 1 1Hp2 7 19 T A 4 1 1Hp3 8 21 T A 4 1 1 2 2 1Hp4 8 22 T A 4 1Hp5 8 26 T A 4 3 3Hp6 9 19 T A 4 1Hp7 9 20 T A 4 1 1Hp8 9 21 T A 4 3 1 1 5 2 2 6 1 7 6 1Hp9 9 22 T A 4 1Hp10 9 23 T A 4 1 1Hp11 10 17 T A 4 1 1Hp12 10 20 T A 4 1 1 2 2Hp13 10 21 T A 4 1 1 3 5 3 2 5 18 2 5 2 2 5 34 14 6 6Hp14 10 22 T A 4 1 8Hp15 10 23 T A 4 1 1 1 1 2 5 1Hp16 10 24 T A 4 1 1 2 1Hp17 10 25 T A 4 1 1 1 1 1Hp18 11 8 T A 4 1 1Hp19 11 20 T A 4 1 1 1 1 1 3 3Hp20 11 21 T A 4 1 2 3 2 2 8 1 1 3 13 6 1 3Hp21 11 22 T A 4 1 1 1 1 2 2 4 4 1Hp22 11 23 T A 4 1 3 4 1 1 1 3 6 9 1Hp23 11 24 T A 4 1 1Hp24 11 25 T A 4 1 1 1 1 1 1Hp25 12 7 T A 4 1 1Hp26 12 19 T A 4 3Hp27 12 21 T A 4 1 1 1 1 6Hp28 12 22 T A 4 1 1 1 1 1 1Hp29 12 23 T A 4 1 1 1 1 2Hp30 13 21 T A 4 2Hp31 14 7 T A 7 1 1Hp32 14 16 T A 4 1 1 2Hp33 14 21 T A 4 1 1 1Hp34 15 21 T A 4 1 1 1 1
6 6 3 12 27 14 4 18 41 10 9 8 9 12 89 66 13 21
67
Figure S1: Microsatellite allele frequency distribution within the CG non-persistence (in black) and TA persistence lineages (in white), within each population. The estimated sizes of allele 1 in each microsatellite are: 184bp for D2S3010; 125bp for D2S3013 and 175bp for D2S3015. N= number of chromosomes.
68
69
70
ACKNOWLEDGMENTS
Thanks to prof. Donata Luiselli and prof. Davide Pettener for the opportunity
to work in this field. Thanks to all the other people of the research group: Loredana
Castri, Antonella Useli, Alessio Boattini, Marco Sazzini and Graziella Ciani. A
particular thanks to the students that helped me in the lab work: Isabella Paganini-
Paganelli, Mariangela Laino and Angelo Puglisi.
Thanks to prof. Jorge Rocha and Margarida Coelho from IPATIMUP
(Portugal) for the constant help and the important suggestions during the
development of the thesis.
Thanks to Prof Giovanni Destro-Bisol, Cinzia Battaggia and all the other
people from Università la Sapienza, Rome, for the DNA samples and to have
collaborated in typing the samples.
Thanks to all people that kindly offered their DNA for our researches.