Page 1
UNIVERSITY OF CALGARY
Sedimentation of oil sands tailings via microbial treatments
by
Jeremy James Robert Kooyman
A THESIS SUBMITTED TO THE SCHULICH SCHOOL OF ENGINEERING
IN PARTIAL FULFILMENT OF THE REQUIREMENTS FOR THE
BIOMEDICAL ENGINEERING SPECIALISATION
DEPARTMENT OF MECHANICAL & MANUFACTURING ENGINEERING
CALGARY, ALBERTA, CANADA
APRIL, 2011
© Jeremy Kooyman 2011
Page 2
1
UNIVERSITY OF CALGARY SCHULICH SCHOOL OF ENGINEERING
SPECIALISATION IN BIOMEDICAL ENGINEERING
The undersigned certify to have read, and recommend to the Schulich School of Engineering for acceptance, a thesis entitled Sedimentation of oil sands tailings via microbial treatments submitted by Jeremy Kooyman in partial fulfilment of the requirements for the Specialisation in Biomedical Engineering.
________________________________________________ Supervisor, Dr-Ing. Robert Martinuzzi. Mechanical and Manufacturing Engineering
________________________________________________
External Examiner, Dr. David Wood. Mechanical and Manufacturing Engineering
_______________________ Date
Page 3
2
Abstract:
Bioremediation, the use of biological processes to overcome environmental problems, is
being explored as a possible method addressing the problems associated with tailings ponds
such as toxicity and process water consumption. Preliminary experiments that treated
mature fine tailings with BioTiger, a multispecies consortium with established
bioremediation abilities, yielded results that suggested a large potential for reducing the
environmental impact and energy requirements of oil sands development.
This research project examined the individual effects of the BioTiger species on the
sedimentation of mature fine tailings and found no notable difference between the BioTiger
species and experimental controls. However, a significant reduction in optical density was
observed in mixed samples treated with BioTiger, suggesting that oil sands operators could
use BioTiger to achieve the fines reduction goals outlined by the ERCB in Directive 074.
Future experiments will need to be conducted to determine the large-scale feasibility of this
process.
Page 4
3
Acknowledgments:
First and foremost, I would like to thank Dr. Martinuzzi for granting me the opportunity to
conduct several months of research in his laboratory. The experience has brought me closer
to achieving my educational goals.
I would also like to thank Dr. Kostenko for her patience and guidance throughout the
course of my research. Her expertise in many things microbial proved to be very valuable
while performing experiments.
Additionally, I would like to thank Mehdi Salek for his assistance with the unfortunately
omitted CFD portion of my research. I cannot fathom preparing a PhD defence while still
finding time to assist an undergraduate student.
Finally, I would like to thank everyone in the Biofilm Engineering Research Group for
tolerating my presence in the lab, and for the use of their facility.
Page 5
4
Table of Contents:
Abstract: ................................................................................................................................. 2
Acknowledgments: ................................................................................................................. 3
Table of Contents: .................................................................................................................. 4
List of Figures ......................................................................................................................... 8
List of Tables ........................................................................................................................ 11
List of Acronyms .................................................................................................................. 12
1.0 Significance .................................................................................................................... 13
2.0 Background ..................................................................................................................... 14
2.1 Overview .................................................................................................................... 14
2.2 Environmental Problems ............................................................................................ 15
2.2.1 Toxicity ................................................................................................................ 15
2.2.2 Water Consumption ............................................................................................. 16
2.3 Reclamation of Tailings Ponds ................................................................................... 16
2.3.1 Dry Landscape Approach .................................................................................... 16
2.3.2 Wet Landscape Approach .................................................................................... 17
2.4 Primary Options for MFTs Treatment ........................................................................ 18
2.4.1 Composite Tailings (CT) ..................................................................................... 18
Page 6
5
2.4.2 Freeze-Thaw Dewatering of MFTs ..................................................................... 18
2.5 Microbial Activity in Oil Sands Tailings Ponds ......................................................... 19
2.6 Biofilms ...................................................................................................................... 20
3.0 Overview of Chapters ..................................................................................................... 21
4.0 Hypothesis ...................................................................................................................... 21
5.0 Specific Aims ................................................................................................................. 21
5.1 Evaluation of sedimentation capabilities of BioTiger bacteria .................................. 21
5.2 Evaluation of BioTiger bioremediation capability via alternative parameters ........... 22
6.0 Materials and Methods ................................................................................................... 22
6.1 MFT Samples ............................................................................................................. 22
6.2 Microbial Techniques ................................................................................................. 22
6.3 Sedimentation Measurements and Calculation........................................................... 23
6.4 BioTiger Sedimentation Experiments ........................................................................ 24
6.4.1 Materials .............................................................................................................. 24
6.4.2 Methods – General .............................................................................................. 25
6.4.3 Methods – 10 Day Experiments ......................................................................... 26
6.4.4 Methods – 3 Day Experiments ............................................................................ 27
6.4.5 Methods – 4 Hour Experiments ........................................................................... 29
6.4.6 Methods – Optical Density Analysis ................................................................... 30
Page 7
6
6.4.7 Methods – Full Spectrum Absorbance Analysis ................................................. 30
6.5 Shell Tailings Experiments ......................................................................................... 31
6.5.1 Materials .............................................................................................................. 31
6.5.2 Methods ............................................................................................................... 32
7.0 Results ............................................................................................................................ 33
7.1 BioTiger Sedimentation Experiments ........................................................................ 34
7.1.1 10 Day Sedimentation + Centrifugation Experiment .......................................... 34
7.1.2 4 Hour + 3 Day Control Sedimentation +/- Antibiotics Experiment ................... 37
7.2 Shell Tailings Experiments ......................................................................................... 44
7.3 Optical Density Analysis Results ............................................................................... 49
7.4 Full Spectrum Absorbance Analysis Results ............................................................. 56
8.0 Discussion ....................................................................................................................... 58
8.1 BioTiger Experiments ................................................................................................ 58
8.1.1 10 Day Sedimentation + Centrifugation Experiment .......................................... 58
8.1.2 4 Hour + 3 Day Control Sedimentation +/- Antibiotics Experiment ................... 59
8.2 Shell Tailings Experiments ......................................................................................... 61
8.3 UV-Vis Spectrometer Experiments ............................................................................ 61
8.3.1 Optical Density Analysis ..................................................................................... 62
8.3.2 Full Spectrum Analysis ....................................................................................... 63
Page 8
7
9.0 Conclusions + Future Work ............................................................................................ 64
10.0 References .................................................................................................................... 67
Page 9
8
List of Figures
Figure 1: Visual explaining the two parameters measured for sedimentation. .................... 23
Figure 2: Results of a 10 day MFT sedimentation experiment comparing the effects of the
individual strains of BioTiger bacteria against the water and media controls.Mixed samples.
.............................................................................................................................................. 34
Figure 3: Results of a 10 day MFT sedimentation experiment comparing the effects of the
individual strains of BioTiger bacteria against the water and media controls.Capped
samples. ................................................................................................................................ 35
Figure 4: Results of a 4 hour MFT sedimentation experiment comparing the effects of MFT
treated with water and R2A media against plain tailings.. ................................................... 37
Figure 5: Results of a 3 day MFT sedimentation experiment comparing the effects of
temperature, treatment with R2A media or water, and the presence of antibiotics, against
plain tailings. ........................................................................................................................ 38
Figure 6: The samples that experienced the greatest levels of sedimentation in Figure 5 are
re-plotted here, with standard deviation error bars. .............................................................. 39
Figure 7: Results of a 3 day MFT sedimentation experiment comparing the effects of
temperature, treatment with R2A media or water, and the presence of antibiotics, against
plain tailings.. ....................................................................................................................... 40
Figure 8: The samples that experienced the greatest levels of sedimentation in Figure 7 are
re-plotted here, with standard deviation error bars. .............................................................. 40
F ur 9: Tr p t 24 C Media-Cap + Antibiotics samples from Figure 7 and 8 illustrating
extremely high levels of sedimentation after centrifugation. ............................................... 41
Page 10
9
F ur 10: 36 C Water Control-Mix samples from Figure 5 showing bitumen smearing at
the free surface...................................................................................................................... 42
Figure 11: Results of a 10 day MFT sedimentation experiment comparing the effects of the
individual strains of native Shell MFT bacteria against the water and media controls.Mixed
samples. ................................................................................................................................ 44
Figure 12: The samples that experienced the greatest levels of sedimentation in Figure 11
are re-plotted here, with standard deviation error bars. ........................................................ 45
Figure 13: Results of a 10 day MFT sedimentation experiment comparing the effects of the
individual strains of native Shell tailings bacteria against the water and media controls.
Capped samples. ................................................................................................................... 46
Figure 14: The samples that experienced the greatest levels of sedimentation in Figure 13
are re-plotted here, with standard deviation error bars. ........................................................ 47
Figure 15: Optical density analysis of mixed samples vs. water control from Section 7.1.1..
.............................................................................................................................................. 49
Figure 16: Optical density analysis of mixed samples vs. media control from Section 7.1.1..
.............................................................................................................................................. 50
Figure 17: Optical density analysis of capped samples vs. water control from Section 7.1.1..
.............................................................................................................................................. 52
Figure 18: Optical density analysis of capped samples vs. media control from Section
7.1.1.. .................................................................................................................................... 53
Figure 19: Results of a full spectrum absorbance analysis on mixed samples detailed in
Section 7.1.1. ........................................................................................................................ 56
Page 11
10
Figure 20: Results of a full spectrum analysis on capped samples detailed in Section 7.1.1.
.............................................................................................................................................. 57
Page 12
11
List of Tables
Table 1: Summary of data presented in Figure 4.................................................................. 37
Table 2: Summary of 3Day sedimentation data presented in Figure 5. + Sign indicates
presence of antibiotics. ......................................................................................................... 39
Table 3: Summary of 3Day sedimentation data shown in Figure 7. + Sign indicates
presence of antibiotics. ......................................................................................................... 41
Table 4: Summary of 10 Day sedimentation data presented in Figure 11. .......................... 45
Table 5: Summary of 10 Day sedimentation data presented in Figure 13. .......................... 47
Table 6: Optical Density summary of data presented in Figures 15 and 16. ........................ 51
Table 7: Summary of statistical analysis of data presented in Table 6................................. 51
Table 8: Optical density summary of data presented in Figures 17 and 18. ........................ 54
Table 9: Summary of statistical analysis of data presented in Table 8................................. 54
Page 13
12
List of Acronyms
bbl: Oil barrel, 42 US gallons (158.9873 L)
CAPP: Canadian Association of Petroleum Producers
CT: Composite Tailings
EPS: Extracellular polymeric substance
ERCB: Energy Resources Conservation Board
FTFC: Fine Tailings Fundamentals Consortium
GHG: Greenhouse gas(es)
MFT: Mature fine tailings
MLSB: Mildred Lake Settling Basin
NA: Naphthenic acid
PTAC: Petroleum Technology Alliance Canada
SD: Standard deviation
SRNL: Savannah River National Laboratory
Page 14
13
1.0 Significance
Tailings ponds, a toxic by-produ t of A b rt ’s oil sands mining developments, are a
mixture of sand, clay, water, and an extremely viscous hydrocarbon called bitumen. At
present, these ponds occupy more than 130 km2 of Alberta. Studies indicate that oil sands
developments are releasing toxic elements into the Athabasca River and point to tailings
ponds as a contributing factor (Kelly et al., 2010). With bitumen production projected to
double by 2020 (CAPP 2009), major changes to current extraction and tailings remediation
techniques need to be developed and implemented in order to prevent an environmental
disaster.
Recent research with bacterial biofilms has shown that residual bitumen separation and clay
settling properties can be significantly enhanced when hydrodynamically conditioned.
These results suggest a large potential for reducing the energy requirements and
environmental impact of the oil sands.
This research project seeks to distinguish between the influence of viscosity and the
influence of shear rate on the formation, response, and structure of biofilms. Decoupling
these two influences will enable future research to maximize the beneficial effects of
biofilms for bioremediation applications through specific hydrodynamic conditioning.
Page 15
14
2.0 Background
2.1 Overview
Oil sands are a type of unconventional petroleum deposit consisting of a mixture of sand,
water, and a heavy, viscous hydrocarbon called bitumen, which can be converted to oil.
While these deposits are found across the world, the largest deposits are found in Alberta
and Venezuela (Tenenbaum 2009).
These deposits are found in four major areas in Alberta: Athabasca (the largest), Wabasca,
Peace River, and Cold Lake. It is estimated that there are 175 billion barrels of recoverable
oil in these reserves, ranking Alberta second behind Saudi Arabia for recoverable oil
(Tenenbaum 2009).
Shallow deposits, which are thought to contain 8-20% of A b rt ’s tot o s nds, r
surface mined using some of the largest trucks and shovels in the world. The oil sands
taken from these open pit mines are subjected to variations of the Clark Hot Water
Extraction Process (Clarke 1980), which consists of three major steps:
1. Oil sand is agitated in hot water with a small amount of caustic (often NaOH) to
maintain the pH in the range of 8.0-8.5.
2. Sand grains that have settled on the bottom of the settling tank are removed and the
oil froth that floats to the surface is recovered by skimming. Fine particulate matter,
dominated by clay minerals, remain in what is called the middling stream.
3. The stream is then processed, which provides incremental recovery of suspended
bitumen through conventional froth floatation.
Page 16
15
The slurry remaining after the Clark Hot Water Extraction Process is a mixture of sand, fine
clay particles, water, and residual bitumen. When these tailings are sent to a pond, the large
sand particles fall out of suspension quickly, forming a beach, while the remaining fine
tailings settle to the bottom of the pond. Over a few years, these fine tailings will settle to a
30 wt% solid (86% by volume water), stable slurry structure called mature fine tails (MFT).
The MFTs will remain in this stable slurry for decades due to its slow consolidation rate
(Chalaturnyk et al., 2002).
2.2 Environmental Problems
MFTs are a growing problem, being produced at a rate of 0.25 m3/barrel of bitumen.
Current estimates place the volume of MFTs at ~650 000 000 m3 (based on 2.6 billion bbl
of bitumen mined s n 1968) (PTAC 2007). Th A b rt ov rnm nt st t d th t ―Tox ty
and the loss of bitumen and process water are among the most serious problems associated
with the build up of these y t n s.‖ (Kot y r t ., 1995).
2.2.1 Toxicity
A ord n to th r port ―11 M on L tr s D y: Th T r S nds’ L k n L y‖ from
the activist group Environmental Defence, with consultation from the Pembina Institute, 11
million litres of toxic process-affected water escape from tailings ponds each day. The
principal acute toxicant in the affected water is a group of polycyclic aromatic
hydrocarbons known as naphthenic acids (NAs). Process affected waters can contain 20-
120 mg/L naphthenic acid; these acids are the most toxic components to aquatic organisms
(Price 2008). Studies have explicitly stated the toxic effects of naphthenic acids on fish,
insect, and phytoplankton communities (Kelly et al., 2010). Although some process-
Page 17
16
affected waters are not acutely toxic to fish, there are documented sub lethal effects for fish
exposed to process-affected waters.
2.2.2 Water Consumption
Taking into account current water recycling practices, approximately three barrels of water
are used in the production of one barrel of bitumen. Process water is often trapped within
the MFTs or declines in water quality, due to scaling, fouling, increased corrosivity, or
interference with extraction chemistry. This can lead to bitumen recovery becoming
impossible with the existing water and fresh water must be used instead.
Many oil sands developments in north-eastern Alberta tap into the Athabasca River for
their fresh water requirements. It is thought that unless future water demand is reduced, the
o s nds d v opm nts ―w r qu r ~45 m3s
-1 of w t r supp y by 2020‖, n r y h f of th
Ath b s R v r’s f ow dur n th w nt r months (S h nd r & Don hu , 2006).
2.3 Reclamation of Tailings Ponds
Current bioremediation techniques used for tailing ponds reclamation require the alteration
of the site environment in ways that encourage manipulation and fast metabolism of the
microorganisms that can degrade/detoxify the environmental contaminants. These
techniques take one of two paths: dry and wet landscapes. (Yang 2009)
2.3.1 Dry Landscape Approach
Dry landscape approaches aim to reduce the water content of the fine tails, forming a solid
deposit which is capable of being reclaimed as a land surface or wetland. Current
techniques include reliance evaporation, freeze-thaw, and the addition of calcium sulphate
Page 18
17
to extraction tailings to form consolidated tailings. Dry landscape approaches typically fail
to deal with the NA contaminated water that may leech from the reclamation area. (FTFC
1995)
2.3.2 Wet Landscape Approach
Wet landscape approaches typically take one of two forms: water capping or constructed
wetlands.
The water capping technique was originally used in the mining industry to prevent oxygen
interaction with toxic mining tailings. When applied to oil sands developments, the tailings
are transferred into an abandoned, mined-out pit, over which a layer of water is placed to
establish a cap over the tailings base. Computer simulations have estimated that two years
must elapse before concentrations of NAs and other organic compounds in the surface
water will be reduced below levels acutely toxic to aquatic biota. Given that the end goal is
to r s th ―r m d‖ w t r b k nto th nv ronm nt, th re is a need for increased
efficiency and biodegradation rate of the NAs. (Quagraine et al., 2005)
Constructed wetlands, after many years of use in municipal settings, are gaining acceptance
for use in the petroleum industry because of their ability to treat a wide range of pollutants.
Although a feasibility report on the Suncor constructed wetlands in 1991 concluded that
they had the potential to be a suitable low-cost, passive, and self-sustaining treatment
approach, preliminary results in 1992-1993 indicated that a very long hydraulic retention
time would be required and future results would be negatively impacted by the environment
during the winter months. (Allen 2008)
Page 19
18
2.4 Primary Options for MFTs Treatment
Over the past two decades, a large volume of work has been carried out to find effective
methods to densify the MFTs, reducing their volume and water retention (Guo 2009). The
two major methods in current oil sands tailings practice are explained below.
2.4.1 Composite Tailings (CT)
Composite Tailings are a mixture of MFTs, tailings sand, and gypsum (Syncrude Canada
Ltd. 2010). The introduction of the sand particles into the MFTs applies an internal stress to
the structure, causing a significant increase in the densification rate of the tailings (FTFC
1995). Gypsum acts as a chemical coagulant, causing the dewatering rate of the MFTs to
rapidly increase.
Further, the addition of chemical additives in the CT process can increase the salinity,
corrosion potential, and affect bitumen recovery at the plant (Mackinnon et al., 2000).
2.4.2 Freeze-Thaw Dewatering of MFTs
Recognized for several decades, the dewatering of slurries originated with research into
segregated ice-soil structures occurring in natural permafrost soils (Mackay 1974). When
water-saturated, fine-grained slurries are subjected to sub-freezing temperatures, negative
pore pressures develop between ice and unfrozen liquid pore water, causing water to
migrate to growing ice crystals, ultimately resulting in segregated reticulate ice structures
(Dawson et al., 1999).
Laboratory tests suggest that Freeze-thaw is an effective method to accelerate the
dewatering rate of MFTs. It has been shown that freeze-thaw increased the solids content of
Page 20
19
MFTs from 35% to approximately 44-48% (FTFC 1995). Chemically pre-treating the
MFTs prior to freeze-thaw has been shown to significantly improve the dewatering rate of
the MFTs, with combined treatment processes increasing the solids content from 35% to
70% (FTFC 1995).
Despite of these beneficial outcomes, freeze-thaw is not necessarily feasible on an
industrial scale because of the large surface area required to treat the large volume of MFTs
accumulated to date (Guo 2009)
2.5 Microbial Activity in Oil Sands Tailings Ponds
In 1985, Foght et al. examined the microbial content of tailings samples from the Mildred
Lake Settling Basin (MLSB), the primary tailings pond for Syncrude Canada Ltd. Methane
production was observed in samples that were supplemented with acetate or glucose and
n ub t d t 37 C, however no meth n w s d t t d n th s mp s n ub t d t 15 C, the
native temperature of the tailings. Coincidentally, in 1999 the MLSB was producing 12 g
CH4 m-2
d-1
over 40-60% of the 12 km2 pond surface area. The microbial metabolism of the
resident hydrocarbons was causing a total daily emission of 108 L of greenhouse gases
(GHG) (Holowenko et al., 2000).
Despite the undesirable GHG production, microbial activities have been shown to be
beneficial by catalyzing hydrocarbon biodegradation (Quagraine et al., 2005) (Siddique et
al., 2007) and improving tailings densification (Fedorak et al., 2003).
With the densification of MFTs estimated to take 150 years (Eckert et al., 1996), research
suggesting that methanogenic MFTs experience an accelerated densification rate when
Page 21
20
compared with non-methanogenic MFTs (Fedorak et al., 2003) highlights the importance of
bacteria-based remediation techniques.
2.6 Biofilms
Bacterial biofilms are sessile colonies of synergetic microorganisms imbedded in self
generated extracellular polymeric substances (EPS), which contain chemically active
molecules including surfactants. The biofilm environment allows the expression of specific
phenotypes, which can be conditioned by the fluid environment. Hydrodynamic forces
have been shown to alter the structure of biofilms and consequently the response of bacteria
to environmental challenges, for example increasing the tolerance to antibiotics in higher
shear regions (Kostenko et al., 2010). Increased viscosity has been shown to reduce the
susceptibility of Staphylococcus aureus biofilms in two ways: (i) modified transport; and
(ii) stimulation of metabolic stress response resulting in increased EPS production and
tolerance (Kostenko et al., 2007).
Preliminary experiments have shown that using BioTiger, a multispecies consortium with
established bioremediation abilities, to treat oil sand tailings samples results in a 5-fold
increase in bitumen recovery over 24 hours when grown in biofilms and agitated as
compared to the traditional (planktonic) methods under similar flow conditions. (Kostenko
V. 2010)
These results suggest that the integration of biofilms into remediation technology will
reduce the energy requirements and environmental impact of oil sands developments.
Page 22
21
3.0 Overview of Chapters
With an overview of the significance and current state of bioremediation and how it
pertains to oil sands tailings detailed in Chapter 1 and 2, Chapter 4 introduces the
governing hypothesis of this research project.
Chapter 5 details the specific aims of this research project, expanding how the hypothesis
will be tested and explored.
Chapter 6 describes the materials and techniques used in the laboratory experiments.
Test results, including densification rates and bacteria colony counts, are presented in
Chapter 7, and discussed in Chapter 8.
Concluding remarks and suggestions for oil sands tailings bioremediation and future
research are presented in Chapter 9, with cited works appearing in Chapter 10.
4.0 Hypothesis
The hypothesis that is addressed in this paper is that the established bioremediation
capabilities of the BioTiger multispecies consortium can be adapted for the purpose of
increasing the rates of sedimentation experienced by MFTs.
5.0 Specific Aims
5.1 Evaluation of sedimentation capabilities of BioTiger bacteria
Conduct sedimentation experiments with different strains of BioTiger bacteria
Determine the effectiveness of each strain at 24 C nd 36 C incubation temperatures
Page 23
22
5.2 Evaluation of BioTiger bioremediation capability via alternative
parameters
Evaluate optical density of released water from samples treated with BioTiger
Determine the concentration of bituminous materials in released water
6.0 Materials and Methods
6.1 MFT Samples
The MFT samples used in this study were kindly provided by Shell Canada through an
informal agreement. All samples provided were stored in a sealed container at room
temperature.
6.2 Microbial Techniques
Two groups of bacteria were used for this experiment. The same bacteria preparation
technique was used for all procedures. Dr. Kostenko provided guidance regarding this
technique.
t r str ns w r r mov d from stor t 4 C and seeded in triplicate in individual
conical-bottomed tubes containing 20mL R2A media. Tubes were placed on a rocker at
room temperature and left to grow for 24 hours prior to experimentation.
Page 24
23
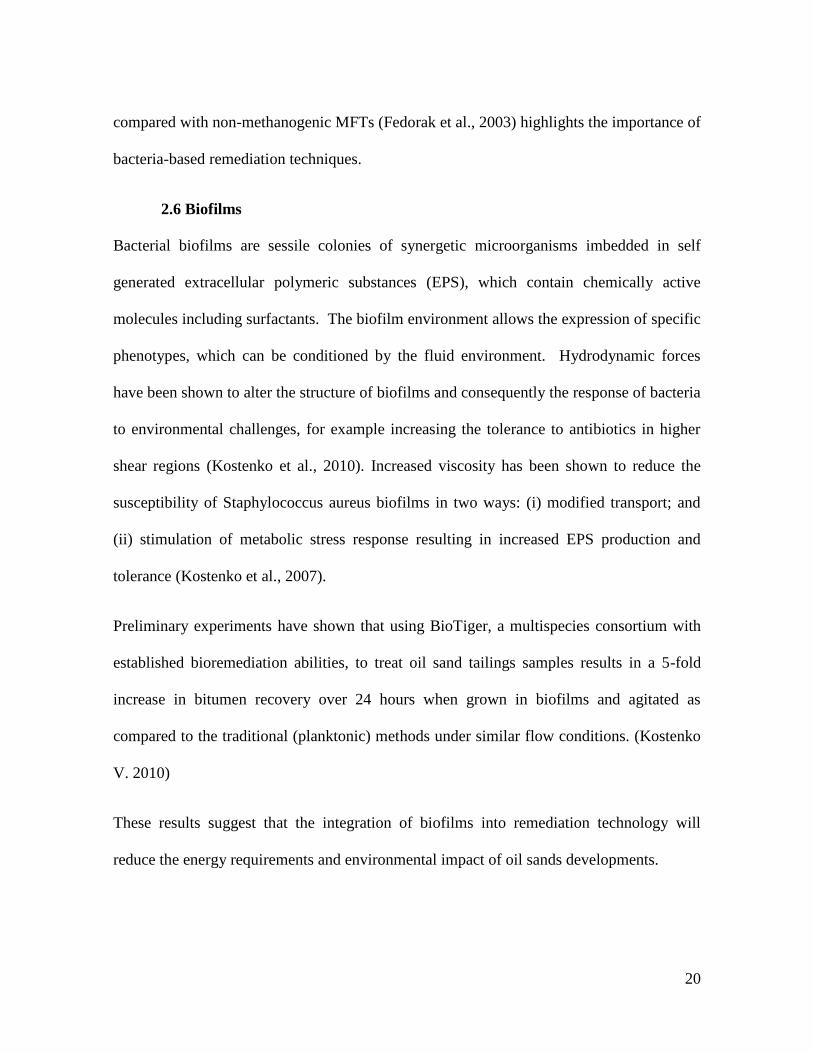
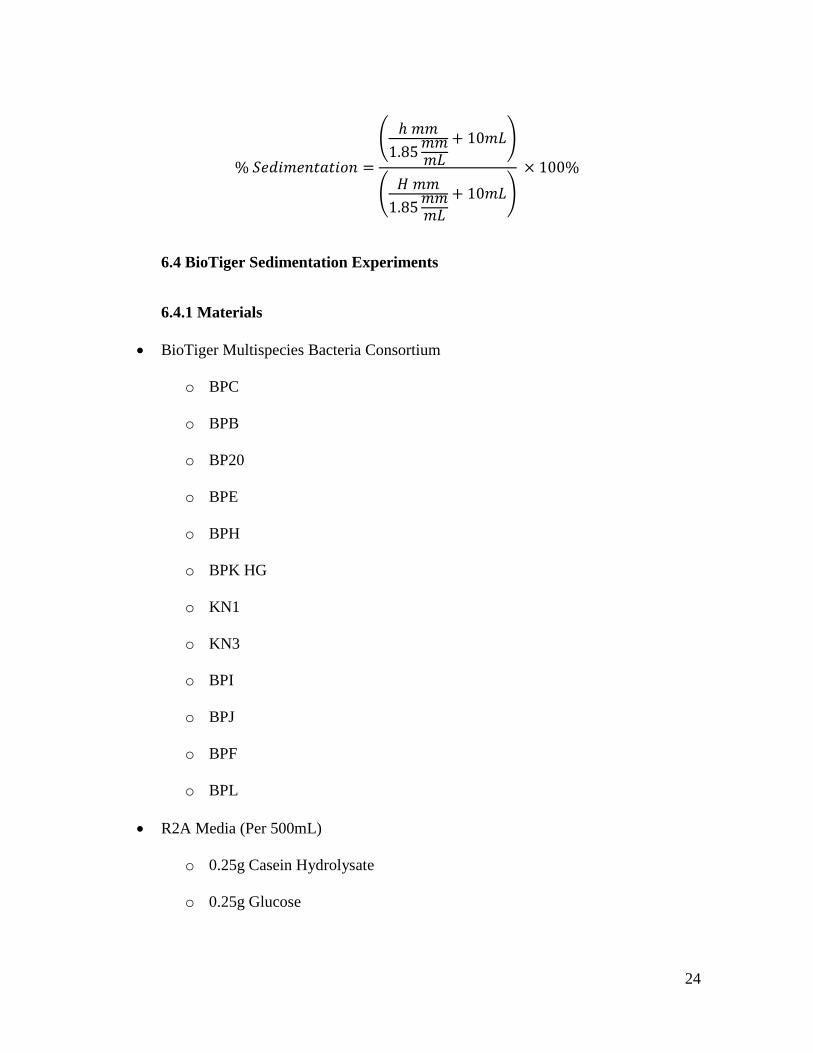
6.3 Sedimentation Measurements and Calculation
Figure 1: Two measurements were used to calculate the sedimentation of a sample. The first (H) was the distance
from the 10mL line on the tube to the free surface. The second (h) was the distance from the 10mL line on the tube
to the tailings/liquid interface.
Two measurements were taken for each sample with digital callipers, using the 10mL line
on the tube as a reference point.
The first measurement, H, was the distance from the 10mL line to the surface of the liquid.
The second measurement, h, was the distance from the 10mL line to the tailings/liquid
interface.
Sedimentation was calculated as a percentage of the total volume, with the two
measurements being converted from mm to mL, and compensated with the remaining
10mL of tube volume.
Page 25
24
6.4 BioTiger Sedimentation Experiments
6.4.1 Materials
BioTiger Multispecies Bacteria Consortium
o BPC
o BPB
o BP20
o BPE
o BPH
o BPK HG
o KN1
o KN3
o BPI
o BPJ
o BPF
o BPL
R2A Media (Per 500mL)
o 0.25g Casein Hydrolysate
o 0.25g Glucose
Page 26
25
o 0.25g Peptone
o 0.25g Yeast Extract
o 0.15g K2HPO4
o 0.025g MgSO4
o 0.25g NH4Cl
o 0.025g CaCl2
o 0.15g Sodium Pyruvate
o 0.25g Starch (Soluble)
o pH 7.0 +/- 0.2
o Autoclave Liquid 20 cycle
Oil Sands Tailings
Antibiotics
o 2-methyl-5-nitro-1-imidazoleethanol
o Chloramphenicol
o Spectinomycin dihydrochloride pentahydrate
50mL Conical-bottomed tubes - VWR
Measurement Callipers
25ml Pipettes
6.4.2 Methods – General
MFT stock was stirred with a wooden stick to ensure that the consistency of the tailings did
not change as a function of depth and to avoid changing the properties of the tailings over
the course of several experiments. It was established that the tailings were suitably mixed
Page 27
26
when one could pull tailings from the bottom of the pail and have them look the same as
those on top.
Three basic sets of tubes were prepared, from which the experimental controls and bacteria
samples would be made.
First, tubes treated with water were prepared by taking mixed MFT, adding 10% dH2O, and
mixing in a similar manner as described above. 20mL aliquots were placed in 50mL
centrifuge tubes and set aside for future use.
Second, tubes treated with media were prepared by taking mixed MFT, adding 10% 10X
R2A media, and mixing in a similar manner as described above. 20mL aliquots were placed
in 50mL centrifuge tubes and set aside for future use.
Third, tubes with plain tailings were prepared by placing 20mL aliquots of mixed MFT into
50mL centrifuge tubes.
6.4.3 Methods – 10 Day Experiments
These experiments took the tube types described in Section 6.4.2 and modified them to
accurately reflect the controls and samples required for this procedure.
The controls required for this type of experiment were titled Water Control – Mix, Water
Control – Cap, Media Control – Mix, and Media Control – Cap.
Water controls were prepared by taking 20mL aliquots of MFT + 10% dH2O and either
capping with 10ml dH2O to form the Water Control – Cap, or adding 10mL dH2O and
stirring until fully mixed to form the Water Control – Mix.
Page 28
27
Media controls were prepared by taking 20mL aliquots of MFT + 10% 10X R2A media and
either capping with 10ml 1X R2A media to form the Media Control – Cap, or adding 10mL
1X R2A media and stirring until fully mixed to form the Media Control – Mix.
Test samples were prepared by taking the bacteria strains described in Section 6.2 and
listed in Section 6.4.1, adding 1mL 10X R2A media to each tube, then mixing completely.
10ml of each bacteria suspension was added to 20mL aliquots of MFT + 10% 10X R2A
media, and either mixed to form samples labelled BacteriaName – Mix, or capped to form
samples labelled BacteriaName – Cap.
S mp s ts w r th n stor d t th r room t mp r tur (24 C) or n ub t d t36 C.
Measurements, as described in Section 6.3 were taken at 2hours to establish a baseline, and
then every 24 hours for 10 days.
Once 10 days had elapsed, samples were centrifuged for 5 minutes at 1g, 5g, 10g, 25g, 50g,
100g, 250g, 500g, and 1000g. Measurements as described in Section 6.3 were taken in
between each segment of centrifugation.
6.4.4 Methods – 3 Day Experiments
These experiments took the tube types described in 6.4.2 and modified them to accurately
reflect the controls and samples required for this procedure.
The controls required for this type of experiment were titled Water Control – Mix +/-
Antibiotics, Water Control – Cap +/- Antibiotics, Media Control – Mix +/- Antibiotics, and
Media Control – Cap +/- Antibiotics.
Page 29
28
The antibiotics used for this experiment were 2-methyl-5-nitro-1-imidazoleethanol,
chloramphenicol, and spectinomycin dihydrochloride pentahydrate, all at a concentration of
1000 μ /mL n so ut on of dH2O.
Water controls were prepared by taking 20mL aliquots of MFT + 10% dH2O and either
capping with 10ml dH2O to form the Water Control – Cap, capping with 10mL of the
antibiotics preparation to form the Water Control – Cap + Antibiotics, adding 10mL dH2O
and stirring until fully mixed to form the Water Control – Mix, or adding 10mL of the
antibiotics preparation and stirring until fully mixed to form the Water Control – Mix
+Antibiotics.
Media controls were prepared by taking 20mL aliquots of MFT + 10% 10X R2A media and
either capping with 10ml 1X R2A media to form the Media Control – Cap, capping with
10ml of the antibiotics preparation to form the Media Control – Cap + Antibiotics, adding
10mL 1X R2A media and stirring until fully mixed to form the Media Control – Mix, or
adding 10mL of the antibiotics preparation and stirring until fully mixed to form the Media
Control – Mix + Antibiotics.
An additional control, Plain Tailings, was used for this experiment. It was prepared by
taking the stirred MFT and placing 20mL into 50mL tubes.
S mp s ts w r th n stor d t th r room t mp r tur (24 C) or n ub t d t36 C.
Measurements, as described in Section 6.3 were taken at 2 hours to establish a baseline, and
then every 24 hours for 3 days.
Page 30
29
Once 3 days had elapsed, samples were centrifuged for 5 minutes at 100RCF, 500RCF,
1000RCF, 2000RCF, and 3000RCF. Measurements as described in Section 6.3 were taken
in between each segment of centrifugation.
6.4.5 Methods – 4 Hour Experiments
These experiments took the tube types described in Section 6.4.2 and modified them to
accurately reflect the controls and samples required for this procedure.
The controls required for this type of experiment were titled Water Control – Mix, Media
Control – Mix, and Plain tailings.
Water controls were prepared by taking 20mL aliquots of MFT + 10% dH2O, adding 10mL
dH2O and stirring until fully mixed to form the Water Control – Mix.
Media controls were prepared by taking 20mL aliquots of MFT + 10% 10X R2A media,
adding 10mL 1X R2A media and stirring until fully mixed to form the Media Control –
Mix.
Plain tailings controls were prepared by taking 20mL of the mixed MFT and placing in into
50mL tubes.
Sample sets were then stor d t th r room t mp r tur (24 C) or n ub t d t36 C.
Measurements, as described in Section 6.3 were taken at 0 hours to establish a baseline, and
then at 4 hours.
Page 31
30
Once 4 hours had elapsed, samples were centrifuged for 5 minutes at 100RCF, 500RCF,
1000RCF, 2000RCF, and 3000RCF. Measurements as described in Section 6.3 were taken
in between each segment of centrifugation.
6.4.6 Methods – Optical Density Analysis
Samples, as described in Section 6.4.3, that remained after the course of the experiment
were mixed for 10 seconds on a vortex machine to resuspend any material that may have
f n out of so ut on dur n stor t 4 C. Th y w r ow d to s t for 48 hours t 4 C.
200 μL of liquid was taken in triplicate from each sample tube, for a total of 9 samples per
species of BioTiger bacteria, and were placed into individual wells of a 96-well plate.
A UV-Vis spectrometer was used to analyze the optical density of the wells at a wavelength
of 590 nm.
Statistical analysis consisted of unpaired, two sample t-Tests assuming unequal variances,
with significance set at p<0.05, performed using Microsoft Excel 2007.
6.4.7 Methods – Full Spectrum Absorbance Analysis
Samples, as described in Section 6.4.3 and previously tested as described in Section 6.4.6,
w r r mov d from 4 C storage and 1.5 mL aliquots in triplicate were taken from each
sample tube, for a total of 9 samples per species of BioTiger, and placed into individual
2.0 mL Eppendorf tubes.
The Eppendorf tubes were centrifuged at 7000 RPM for 5 minutes to remove all biological
matter that may affect absorbance analysis.
Page 32
31
200 μL of liquid was taken from each Eppendorf tube and placed into individual wells of a
96 well plate.
Plates were scanned using a UV-Vis spectrometer at wavelengths ranging from
200-1000 nm in steps of 10 nm.
6.5 Shell Tailings Experiments
6.5.1 Materials
Bacteria Strains isolated from Shell Tailings
o ST1
o ST2
o ST3
o ST4
o ST6
o ST7
o ST8
o ST9
o ST10
o ST11
o ST12
R2A Media (Per 500mL)
o As prepared in Section 6.4.1
Oil Sands Tailings
Page 33
32
50mL Conical-bottomed tubes - VWR
Measurement Callipers
25ml Pipettes
6.5.2 Methods
These experiments took the tube types described in Section 6.4.2 and modified them to
accurately reflect the controls and samples required for this procedure.
The controls required for this type of experiment were titled Water Control – Mix, Water
Control – Cap, Media Control – Mix, and Media Control – Cap.
Water controls were prepared by taking 20mL aliquots of MFT + 10% dH2O and either
capping with 10ml dH2O to form the Water Control – Cap, or adding 10mL dH2O and
stirring until fully mixed to form the Water Control – Mix.
Media controls were prepared by taking 20mL aliquots of MFT + 10% 10X R2A media and
either capping with 10ml 1X R2A media to form the Media Control – Cap, or adding 10mL
1X R2A media and stirring until fully mixed to form the Media Control – Mix.
Test samples were prepared by taking the bacteria strains described in Section 6.2 and
listed in Section 6.5.1, adding 1mL 10X R2A media to each tube, then mixing completely.
10ml of each bacteria suspension was added to 20mL aliquots of MFT + 10% 10X R2A
media, and either mixed to form samples labelled BacteriaName – Mix, or capped to form
samples labelled BacteriaName – Cap.
Sample sets were then stored at room temperatur (24 C).
Page 34
33
Measurements, as described in Section 6.3 were taken at 2hours to establish a baseline, and
then every 24 hours for 10 days.
Once 10 days had elapsed, samples were centrifuged for 5 minutes at 100RCF, 500RCF,
1000RCF, 2000RCF, and 3000RCF. Measurements as described in section 6.3 were taken
in between each batch of centrifugation.
7.0 Results
Unless otherwise indicated, graphed data displays the sedimentation of the tailings as a
function of time and centrifugal forces. Sedimentation has been established as the percent
ratio between the solid height of the tailings (h) and the total or clear liquid height of the
mixture (H). A lower percentage implies more sedimentation has occurred. Data is
expressed as the mean +/- SD.
Experiments are listed chronologically to facilitate discussion in later sections.
Page 35
34
7.1 BioTiger Sedimentation Experiments
7.1.1 10 Day Sedimentation + Centrifugation Experiment
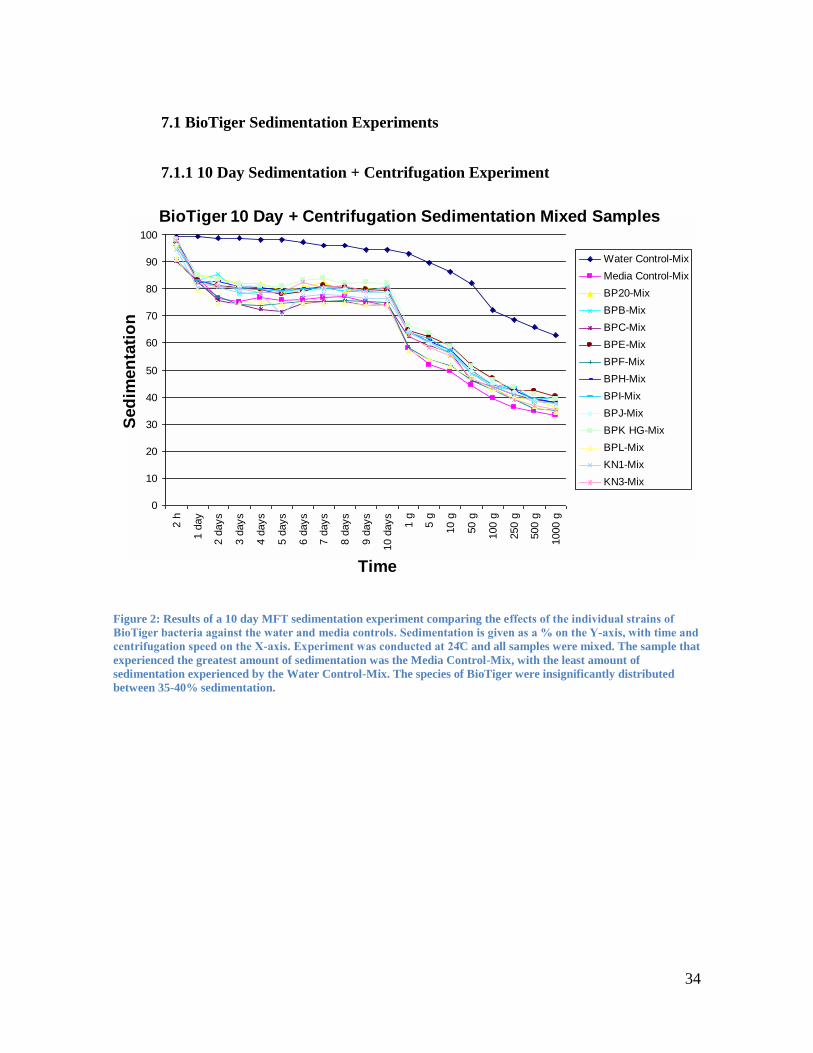
Figure 2: Results of a 10 day MFT sedimentation experiment comparing the e
-
- C and all samples were mixed. The sample that
experienced the greatest amount of sedimentation was the Media Control-Mix, with the least amount of
sedimentation experienced by the Water Control-Mix. The species of BioTiger were insignificantly distributed
between 35-40% sedimentation.
0
10
20
30
40
50
60
70
80
90
100
2 h
1 d
ay
2 d
ays
3 d
ays
4 d
ays
5 d
ays
6 d
ays
7 d
ays
8 d
ays
9 d
ays
10 d
ays
1 g
5 g
10 g
50 g
100 g
250 g
500 g
1000 g
Water Control-Mix
Media Control-Mix
BP20-Mix
BPB-Mix
BPC-Mix
BPE-Mix
BPF-Mix
BPH-Mix
BPI-Mix
BPJ-Mix
BPK HG-Mix
BPL-Mix
KN1-Mix
KN3-Mix
Sed
imen
tati
on
Time
BioTiger 10 Day + Centrifugation Sedimentation Mixed Samples
Page 36
35
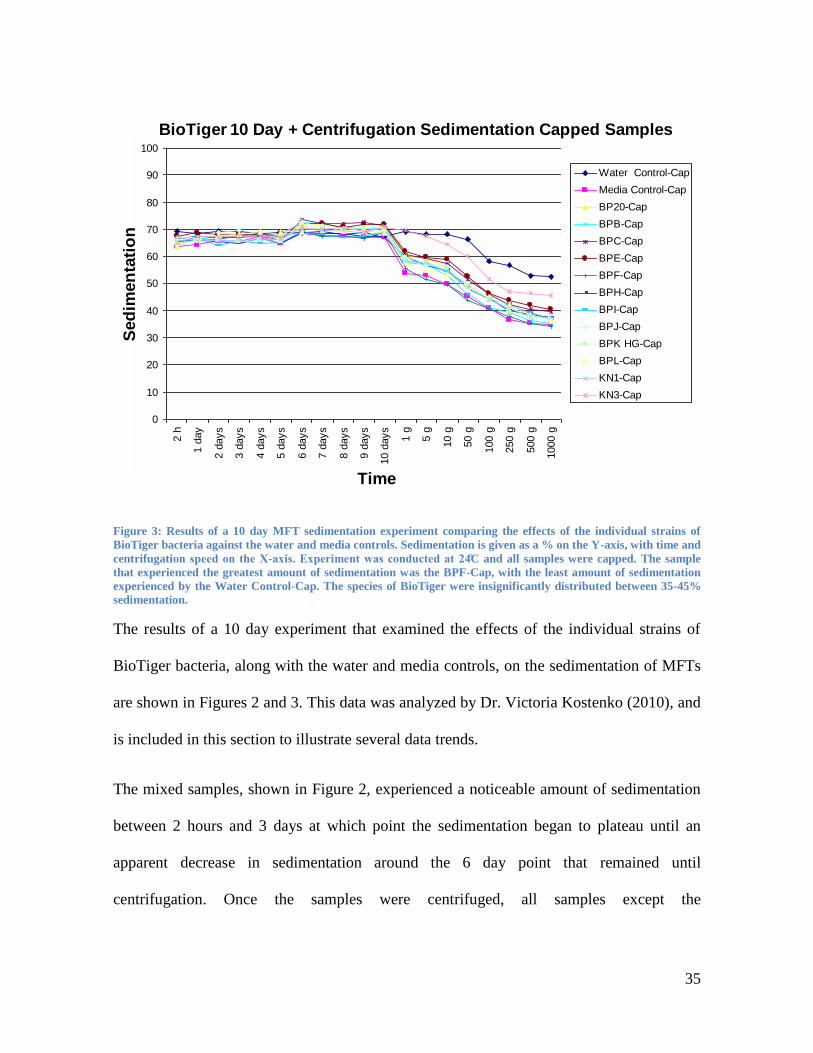
Figure 3: Results of a 10 day MFT sedimentation experiment comparing the effects of the individual strains of
BioTiger bacteria against the water and media controls. Sedimentation is given as a % on the Y-axis, with time and
centrifugati - C and all samples were capped. The sample
that experienced the greatest amount of sedimentation was the BPF-Cap, with the least amount of sedimentation
experienced by the Water Control-Cap. The species of BioTiger were insignificantly distributed between 35-45%
sedimentation.
The results of a 10 day experiment that examined the effects of the individual strains of
BioTiger bacteria, along with the water and media controls, on the sedimentation of MFTs
are shown in Figures 2 and 3. This data was analyzed by Dr. Victoria Kostenko (2010), and
is included in this section to illustrate several data trends.
The mixed samples, shown in Figure 2, experienced a noticeable amount of sedimentation
between 2 hours and 3 days at which point the sedimentation began to plateau until an
apparent decrease in sedimentation around the 6 day point that remained until
centrifugation. Once the samples were centrifuged, all samples except the
0
10
20
30
40
50
60
70
80
90
100
2 h
1 d
ay
2 d
ays
3 d
ays
4 d
ays
5 d
ays
6 d
ays
7 d
ays
8 d
ays
9 d
ays
10 d
ays
1 g
5 g
10 g
50 g
100 g
250 g
500 g
1000 g
Water Control-Cap
Media Control-Cap
BP20-Cap
BPB-Cap
BPC-Cap
BPE-Cap
BPF-Cap
BPH-Cap
BPI-Cap
BPJ-Cap
BPK HG-Cap
BPL-Cap
KN1-Cap
KN3-Cap
Sed
imen
tati
on
Time
BioTiger 10 Day + Centrifugation Sedimentation Capped Samples
Page 37
36
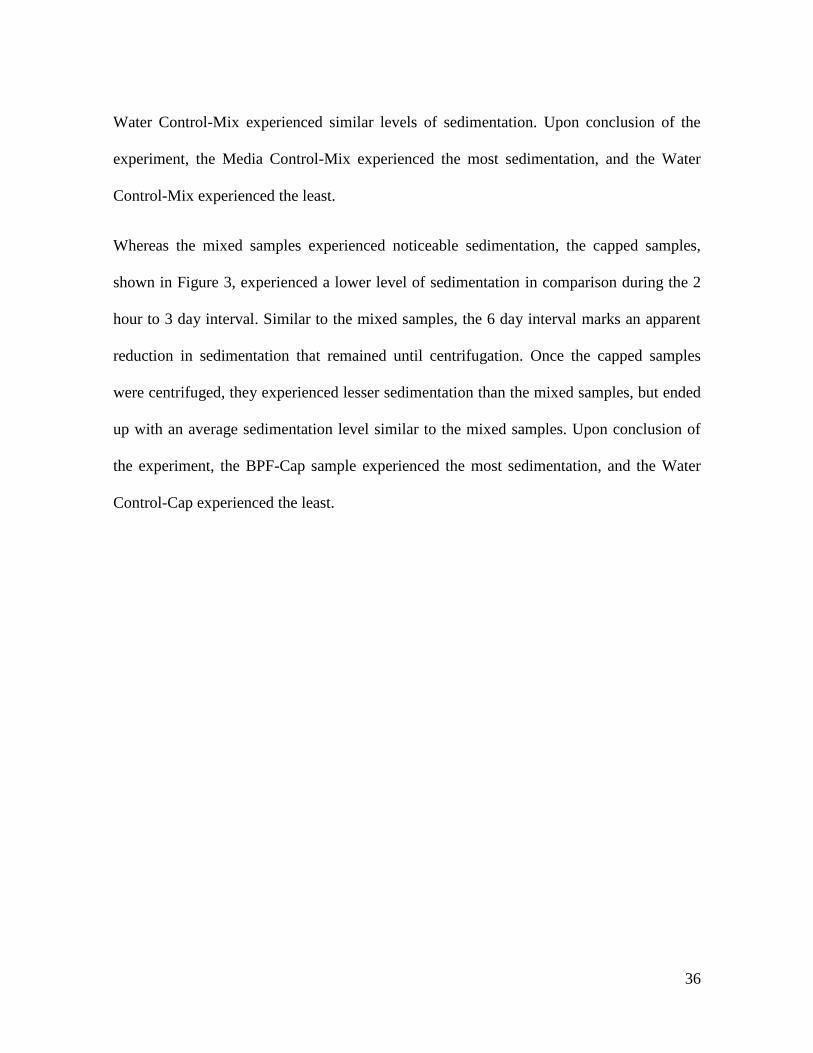
Water Control-Mix experienced similar levels of sedimentation. Upon conclusion of the
experiment, the Media Control-Mix experienced the most sedimentation, and the Water
Control-Mix experienced the least.
Whereas the mixed samples experienced noticeable sedimentation, the capped samples,
shown in Figure 3, experienced a lower level of sedimentation in comparison during the 2
hour to 3 day interval. Similar to the mixed samples, the 6 day interval marks an apparent
reduction in sedimentation that remained until centrifugation. Once the capped samples
were centrifuged, they experienced lesser sedimentation than the mixed samples, but ended
up with an average sedimentation level similar to the mixed samples. Upon conclusion of
the experiment, the BPF-Cap sample experienced the most sedimentation, and the Water
Control-Cap experienced the least.
Page 38
37
7.1.2 4 Hour + 3 Day Control Sedimentation +/- Antibiotics Experiment
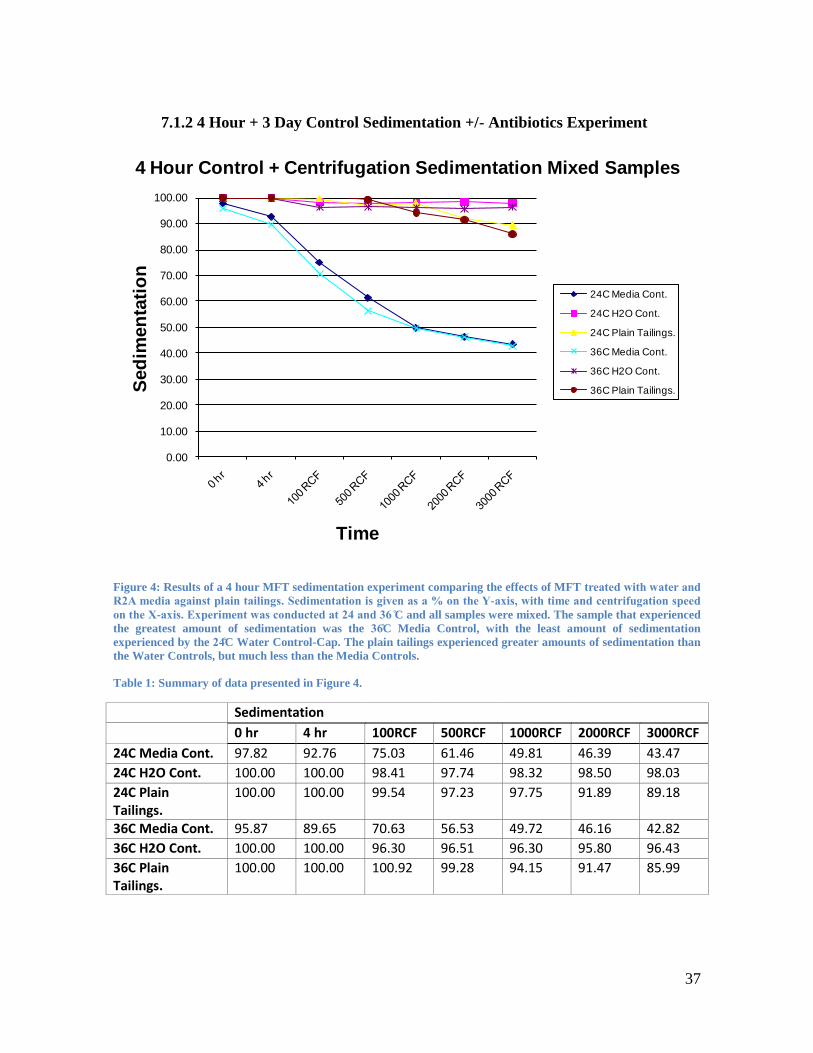
Figure 4: Results of a 4 hour MFT sedimentation experiment comparing the effects of MFT
-
- C and all samples were mixed. The sample that experienced
the greatest amount of sedimentation was the C Media Control, with the least amount of sedimentation
experienced by the C Water Control-Cap. The plain tailings experienced greater amounts of sedimentation than
the Water Controls, but much less than the Media Controls.
Table 1: Summary of data presented in Figure 4.
Sedimentation
0 hr 4 hr 100RCF 500RCF 1000RCF 2000RCF 3000RCF
24C Media Cont. 97.82 92.76 75.03 61.46 49.81 46.39 43.47 24C H2O Cont. 100.00 100.00 98.41 97.74 98.32 98.50 98.03 24C Plain Tailings.
100.00 100.00 99.54 97.23 97.75 91.89 89.18
36C Media Cont. 95.87 89.65 70.63 56.53 49.72 46.16 42.82 36C H2O Cont. 100.00 100.00 96.30 96.51 96.30 95.80 96.43 36C Plain Tailings.
100.00 100.00 100.92 99.28 94.15 91.47 85.99
0.00
10.00
20.00
30.00
40.00
50.00
60.00
70.00
80.00
90.00
100.00
24C Media Cont.
24C H2O Cont.
24C Plain Tailings.
36C Media Cont.
36C H2O Cont.
36C Plain Tailings.Sed
imen
tati
on
Time
4 Hour Control + Centrifugation Sedimentation Mixed Samples
Page 39
38
The results of a 4 hour experiment that examined the sedimentation effects of MFTs treated
with R2A media and dH2O, against plain MFTs, is shown in Figure 4 and summarized in
Table 1. Th xp r m nt w s ondu t d t 24 nd 36 C and all samples were mixed.
Both temperatures of the Media Control-Mix samples experienced the greatest level of
sedimentation, whereas the plain tailings experienced a limited amount, and the Water
Control-Mix experienced the least. The change in temperature does not appear to have
influenced sedimentation.
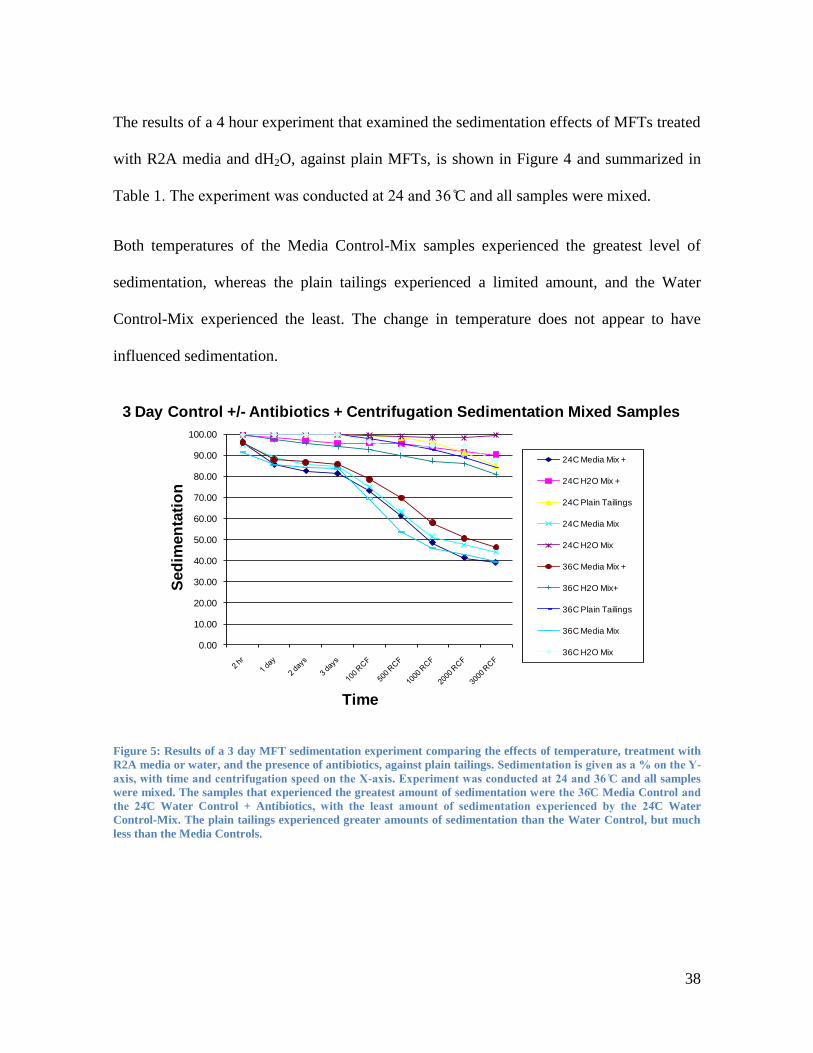
Figure 5: Results of a 3 day MFT sedimentation experiment comparing the effects of temperature, treatment with
R2A media or water, and the presence of antibiotics, against plain tailings. Se -
- C and all samples
were mixed. The samples that experienced the greatest amount of sedimentation were C Media Control
C Water Control + Antibiotics C Water
Control-Mix. The plain tailings experienced greater amounts of sedimentation than the Water Control, but much
less than the Media Controls.
0.00
10.00
20.00
30.00
40.00
50.00
60.00
70.00
80.00
90.00
100.00
24C Media Mix +
24C H2O Mix +
24C Plain Tailings
24C Media Mix
24C H2O Mix
36C Media Mix +
36C H2O Mix+
36C Plain Tailings
36C Media Mix
36C H2O Mix
Sed
imen
tati
on
Time
3 Day Control +/- Antibiotics + Centrifugation Sedimentation Mixed Samples
Page 40
39
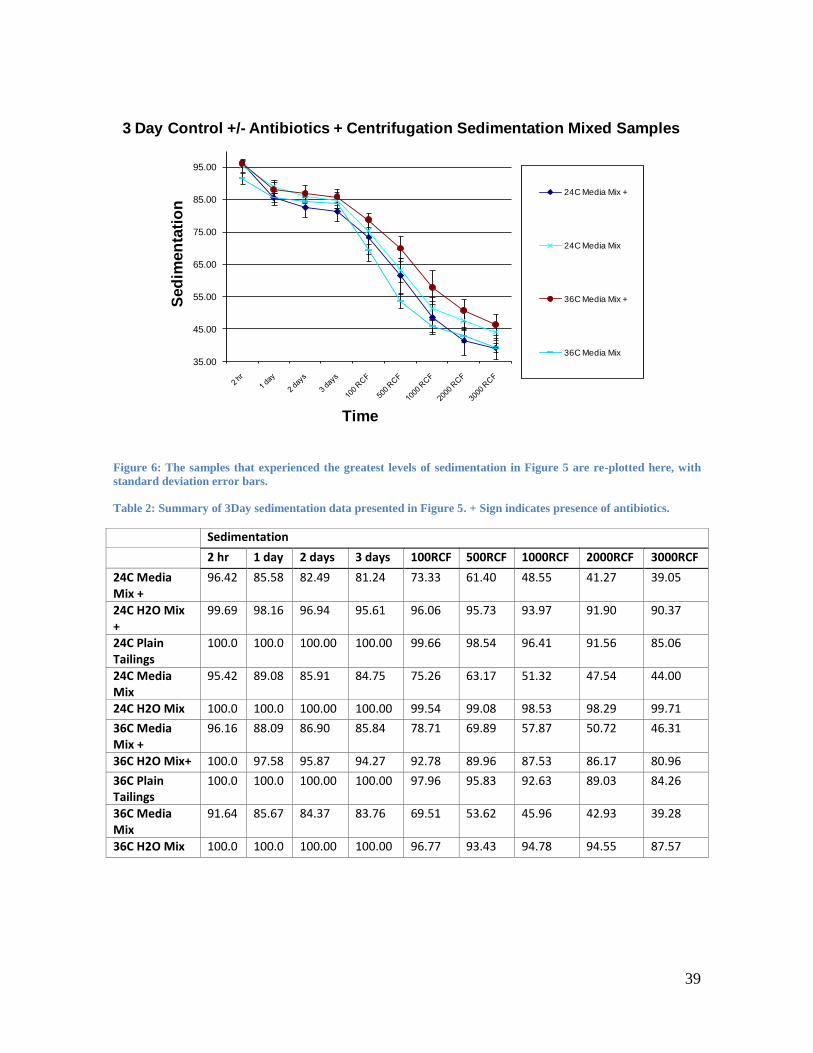
Figure 6: The samples that experienced the greatest levels of sedimentation in Figure 5 are re-plotted here, with
standard deviation error bars.
Table 2: Summary of 3Day sedimentation data presented in Figure 5. + Sign indicates presence of antibiotics.
Sedimentation
2 hr 1 day 2 days 3 days 100RCF 500RCF 1000RCF 2000RCF 3000RCF
24C Media Mix +
96.42 85.58 82.49 81.24 73.33 61.40 48.55 41.27 39.05
24C H2O Mix +
99.69 98.16 96.94 95.61 96.06 95.73 93.97 91.90 90.37
24C Plain Tailings
100.0 100.0 100.00 100.00 99.66 98.54 96.41 91.56 85.06
24C Media Mix
95.42 89.08 85.91 84.75 75.26 63.17 51.32 47.54 44.00
24C H2O Mix 100.0 100.0 100.00 100.00 99.54 99.08 98.53 98.29 99.71
36C Media Mix +
96.16 88.09 86.90 85.84 78.71 69.89 57.87 50.72 46.31
36C H2O Mix+ 100.0 97.58 95.87 94.27 92.78 89.96 87.53 86.17 80.96
36C Plain Tailings
100.0 100.0 100.00 100.00 97.96 95.83 92.63 89.03 84.26
36C Media Mix
91.64 85.67 84.37 83.76 69.51 53.62 45.96 42.93 39.28
36C H2O Mix 100.0 100.0 100.00 100.00 96.77 93.43 94.78 94.55 87.57
35.00
45.00
55.00
65.00
75.00
85.00
95.00
24C Media Mix +
24C Media Mix
36C Media Mix +
36C Media Mix
Sed
imen
tati
on
Time
3 Day Control +/- Antibiotics + Centrifugation Sedimentation Mixed Samples
Page 41
40
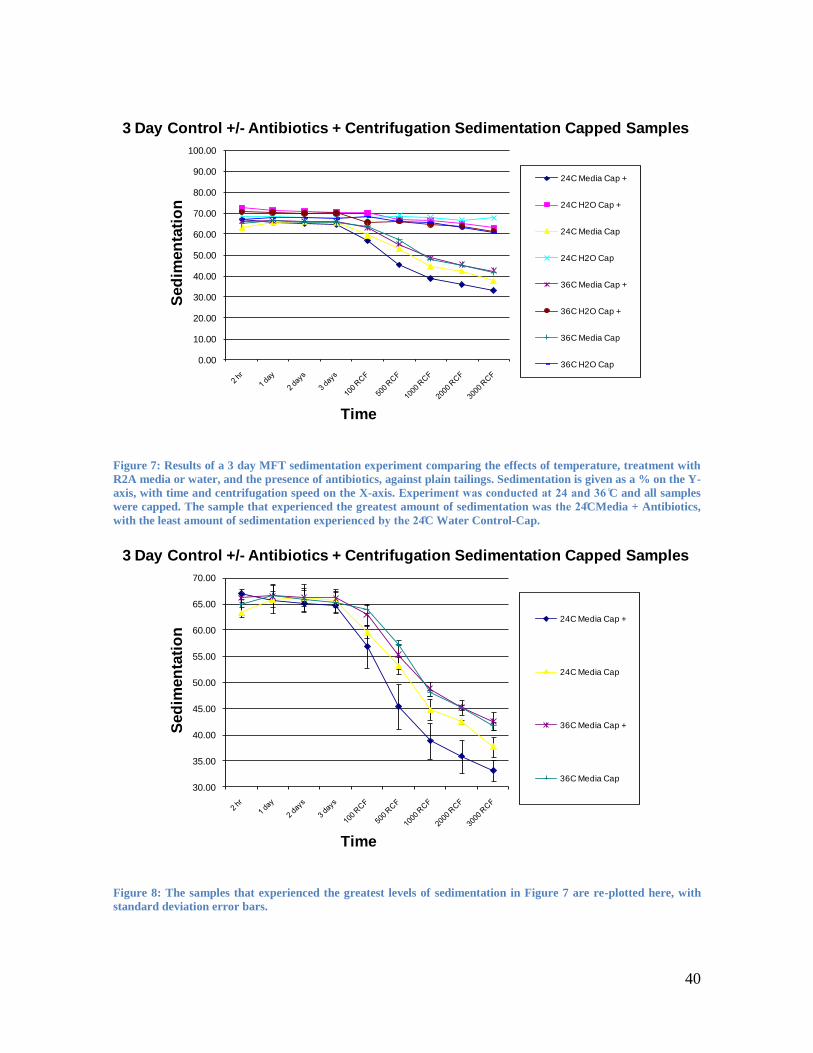
Figure 7: Results of a 3 day MFT sedimentation experiment comparing the effects of temperature, treatment with
R2A media or water, and the presence of antibiotics, against plain tailings. Sedimentation is given as a % on the Y-
axis, with time and centrifugation speed on the X-axis. Experi C and all samples
were capped. The sample that experienced the greatest amount of sedimentation was CMedia + Antibiotics,
with the least amount of sedimentation experienc C Water Control-Cap.
Figure 8: The samples that experienced the greatest levels of sedimentation in Figure 7 are re-plotted here, with
standard deviation error bars.
0.00
10.00
20.00
30.00
40.00
50.00
60.00
70.00
80.00
90.00
100.00
24C Media Cap +
24C H2O Cap +
24C Media Cap
24C H2O Cap
36C Media Cap +
36C H2O Cap +
36C Media Cap
36C H2O Cap
Sed
imen
tati
on
Time
3 Day Control +/- Antibiotics + Centrifugation Sedimentation Capped Samples
30.00
35.00
40.00
45.00
50.00
55.00
60.00
65.00
70.00
24C Media Cap +
24C Media Cap
36C Media Cap +
36C Media Cap
Sed
imen
tati
on
Time
3 Day Control +/- Antibiotics + Centrifugation Sedimentation Capped Samples
Page 42
41
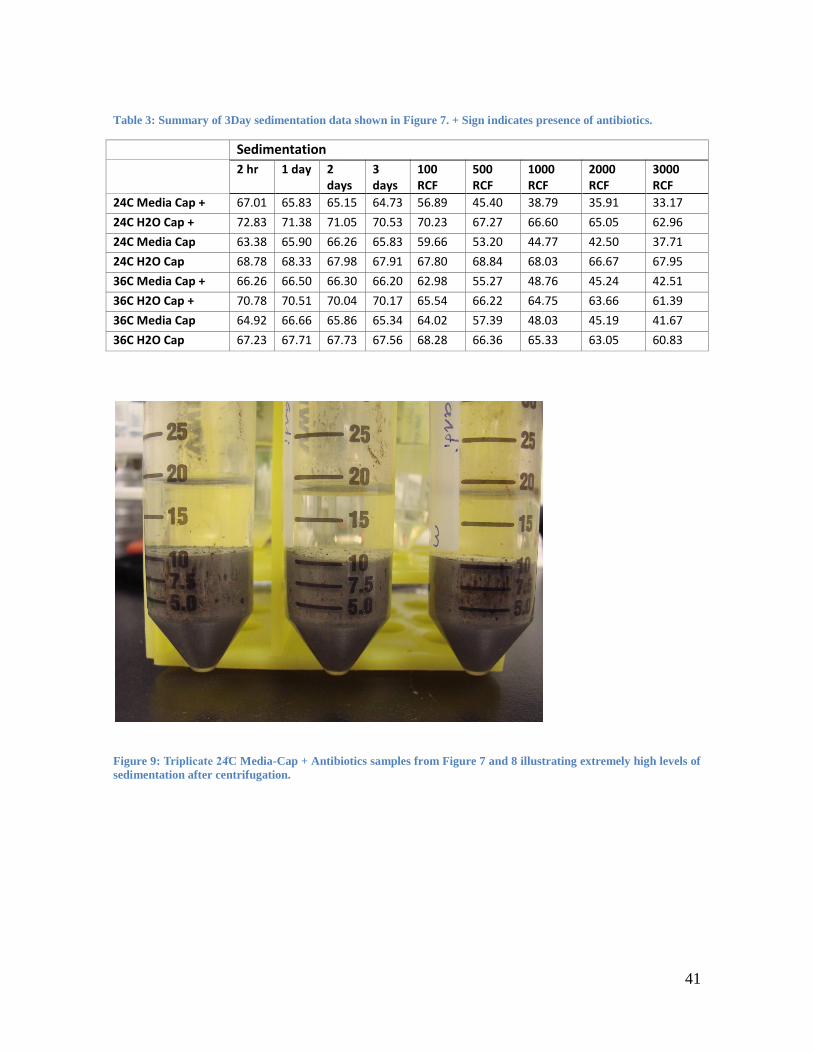
Table 3: Summary of 3Day sedimentation data shown in Figure 7. + Sign indicates presence of antibiotics.
Sedimentation 2 hr 1 day 2
days 3 days
100 RCF
500 RCF
1000 RCF
2000 RCF
3000 RCF
24C Media Cap + 67.01 65.83 65.15 64.73 56.89 45.40 38.79 35.91 33.17
24C H2O Cap + 72.83 71.38 71.05 70.53 70.23 67.27 66.60 65.05 62.96
24C Media Cap 63.38 65.90 66.26 65.83 59.66 53.20 44.77 42.50 37.71
24C H2O Cap 68.78 68.33 67.98 67.91 67.80 68.84 68.03 66.67 67.95
36C Media Cap + 66.26 66.50 66.30 66.20 62.98 55.27 48.76 45.24 42.51
36C H2O Cap + 70.78 70.51 70.04 70.17 65.54 66.22 64.75 63.66 61.39
36C Media Cap 64.92 66.66 65.86 65.34 64.02 57.39 48.03 45.19 41.67
36C H2O Cap 67.23 67.71 67.73 67.56 68.28 66.36 65.33 63.05 60.83
Figure 9 C Media-Cap + Antibiotics samples from Figure 7 and 8 illustrating extremely high levels of
sedimentation after centrifugation.
Page 43
42
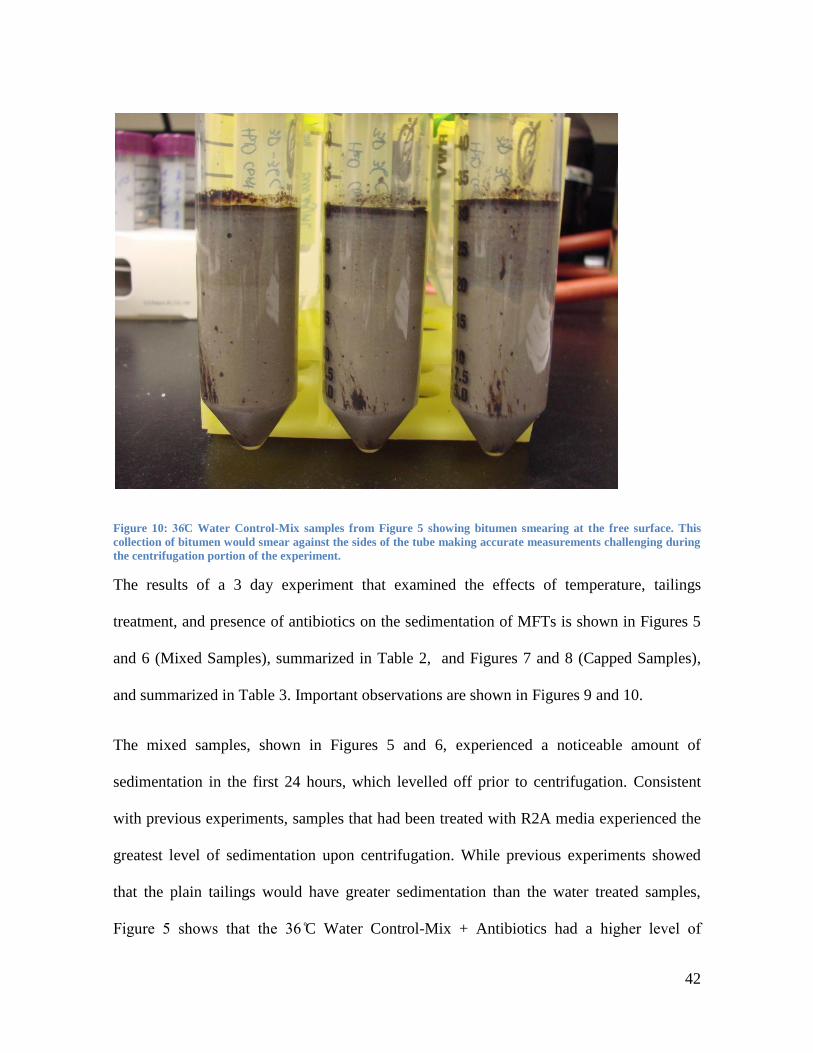
Figure 10 C Water Control-Mix samples from Figure 5 showing bitumen smearing at the free surface. This
collection of bitumen would smear against the sides of the tube making accurate measurements challenging during
the centrifugation portion of the experiment.
The results of a 3 day experiment that examined the effects of temperature, tailings
treatment, and presence of antibiotics on the sedimentation of MFTs is shown in Figures 5
and 6 (Mixed Samples), summarized in Table 2, and Figures 7 and 8 (Capped Samples),
and summarized in Table 3. Important observations are shown in Figures 9 and 10.
The mixed samples, shown in Figures 5 and 6, experienced a noticeable amount of
sedimentation in the first 24 hours, which levelled off prior to centrifugation. Consistent
with previous experiments, samples that had been treated with R2A media experienced the
greatest level of sedimentation upon centrifugation. While previous experiments showed
that the plain tailings would have greater sedimentation than the water treated samples,
F ur 5 shows th t th 36 C Water Control-Mix + Antibiotics had a h h r v of
Page 44
43
sedimentation than the plain tailings samples at both temperatures. The remaining Water
Contro s mp s xp r n d s m r v s of s d m nt t on, w th th x pt on of th 24 C
Water Control-Mix sample, which had an apparent reduction in sedimentation. This
accuracy issue is illustrated in Figure 9, and is attributed to bitumen smearing at the free
surface. The bitumen would smear against the sides of the tube during centrifugation and
obscure the interface needed for an accurate measurement.
Figure 6 highlights an important observation. In previous experiments, samples incubated
t th mor m t bo y t v t mp r tur of 36 C xp r n d h h r v s of
s d m nt t on th n thos k pt t 24 C. Figure 6 shows th t M d Contro s mp tr t d
w th nt b ot s nd k pt t 24 C had th s m v of s d m nt t on s s mp k pt t
36 C without antibiotics. Additionally, th s mp k pt t 36 C with antibiotics experienced
less sedimentation than s mp k pt t 24 C without antibiotics. These differences are
seemingly insignificant and merely suggest a trend.
The capped samples, shown in Figures 7 and 8, did not experience any sedimentation prior
to centrifugation at the 3 day point. Upon centrifugation, samples treated with R2A media
experienced more sedimentation than samples treated with dH2O. The greatest amount of
sedimentation was experienced by the 24 C Media-Cap + Antibiotics sample; th st
mount of s d m nt t on w s xp r n d by th 24 C Water-Cap sample.
F ur 8 nd t s th t s mp s k pt t 24 C xp r n d mor s d m nt t on th n s mp s
k pt t th mor m t bo y t v 36 C.
Page 45
44
7.2 Shell Tailings Experiments
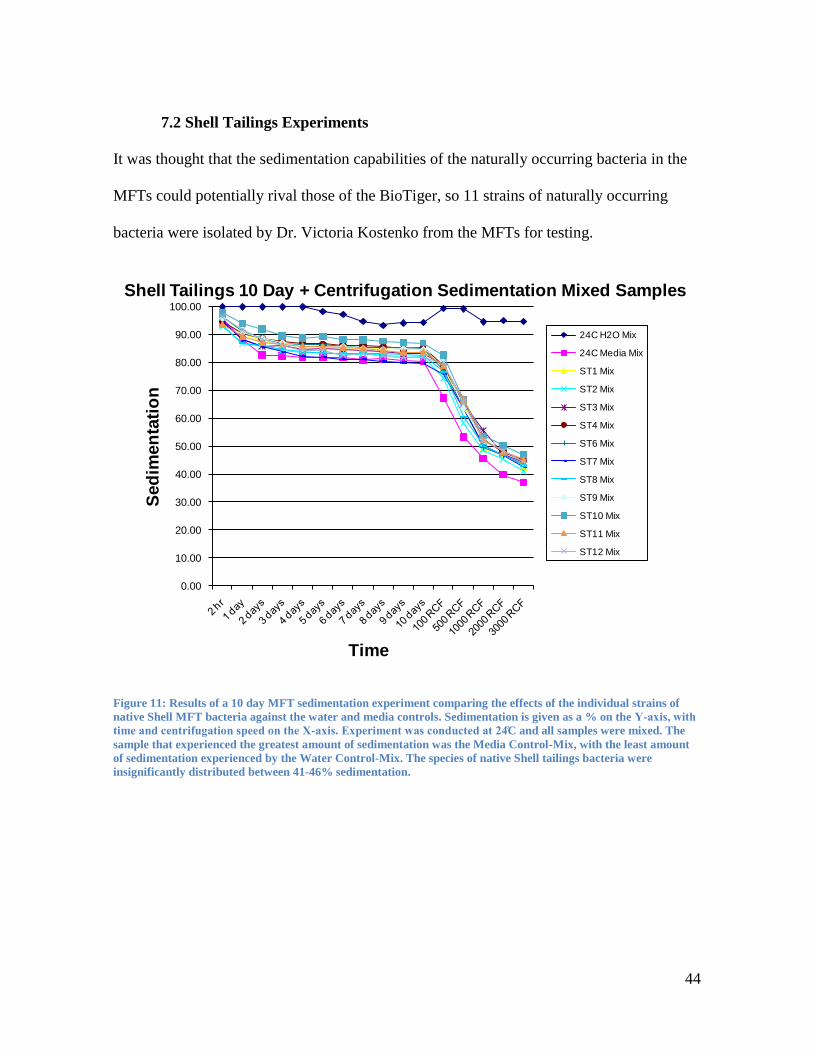
It was thought that the sedimentation capabilities of the naturally occurring bacteria in the
MFTs could potentially rival those of the BioTiger, so 11 strains of naturally occurring
bacteria were isolated by Dr. Victoria Kostenko from the MFTs for testing.
Figure 11: Results of a 10 day MFT sedimentation experiment comparing the effects of the individual strains of
native Shell MFT bacteria against the water and media controls. Sedimentation is given as a % on the -
- C and all samples were mixed. The
sample that experienced the greatest amount of sedimentation was the Media Control-Mix, with the least amount
of sedimentation experienced by the Water Control-Mix. The species of native Shell tailings bacteria were
insignificantly distributed between 41-46% sedimentation.
0.00
10.00
20.00
30.00
40.00
50.00
60.00
70.00
80.00
90.00
100.00
24C H2O Mix
24C Media Mix
ST1 Mix
ST2 Mix
ST3 Mix
ST4 Mix
ST6 Mix
ST7 Mix
ST8 Mix
ST9 Mix
ST10 Mix
ST11 Mix
ST12 Mix
Sed
imen
tati
on
Time
Shell Tailings 10 Day + Centrifugation Sedimentation Mixed Samples
Page 46
45
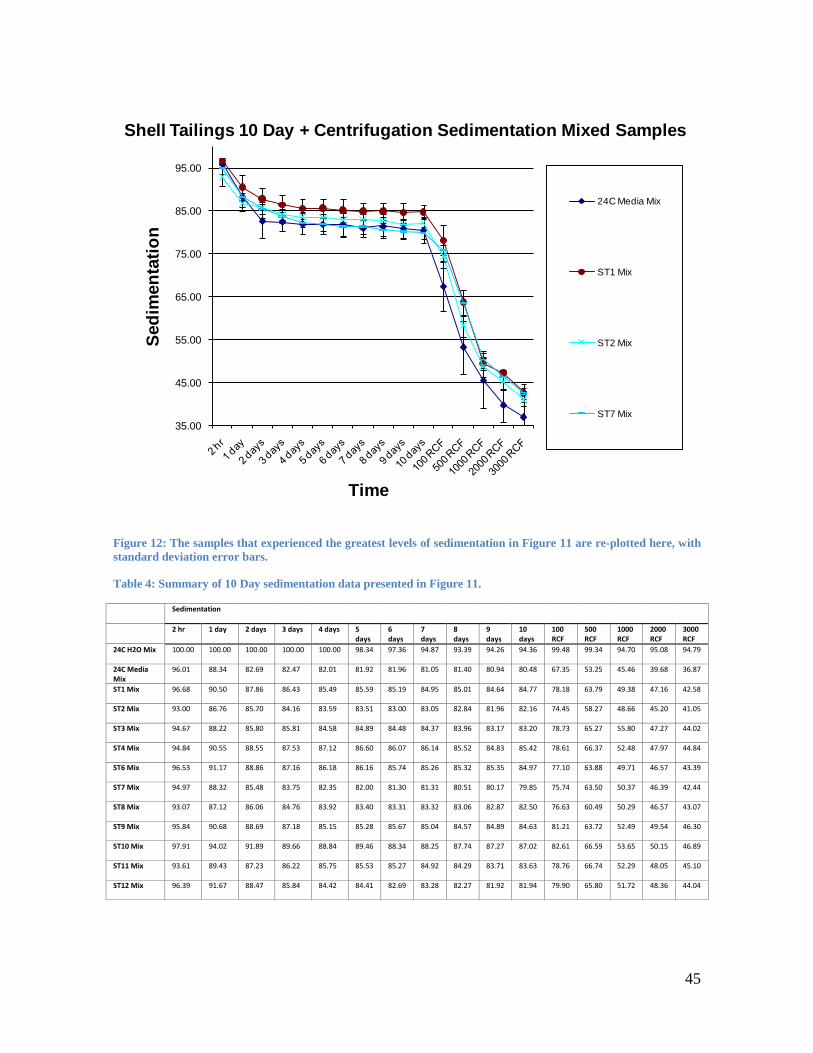
Figure 12: The samples that experienced the greatest levels of sedimentation in Figure 11 are re-plotted here, with
standard deviation error bars.
Table 4: Summary of 10 Day sedimentation data presented in Figure 11.
Sedimentation
2 hr 1 day 2 days 3 days 4 days 5 days
6 days
7 days
8 days
9 days
10 days
100 RCF
500 RCF
1000 RCF
2000 RCF
3000 RCF
24C H2O Mix 100.00 100.00 100.00 100.00 100.00 98.34 97.36 94.87 93.39 94.26 94.36 99.48 99.34 94.70 95.08 94.79
24C Media Mix
96.01 88.34 82.69 82.47 82.01 81.92 81.96 81.05 81.40 80.94 80.48 67.35 53.25 45.46 39.68 36.87
ST1 Mix 96.68 90.50 87.86 86.43 85.49 85.59 85.19 84.95 85.01 84.64 84.77 78.18 63.79 49.38 47.16 42.58
ST2 Mix 93.00 86.76 85.70 84.16 83.59 83.51 83.00 83.05 82.84 81.96 82.16 74.45 58.27 48.66 45.20 41.05
ST3 Mix 94.67 88.22 85.80 85.81 84.58 84.89 84.48 84.37 83.96 83.17 83.20 78.73 65.27 55.80 47.27 44.02
ST4 Mix 94.84 90.55 88.55 87.53 87.12 86.60 86.07 86.14 85.52 84.83 85.42 78.61 66.37 52.48 47.97 44.84
ST6 Mix 96.53 91.17 88.86 87.16 86.18 86.16 85.74 85.26 85.32 85.35 84.97 77.10 63.88 49.71 46.57 43.39
ST7 Mix 94.97 88.32 85.48 83.75 82.35 82.00 81.30 81.31 80.51 80.17 79.85 75.74 63.50 50.37 46.39 42.44
ST8 Mix 93.07 87.12 86.06 84.76 83.92 83.40 83.31 83.32 83.06 82.87 82.50 76.63 60.49 50.29 46.57 43.07
ST9 Mix 95.84 90.68 88.69 87.18 85.15 85.28 85.67 85.04 84.57 84.89 84.63 81.21 63.72 52.49 49.54 46.30
ST10 Mix 97.91 94.02 91.89 89.66 88.84 89.46 88.34 88.25 87.74 87.27 87.02 82.61 66.59 53.65 50.15 46.89
ST11 Mix 93.61 89.43 87.23 86.22 85.75 85.53 85.27 84.92 84.29 83.71 83.63 78.76 66.74 52.29 48.05 45.10
ST12 Mix 96.39 91.67 88.47 85.84 84.42 84.41 82.69 83.28 82.27 81.92 81.94 79.90 65.80 51.72 48.36 44.04
35.00
45.00
55.00
65.00
75.00
85.00
95.00
24C Media Mix
ST1 Mix
ST2 Mix
ST7 Mix
Sed
imen
tati
on
Time
Shell Tailings 10 Day + Centrifugation Sedimentation Mixed Samples
Page 47
46
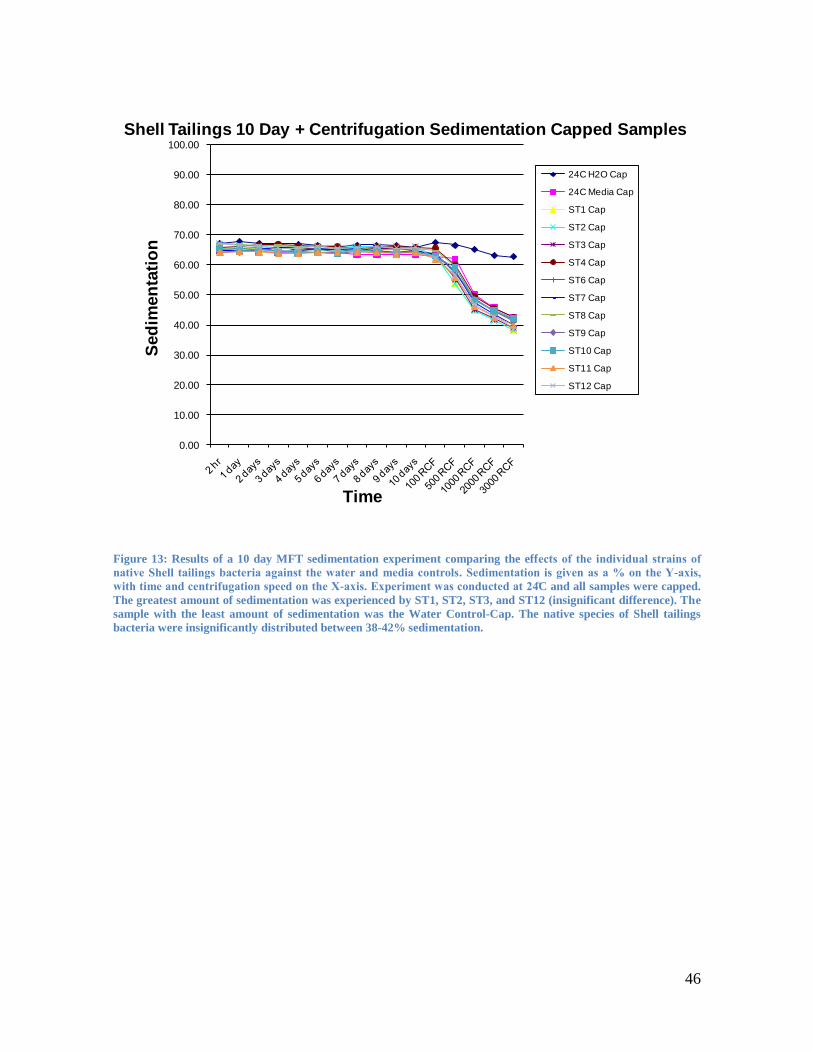
Figure 13: Results of a 10 day MFT sedimentation experiment comparing the eff
-
- C and all samples were capped.
The greatest amount of sedimentation was experienced by ST1, ST2, ST3, and ST12 (insignificant difference). The
sample with the least amount of sedimentation was the Water Control-Cap. The native species of Shell tailings
bacteria were insignificantly distributed between 38-42% sedimentation.
0.00
10.00
20.00
30.00
40.00
50.00
60.00
70.00
80.00
90.00
100.00
24C H2O Cap
24C Media Cap
ST1 Cap
ST2 Cap
ST3 Cap
ST4 Cap
ST6 Cap
ST7 Cap
ST8 Cap
ST9 Cap
ST10 Cap
ST11 Cap
ST12 Cap
Sed
imen
tati
on
Time
Shell Tailings 10 Day + Centrifugation Sedimentation Capped Samples
Page 48
47
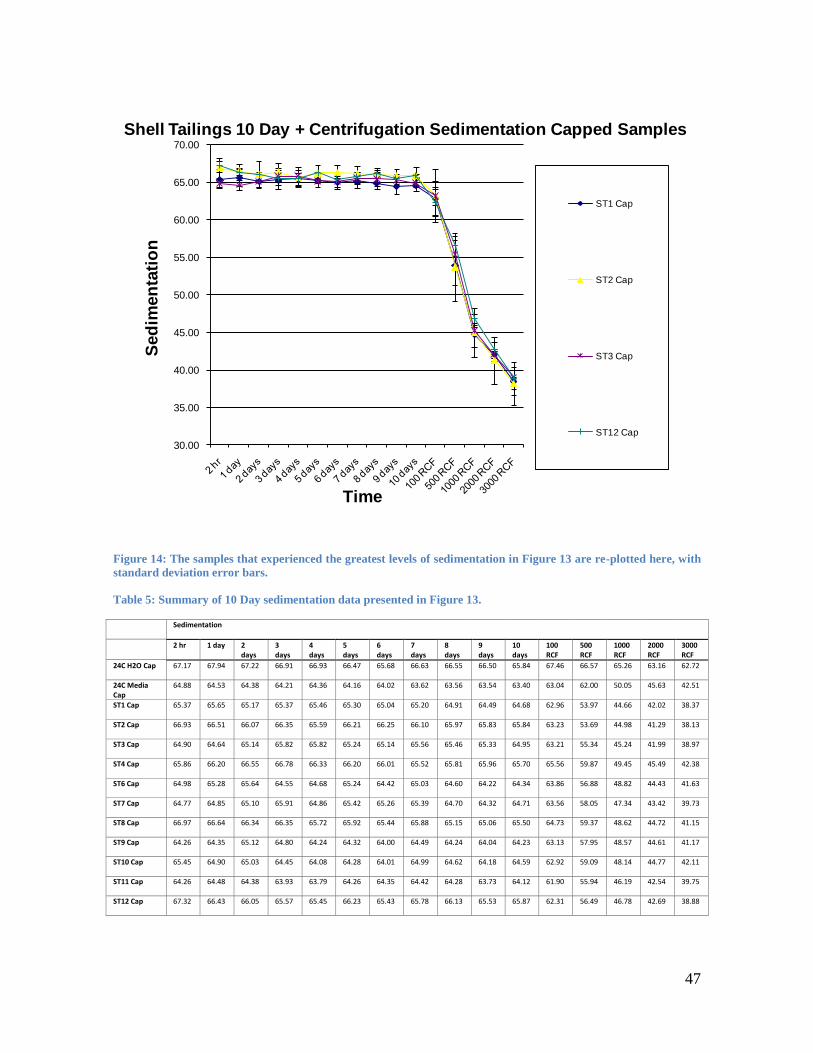
Figure 14: The samples that experienced the greatest levels of sedimentation in Figure 13 are re-plotted here, with
standard deviation error bars.
Table 5: Summary of 10 Day sedimentation data presented in Figure 13.
Sedimentation
2 hr 1 day 2 days
3 days
4 days
5 days
6 days
7 days
8 days
9 days
10 days
100 RCF
500 RCF
1000 RCF
2000 RCF
3000 RCF
24C H2O Cap 67.17 67.94 67.22 66.91 66.93 66.47 65.68 66.63 66.55 66.50 65.84 67.46 66.57 65.26 63.16 62.72
24C Media Cap
64.88 64.53 64.38 64.21 64.36 64.16 64.02 63.62 63.56 63.54 63.40 63.04 62.00 50.05 45.63 42.51
ST1 Cap 65.37 65.65 65.17 65.37 65.46 65.30 65.04 65.20 64.91 64.49 64.68 62.96 53.97 44.66 42.02 38.37
ST2 Cap 66.93 66.51 66.07 66.35 65.59 66.21 66.25 66.10 65.97 65.83 65.84 63.23 53.69 44.98 41.29 38.13
ST3 Cap 64.90 64.64 65.14 65.82 65.82 65.24 65.14 65.56 65.46 65.33 64.95 63.21 55.34 45.24 41.99 38.97
ST4 Cap 65.86 66.20 66.55 66.78 66.33 66.20 66.01 65.52 65.81 65.96 65.70 65.56 59.87 49.45 45.49 42.38
ST6 Cap 64.98 65.28 65.64 64.55 64.68 65.24 64.42 65.03 64.60 64.22 64.34 63.86 56.88 48.82 44.43 41.63
ST7 Cap 64.77 64.85 65.10 65.91 64.86 65.42 65.26 65.39 64.70 64.32 64.71 63.56 58.05 47.34 43.42 39.73
ST8 Cap 66.97 66.64 66.34 66.35 65.72 65.92 65.44 65.88 65.15 65.06 65.50 64.73 59.37 48.62 44.72 41.15
ST9 Cap 64.26 64.35 65.12 64.80 64.24 64.32 64.00 64.49 64.24 64.04 64.23 63.13 57.95 48.57 44.61 41.17
ST10 Cap 65.45 64.90 65.03 64.45 64.08 64.28 64.01 64.99 64.62 64.18 64.59 62.92 59.09 48.14 44.77 42.11
ST11 Cap 64.26 64.48 64.38 63.93 63.79 64.26 64.35 64.42 64.28 63.73 64.12 61.90 55.94 46.19 42.54 39.75
ST12 Cap 67.32 66.43 66.05 65.57 65.45 66.23 65.43 65.78 66.13 65.53 65.87 62.31 56.49 46.78 42.69 38.88
30.00
35.00
40.00
45.00
50.00
55.00
60.00
65.00
70.00
ST1 Cap
ST2 Cap
ST3 Cap
ST12 Cap
Sed
imen
tati
on
Time
Shell Tailings 10 Day + Centrifugation Sedimentation Capped Samples
Page 49
48
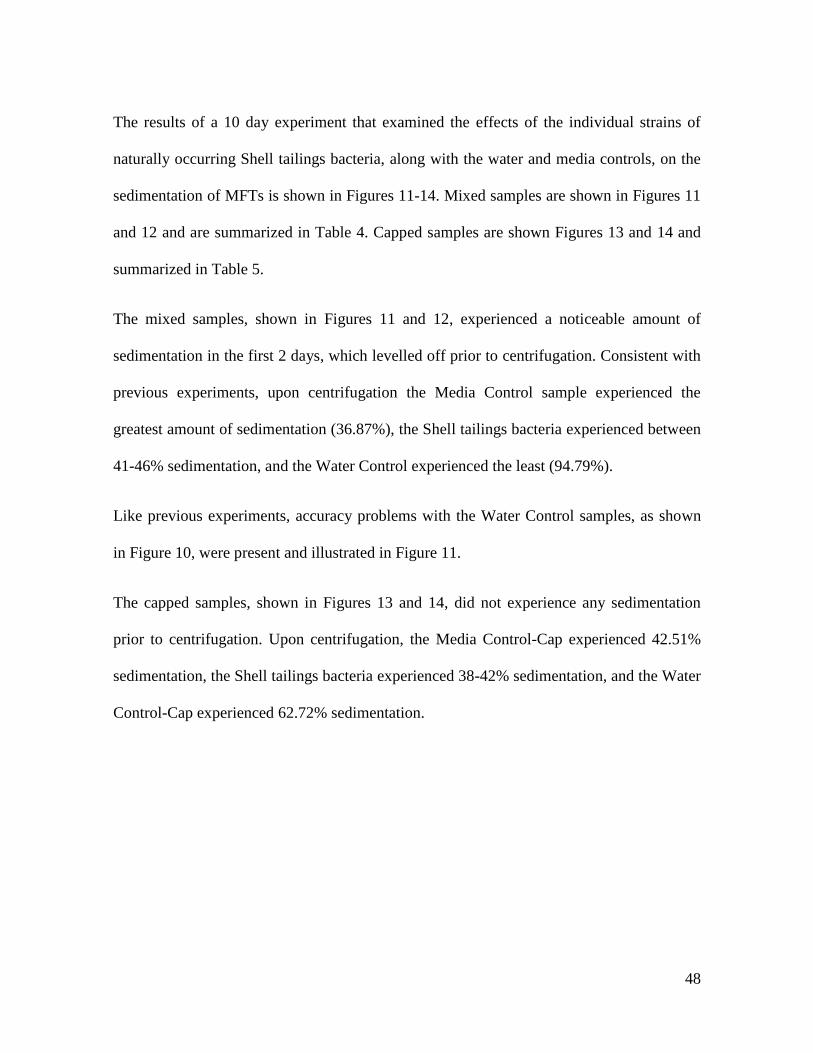
The results of a 10 day experiment that examined the effects of the individual strains of
naturally occurring Shell tailings bacteria, along with the water and media controls, on the
sedimentation of MFTs is shown in Figures 11-14. Mixed samples are shown in Figures 11
and 12 and are summarized in Table 4. Capped samples are shown Figures 13 and 14 and
summarized in Table 5.
The mixed samples, shown in Figures 11 and 12, experienced a noticeable amount of
sedimentation in the first 2 days, which levelled off prior to centrifugation. Consistent with
previous experiments, upon centrifugation the Media Control sample experienced the
greatest amount of sedimentation (36.87%), the Shell tailings bacteria experienced between
41-46% sedimentation, and the Water Control experienced the least (94.79%).
Like previous experiments, accuracy problems with the Water Control samples, as shown
in Figure 10, were present and illustrated in Figure 11.
The capped samples, shown in Figures 13 and 14, did not experience any sedimentation
prior to centrifugation. Upon centrifugation, the Media Control-Cap experienced 42.51%
sedimentation, the Shell tailings bacteria experienced 38-42% sedimentation, and the Water
Control-Cap experienced 62.72% sedimentation.
Page 50
49
7.3 Optical Density Analysis Results
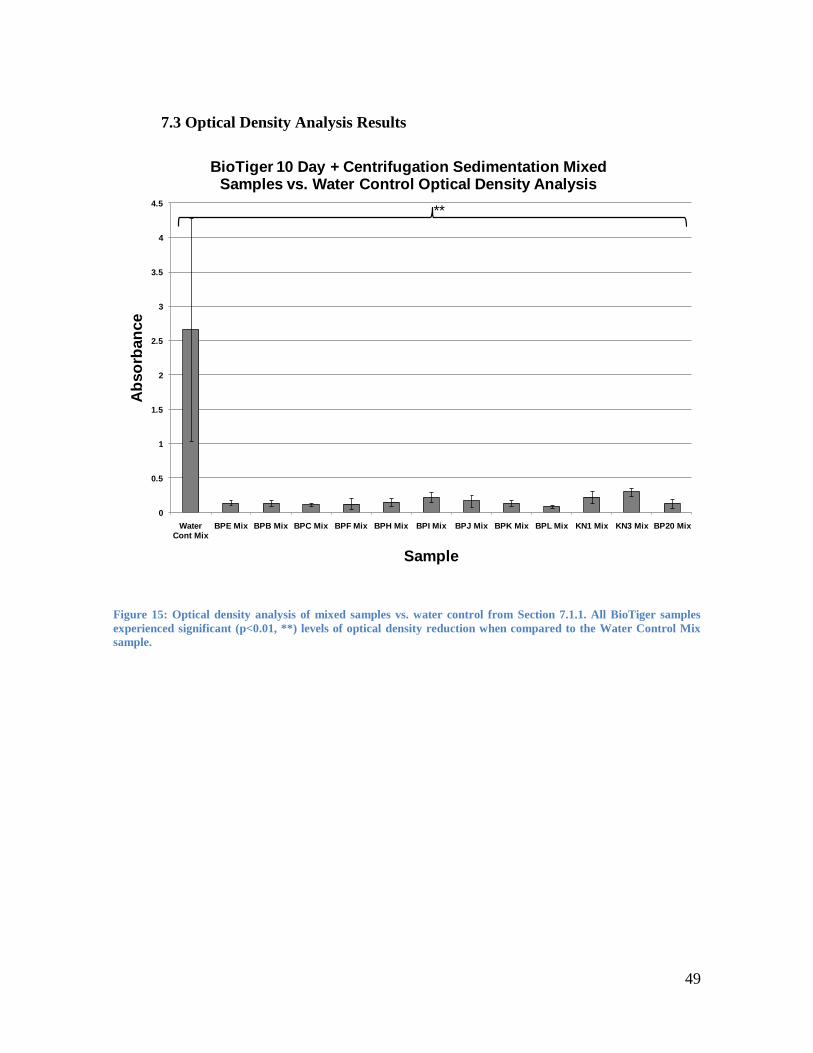
Figure 15: Optical density analysis of mixed samples vs. water control from Section 7.1.1. All BioTiger samples
experienced significant (p<0.01, **) levels of optical density reduction when compared to the Water Control Mix
sample.
0
0.5
1
1.5
2
2.5
3
3.5
4
4.5
Water Cont Mix
BPE Mix BPB Mix BPC Mix BPF Mix BPH Mix BPI Mix BPJ Mix BPK Mix BPL Mix KN1 Mix KN3 Mix BP20 Mix
Ab
so
rban
ce
Sample
BioTiger 10 Day + Centrifugation Sedimentation Mixed Samples vs. Water Control Optical Density Analysis
**
Page 51
50
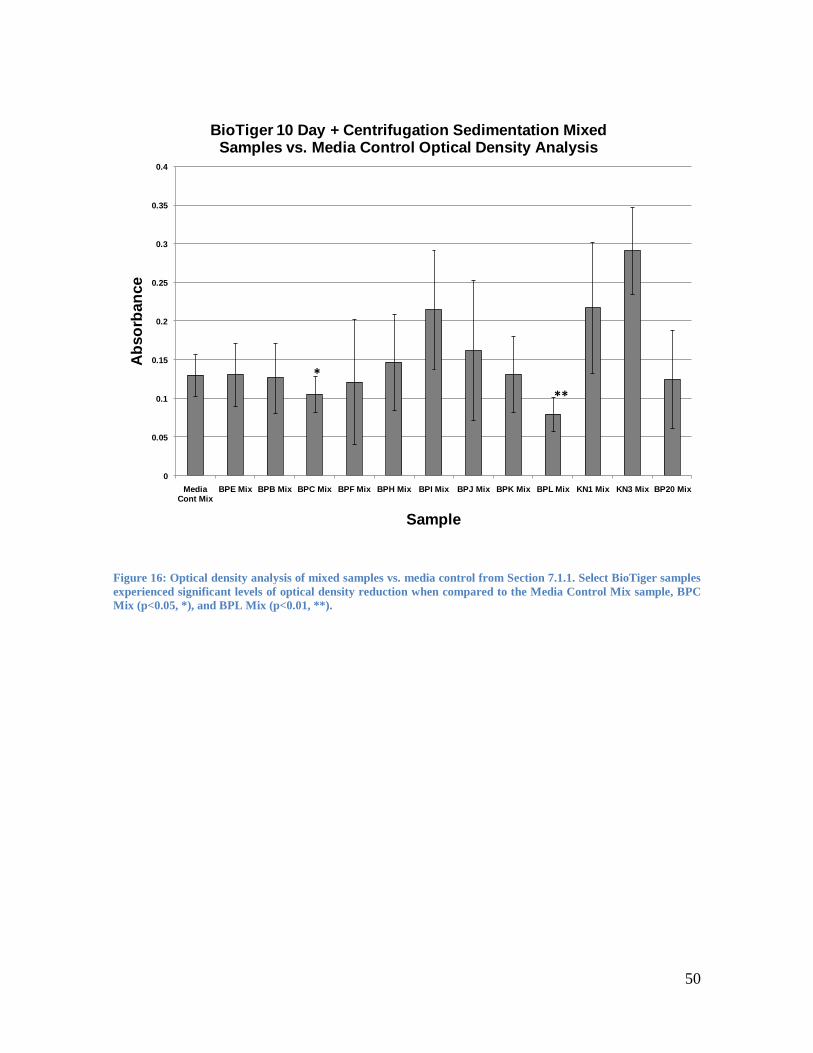
Figure 16: Optical density analysis of mixed samples vs. media control from Section 7.1.1. Select BioTiger samples
experienced significant levels of optical density reduction when compared to the Media Control Mix sample, BPC
Mix (p<0.05, *), and BPL Mix (p<0.01, **).
0
0.05
0.1
0.15
0.2
0.25
0.3
0.35
0.4
Media Cont Mix
BPE Mix BPB Mix BPC Mix BPF Mix BPH Mix BPI Mix BPJ Mix BPK Mix BPL Mix KN1 Mix KN3 Mix BP20 Mix
Ab
so
rban
ce
Sample
BioTiger 10 Day + Centrifugation Sedimentation Mixed Samples vs. Media Control Optical Density Analysis
*
**
Page 52
51
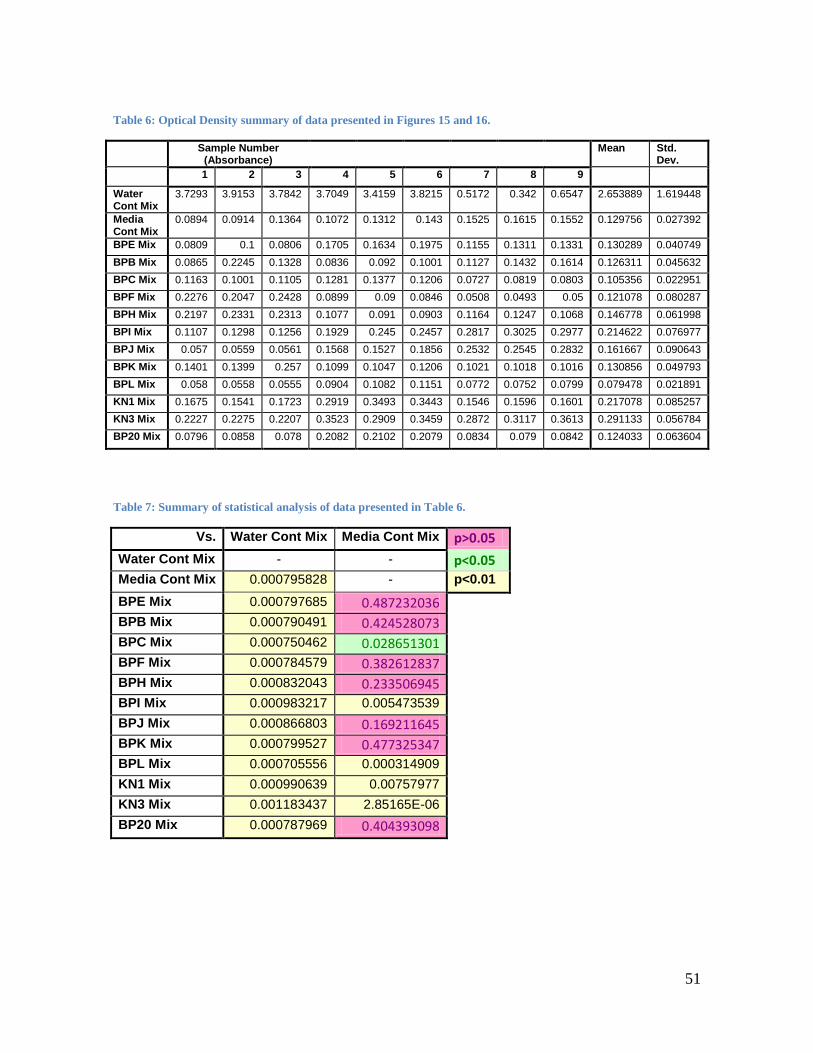
Table 6: Optical Density summary of data presented in Figures 15 and 16.
Sample Number (Absorbance)
Mean Std. Dev.
1 2 3 4 5 6 7 8 9
Water Cont Mix
3.7293 3.9153 3.7842 3.7049 3.4159 3.8215 0.5172 0.342 0.6547 2.653889 1.619448
Media Cont Mix
0.0894 0.0914 0.1364 0.1072 0.1312 0.143 0.1525 0.1615 0.1552 0.129756 0.027392
BPE Mix 0.0809 0.1 0.0806 0.1705 0.1634 0.1975 0.1155 0.1311 0.1331 0.130289 0.040749
BPB Mix 0.0865 0.2245 0.1328 0.0836 0.092 0.1001 0.1127 0.1432 0.1614 0.126311 0.045632
BPC Mix 0.1163 0.1001 0.1105 0.1281 0.1377 0.1206 0.0727 0.0819 0.0803 0.105356 0.022951
BPF Mix 0.2276 0.2047 0.2428 0.0899 0.09 0.0846 0.0508 0.0493 0.05 0.121078 0.080287
BPH Mix 0.2197 0.2331 0.2313 0.1077 0.091 0.0903 0.1164 0.1247 0.1068 0.146778 0.061998
BPI Mix 0.1107 0.1298 0.1256 0.1929 0.245 0.2457 0.2817 0.3025 0.2977 0.214622 0.076977
BPJ Mix 0.057 0.0559 0.0561 0.1568 0.1527 0.1856 0.2532 0.2545 0.2832 0.161667 0.090643
BPK Mix 0.1401 0.1399 0.257 0.1099 0.1047 0.1206 0.1021 0.1018 0.1016 0.130856 0.049793
BPL Mix 0.058 0.0558 0.0555 0.0904 0.1082 0.1151 0.0772 0.0752 0.0799 0.079478 0.021891
KN1 Mix 0.1675 0.1541 0.1723 0.2919 0.3493 0.3443 0.1546 0.1596 0.1601 0.217078 0.085257
KN3 Mix 0.2227 0.2275 0.2207 0.3523 0.2909 0.3459 0.2872 0.3117 0.3613 0.291133 0.056784
BP20 Mix 0.0796 0.0858 0.078 0.2082 0.2102 0.2079 0.0834 0.079 0.0842 0.124033 0.063604
Table 7: Summary of statistical analysis of data presented in Table 6.
Vs. Water Cont Mix Media Cont Mix p>0.05
Water Cont Mix - - p<0.05 Media Cont Mix 0.000795828 - p<0.01
BPE Mix 0.000797685 0.487232036
BPB Mix 0.000790491 0.424528073
BPC Mix 0.000750462 0.028651301
BPF Mix 0.000784579 0.382612837
BPH Mix 0.000832043 0.233506945
BPI Mix 0.000983217 0.005473539
BPJ Mix 0.000866803 0.169211645
BPK Mix 0.000799527 0.477325347
BPL Mix 0.000705556 0.000314909
KN1 Mix 0.000990639 0.00757977
KN3 Mix 0.001183437 2.85165E-06
BP20 Mix 0.000787969 0.404393098
Page 53
52
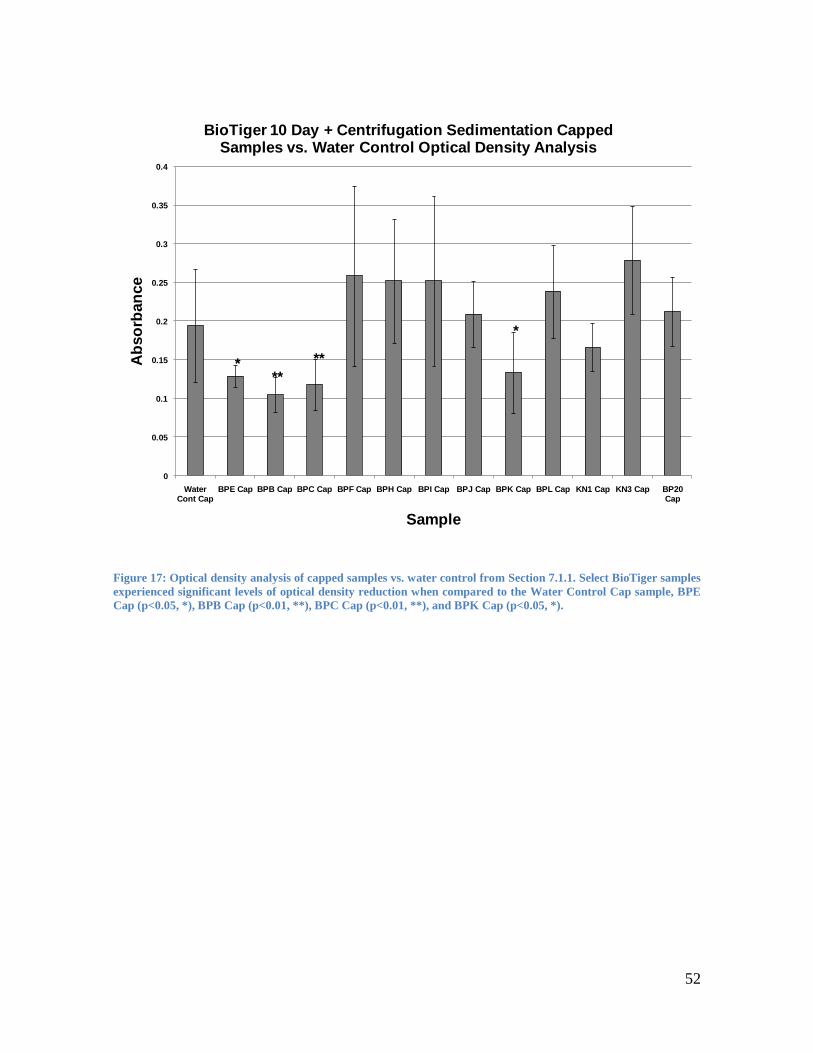
Figure 17: Optical density analysis of capped samples vs. water control from Section 7.1.1. Select BioTiger samples
experienced significant levels of optical density reduction when compared to the Water Control Cap sample, BPE
Cap (p<0.05, *), BPB Cap (p<0.01, **), BPC Cap (p<0.01, **), and BPK Cap (p<0.05, *).
0
0.05
0.1
0.15
0.2
0.25
0.3
0.35
0.4
Water Cont Cap
BPE Cap BPB Cap BPC Cap BPF Cap BPH Cap BPI Cap BPJ Cap BPK Cap BPL Cap KN1 Cap KN3 Cap BP20 Cap
Ab
so
rban
ce
Sample
BioTiger 10 Day + Centrifugation Sedimentation Capped Samples vs. Water Control Optical Density Analysis
***
**
*
Page 54
53
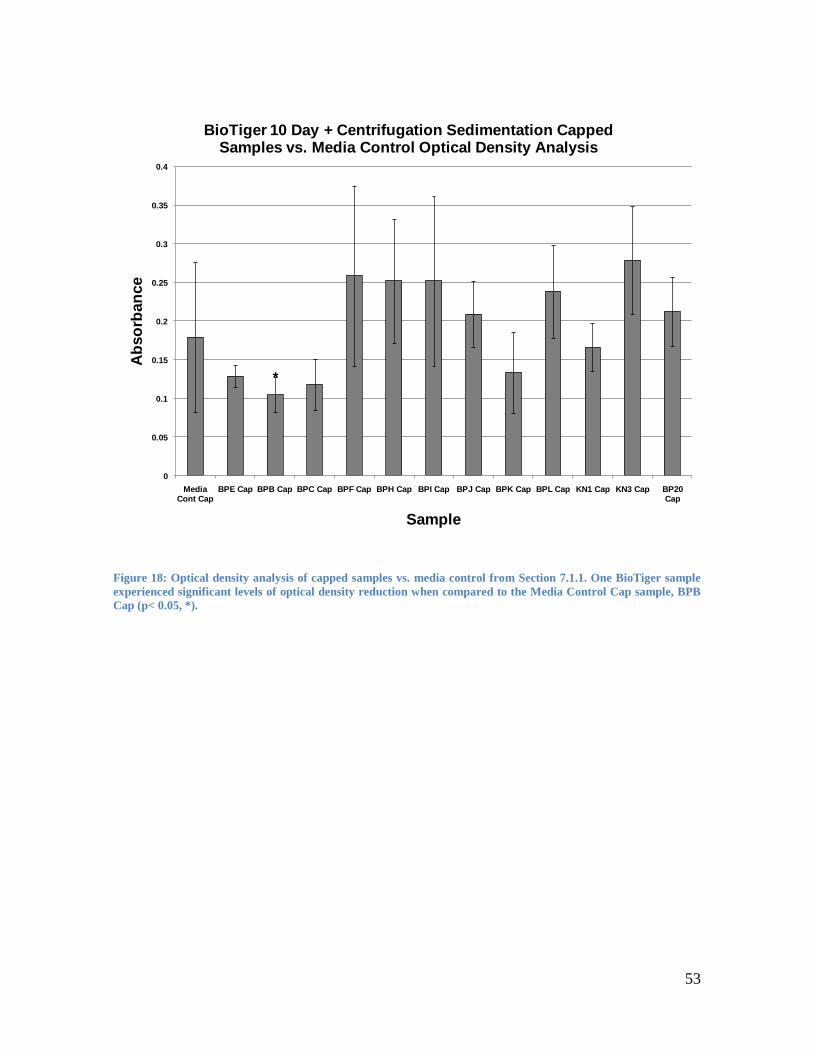
Figure 18: Optical density analysis of capped samples vs. media control from Section 7.1.1. One BioTiger sample
experienced significant levels of optical density reduction when compared to the Media Control Cap sample, BPB
Cap (p< 0.05, *).
0
0.05
0.1
0.15
0.2
0.25
0.3
0.35
0.4
Media Cont Cap
BPE Cap BPB Cap BPC Cap BPF Cap BPH Cap BPI Cap BPJ Cap BPK Cap BPL Cap KN1 Cap KN3 Cap BP20 Cap
Ab
so
rban
ce
Sample
BioTiger 10 Day + Centrifugation Sedimentation Capped Samples vs. Media Control Optical Density Analysis
*
Page 55
54
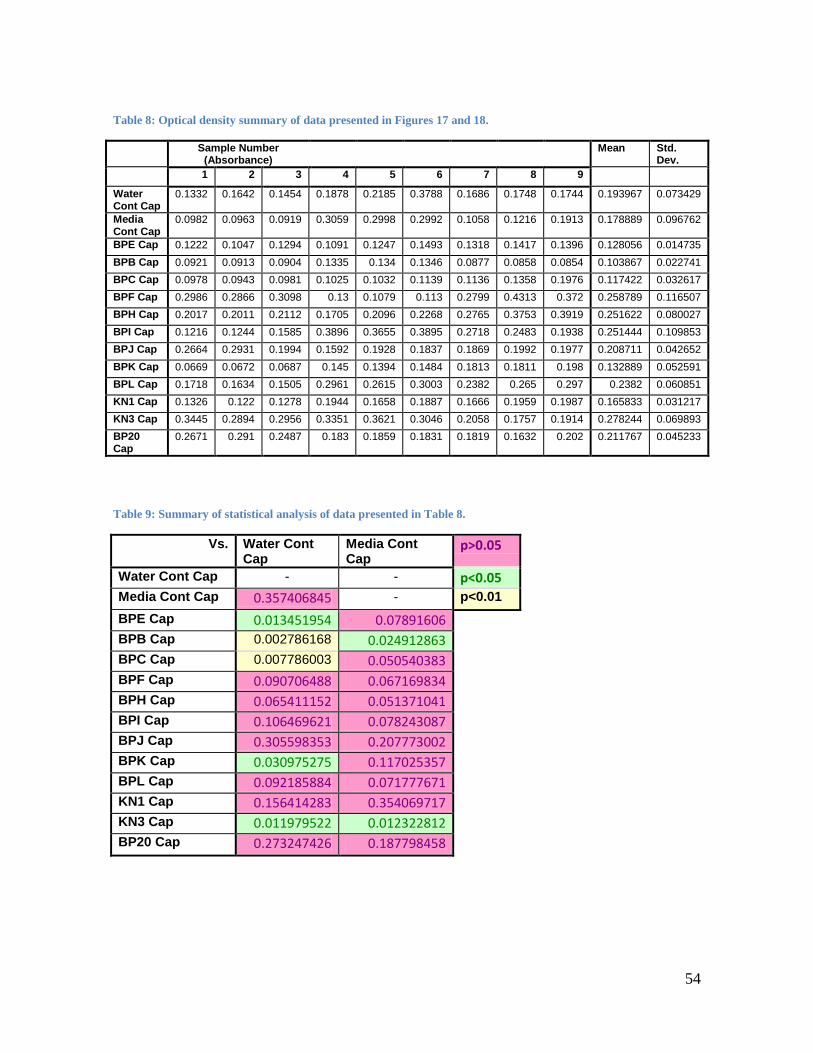
Table 8: Optical density summary of data presented in Figures 17 and 18.
Sample Number (Absorbance)
Mean Std. Dev.
1 2 3 4 5 6 7 8 9
Water Cont Cap
0.1332 0.1642 0.1454 0.1878 0.2185 0.3788 0.1686 0.1748 0.1744 0.193967 0.073429
Media Cont Cap
0.0982 0.0963 0.0919 0.3059 0.2998 0.2992 0.1058 0.1216 0.1913 0.178889 0.096762
BPE Cap 0.1222 0.1047 0.1294 0.1091 0.1247 0.1493 0.1318 0.1417 0.1396 0.128056 0.014735
BPB Cap 0.0921 0.0913 0.0904 0.1335 0.134 0.1346 0.0877 0.0858 0.0854 0.103867 0.022741
BPC Cap 0.0978 0.0943 0.0981 0.1025 0.1032 0.1139 0.1136 0.1358 0.1976 0.117422 0.032617
BPF Cap 0.2986 0.2866 0.3098 0.13 0.1079 0.113 0.2799 0.4313 0.372 0.258789 0.116507
BPH Cap 0.2017 0.2011 0.2112 0.1705 0.2096 0.2268 0.2765 0.3753 0.3919 0.251622 0.080027
BPI Cap 0.1216 0.1244 0.1585 0.3896 0.3655 0.3895 0.2718 0.2483 0.1938 0.251444 0.109853
BPJ Cap 0.2664 0.2931 0.1994 0.1592 0.1928 0.1837 0.1869 0.1992 0.1977 0.208711 0.042652
BPK Cap 0.0669 0.0672 0.0687 0.145 0.1394 0.1484 0.1813 0.1811 0.198 0.132889 0.052591
BPL Cap 0.1718 0.1634 0.1505 0.2961 0.2615 0.3003 0.2382 0.265 0.297 0.2382 0.060851
KN1 Cap 0.1326 0.122 0.1278 0.1944 0.1658 0.1887 0.1666 0.1959 0.1987 0.165833 0.031217
KN3 Cap 0.3445 0.2894 0.2956 0.3351 0.3621 0.3046 0.2058 0.1757 0.1914 0.278244 0.069893
BP20 Cap
0.2671 0.291 0.2487 0.183 0.1859 0.1831 0.1819 0.1632 0.202 0.211767 0.045233
Table 9: Summary of statistical analysis of data presented in Table 8.
Vs. Water Cont Cap
Media Cont Cap
p>0.05
Water Cont Cap - - p<0.05 Media Cont Cap 0.357406845 - p<0.01
BPE Cap 0.013451954 0.07891606
BPB Cap 0.002786168 0.024912863
BPC Cap 0.007786003 0.050540383
BPF Cap 0.090706488 0.067169834
BPH Cap 0.065411152 0.051371041
BPI Cap 0.106469621 0.078243087
BPJ Cap 0.305598353 0.207773002
BPK Cap 0.030975275 0.117025357
BPL Cap 0.092185884 0.071777671
KN1 Cap 0.156414283 0.354069717
KN3 Cap 0.011979522 0.012322812
BP20 Cap 0.273247426 0.187798458
Page 56
55
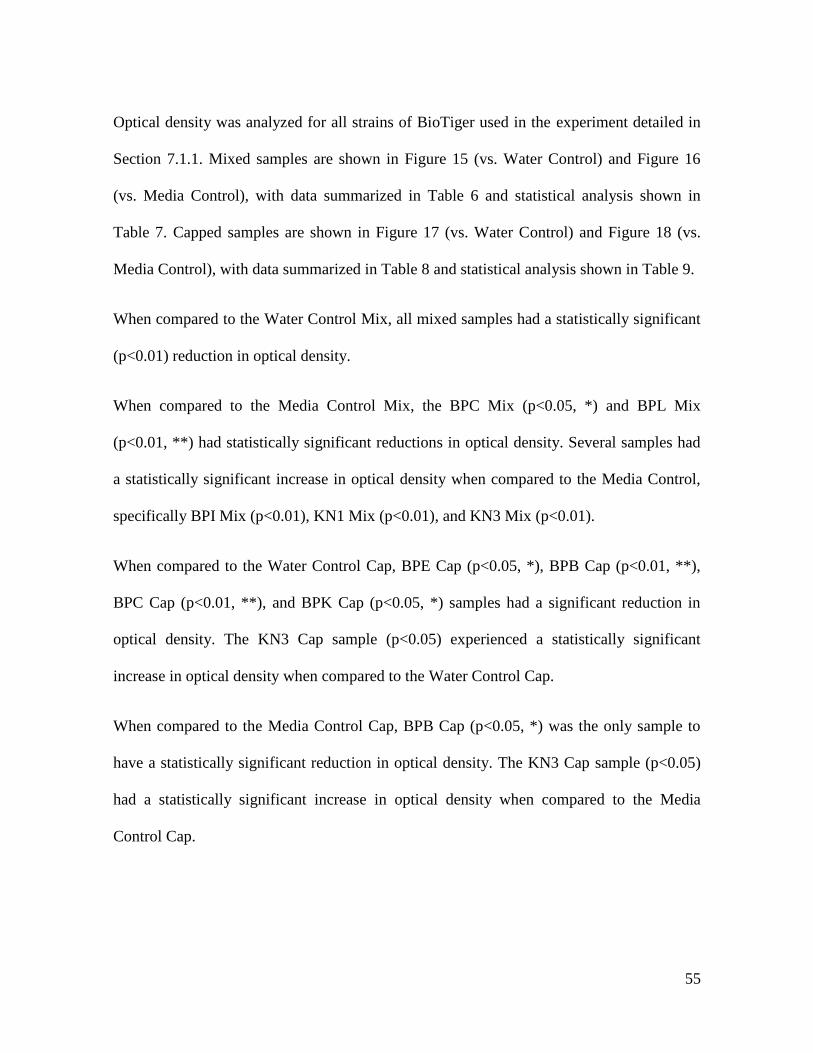
Optical density was analyzed for all strains of BioTiger used in the experiment detailed in
Section 7.1.1. Mixed samples are shown in Figure 15 (vs. Water Control) and Figure 16
(vs. Media Control), with data summarized in Table 6 and statistical analysis shown in
Table 7. Capped samples are shown in Figure 17 (vs. Water Control) and Figure 18 (vs.
Media Control), with data summarized in Table 8 and statistical analysis shown in Table 9.
When compared to the Water Control Mix, all mixed samples had a statistically significant
(p<0.01) reduction in optical density.
When compared to the Media Control Mix, the BPC Mix (p<0.05, *) and BPL Mix
(p<0.01, **) had statistically significant reductions in optical density. Several samples had
a statistically significant increase in optical density when compared to the Media Control,
specifically BPI Mix (p<0.01), KN1 Mix (p<0.01), and KN3 Mix (p<0.01).
When compared to the Water Control Cap, BPE Cap (p<0.05, *), BPB Cap (p<0.01, **),
BPC Cap (p<0.01, **), and BPK Cap (p<0.05, *) samples had a significant reduction in
optical density. The KN3 Cap sample (p<0.05) experienced a statistically significant
increase in optical density when compared to the Water Control Cap.
When compared to the Media Control Cap, BPB Cap (p<0.05, *) was the only sample to
have a statistically significant reduction in optical density. The KN3 Cap sample (p<0.05)
had a statistically significant increase in optical density when compared to the Media
Control Cap.
Page 57
56
7.4 Full Spectrum Absorbance Analysis Results
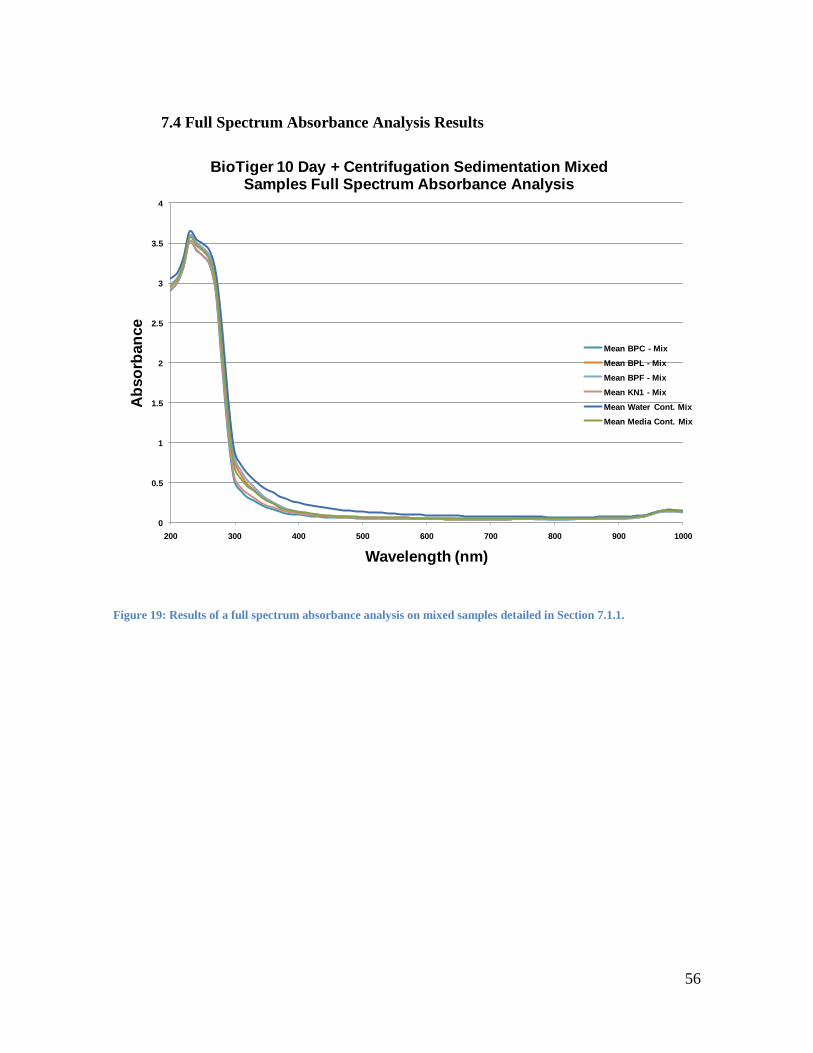
Figure 19: Results of a full spectrum absorbance analysis on mixed samples detailed in Section 7.1.1.
0
0.5
1
1.5
2
2.5
3
3.5
4
200 300 400 500 600 700 800 900 1000
Ab
so
rban
ce
Wavelength (nm)
BioTiger 10 Day + Centrifugation Sedimentation Mixed Samples Full Spectrum Absorbance Analysis
Mean BPC - Mix
Mean BPL - Mix
Mean BPF - Mix
Mean KN1 - Mix
Mean Water Cont. Mix
Mean Media Cont. Mix
Page 58
57
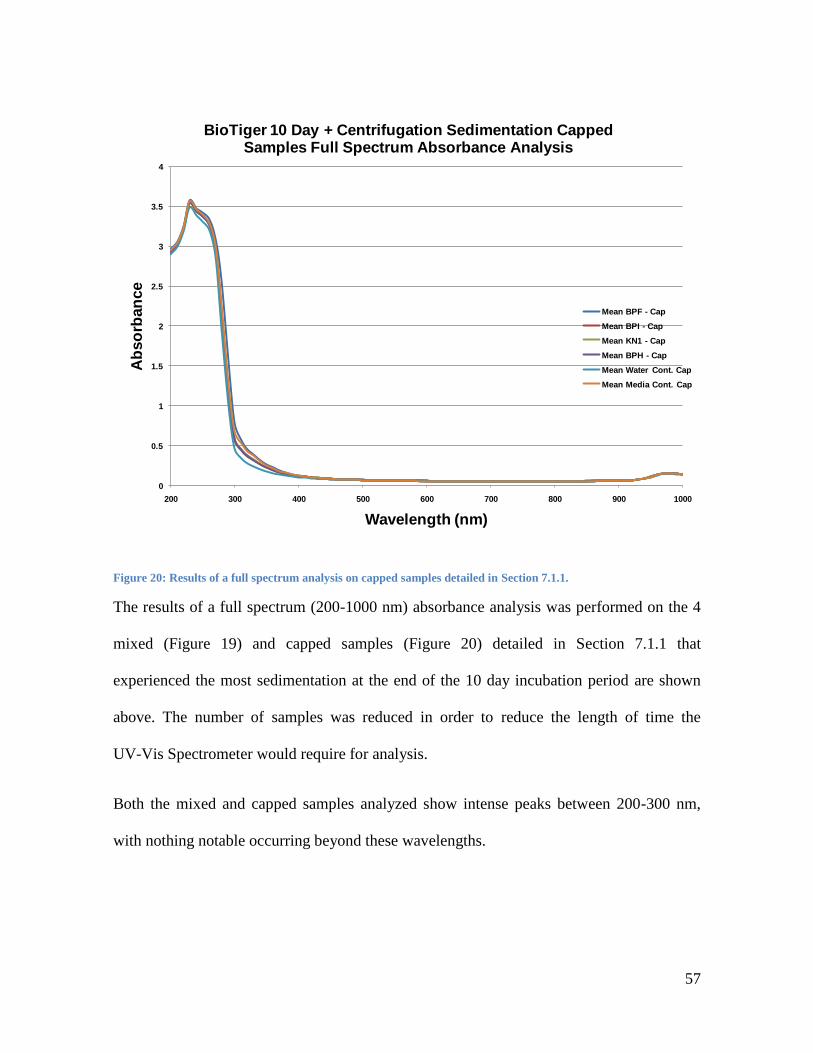
Figure 20: Results of a full spectrum analysis on capped samples detailed in Section 7.1.1.
The results of a full spectrum (200-1000 nm) absorbance analysis was performed on the 4
mixed (Figure 19) and capped samples (Figure 20) detailed in Section 7.1.1 that
experienced the most sedimentation at the end of the 10 day incubation period are shown
above. The number of samples was reduced in order to reduce the length of time the
UV-Vis Spectrometer would require for analysis.
Both the mixed and capped samples analyzed show intense peaks between 200-300 nm,
with nothing notable occurring beyond these wavelengths.
0
0.5
1
1.5
2
2.5
3
3.5
4
200 300 400 500 600 700 800 900 1000
Ab
so
rban
ce
Wavelength (nm)
BioTiger 10 Day + Centrifugation Sedimentation Capped Samples Full Spectrum Absorbance Analysis
Mean BPF - Cap
Mean BPI - Cap
Mean KN1 - Cap
Mean BPH - Cap
Mean Water Cont. Cap
Mean Media Cont. Cap
Page 59
58
It should be noted that the plates were incorrectly blanked prior to analysis, so data
presented here is not normalized, and cannot be used to calculate the concentrations of
various compounds.
8.0 Discussion
8.1 BioTiger Experiments
8.1.1 10 Day Sedimentation + Centrifugation Experiment
It had recently been shown that using BioTiger, a patented biofilm with established
bioremediation abilities, to treat oil sand samples resulted in a 5-fold increase in bitumen
recovery and an equivalent increase in chelating heavy metal ions over 24 hours. Tailings
samples treated with P. aeruginosa bacteria showed a notable increase in bitumen recovery
from clay sludge after a 36 hour treatment due to bacterial activity that induced separation
of the oil sands components. This proves that the increased bitumen recovery is
proportional to densification of the tailings and release of water. However, the contributions
of the individual strains that comprise BioTiger to the bioremediation process remains to be
determined. Additionally, it remains unclear if the BioTiger consortium is more effective
than the naturally occurring bacteria in the tailings, as supplemented with R2A growth
media.
The results illustrated and summarized in Section 7.1.1 reflect that none of the individual
BioTiger strains were capable of outperforming the media controls, in both the mixed and
capped forms. They also show that samples treated with media outperform those treated
with water.
Page 60
59
While the centrifugation data shows a negligible difference between the mixed and capped
groups, prior to centrifugation the capped samples experienced more sedimentation than the
mixed ones. The reason for this is unknown.
8.1.2 4 Hour + 3 Day Control Sedimentation +/- Antibiotics Experiment
During a conference call with the Savannah River Natural Laboratory (SRNL) it was
decided that in order to determine the differences between the media control and the
bacteria-added samples (Section 7.1.1), another experiment was needed to clarify whether
the differences were due to chemical or biological change.
The experiment detailed in Section 7.1.2 was done in two parts: a 4 hour and a 3 day
growth period. The governing hypothesis was that the artificially short growth period of the
4 hour experiment would limit the sedimentation effects of the naturally occurring tailings
bacteria, and the difference in sedimentation between the media and water treated samples
would be primarily caused by the chemical differences between the two substances.
As Figure 4 shows, the samples mixed with the media experienced far more sedimentation
than those treated with water, with differences manifesting themselves after a mere four
hours. This suggests that the previously observed performance of samples treated with just
media (Media Control, Section 7.1.1) is largely due to chemical or charge effects, rather
than the native tailings bacteria.
Figure 5 shows the results from the three day portion of the experiment with mixed
samples. Notably, Water Control samples treated with antibiotic outperformed those which
were not. Further, all but one (the 36°C H2O mix+) were outperformed by the plain
Page 61
60
tailings, a finding consistent with Figure 4. Examining the media treated samples, the 24°C
Media Control Mix+ outperformed the 24°C Media Control Mix, whereas the opposite was
true for the 36°C samples. However, as shown in Figure 6, this could all be due to
experimental error. The general trend of samples treated with media experiencing more
sedimentation than samples treated with water described in Section 8.1.1 still stands (i.e.
Media Control Mix and Media Control Cap samples experienced more sedimentation than
Water Control Mix and Water Control Cap samples).
Figure 7 shows the results from the three day portion of the experiment with capped
samples. Samples capped with water, both with and without the antibiotic treatment,
performed similarly, especially at 36°C. The trend of media treatment increasing
sedimentation continues, with all media treated samples experiencing more sedimentation
than their water treated counterparts. As shown in Figure 7, the 24°C Media-Cap +
Antibiotics sample experienced far more sedimentation than all other samples, including
samples from previous experiments. A picture of the replicates is shown in Figure 9.
The sedimentation of the 24°C media+ sample in Figure 7 is perhaps the most important
observation from this experiment. Typically it has been observed that samples treated with
media at 36°C experience the most sedimentation, but these results show otherwise.
Overall the data presented in Sections 7.1.1 and 7.1.2 suggest that the differences between
the water treated samples and the media treated samples is most likely due to the
chemical/charge differences between the substances, rather than bacterial activity, when the
artificially short time-span of this experiment is considered. This trend was echoed during
Page 62
61
the 3 day experiment involving antibiotics to eliminate the native bacteria strains in the
tailings.
8.2 Shell Tailings Experiments
The inconclusive results from testing of th oT r mu t sp s onsort um’s
sedimentation capacity required testing of the sedimentation capabilities of the naturally
occurring bacteria (those stimulated by the R2A media in the Media Control samples). 11
strains of bacteria were isolated from the tailings for testing.
The data from this experiment, shown in Section 7.2, is consistent with the trends
established in Section 7.1. On average, capped samples experienced greater levels of
sedimentation than the mixed samples. Media controls typically outperformed the samples
treated with a specific strain of bacteria, with the exception of Figure 14 where the media
control was outperformed by at least four species of the Shell tailings bacteria.
Overall, the results from this experiment suggest that the hypothesis that the naturally
occurring Shell Tailings bacteria could outperform the BioTiger bacteria in sedimentation
cannot be maintained.
8.3 UV-Vis Spectrometer Experiments
During a conference call with researchers at SRNL, it was decided that the inconclusive
results of the sedimentation experiments required expanding the BioTiger experiments to
include an analysis of the released water chemistry, with a particular interest in water
turbidity as it pertains to the required reduction in fine particles in fluid tailings under the
ERC ’s Directive 074 (ERCB 2009). An inventory of samples retained from previous
Page 63
62
experiments was performed and it was decided that the most suitable samples for analysis
were those from experiments outlined in Sections 6.4.3 and 7.1.1, tailings samples treated
with th nd v du oT r str ns, s n th y h d b n stor d t 4 C and closely
mimicked what a potential future experiment might investigate.
8.3.1 Optical Density Analysis
The analysis of the optical density of samples treated with BioTiger shown in Section 7.3
supports the view microbial activity may be used to reduce the turbidity of process affected
water.
The most significant finding from this experiment is shown in Figure 15, where all mixed
samples experienced a statistically significant (p<0.01) reduction in optical density at
590 nm when compared to the Water Control Mix.
The results from the capped samples, shown in Figures 17 and 18, are not as notable as
those from the mixed samples. This is likely due to the experimental procedure, where
samples treated with BioTiger were capped with the bacteria-containing R2A mixture, and
the Water Control Cap was capped with dH2O. While several samples had a statistically
significant reduction in optical density, the magnitudes of the reduction were much less
than in the mixed samples, suggesting a more subtle effect in this regard.
In both the mixed and capped sample analysis, several strains of BioTiger had an apparent
increase in optical density when compared to the media control, rather than a reduction.
Shown in Table 7, the BPI-Mix, KN1-Mix, and KN3-Mix samples had a statistically
significant increase in optical density. Shown in Table 9, the KN3-Cap sample had a
Page 64
63
statistically significant increase in optical density. These results suggest that there is an
effect of microbial activity on the optical density of the released water, be it beneficial or
detrimental. Furthermore, the significant increases or decreases in optical density imply that
these effects are not limited to the suggested charge/chemistry effects of media, as seen in
the sedimentation experiments.
Overall, the net reduction in optical density suggests that the BioTiger bacteria are reducing
the amount of suspended fines in the released water. Fines are mineral solids with particle
sizes equal to or less than 44 μm (ERCB 2009). In accordance with Directive 074: Tailings
Performance Criteria and Requirements for Oil Sands Mining Schemes, Operators must
reduce the amount of fines in dedicated disposal areas by 20% before June 30, 2011, by
30% before June 30, 2012, and by 50% before June 30, 2013 (ERCB 2009). While the
large-scale feasibility of treating oil sands tailings with BioTiger has not been investigated,
the results presented here suggest that future investigation would be worthwhile.
8.3.2 Full Spectrum Analysis
A full spectrum absorbance analysis was performed on the top 4 mixed and capped
samples, outlined in Sections 6.4.3 and 7.1.1, that experienced the most sedimentation at
the end of the 10 day incubation. Results are shown in Figures 19 and 20.
Both the mixed and capped samples feature similar peaks between 200-300 nm, suggesting
the presence of aromatic hydrocarbons in the released water. Unfortunately, procedural
errors prevented the plates from being properly blanked, so the amount of bituminous
material could not be calculated.
Page 65
64
Had the blanking worked properly, the amounts of bituminous material in the released
water would have been calculated using an extinction coefficient of 400 L/mol cm (Ali &
Alghannam, 1979), and the equation:
Where A is the absorbance, ε is the extinction coefficient, and l is the path length.
9.0 Conclusions + Future Work
From Section 7.1.1 the figures show that at the end of centrifugation, the average
sedimentation caused by the BioTiger species is 35-40% for both the cap and mixed
samples, despite discrepancies prior to centrifugation (capped samples typically
outperformed mixed samples prior to this point). This suggests there is a limit to the
sedimentation effects of media/water chemistry and bacteria.
From Section 7.1.2, figures demonstrate that there is an immediate effect of media as
shown in Figure 4. This suggests that there is a chemical effect of the R2A media on the
MFTs, rather than a bacteria effect since the effects of their activity would be negligible in
4 hours, a finding that calls into question the governing hypothesis of this study.
Further adding to the confusion are the results shown in Figures 5 and 7 where samples
treated with antibiotics to inhibit bacterial activity outperformed those that were treated
with just media, suggesting that the naturally occurring bacteria in the tailings were not
suitable for sedimentation application, an observation in conflict with the results from
Section 7.1.1 where the media controls outperformed established bioremediation bacteria.
Page 66
65
From Section 7.2, it is shown that at the end of centrifugation, the average sedimentation
caused by the Shell Tailings bacteria is not as much as that caused by the BioTiger bacteria.
This suggests that the BioTiger multispecies consortium is more suited to sedimentation
than the naturally occurring strains.
The inability of all samples to routinely outperform their controls, and the high levels of
sedimentation of capped controls treated with antibiotics, shown in Figures 7, 8, and 9,
suggest that the overall capacity of the BioTiger multispecies consortium for the
sedimentation of MFTs is limited, and their bioremediation capabilities should be examined
via other parameters.
Expanding the scope of the BioTiger bioremediation evaluation, the statistically significant
reduction in optical density of the released water in mixed samples, shown in Section 7.3
and Figure 15, was potentially the most significant finding of the experiment when put in
an industrial context.
Directive 074 requires oil sands operators to achieve drastic reductions in suspended fine
particles in tailings ponds on a yearly basis. While the ability of oil sands operators to meet
th s r du t ons won’t b known until the first deadline (June 30, 2011), the reduction in
released water optical density via treatment with BioTiger suggests that there exists
potential for passive tailings pond treatment to improve the quality of the process-affected
water.
Future steps should be taken to evaluate the oil sands tailings bioremediation potential of
BioTiger under parameters other than sedimentation, including optical density, pH, and
Page 67
66
UV-Vis Spectrometry. Explicitly, steps should be taken to repeat the experiments detailed
in Section 6.4.6 and 6.4.7, as data presented in this th s s w s r ord d from s mp s stor d
t 4 C for an extended period of time.
Page 68
67
10.0 References
Ali, L., & Alghannam, K. (1979). Bituminous impurity in the elemental sulphur from the
Mishraq deposit. Fuel, 58(12), 883-887. doi: 10.1016/0016-2361(79)90205-9.
A n, E. W. (2008 ). Pro ss w t r tr tm nt n C n d ’s o s nds ndustry: II. A r v w
of emerging technologies. Journal of Environmental Engineering and Science, 7(5),
499-524. doi: 10.1139/S08-020.
Allen, E. W. (2008b). Process water treatment in Can d ’s o s nds ndustry: I. T r t
pollutants and treatment objectives. Journal of Environmental Engineering and
Science, 7(2), 123-138. doi: 10.1139/S07-038.
Bordenave, S., Kostenko, V., Dutkoski, M., Grigoryan, A., Martinuzzi, Robert J, &
Voordouw, G. (2010). Relation between the activity of anaerobic microbial
populations in oil sands tailings ponds and the sedimentation of tailings.
Chemosphere. Elsevier Ltd. doi: 10.1016/j.chemosphere.2010.07.058.
CAPP. (2009). Crude Oil: Forecast Markets & Pipelines. Calgary. doi:
10.1134/S1070363209110371.
Chalaturnyk, R. J., Don Scott, J., & Özüm, B. (2002). Management of Oil Sands Tailings.
Petroleum Science and Technology, 20(9&10), 1025-1046. doi: 10.1081/LFT-
120003695.
Clarke, T. (1980). Oil sands hot water extraction process. US Patent 4,240,897. Retrieved
October 11, 2010
Dawson, R. F., Sego, D. C., & Pollock, G. W. (1999). Freeze-thaw dewatering of oil sands
fine tails. Canadian Geotechnical Journal, 36(4), 587-598. doi: 10.1139/cgj-36-4-587.
Eckert, W. F., Masliyah, J. H., Gray, M. R., & Fedorak, P. M. (1996). Prediction of
sedimentation and consolidation of fine tails. AIChE Journal, 42(4), 960-972. doi:
10.1002/aic.690420409.
ERCB. (2009). ERCB Directive 074: Tailings Performance Criteria and Requirements for
Oil Sands Mining Schemes. Regulation (pp. 1-14). Calgary: Energy Resources
Conservation Board.
Fedorak, P., Coy, D., & Dudas, M. (2003). Microbially-mediated fugitive gas production
from oil sands tailings and increased tailings densification rates. Journal of
Environmental Engineering, 211(September), 199-211. doi: 10.1139/S03-022.
Page 69
68
Foght, J.M., Fedorak, P.M., Westlake, D. W. S. (1985). Microbial content and metabolic
activities in Syncrude tailings pond. AOSTRA J. Res., 1, 139-146.
FTFC. (1995). Advances in Oil Sands Tailings Research. AOSTRA Edmonton, AB.
Gosselin, P., Hrudey, S. E., Naeth, M. A., Plourde, A., Therrien, R., Van Der Kraak, G., et
al. (2010). The Royal Society of Canada Expert Panel: Environmental and Health
Imp t of C n d ʼs O S nds Industry.
Guo, C. (2009). Rapid Densification of the Oil Sands Mature Fine Tailings ( MFT ) by
Microbial Activity. Environmental Engineering.
Holowenko, F. M., MacKinnon, M D, & Fedorak, P M. (2000). Methanogens and sulfate-
reducing bacteria in oil sands fine tailings waste. Canadian journal of microbiology,
46(10), 927-37. Retrieved from http://www.ncbi.nlm.nih.gov/pubmed/11068680.
J.G, M., W.H, S., & R.G., C., with MacKinnon M.D. (2000). Water Quality Issue
Associated with Implementation of Composite Tailings (CT) Technology for
Managing Oil Sands Tailings. Proceedings of SWEMP 2000.Calgary. Alberta.
Kelly, E. N., Schindler, David W, Hodson, P. V., Short, J. W., Radmanovich, R., &
Nielsen, C. C. (2010). Oil sands development contributes elements toxic at low
concentrations to the Athabasca River and its tributaries. PNAS, 107, 16178-16183.
doi: 10.1073/pnas.1008754107/-
/DCSupplemental.www.pnas.org/cgi/doi/10.1073/pnas.1008754107.
Kelly, E. N., Short, J. W., Schindler, David W, Hodson, P. V., Ma, M., Kwan, A. K., et al.
(2009). Oil sands development contributes polycyclic aromatic compounds to the
Athabasca River and its tributaries. Proceedings of the National Academy of Sciences
of the United States of America, 106(52), 22346-51. doi: 10.1073/pnas.0912050106.
Kostenko, V., Ceri, H., & Martinuzzi, Robert John. (2007). Increased tolerance of
Staphylococcus aureus to vancomycin in viscous media. FEMS immunology and
medical microbiology, 51(2), 277-88. doi: 10.1111/j.1574-695X.2007.00300.x.
Kostenko, V., Salek, M. M., Sattari, P., & Martinuzzi, Robert John. (2010). Staphylococcus
aureus biofilm formation and tolerance to antibiotics in response to oscillatory shear
stresses of physiological levels. FEMS immunology and medical microbiology, 59(3),
421-31. doi: 10.1111/j.1574-695X.2010.00694.x.
Kostenko V, 2010 pers. comm. 30 Sept interview by author
Page 70
69
Kotlyar, L., Sparks, B., Woods, J., Capes, C., & Schutte, R. (1995). Biwetted ultrafine
solids and structure formation in oil sands fine tailings. Fuel, 74(9), 1363-1368. doi:
10.1016/0016-2361(95)00091-I.
Mackay, J. R. (1975). Reticulate Ice Veins in Permafrost, Northern Canada: Reply.
Canadian Geotechnical Journal, 12(1), 163-165. doi: 10.1139/t75-018.
Price, M. (2008). 11 MILLION LITRES A DAY THE TAR SANDS ’ LEAKING LEGACY.
PTAC. (2007). Water Use in Alberta Oil Sands. Water Innovation in the Oil Patch Forum.
Quagraine, E., Peterson, H., & Headley, J. (2005). In Situ Bioremediation of Naphthenic
Acids Contaminated Tailing Pond Waters in the Athabasca Oil Sands Region—
Demonstrated Field Studies and Plausible Options: A Review. Journal of
Environmental Science and Health, Part A: Toxic/Hazardous Substances &
Environmental Engineering, 40(3), 685-722. doi: 10.1081/ESE-200046649.
Schindler, D W, & Donahue, W. F. (2006). An mp nd n w t r r s s n C n d ʼs w st rn
prairie provinces. Proceedings of the National Academy of Sciences of the United
States of America, 103(19), 7210-6. doi: 10.1073/pnas.0601568103.
Siddique, T., Fedorak, Phillip M, MacKinnon, Michael D, & Foght, J. M. (2007).
Metabolism of BTEX and naphtha compounds to methane in oil sands tailings.
Environmental science & technology, 41(7), 2350-6. Retrieved from
http://www.ncbi.nlm.nih.gov/pubmed/17438786.
Syncrude. (2010). Tailings Management. Retrieved February 26, 2011, from
http://www.syncrude.ca/users/folder.asp?FolderID=5913.
Tenenbaum, D. J. (2009). Oil Sands Development: A health risk worth taking?
Environmental Health Perspectives, 117(4), A150-A156. doi:
10.1073/pnas.1008754107.
Yang, J. (2009). Computational Fluid Dynamics Modeling of Deposition of Oil Sand Slurry
into Mature Fine Tailings. Mechanical Engineering.