UNIVERSITY OF CALIFORNIA COOPERATIVE EXTENSION 2015 SAMPLE COSTS TO ESTABLISH AN ORANGE ORCHARD AND PRODUCE ORANGES Navels & Valencias SAN JOAQUIN VALLEY - South Low Volume Irrigation Prepared by Neil V. O'Connell UC Cooperative Extension Farm Advisor, Tulare County Craig E. Kallsen UC Cooperative Extension Farm Advisor, Kern County Karen M. Klonsky UC Cooperative Extension Economist, Department of Agricultural and Resource Economics, UC Davis Kabir P. Tumber UC Cooperative Extension Staff Research Associate, Department of Agricultural and Resource Economics, UC Davis
Transcript
UNIVERSITY OF CALIFORNIA COOPERATIVE EXTENSION
2015
SAMPLE COSTS TO ESTABLISH AN ORANGE ORCHARD AND PRODUCE
ORANGES Navels amp Valencias
SAN JOAQUIN VALLEY - South Low Volume Irrigation
Prepared by
Neil V OConnell UC Cooperative Extension Farm Advisor Tulare County Craig E Kallsen UC Cooperative Extension Farm Advisor Kern County Karen M Klonsky UC Cooperative Extension Economist Department of Agricultural and Resource
Economics UC Davis Kabir P Tumber UC Cooperative Extension Staff Research Associate Department of Agricultural and
Resource Economics UC Davis
UNIVERSITY OF CALIFORNIA COOPERATIVE EXTENSION
SAMPLE COST TO ESTABLISH an ORANGE ORCHARD and PRODUCE ORANGES
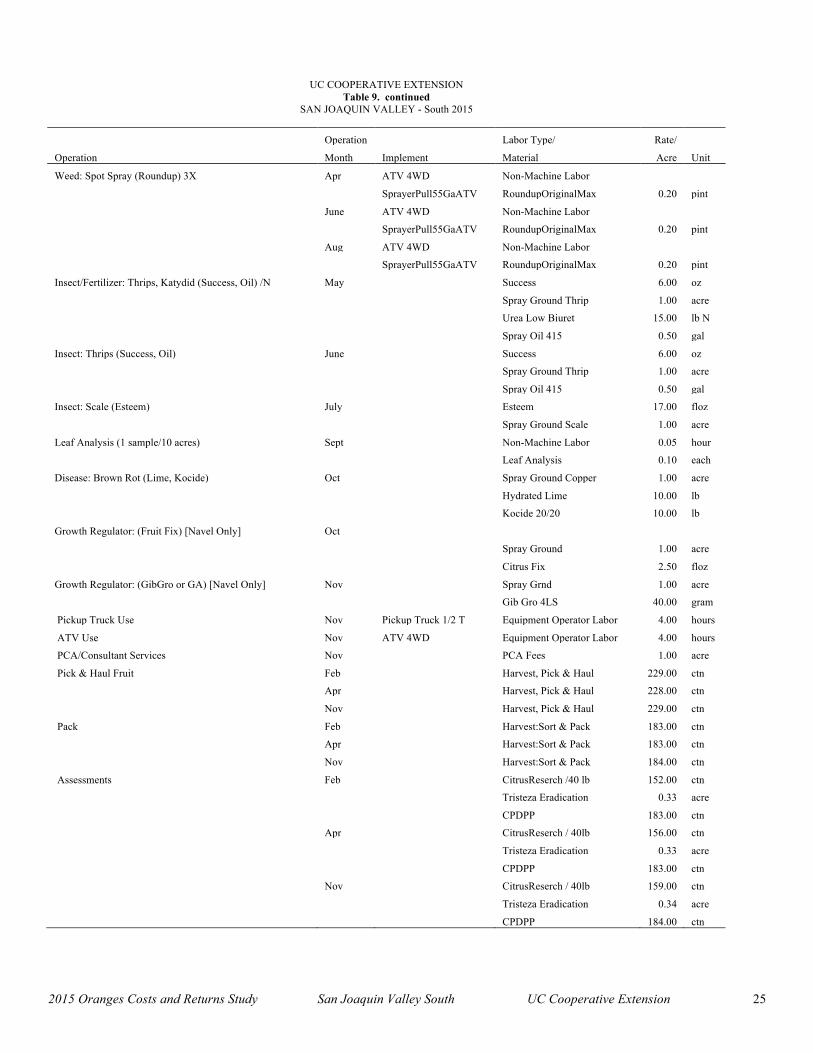
REFERENCES 13 Table 1 COSTS PER ACRE TO ESTABLISH AN ORANGE ORCHARD 14 Table 2 MATERIALS amp CUSTOM WORK COSTS PER ACRE ndash ESTABLISHMENT YEARS 16 Table 3 COSTS PER ACRE TO PRODUCE ORANGES 18 Table 4 COSTS AND RETURNS PER ACRE TO PRODUCE ORANGES 19 Table 5 MONTHLY PER ACRE CASH COSTS ndash ORANGES 21 Table 6 RANGING ANALYSIS 22 Table 7 WHOLE FARM EQUIPMENT INVESTMENT AND BUSINESS OVERHEAD COSTS 23 Table 8 HOURLY EQUIPMENT COSTS 23 Table 9 OPERATIONS WITH EQUIPMENT amp MATERIALS 24
INTRODUCTION
Sample costs to establish an orange orchard and produce oranges under low volume irrigation in the Southern San Joaquin Valley are presented in this study This study is intended as a guide only and can be used to make production decisions determine potential returns prepare budgets and evaluate production loans Practices described are based on production practices considered typical for the crop and area but will not apply to every situation Sample costs for labor materials equipment and custom services are based on current figures A blank column titled ldquoYour Costsrdquo in Tables 3 and 4 is provided to enter your costs
The hypothetical farm operation production practices overhead and calculations are described under the assumptions For additional information or an explanation of the calculations used in the study call the Department of Agricultural and Resource Economics University of California Davis (530) 752-5489 or your local UC Cooperative Extension office
Sample Cost of Production Studies for all current and many archived commodities are available at httpcoststudiesucdavisedu or can be requested from the Department of Agricultural and Resource Economics UC Davis (530) 752-1515 or obtained from selected county UC Cooperative Extension offices
The University of California is an affirmative actionequal opportunity employer The University of California and the United States Department of Agriculture cooperating
2015 Oranges Costs and Returns Study San Joaquin Valley South UC Cooperative Extension 2
ASSUMPTIONS
The assumptions refer to Tables 1 to 9 and pertain to sample costs to establish and produce oranges in the southern San Joaquin Valley The cultural practices shown represent production operations and materials considered typical of a well-managed orchard in the region Costs materials and practices in this study will not apply to all farms Timing of and types of cultural practices will vary among growers within the region and from season to season due to variables such as variety weather soil and insect and disease pressure For more details on citrus production practices see the 2014 University of California Cooperative Extension (UCCE) Citrus Production Manual The use of trade names and cultural practices in this report does not constitute an endorsement or recommendation by the University of California nor is any criticism implied by omission of other similar products or cultural practices
Land The hypothetical farm consists of 65 contiguous acres Establishment and production costs are based on ten acres being planted to oranges Mature orange trees are grown on 50 acres and the remaining five acres are roads equipment and shop area and homestead The grower owns and farms the orchards
Establishment Operating Costs Tables 1 amp 2
Land Preparation The orchard is established on ground previously planted to another tree crop Land preparation begins by removing the old orchard Orchard removal costs include pushing stacking and burning or shredding the trees and a hand cleanup of the area After removal deep ripping of the soil profile 4 to 6 feet deep is done to break up stratified layers that affect root and water penetration The ground is disced two times to break up large clods and then leveled (triplaned) All land preparation operations are contracted and done in the year prior to planting Contracted or custom operation costs will vary depending upon acreage size Small acres (10 in this case) may have a minimum fee or additional equipment delivery charges Some of these costs are included in this study
Planting Planting the orchard starts by marking tree sites (layout orchard) Holes are then dug and the trees planted in March The trunks are wrapped with a foam wrap to shield them from sunburn and to reduce sucker development Also two percent of the trees 2 trees per acre are assumed to be replaced in the second year
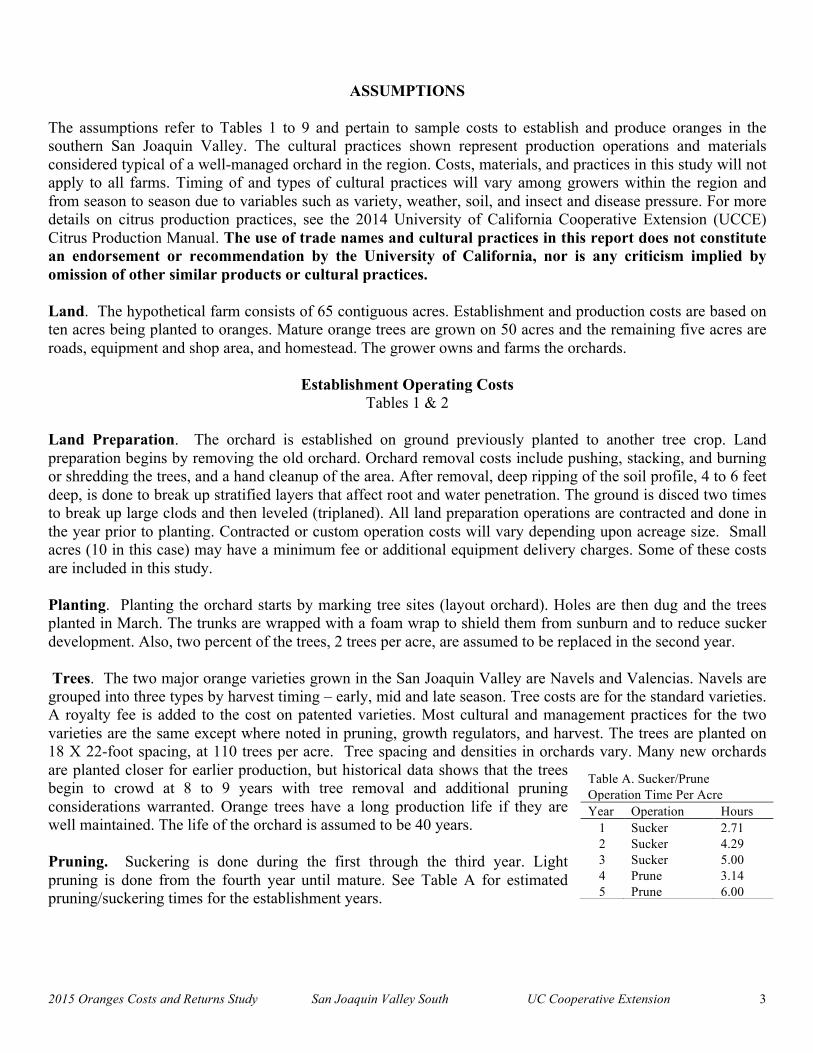
Trees The two major orange varieties grown in the San Joaquin Valley are Navels and Valencias Navels are grouped into three types by harvest timing ndash early mid and late season Tree costs are for the standard varieties A royalty fee is added to the cost on patented varieties Most cultural and management practices for the two varieties are the same except where noted in pruning growth regulators and harvest The trees are planted on 18 X 22-foot spacing at 110 trees per acre Tree spacing and densities in orchards vary Many new orchards are planted closer for earlier production but historical data shows that the trees Table A SuckerPrune begin to crowd at 8 to 9 years with tree removal and additional pruning Operation Time Per Acre considerations warranted Orange trees have a long production life if they are Year Operation Hours well maintained The life of the orchard is assumed to be 40 years 1 Sucker 271
2 Sucker 429 Pruning Suckering is done during the first through the third year Light 3 Sucker 500
4 Prune 314 pruning is done from the fourth year until mature See Table A for estimated 5 Prune 600 pruningsuckering times for the establishment years
2015 Oranges Costs and Returns Study San Joaquin Valley South UC Cooperative Extension 3
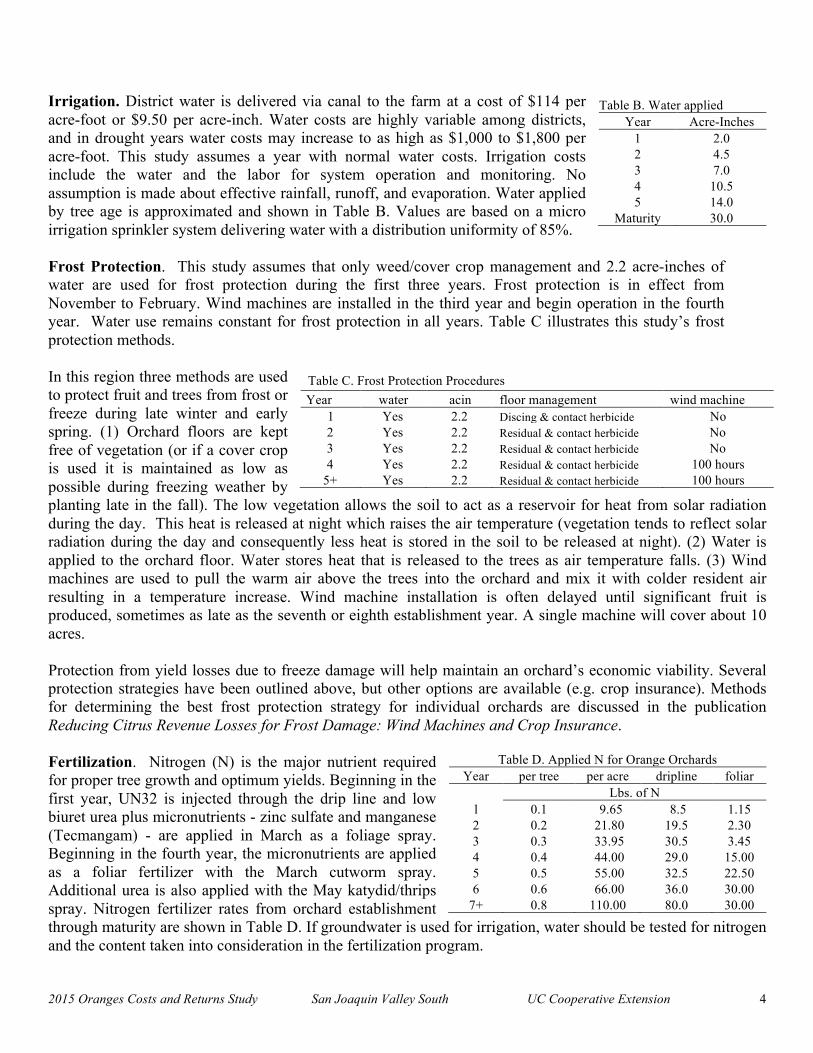
Irrigation District water is delivered via canal to the farm at a cost of $114 per Table B Water applied acre-foot or $950 per acre-inch Water costs are highly variable among districts Year Acre-Inches and in drought years water costs may increase to as high as $1000 to $1800 per 1 20 acre-foot This study assumes a year with normal water costs Irrigation costs 2 45 include the water and the labor for system operation and monitoring No 3 70
4 105 assumption is made about effective rainfall runoff and evaporation Water applied 5 140 by tree age is approximated and shown in Table B Values are based on a micro Maturity 300 irrigation sprinkler system delivering water with a distribution uniformity of 85
Frost Protection This study assumes that only weedcover crop management and 22 acre-inches of water are used for frost protection during the first three years Frost protection is in effect from November to February Wind machines are installed in the third year and begin operation in the fourth year Water use remains constant for frost protection in all years Table C illustrates this studyrsquos frost protection methods
In this region three methods are used Table C Frost Protection Procedures to protect fruit and trees from frost or Year water acin floor management wind machine freeze during late winter and early 1 Yes 22 Discing amp contact herbicide No spring (1) Orchard floors are kept 2 Yes 22 Residual amp contact herbicide No free of vegetation (or if a cover crop 3 Yes 22 Residual amp contact herbicide No
4 Yes 22 Residual amp contact herbicide 100 hours is used it is maintained as low as 5+ Yes 22 Residual amp contact herbicide 100 hours possible during freezing weather by
planting late in the fall) The low vegetation allows the soil to act as a reservoir for heat from solar radiation during the day This heat is released at night which raises the air temperature (vegetation tends to reflect solar radiation during the day and consequently less heat is stored in the soil to be released at night) (2) Water is applied to the orchard floor Water stores heat that is released to the trees as air temperature falls (3) Wind machines are used to pull the warm air above the trees into the orchard and mix it with colder resident air resulting in a temperature increase Wind machine installation is often delayed until significant fruit is produced sometimes as late as the seventh or eighth establishment year A single machine will cover about 10 acres
Protection from yield losses due to freeze damage will help maintain an orchardrsquos economic viability Several protection strategies have been outlined above but other options are available (eg crop insurance) Methods for determining the best frost protection strategy for individual orchards are discussed in the publication Reducing Citrus Revenue Losses for Frost Damage Wind Machines and Crop Insurance
Fertilization Nitrogen (N) is the major nutrient required Table D Applied N for Orange Orchards for proper tree growth and optimum yields Beginning in the Year per tree per acre dripline foliar
Lbs of N first year UN32 is injected through the drip line and low l 01 965 85 115 biuret urea plus micronutrients - zinc sulfate and manganese 2 02 2180 195 230
(Tecmangam) - are applied in March as a foliage spray 3 03 3395 305 345 Beginning in the fourth year the micronutrients are applied 4 04 4400 290 1500 as a foliar fertilizer with the March cutworm spray 5 05 5500 325 2250 Additional urea is also applied with the May katydidthrips 6 06 6600 360 3000 spray Nitrogen fertilizer rates from orchard establishment 7+ 08 11000 800 3000
through maturity are shown in Table D If groundwater is used for irrigation water should be tested for nitrogen and the content taken into consideration in the fertilization program
2015 Oranges Costs and Returns Study San Joaquin Valley South UC Cooperative Extension 4
LeafTissue Sampling Leaf samples are taken by the PCA sometime from August through October for nutrition analysis For this study one sample per 10 acres is taken
Soil Amendments Beginning in the fifth year soluble gypsum is applied through the drip lines during each irrigation A total of one-ton per acre per year is applied each season Gypsum calcium or lime is applied for improving water infiltration and soil pH and use should be based on soil and water tests Although not included in this study compost may be added to enhance soil organic matter
Pest Management The pesticides and rates mentioned in this cost study as well as other materials available are listed in UC Integrated Pest Management Guidelines Citrus Pesticides mentioned in the study are commonly used but are not presented as a recommendation
Weeds Chemical weed control begins the first year with three spot sprays (April June August) in the tree row during the spring and summer using Roundup herbicide In the first year a custom operator discs the floor middles three times (April May June) From the second year on residualpre-emergent herbicides Karmex and Princep are applied to the orchard floor in the fall (October) and in the spring (March) using half of the maximum rate for each application These materials are regulated under the Groundwater Protection Regulations and under some conditions may require a pesticide permit from the agricultural commissionerrsquos office
Insects Insects treated in this study are citrus thrips (Scirtothrips citri) katydids (Scudderia furcata) and larvae of Lepidoptera species (orangeworms) such as citrus cutworm (Xylomyges curialis) See UC IPM website httpipmucdaviseduPMGselectnewpestcitrushtml for full orangeworm list Control for citrus thrips citrus cutworms and katydids begin in the fourth year Citrus cutworms are controlled (generally required every other year) in March with one application of Dipel insecticide Pesticides are applied at a lower volume per acre in the early years to account for the small tree size In the fourth year 50 and in the fifth 75 of the recommended spray volume is applied Thrips and katydids are treated with Success insecticide plus oil in May at petal fall Although a common industry practice is to apply multiple sprays on non-bearing trees for thrips protection in this study begins in the fourth year for fruit protection rather than foliage protection California red scale (Aonidiella aurantii) is not treated on young trees as it is only an economic problem when found on the fruit
Fire ant (Solenopsis xyloni) control may be needed through the third year especially if nests are still present Clinch or Esteem ant bait is applied in late spring to early summer (May in this study) with the grower owned ATV and a bait applicator furnished by the chemical company After careful monitoring spot treatments with Lorsban may be needed but are not included in this study
Diseases Beginning in October of the third year brown rot (Phytophthora spp) and septoria spot (Septoria spp) are managed with a Kocide (copper) and hydrated lime application A custom applicator applies the insect and disease materials by ground with an air blast sprayer Various export markets require additional cooper spray applications but this study does not include this
Nematodes and phytophthora Nematodes (Tylenchulus semipenetrans) phytophthora root rot (Phytophthora citrophthora and P parasitica) and phytophthora gummosis (Phytophthora ssp) can be severe problems If the field was previously planted to citrus phytophthora and nematode samples should be taken to detect the presence and population levels of the organisms prior to planting Management strategies include resistant rootstocks irrigation management and chemical applications All pest management strategies need to be tailored to meet specific orchard requirements and should be discussed with a certified pest control adviser or local farm advisor
2015 Oranges Costs and Returns Study San Joaquin Valley South UC Cooperative Extension 5
+
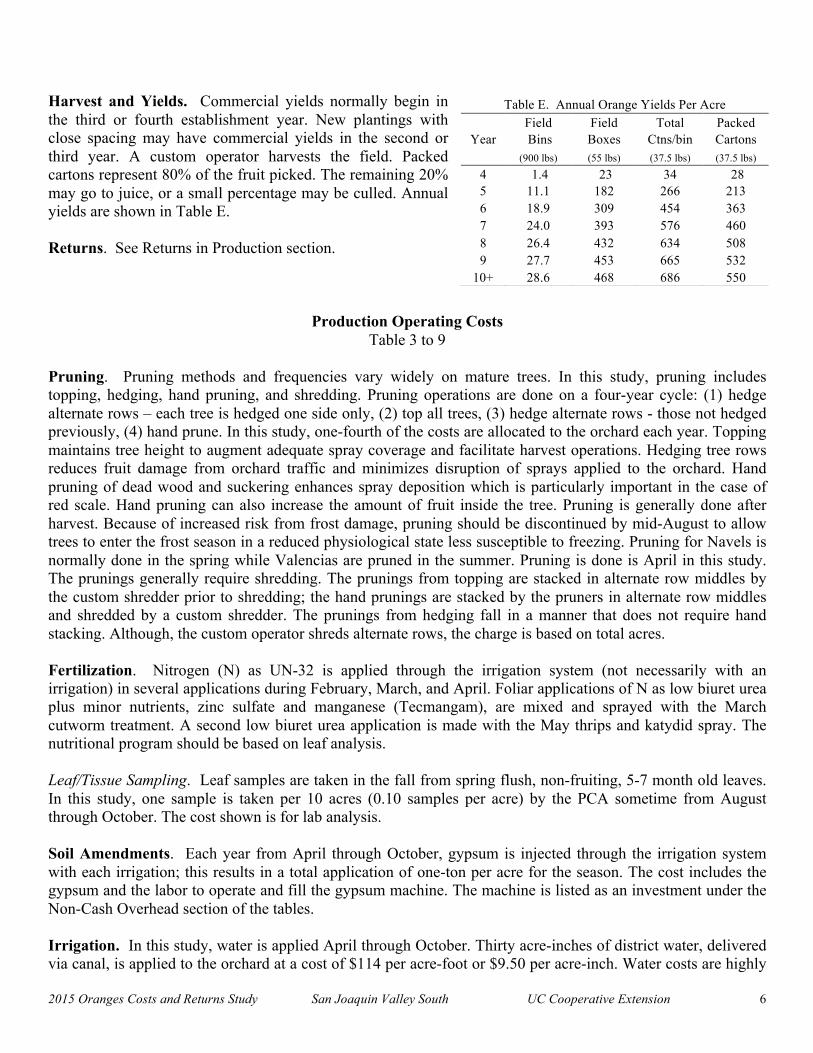
Harvest and Yields Commercial yields normally begin in Table E Annual Orange Yields Per Acre the third or fourth establishment year New plantings with Field Field Total Packed close spacing may have commercial yields in the second or Year Bins Boxes Ctnsbin Cartons third year A custom operator harvests the field Packed (900 lbs) (55 lbs) (375 lbs) (375 lbs)
cartons represent 80 of the fruit picked The remaining 20 4 14 23 34 28 may go to juice or a small percentage may be culled Annual 5 111 182 266 213 yields are shown in Table E 6 189 309 454 363
7 240 393 576 460 8 264 432 634 508Returns See Returns in Production section 9 277 453 665 532
10+ 286 468 686 550
Production Operating Costs Table 3 to 9
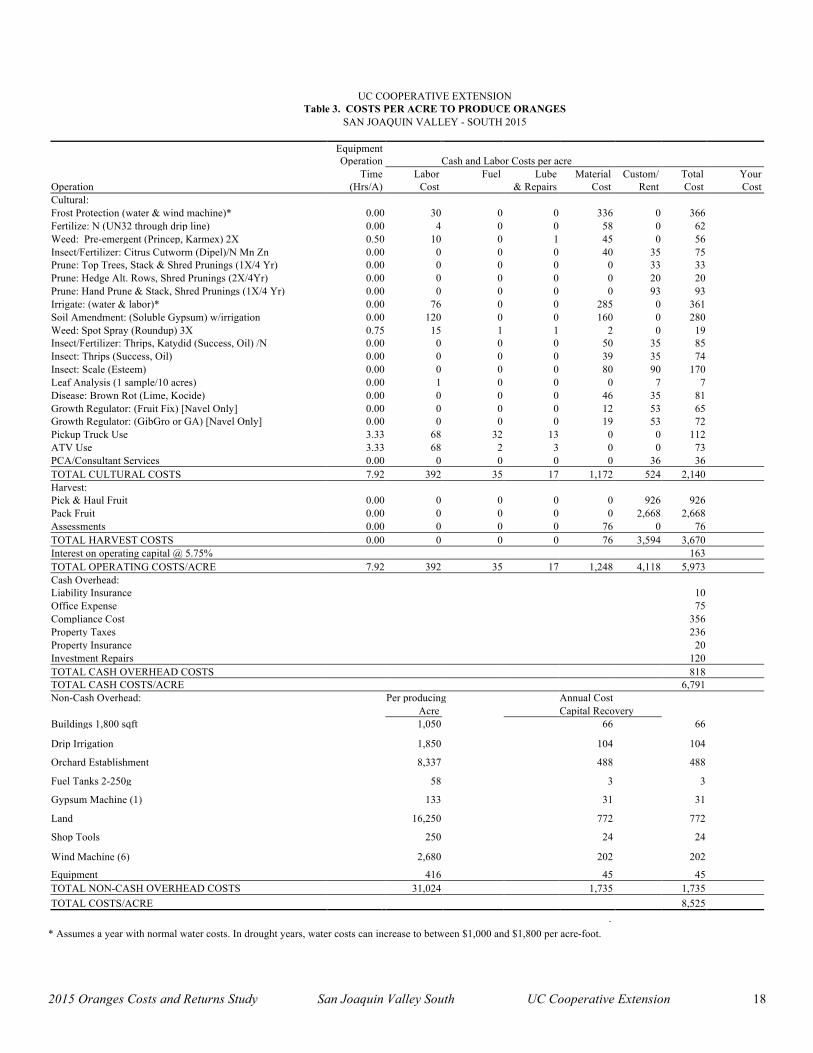
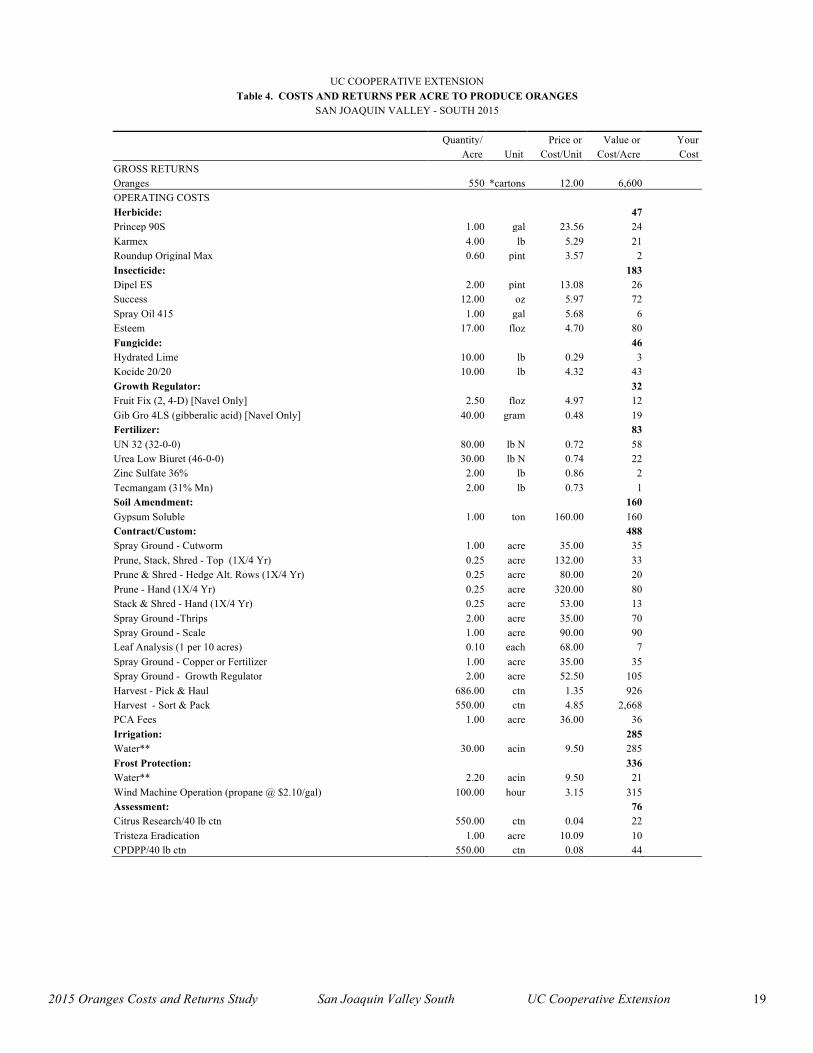
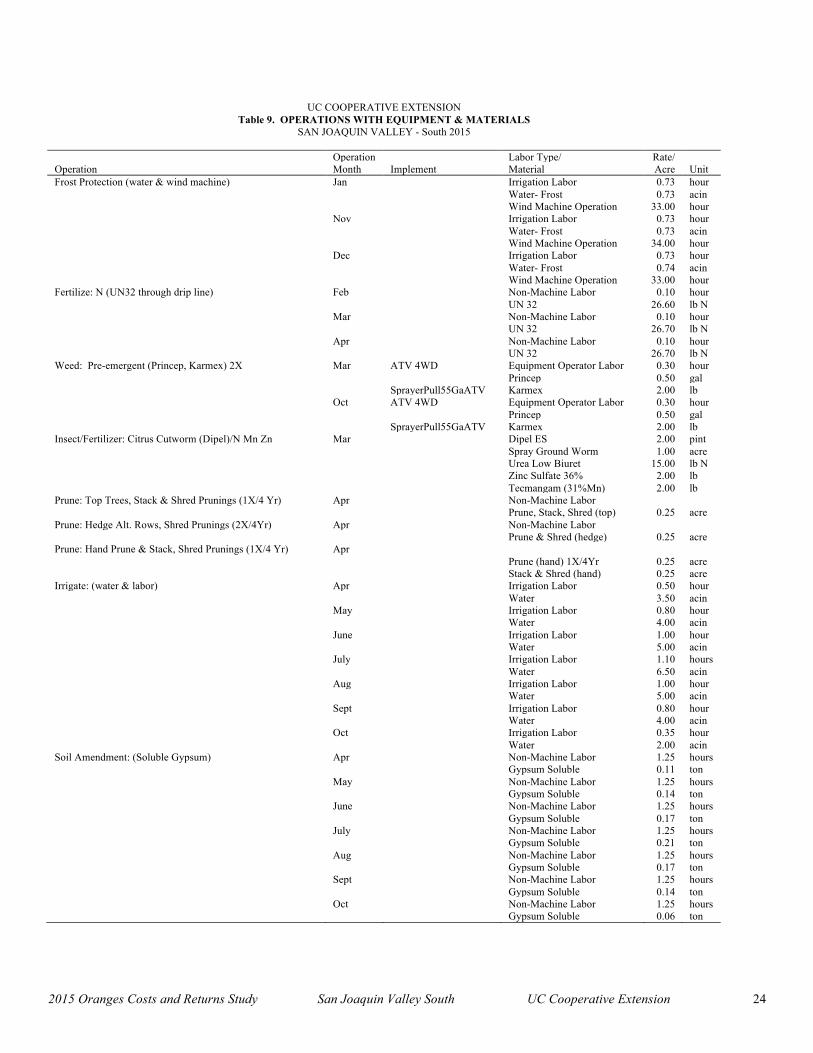
Pruning Pruning methods and frequencies vary widely on mature trees In this study pruning includes topping hedging hand pruning and shredding Pruning operations are done on a four-year cycle (1) hedge alternate rows ndash each tree is hedged one side only (2) top all trees (3) hedge alternate rows - those not hedged previously (4) hand prune In this study one-fourth of the costs are allocated to the orchard each year Topping maintains tree height to augment adequate spray coverage and facilitate harvest operations Hedging tree rows reduces fruit damage from orchard traffic and minimizes disruption of sprays applied to the orchard Hand pruning of dead wood and suckering enhances spray deposition which is particularly important in the case of red scale Hand pruning can also increase the amount of fruit inside the tree Pruning is generally done after harvest Because of increased risk from frost damage pruning should be discontinued by mid-August to allow trees to enter the frost season in a reduced physiological state less susceptible to freezing Pruning for Navels is normally done in the spring while Valencias are pruned in the summer Pruning is done is April in this study The prunings generally require shredding The prunings from topping are stacked in alternate row middles by the custom shredder prior to shredding the hand prunings are stacked by the pruners in alternate row middles and shredded by a custom shredder The prunings from hedging fall in a manner that does not require hand stacking Although the custom operator shreds alternate rows the charge is based on total acres
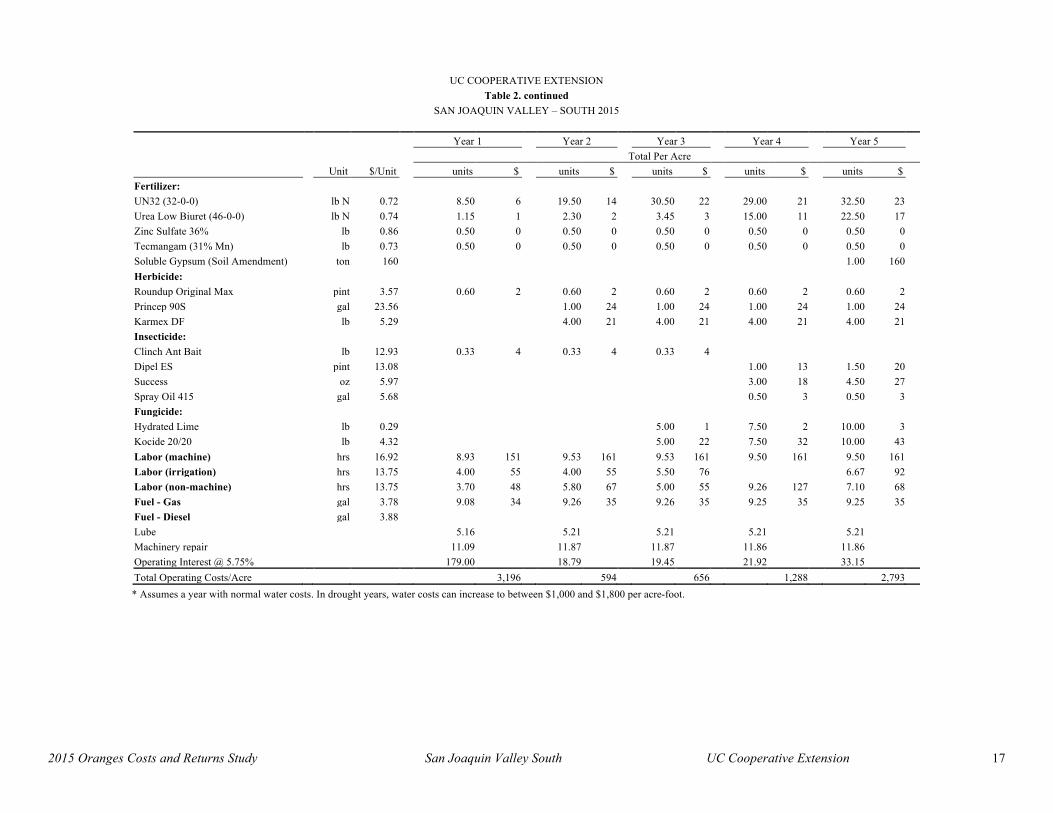
Fertilization Nitrogen (N) as UN-32 is applied through the irrigation system (not necessarily with an irrigation) in several applications during February March and April Foliar applications of N as low biuret urea plus minor nutrients zinc sulfate and manganese (Tecmangam) are mixed and sprayed with the March cutworm treatment A second low biuret urea application is made with the May thrips and katydid spray The nutritional program should be based on leaf analysis
LeafTissue Sampling Leaf samples are taken in the fall from spring flush non-fruiting 5-7 month old leaves In this study one sample is taken per 10 acres (010 samples per acre) by the PCA sometime from August through October The cost shown is for lab analysis
Soil Amendments Each year from April through October gypsum is injected through the irrigation system with each irrigation this results in a total application of one-ton per acre for the season The cost includes the gypsum and the labor to operate and fill the gypsum machine The machine is listed as an investment under the Non-Cash Overhead section of the tables
Irrigation In this study water is applied April through October Thirty acre-inches of district water delivered via canal is applied to the orchard at a cost of $114 per acre-foot or $950 per acre-inch Water costs are highly
2015 Oranges Costs and Returns Study San Joaquin Valley South UC Cooperative Extension 6
variable among districts and the cost used is approximately mid-range From grower and district information costs may be as low as $90 per acre-foot or as high as $250 per acre-foot in non-drought years In drought years growers may pay between $1000 and $1800 per acre-foot This study assumes a year with normal water costs No assumption is made about effective rainfall runoff evaporation winter water requirements or rainfall stored in the soil profile tree size or tree health The irrigation operation costs include the water and labor for irrigating operating and monitoring the system
Frost Protection Protection is required from late winter to early spring (November through February) and is shown for November December and January In this study chemical vegetation control on the orchard floor and 22 acre-inches of water are used for frost protection during the season Also wind machines are operated on nights with threatening minimum temperatures (see Table C) Each wind machine protects approximately 10 acres and uses 15 gallons of propane ($210 per gallon) per hour The frost protection cost includes the fuel use and labor to operate the machines and to apply the water
Pest Management The pesticides and rates mentioned in this cost study are listed in UC Integrated Pest Management Guidelines Citrus Pest Management Guidelines For more information on other pesticides available pest identification monitoring and management visit the UC IPM website at wwwipmucdavisedu For information and pesticide use permits contact the local county agricultural commissioners office Growers with fruit destined for the export market must use registered products that meet maximum residue limits (MRL) for that country Check the MRLs at wwwcalcitrusqualityorg
Pest Control Adviser (PCA) Written recommendations are required for many pesticides and are made by licensed PCAs In addition the PCA can monitor the field for agronomic problems including pests and nutrition Growers may hire private PCAs or receive the service as part of a service agreement with an agricultural chemical and fertilizer company In this study a private PCA monitors the crops for pest disease and nutrition
Weeds Pre-emergent herbicides (Karmex Princep) are applied to the orchard floor (tree row and middles) in split applications one in the fall (October) and one in the spring (March) using one-half the maximum rate per application Surviving weeds are controlled with three spot sprays ndash April June August ndash with Roundup Karmex and Princep are regulated under the Groundwater Protection Regulations Check with your farm advisor or PCA prior to applying
Insects Citrus cutworms are sprayed primarily in March with Dipel insecticide Citrus thrips and katydids are treated in May and citrus thrips only in June Success insecticide and oil are used in both applications Urea and micronutrients are mixed with the cutworm spray and urea only with the thrips and katydid spray A spray is applied in July for California red scale and citricola scale alternating each year with Esteem (insect growth regulator) and Lorsban Esteem controls red scale only and Lorsban controls both scales All insect and disease treatments are applied by a commercial applicator The custom application costs vary by pest material applied volume of water used and sprayer speed The grower should alternate materials in order to reduce the potential for the development of insect resistance to pesticides used
Disease Brown rot is the primary preharvest disease of fruit that occurs in this study and is controlled by spraying a Kocide (copper) and hydrated lime mixture during October or November The same fungicide mixture also controls Septoria spot Brown rot develops in the fall initially on fruit that is close to the ground The pathogen is normally found in the soil and is splashed onto the low hanging fruit by rain Symptoms usually appear during cool wet periods on mature or nearly mature fruit
2015 Oranges Costs and Returns Study San Joaquin Valley South UC Cooperative Extension 7
Snails Brown garden snails (Helix aspera) cause fruit damage Control options for brown garden snails include predaceous snails skirt pruning trunk banding and chemical baits However in this study snails are assumed not to be a problem
Insect and Disease Management Options There are two fundamental approaches to using synthetic pesticides in citrus production (1) Several applications of broad-spectrum pesticides are made to prevent pest damage While these pesticides control a wide range of insect and mite pests and persist to provide control for long periods of time these attributes can also create additional pest problems Long-term use has increased pest resistance to many of these pesticides resulting in increased pesticide applications Since broad-spectrum pesticides affect many species of insects and mites those sprays decrease the levels of beneficial populations that can assist in controlling many pests Pest resurgence and secondary outbreaks can be the result of parasite and predator suppression by these pesticide applications For example treatment for citrus cutworms or citrus thrips can cause an increase of citrus red mite (2) Use of selective pesticides and natural enemies (beneficial predators) as control measures Selective pesticides are toxic to a narrow range of pests and are usually less harmful to the natural enemies Their use requires careful monitoring of pests and more precise timing and application to be effective Many selective pesticides do not persist for long-term control Preserving beneficial predatory and parasitic populations can reduce the potential resurgence and secondary outbreaks of pests However some minor pests such as citricola scale may become economic pests once broad spectrum pesticides are not used Pest management practices used in this study follow the first strategy described (currently this is the more typical pest management program used in this region)
Growth Regulators for Navels Growth regulators are applied to mature Navel orange trees only Gibberellic acid (Gib Gro) and 2 4-D (Citrus Fix) treatments are made on mid-to-late harvested Navels Gibberellic acid maintains a juvenile rind and 24-D applied in OctoberNovember minimizes pre-harvest fruit drop In this study gibberellic acid (GA) is sprayed in October and 24-D in November Growth regulators are applied to 70 of the orchard because 30 of the orchard was picked earlier
Harvest Orange trees typically reach full production by the 10th or 11th year In this cost study the crop is hand picked and hauled by a contracted harvesting company
Typically one-third of the orchard is picked in each of three harvests over the growing season Navels are normally harvested from November to June while Valencias are harvested April through September Oranges are hand picked and put into field bins that hold 900 pounds (24 carton equivalent) of fruit The oranges are hauled from the field to a packinghouse where they are washed graded sized and packed Picking hauling packing and marketing costs from the field to the packinghouse are paid by the grower Current rates for these services vary picking and hauling costs are $135 per carton and the packinghouse cost is $485 per carton Delivering outside the local area will increase hauling costs The packing house cost includes costs for the carton packing marketing and miscellaneous fees charged by the packer The costs are based on typical costs as received from packinghouses and growers in the region
Yields Typical annual yields for the Navel and Valencia varieties are measured in 900-pound field bins per acre but are typically sold by packed cartons weighing 375 pounds although the industry often refers to them as 40-pound cartons A 900-pound bin is calculated as either 23 or 24 cartons Packed cartons represent 80 of the fruit picked The remaining 20 may go to juice or a small percentage may be culled
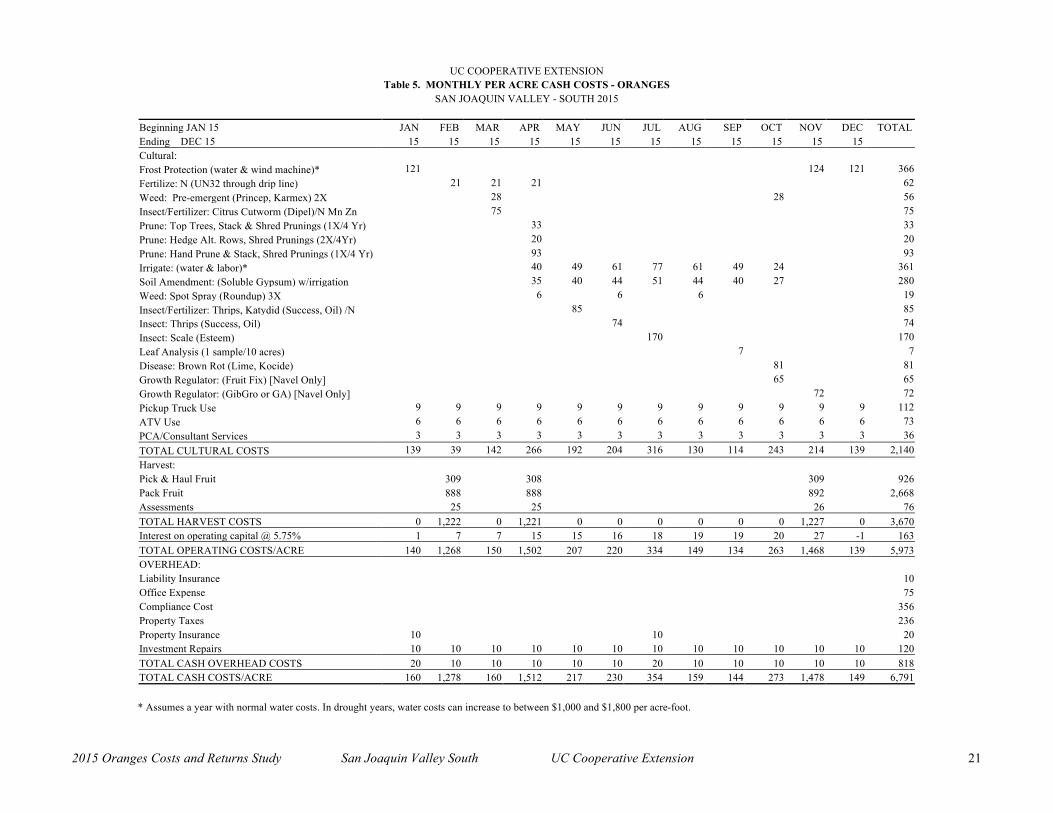
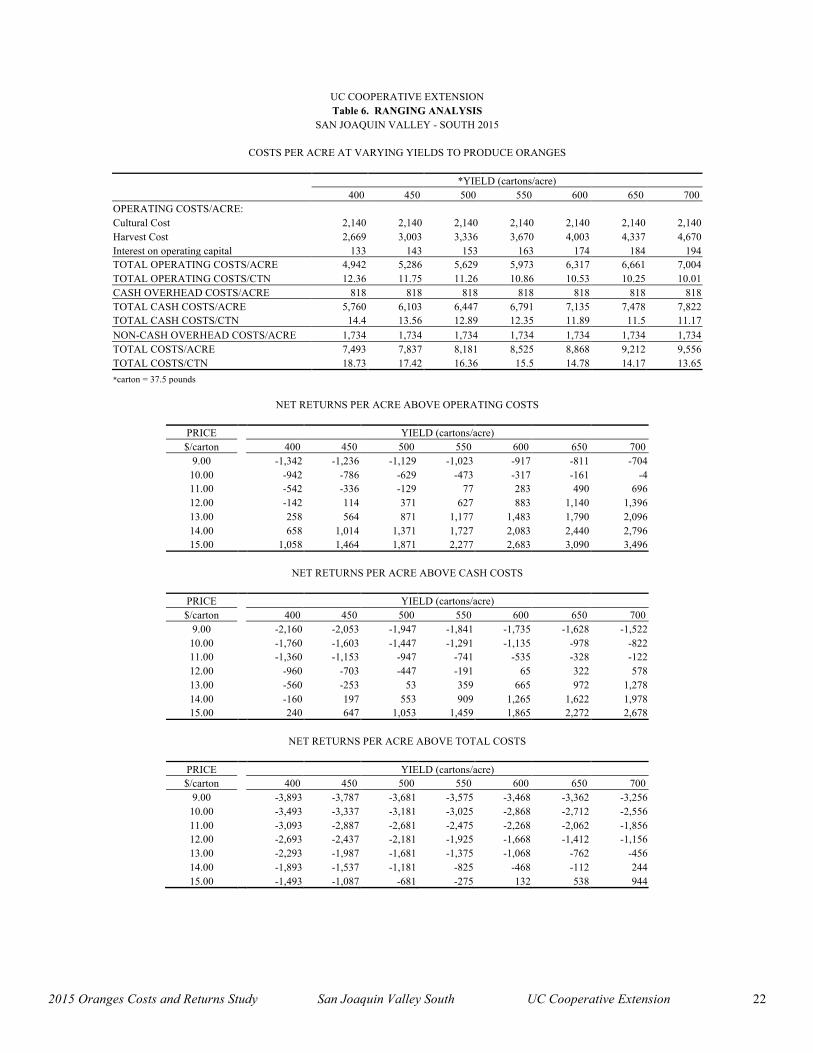
Returns An estimated price based on past returns of $12 per carton fob packinghouse is used in this study There is basically no income for juice products in Navels but there may be a small amount in Valencias Returns over a range of yields are shown in Table 6
2015 Oranges Costs and Returns Study San Joaquin Valley South UC Cooperative Extension 8
Assessments Commercial orange producers pay three assessments
Citrus Pest and Disease Prevention Program (CPDPP) The CPDPP was created to advise the Agricultural Secretary of California and the agricultural industry about efforts to combat serious pests and diseases that threaten Californiarsquos citrus crop Growers must pay a mandatory fee of $008 per 40-pound carton to support the disease prevention program
State Marketing Order Under a state marketing order mandatory assessment fees are collected and administered by the grower-directed Citrus Research Board This assessment currently $004 per 40 lb carton is used to fund industry research programs
Central California Tristeza Eradication Agency Tristeza disease can result in damage ranging from lower fruit quality to the death of the tree The Central California Tristeza Eradication Agency (CCTEA) manages an eradication program to keep the Central Valley tristeza-free The assessment varies by pest control district and not all districts participate Although not all growers participate in this program and pay assessments an average of $1009 per acre is charged in this study The charges are paid in the property assessment bill but are shown as an assessment line item cost in this study
PickupATV The grower uses a pickup for business and personal use It is assumed that 5000 miles are for business use An all terrain vehicle (ATV) is used for checking and monitoring the field irrigating and checking the irrigation system The cost is estimated and not based on any specific data The grower also uses the ATV for weed control and the operation cost is included in that cost
Labor Equipment and Interest
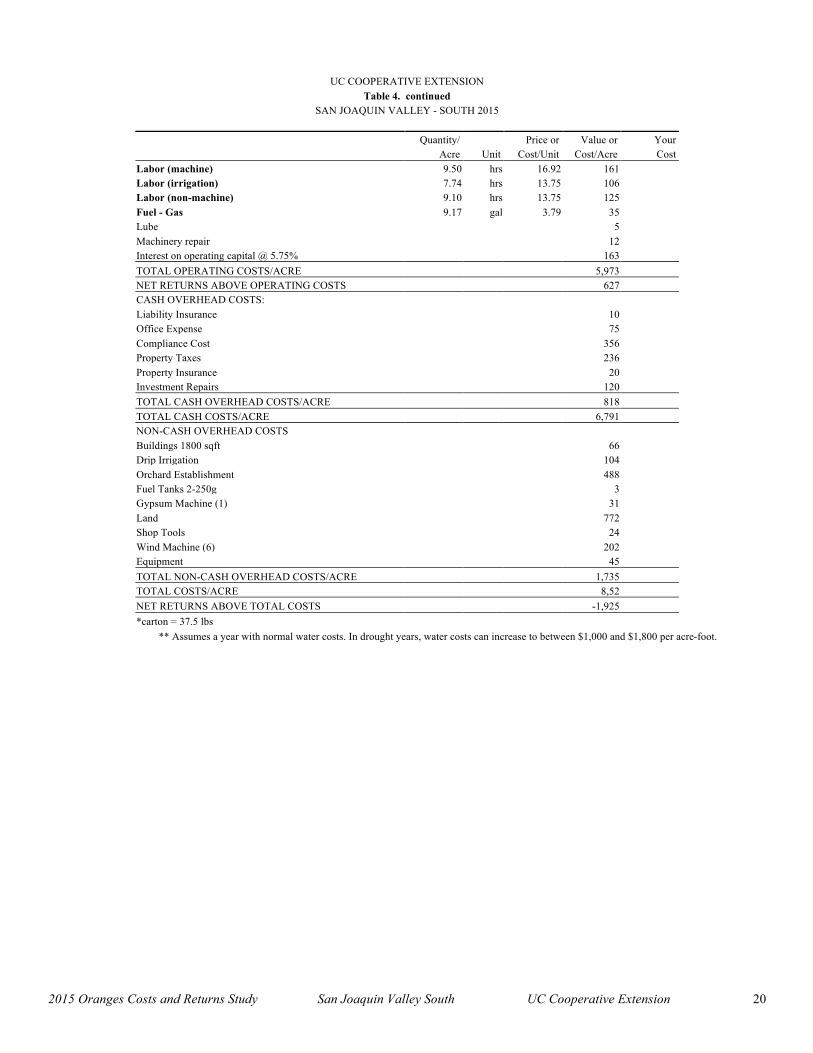
Labor Labor rates of $1692 per hour for machine operators and $1375 for general labor includes payroll overhead of 41 The basic hourly wages are $1200 for machine operators and $975 for general labor The overhead includes the employersrsquo share of federal and California state payroll taxes workers compensation insurance for orchardfruit crops (code 0016) and a percentage for other possible benefits Workersrsquo compensation costs will vary among growers but for this study the cost is based upon the average industry final rate as of March 1 2014 (personal e-mail from California Department of Insurance March 2015 unreferenced) Labor for operations involving machinery are 20 higher than the operation time given in Table 3 to account for the extra labor involved in equipment set up moving maintenance work breaks and field repair
Wages for management are not included as a cash cost Any return above total costs is considered a return to management and risk However growers wanting to account for management may wish to add a fee The manager makes all production decisions including cultural practices action to be taken on pest management recommendations and labor
Equipment Operating Costs Repair costs are based on purchase price annual hours of use total hours of life and repair coefficients formulated by American Society of Agricultural Engineers (ASAE) Fuel and lubrication costs are also determined by ASAE equations based on maximum Power Take Off (PTO) horsepower and fuel type Prices for on-farm delivery of red dye diesel and gasoline are $388 (excludes excise tax) and $379 per gallon respectively Fuel costs are derived from the Energy Information Administration averaging January to December 2014 fuel prices The cost includes a 2 local sales tax on diesel fuel and 8 sales tax on gasoline Gasoline also includes federal and state excise tax which are refundable for on-farm use when filing your income taxes The fuel lube and repair cost per acre for each operation in Table 3 is determined by multiplying the total hourly operating cost in Table 7 for each piece of equipment used for the selected operation by the hours per acre Tractor time is 10 higher than implement time for a given operation to account for setup travel and down time 2015 Oranges Costs and Returns Study San Joaquin Valley South UC Cooperative Extension 9
Interest On Operating Capital Interest on operating capital is based on cash operating costs and is calculated monthly until harvest at a nominal rate of 575 per year A nominal interest rate is the typical market cost of borrowed funds The interest cost of post harvest operations is discounted back to the last harvest month using a negative interest charge The interest rate will vary depending upon various factors The rate is this study is considered a typical lending rate by a farm lending agency as of January 2015
Risk The risks associated with crop production should not be minimized While this study makes every effort to model a production system based on typical real world practices it cannot fully represent financial agronomic and market risks which affect profitability and economic viability Crop insurance is a risk management tool available to growers
Cash Overhead Costs
Cash overhead consists of various cash expenses paid out during the year that are assigned to the whole farm and not to a particular operation
Property Taxes Counties charge a base property tax rate of 1 on the assessed value of the property In some counties special assessment districts exist and charge additional taxes on property including equipment buildings and improvements For this study county taxes are calculated as 1 of the average value of the property Average value equals new cost plus salvage value divided by 2 on a per acre basis
Insurance Insurance for farm investments varies depending on the assets included and the amount of coverage Property insurance provides coverage for property loss and is charged at 0843 of the average value of the assets over their useful life Liability insurance covers accidents on the farm and costs $638 for the entire farm
Crop Insurance Crop insurance is available to growers but is not included as a cost in this study
Office Expense Office and business expenses are estimated at $75 per acre These expenses include office supplies telephones bookkeeping accounting legal fees shop and office utilities and miscellaneous administrative charges
ManagementSupervisor Salaries The grower farms the orchard so no cash cost is allocated to management Returns above costs are considered a return to management
Compliance Costs Compliance costs are estimated by a study conducted for California Citrus Mutual examining compliance costs for citrus production across California The study estimates total compliance cost per acre at $35620 which includes education and training air quality compliance water quality compliance pesticide regulation labor regulation and capital expenditures
Investment Repairs Annual maintenance is calculated as 2 of the purchase price except orchard establishment is calculated at 050 to account for tree replacement and orchard repairs
2015 Oranges Costs and Returns Study San Joaquin Valley South UC Cooperative Extension 10
Non-Cash Overhead Costs
Non-cash overhead is calculated as the capital recovery cost for equipment and other farm investments
Capital Recovery Costs Capital recovery cost is the annual depreciation and interest costs for a capital investment It is the amount of money required each year to recover the difference between the purchase price and salvage value (unrecovered capital) It is equivalent to the annual payment on a loan for the investment with the down payment equal to the discounted salvage value This is a more complex method of calculating ownership costs than straight-line depreciation and opportunity costs but more accurately represents the annual costs of ownership because it takes the time value of money into account (Boehlje and Eidman) The formula for the calculation of the annual capital recovery costs is ((Purchase Price ndash Salvage Value) x Capital Recovery Factor) + (Salvage Value x Interest Rate)
Salvage Value Salvage value is an estimate of the remaining value of an investment at the end of its useful life For farm machinery (tractors and implements) the remaining value is a percentage of the new cost of the investment (Boehlje and Eidman) The percent remaining value is calculated from equations developed by the American Society of Agricultural Engineers (ASAE) based on equipment type and years of life The life in years is estimated by dividing the wear out life as given by ASAE by the annual hours of use in this operation For other investments including irrigation systems buildings and miscellaneous equipment the value at the end of its useful life is zero The salvage value for land is the purchase price because land does not depreciate
Capital Recovery Factor Capital recovery factor is the amortization factor or annual payment whose present value at compound interest is 1 The amortization factor is a table value that corresponds to the interest rate used and the life of the machine
Interest Rate An interest rate of 475 is used to calculate capital recovery The rate will vary depending upon loan amount and other lending agency conditions but is the basic suggested rate by a farm lending agency as of January 2015
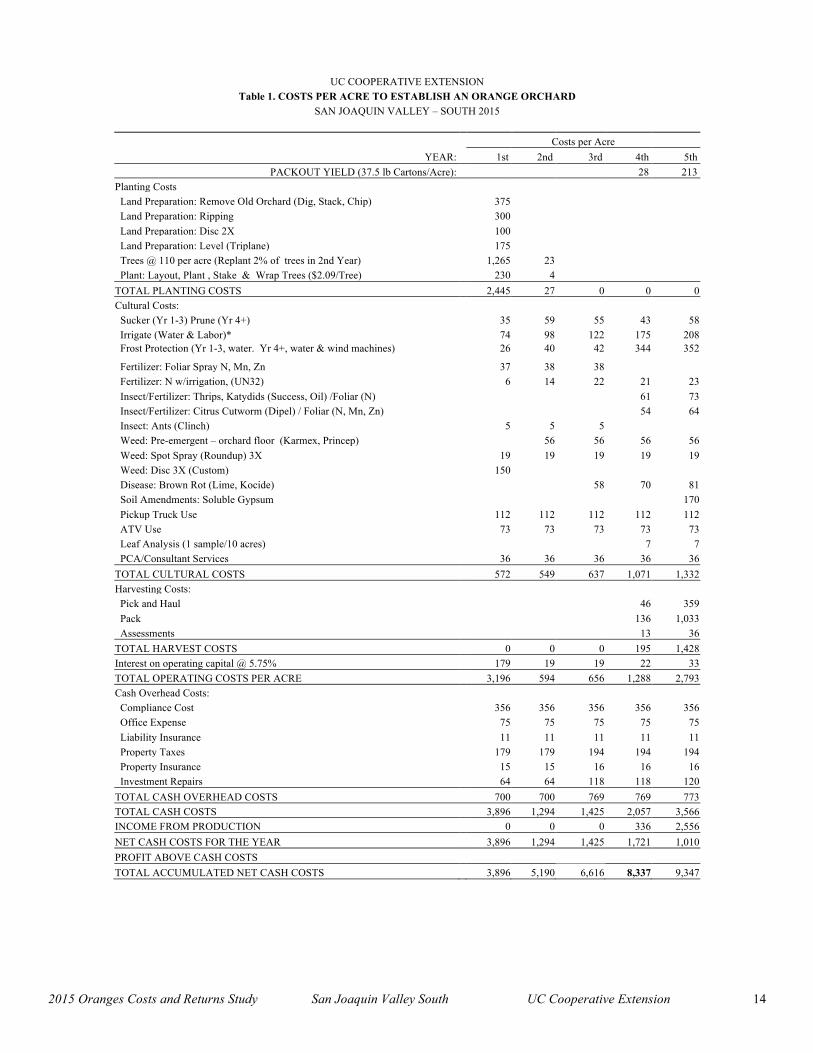
Establishment Cost Costs to establish the orchard are used to determine capital recovery expenses depreciation and interest on investment for the production years Establishment cost is the sum of the costs for land preparation planting trees cash overhead and production expenses for growing the trees through the first year that oranges are harvested minus any returns from production The ldquoTotal Accumulated Net Cash Costrdquo on Table 1 in the fourth year represents the establishment cost For this study the cost is $8337 per acre or $83370 for the 10-acre orchard The establishment cost is spread over the remaining 36 years of the 40 years the orchard is in production Establishment costs in this study are based on typical basic operations but can vary considerably depending upon terrain soil type local regulations and other factors For example development on marginal soils will require additional land preparation and soil amendments ManagementDevelopment companies will have additional labor costs
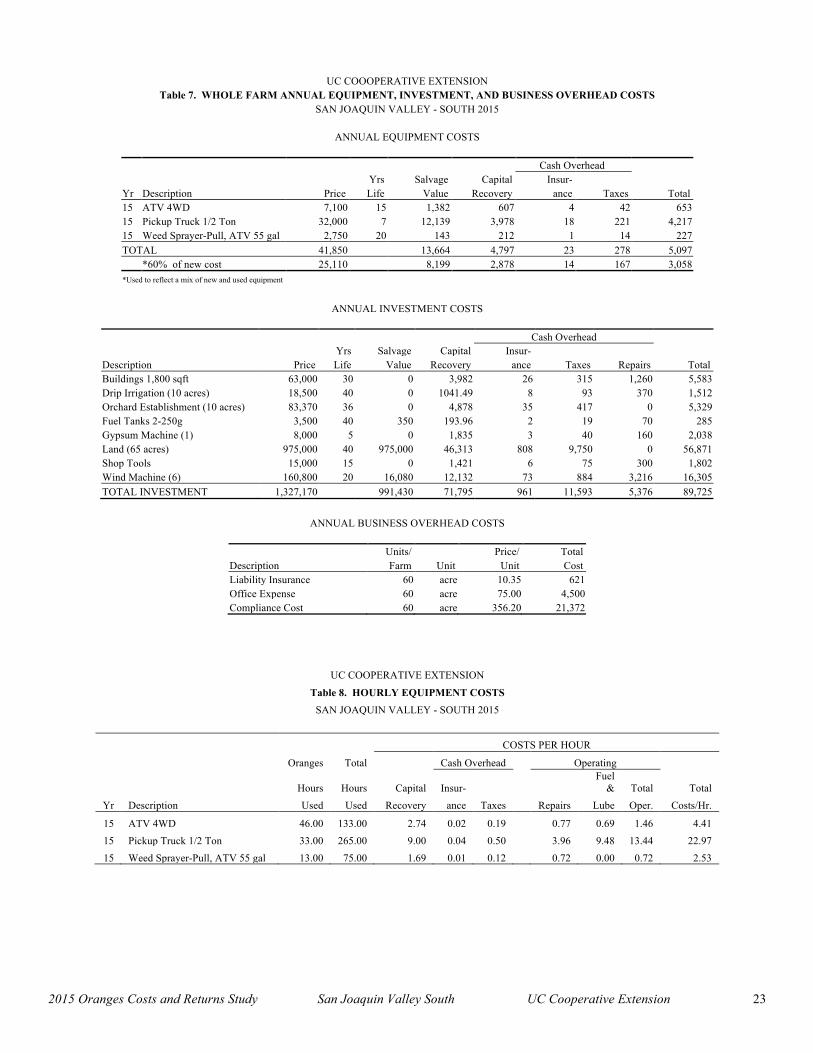
Irrigation System Water is delivered under pressure to the orchard through a low-volume irrigation system Low-volume emitters discharge 10 gallons per hour and are spaced at one per tree The cost for the low-volume irrigation system includes the cost of a pump filtration system hoses emitters and installation The life of the irrigation system is estimated at 40 years The above ground portion of the irrigation system will probably have to be replaced once per ten years but is not separated out in this study
2015 Oranges Costs and Returns Study San Joaquin Valley South UC Cooperative Extension 11
Land 2014 land values for bare or row crop land in Kern and Tulare Counties range between $8000 to $18000 per acre (Trends amp Leases) depending on available water Land with citrus orchards ranges from $14000 to $24000 per acre Current real estate listings for bare land values range from $15000 to $20000 per acre The land on which the orchard is planted in this study is valued at $15000 per acre Building The shop building is a 1800 square foot metal building or buildings on a cement slab
Tools This includes shop tools hand tools and miscellaneous field tools such as pruning tools The value is estimated and not taken from any specific data
Fuel Tanks Two 250-gallon fuel tanks using gravity feed are on metal stands The tanks are setup in a cement containment pad that meets federal state and county regulations
Wind Machines Each machine will cover approximately 10-acres The cost includes six machines on the farm with one being in the new planting and five on the remaining acres Cost includes installation of the propane-powered machines The machines are assumed to use 15 gallons of propane per hour
Gypsum Machine The machine is used to inject the soluble gypsum into the irrigation system The machine costs are allocated to the 10-acres of newly established oranges
Equipment Farm equipment is purchased new or used but the study shows the current purchase price for new equipment The new purchase price is adjusted to 60 to indicate a mix of new and used equipment Equipment costs are composed of three parts non-cash overhead cash overhead and operating costs Both of the overhead factors have been discussed in previous sections The operating costs consist of repairs fuel and lubrication and are discussed under operating costs
Table Values Due to rounding the totals may be slightly different from the sum of the components
2015 Oranges Costs and Returns Study San Joaquin Valley South UC Cooperative Extension 12
REFERENCES
American Society of Agricultural Engineers 1992 American Society of Agricultural Engineers Standards Yearbook St Joseph MI
American Society of Farm Managers and Rural Appraisers 2014 Trends in Agricultural Land amp Lease Values California Chapter of the American Society of Farms Managers and Rural Appraisers
Boehlje Michael D and Vernon R Eidman 1984 Farm Management John Wiley and Sons New York NY
California State Board of Equalization 2015 Fuel Tax Division Tax Rates Internet accessed January 2015 httpwwwboecagovsptaxprogspftdrateshtm
Dreistadt Steve 2012 Integrated Pest Management for Citrus Third Edition University of California Statewide Integrated Pest Management Program ANR
Energy Information Administration 2015 Gasoline and Diesel Fuel Update Internet accessed January 2014 httptontoeiadoegovooginfogdugasdieselasp
Ferguson L E Grafton-Cardwell 2014 Citrus Production Manual University of California Agriculture and Natural Resources
Hamilton Lynn 2006 Comparing Californiarsquos Cost of Regulation to Other States A Case Study Approach for Agriculture California Institute for the Study of Specialty Crops
OrsquoConnell Neil V Craig E Kallsen Karen M Klonsky and Richard L De Moura 2009 Sample Costs to Establish an Orange Orchard and Produce Oranges Navels amp Valencias San Joaquin Valley South University of California Cooperative Extension Department of Agricultural and Resource Economics Davis CA
University of California Statewide Integrated Pest Management Program UC Integrated Pest Management Guidelines Citrus 2014 University of California Davis CA httpwwwipmucdaviseduPMGselectnewpestcitrushtml
Venner Raymond and Steven C Blank 1995 Reducing Citrus Revenue Losses From Frost Damage Wind Machines and Crop Insurance Giannini Foundation Information Series No 95-1 University of Calif Oakland CA
2015 Oranges Costs and Returns Study San Joaquin Valley South UC Cooperative Extension 13
UC COOPERATIVE EXTENSION Table 1 COSTS PER ACRE TO ESTABLISH AN ORANGE ORCHARD
Land Preparation Remove Old Orchard (Dig Stack Chip) 375 Land Preparation Ripping 300 Land Preparation Disc 2X 100 Land Preparation Level (Triplane) 175 Trees 110 per acre (Replant 2 of trees in 2nd Year) 1265 23 Plant Layout Plant Stake amp Wrap Trees ($209Tree) 230 4
TOTAL CASH OVERHEAD COSTS 700 700 769 769 773 TOTAL CASH COSTS 3896 1294 1425 2057 3566 INCOME FROM PRODUCTION 0 0 0 336 2556 NET CASH COSTS FOR THE YEAR 3896 1294 1425 1721 1010 PROFIT ABOVE CASH COSTS TOTAL ACCUMULATED NET CASH COSTS 3896 5190 6616 8337 9347
2015 Oranges Costs and Returns Study San Joaquin Valley South UC Cooperative Extension 14
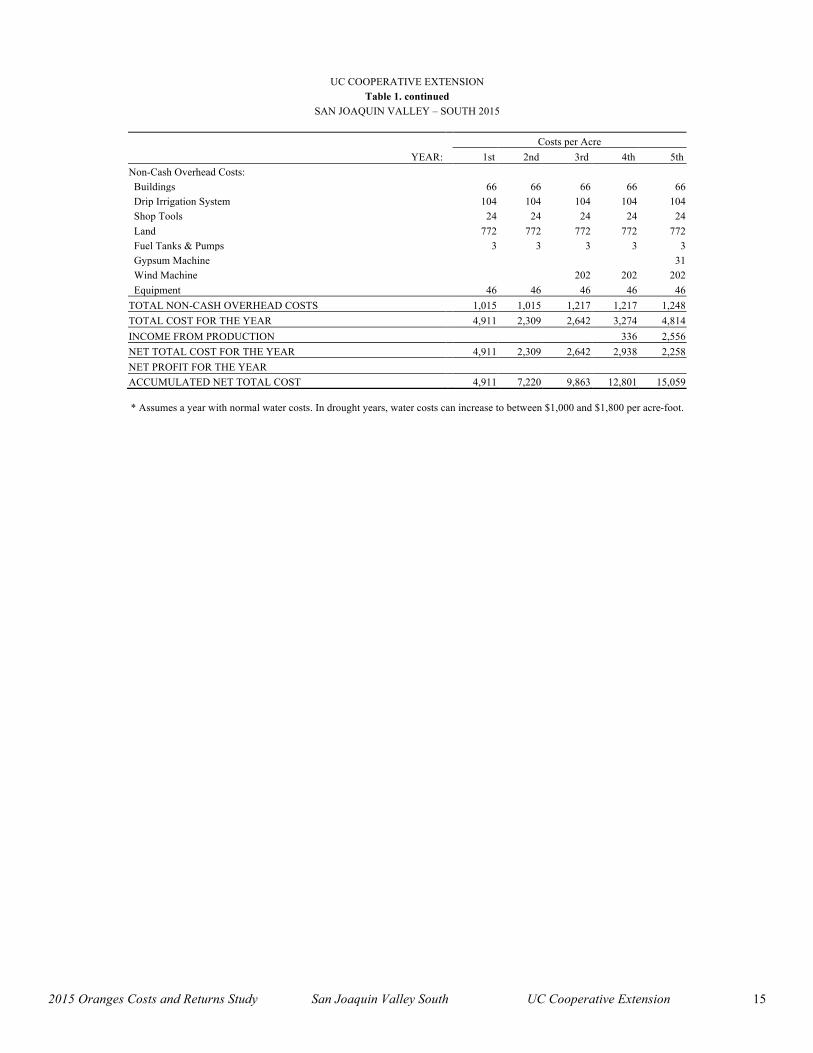
TOTAL NON-CASH OVERHEAD COSTS 1015 1015 1217 1217 1248 TOTAL COST FOR THE YEAR 4911 2309 2642 3274 4814 INCOME FROM PRODUCTION 336 2556 NET TOTAL COST FOR THE YEAR 4911 2309 2642 2938 2258 NET PROFIT FOR THE YEAR ACCUMULATED NET TOTAL COST 4911 7220 9863 12801 15059
Assumes a year with normal water costs In drought years water costs can increase to between $1000 and $1800 per acre-foot
2015 Oranges Costs and Returns Study San Joaquin Valley South UC Cooperative Extension 15
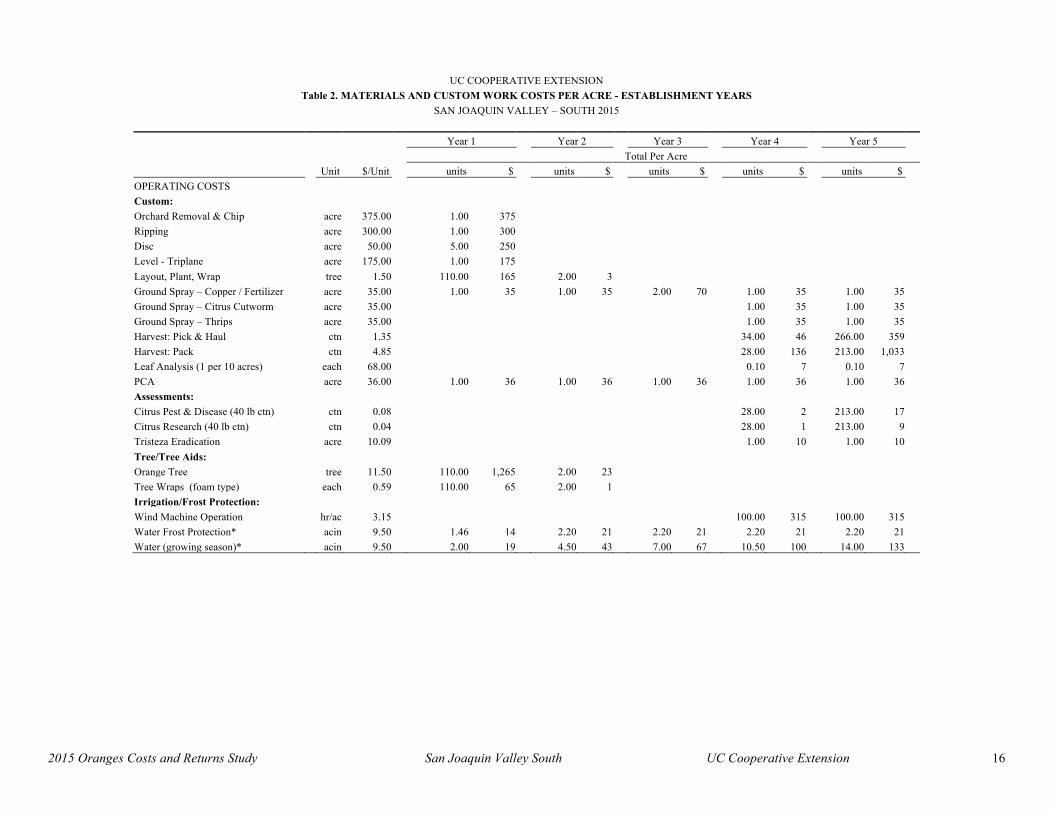
UC COOPERATIVE EXTENSION Table 2 MATERIALS AND CUSTOM WORK COSTS PER ACRE - ESTABLISHMENT YEARS
REFERENCES 13 Table 1 COSTS PER ACRE TO ESTABLISH AN ORANGE ORCHARD 14 Table 2 MATERIALS amp CUSTOM WORK COSTS PER ACRE ndash ESTABLISHMENT YEARS 16 Table 3 COSTS PER ACRE TO PRODUCE ORANGES 18 Table 4 COSTS AND RETURNS PER ACRE TO PRODUCE ORANGES 19 Table 5 MONTHLY PER ACRE CASH COSTS ndash ORANGES 21 Table 6 RANGING ANALYSIS 22 Table 7 WHOLE FARM EQUIPMENT INVESTMENT AND BUSINESS OVERHEAD COSTS 23 Table 8 HOURLY EQUIPMENT COSTS 23 Table 9 OPERATIONS WITH EQUIPMENT amp MATERIALS 24
INTRODUCTION
Sample costs to establish an orange orchard and produce oranges under low volume irrigation in the Southern San Joaquin Valley are presented in this study This study is intended as a guide only and can be used to make production decisions determine potential returns prepare budgets and evaluate production loans Practices described are based on production practices considered typical for the crop and area but will not apply to every situation Sample costs for labor materials equipment and custom services are based on current figures A blank column titled ldquoYour Costsrdquo in Tables 3 and 4 is provided to enter your costs
The hypothetical farm operation production practices overhead and calculations are described under the assumptions For additional information or an explanation of the calculations used in the study call the Department of Agricultural and Resource Economics University of California Davis (530) 752-5489 or your local UC Cooperative Extension office
Sample Cost of Production Studies for all current and many archived commodities are available at httpcoststudiesucdavisedu or can be requested from the Department of Agricultural and Resource Economics UC Davis (530) 752-1515 or obtained from selected county UC Cooperative Extension offices
The University of California is an affirmative actionequal opportunity employer The University of California and the United States Department of Agriculture cooperating
2015 Oranges Costs and Returns Study San Joaquin Valley South UC Cooperative Extension 2
ASSUMPTIONS
The assumptions refer to Tables 1 to 9 and pertain to sample costs to establish and produce oranges in the southern San Joaquin Valley The cultural practices shown represent production operations and materials considered typical of a well-managed orchard in the region Costs materials and practices in this study will not apply to all farms Timing of and types of cultural practices will vary among growers within the region and from season to season due to variables such as variety weather soil and insect and disease pressure For more details on citrus production practices see the 2014 University of California Cooperative Extension (UCCE) Citrus Production Manual The use of trade names and cultural practices in this report does not constitute an endorsement or recommendation by the University of California nor is any criticism implied by omission of other similar products or cultural practices
Land The hypothetical farm consists of 65 contiguous acres Establishment and production costs are based on ten acres being planted to oranges Mature orange trees are grown on 50 acres and the remaining five acres are roads equipment and shop area and homestead The grower owns and farms the orchards
Establishment Operating Costs Tables 1 amp 2
Land Preparation The orchard is established on ground previously planted to another tree crop Land preparation begins by removing the old orchard Orchard removal costs include pushing stacking and burning or shredding the trees and a hand cleanup of the area After removal deep ripping of the soil profile 4 to 6 feet deep is done to break up stratified layers that affect root and water penetration The ground is disced two times to break up large clods and then leveled (triplaned) All land preparation operations are contracted and done in the year prior to planting Contracted or custom operation costs will vary depending upon acreage size Small acres (10 in this case) may have a minimum fee or additional equipment delivery charges Some of these costs are included in this study
Planting Planting the orchard starts by marking tree sites (layout orchard) Holes are then dug and the trees planted in March The trunks are wrapped with a foam wrap to shield them from sunburn and to reduce sucker development Also two percent of the trees 2 trees per acre are assumed to be replaced in the second year
Trees The two major orange varieties grown in the San Joaquin Valley are Navels and Valencias Navels are grouped into three types by harvest timing ndash early mid and late season Tree costs are for the standard varieties A royalty fee is added to the cost on patented varieties Most cultural and management practices for the two varieties are the same except where noted in pruning growth regulators and harvest The trees are planted on 18 X 22-foot spacing at 110 trees per acre Tree spacing and densities in orchards vary Many new orchards are planted closer for earlier production but historical data shows that the trees Table A SuckerPrune begin to crowd at 8 to 9 years with tree removal and additional pruning Operation Time Per Acre considerations warranted Orange trees have a long production life if they are Year Operation Hours well maintained The life of the orchard is assumed to be 40 years 1 Sucker 271
2 Sucker 429 Pruning Suckering is done during the first through the third year Light 3 Sucker 500
4 Prune 314 pruning is done from the fourth year until mature See Table A for estimated 5 Prune 600 pruningsuckering times for the establishment years
2015 Oranges Costs and Returns Study San Joaquin Valley South UC Cooperative Extension 3
Irrigation District water is delivered via canal to the farm at a cost of $114 per Table B Water applied acre-foot or $950 per acre-inch Water costs are highly variable among districts Year Acre-Inches and in drought years water costs may increase to as high as $1000 to $1800 per 1 20 acre-foot This study assumes a year with normal water costs Irrigation costs 2 45 include the water and the labor for system operation and monitoring No 3 70
4 105 assumption is made about effective rainfall runoff and evaporation Water applied 5 140 by tree age is approximated and shown in Table B Values are based on a micro Maturity 300 irrigation sprinkler system delivering water with a distribution uniformity of 85
Frost Protection This study assumes that only weedcover crop management and 22 acre-inches of water are used for frost protection during the first three years Frost protection is in effect from November to February Wind machines are installed in the third year and begin operation in the fourth year Water use remains constant for frost protection in all years Table C illustrates this studyrsquos frost protection methods
In this region three methods are used Table C Frost Protection Procedures to protect fruit and trees from frost or Year water acin floor management wind machine freeze during late winter and early 1 Yes 22 Discing amp contact herbicide No spring (1) Orchard floors are kept 2 Yes 22 Residual amp contact herbicide No free of vegetation (or if a cover crop 3 Yes 22 Residual amp contact herbicide No
4 Yes 22 Residual amp contact herbicide 100 hours is used it is maintained as low as 5+ Yes 22 Residual amp contact herbicide 100 hours possible during freezing weather by
planting late in the fall) The low vegetation allows the soil to act as a reservoir for heat from solar radiation during the day This heat is released at night which raises the air temperature (vegetation tends to reflect solar radiation during the day and consequently less heat is stored in the soil to be released at night) (2) Water is applied to the orchard floor Water stores heat that is released to the trees as air temperature falls (3) Wind machines are used to pull the warm air above the trees into the orchard and mix it with colder resident air resulting in a temperature increase Wind machine installation is often delayed until significant fruit is produced sometimes as late as the seventh or eighth establishment year A single machine will cover about 10 acres
Protection from yield losses due to freeze damage will help maintain an orchardrsquos economic viability Several protection strategies have been outlined above but other options are available (eg crop insurance) Methods for determining the best frost protection strategy for individual orchards are discussed in the publication Reducing Citrus Revenue Losses for Frost Damage Wind Machines and Crop Insurance
Fertilization Nitrogen (N) is the major nutrient required Table D Applied N for Orange Orchards for proper tree growth and optimum yields Beginning in the Year per tree per acre dripline foliar
Lbs of N first year UN32 is injected through the drip line and low l 01 965 85 115 biuret urea plus micronutrients - zinc sulfate and manganese 2 02 2180 195 230
(Tecmangam) - are applied in March as a foliage spray 3 03 3395 305 345 Beginning in the fourth year the micronutrients are applied 4 04 4400 290 1500 as a foliar fertilizer with the March cutworm spray 5 05 5500 325 2250 Additional urea is also applied with the May katydidthrips 6 06 6600 360 3000 spray Nitrogen fertilizer rates from orchard establishment 7+ 08 11000 800 3000
through maturity are shown in Table D If groundwater is used for irrigation water should be tested for nitrogen and the content taken into consideration in the fertilization program
2015 Oranges Costs and Returns Study San Joaquin Valley South UC Cooperative Extension 4
LeafTissue Sampling Leaf samples are taken by the PCA sometime from August through October for nutrition analysis For this study one sample per 10 acres is taken
Soil Amendments Beginning in the fifth year soluble gypsum is applied through the drip lines during each irrigation A total of one-ton per acre per year is applied each season Gypsum calcium or lime is applied for improving water infiltration and soil pH and use should be based on soil and water tests Although not included in this study compost may be added to enhance soil organic matter
Pest Management The pesticides and rates mentioned in this cost study as well as other materials available are listed in UC Integrated Pest Management Guidelines Citrus Pesticides mentioned in the study are commonly used but are not presented as a recommendation
Weeds Chemical weed control begins the first year with three spot sprays (April June August) in the tree row during the spring and summer using Roundup herbicide In the first year a custom operator discs the floor middles three times (April May June) From the second year on residualpre-emergent herbicides Karmex and Princep are applied to the orchard floor in the fall (October) and in the spring (March) using half of the maximum rate for each application These materials are regulated under the Groundwater Protection Regulations and under some conditions may require a pesticide permit from the agricultural commissionerrsquos office
Insects Insects treated in this study are citrus thrips (Scirtothrips citri) katydids (Scudderia furcata) and larvae of Lepidoptera species (orangeworms) such as citrus cutworm (Xylomyges curialis) See UC IPM website httpipmucdaviseduPMGselectnewpestcitrushtml for full orangeworm list Control for citrus thrips citrus cutworms and katydids begin in the fourth year Citrus cutworms are controlled (generally required every other year) in March with one application of Dipel insecticide Pesticides are applied at a lower volume per acre in the early years to account for the small tree size In the fourth year 50 and in the fifth 75 of the recommended spray volume is applied Thrips and katydids are treated with Success insecticide plus oil in May at petal fall Although a common industry practice is to apply multiple sprays on non-bearing trees for thrips protection in this study begins in the fourth year for fruit protection rather than foliage protection California red scale (Aonidiella aurantii) is not treated on young trees as it is only an economic problem when found on the fruit
Fire ant (Solenopsis xyloni) control may be needed through the third year especially if nests are still present Clinch or Esteem ant bait is applied in late spring to early summer (May in this study) with the grower owned ATV and a bait applicator furnished by the chemical company After careful monitoring spot treatments with Lorsban may be needed but are not included in this study
Diseases Beginning in October of the third year brown rot (Phytophthora spp) and septoria spot (Septoria spp) are managed with a Kocide (copper) and hydrated lime application A custom applicator applies the insect and disease materials by ground with an air blast sprayer Various export markets require additional cooper spray applications but this study does not include this
Nematodes and phytophthora Nematodes (Tylenchulus semipenetrans) phytophthora root rot (Phytophthora citrophthora and P parasitica) and phytophthora gummosis (Phytophthora ssp) can be severe problems If the field was previously planted to citrus phytophthora and nematode samples should be taken to detect the presence and population levels of the organisms prior to planting Management strategies include resistant rootstocks irrigation management and chemical applications All pest management strategies need to be tailored to meet specific orchard requirements and should be discussed with a certified pest control adviser or local farm advisor
2015 Oranges Costs and Returns Study San Joaquin Valley South UC Cooperative Extension 5
+
Harvest and Yields Commercial yields normally begin in Table E Annual Orange Yields Per Acre the third or fourth establishment year New plantings with Field Field Total Packed close spacing may have commercial yields in the second or Year Bins Boxes Ctnsbin Cartons third year A custom operator harvests the field Packed (900 lbs) (55 lbs) (375 lbs) (375 lbs)
cartons represent 80 of the fruit picked The remaining 20 4 14 23 34 28 may go to juice or a small percentage may be culled Annual 5 111 182 266 213 yields are shown in Table E 6 189 309 454 363
7 240 393 576 460 8 264 432 634 508Returns See Returns in Production section 9 277 453 665 532
10+ 286 468 686 550
Production Operating Costs Table 3 to 9
Pruning Pruning methods and frequencies vary widely on mature trees In this study pruning includes topping hedging hand pruning and shredding Pruning operations are done on a four-year cycle (1) hedge alternate rows ndash each tree is hedged one side only (2) top all trees (3) hedge alternate rows - those not hedged previously (4) hand prune In this study one-fourth of the costs are allocated to the orchard each year Topping maintains tree height to augment adequate spray coverage and facilitate harvest operations Hedging tree rows reduces fruit damage from orchard traffic and minimizes disruption of sprays applied to the orchard Hand pruning of dead wood and suckering enhances spray deposition which is particularly important in the case of red scale Hand pruning can also increase the amount of fruit inside the tree Pruning is generally done after harvest Because of increased risk from frost damage pruning should be discontinued by mid-August to allow trees to enter the frost season in a reduced physiological state less susceptible to freezing Pruning for Navels is normally done in the spring while Valencias are pruned in the summer Pruning is done is April in this study The prunings generally require shredding The prunings from topping are stacked in alternate row middles by the custom shredder prior to shredding the hand prunings are stacked by the pruners in alternate row middles and shredded by a custom shredder The prunings from hedging fall in a manner that does not require hand stacking Although the custom operator shreds alternate rows the charge is based on total acres
Fertilization Nitrogen (N) as UN-32 is applied through the irrigation system (not necessarily with an irrigation) in several applications during February March and April Foliar applications of N as low biuret urea plus minor nutrients zinc sulfate and manganese (Tecmangam) are mixed and sprayed with the March cutworm treatment A second low biuret urea application is made with the May thrips and katydid spray The nutritional program should be based on leaf analysis
LeafTissue Sampling Leaf samples are taken in the fall from spring flush non-fruiting 5-7 month old leaves In this study one sample is taken per 10 acres (010 samples per acre) by the PCA sometime from August through October The cost shown is for lab analysis
Soil Amendments Each year from April through October gypsum is injected through the irrigation system with each irrigation this results in a total application of one-ton per acre for the season The cost includes the gypsum and the labor to operate and fill the gypsum machine The machine is listed as an investment under the Non-Cash Overhead section of the tables
Irrigation In this study water is applied April through October Thirty acre-inches of district water delivered via canal is applied to the orchard at a cost of $114 per acre-foot or $950 per acre-inch Water costs are highly
2015 Oranges Costs and Returns Study San Joaquin Valley South UC Cooperative Extension 6
variable among districts and the cost used is approximately mid-range From grower and district information costs may be as low as $90 per acre-foot or as high as $250 per acre-foot in non-drought years In drought years growers may pay between $1000 and $1800 per acre-foot This study assumes a year with normal water costs No assumption is made about effective rainfall runoff evaporation winter water requirements or rainfall stored in the soil profile tree size or tree health The irrigation operation costs include the water and labor for irrigating operating and monitoring the system
Frost Protection Protection is required from late winter to early spring (November through February) and is shown for November December and January In this study chemical vegetation control on the orchard floor and 22 acre-inches of water are used for frost protection during the season Also wind machines are operated on nights with threatening minimum temperatures (see Table C) Each wind machine protects approximately 10 acres and uses 15 gallons of propane ($210 per gallon) per hour The frost protection cost includes the fuel use and labor to operate the machines and to apply the water
Pest Management The pesticides and rates mentioned in this cost study are listed in UC Integrated Pest Management Guidelines Citrus Pest Management Guidelines For more information on other pesticides available pest identification monitoring and management visit the UC IPM website at wwwipmucdavisedu For information and pesticide use permits contact the local county agricultural commissioners office Growers with fruit destined for the export market must use registered products that meet maximum residue limits (MRL) for that country Check the MRLs at wwwcalcitrusqualityorg
Pest Control Adviser (PCA) Written recommendations are required for many pesticides and are made by licensed PCAs In addition the PCA can monitor the field for agronomic problems including pests and nutrition Growers may hire private PCAs or receive the service as part of a service agreement with an agricultural chemical and fertilizer company In this study a private PCA monitors the crops for pest disease and nutrition
Weeds Pre-emergent herbicides (Karmex Princep) are applied to the orchard floor (tree row and middles) in split applications one in the fall (October) and one in the spring (March) using one-half the maximum rate per application Surviving weeds are controlled with three spot sprays ndash April June August ndash with Roundup Karmex and Princep are regulated under the Groundwater Protection Regulations Check with your farm advisor or PCA prior to applying
Insects Citrus cutworms are sprayed primarily in March with Dipel insecticide Citrus thrips and katydids are treated in May and citrus thrips only in June Success insecticide and oil are used in both applications Urea and micronutrients are mixed with the cutworm spray and urea only with the thrips and katydid spray A spray is applied in July for California red scale and citricola scale alternating each year with Esteem (insect growth regulator) and Lorsban Esteem controls red scale only and Lorsban controls both scales All insect and disease treatments are applied by a commercial applicator The custom application costs vary by pest material applied volume of water used and sprayer speed The grower should alternate materials in order to reduce the potential for the development of insect resistance to pesticides used
Disease Brown rot is the primary preharvest disease of fruit that occurs in this study and is controlled by spraying a Kocide (copper) and hydrated lime mixture during October or November The same fungicide mixture also controls Septoria spot Brown rot develops in the fall initially on fruit that is close to the ground The pathogen is normally found in the soil and is splashed onto the low hanging fruit by rain Symptoms usually appear during cool wet periods on mature or nearly mature fruit
2015 Oranges Costs and Returns Study San Joaquin Valley South UC Cooperative Extension 7
Snails Brown garden snails (Helix aspera) cause fruit damage Control options for brown garden snails include predaceous snails skirt pruning trunk banding and chemical baits However in this study snails are assumed not to be a problem
Insect and Disease Management Options There are two fundamental approaches to using synthetic pesticides in citrus production (1) Several applications of broad-spectrum pesticides are made to prevent pest damage While these pesticides control a wide range of insect and mite pests and persist to provide control for long periods of time these attributes can also create additional pest problems Long-term use has increased pest resistance to many of these pesticides resulting in increased pesticide applications Since broad-spectrum pesticides affect many species of insects and mites those sprays decrease the levels of beneficial populations that can assist in controlling many pests Pest resurgence and secondary outbreaks can be the result of parasite and predator suppression by these pesticide applications For example treatment for citrus cutworms or citrus thrips can cause an increase of citrus red mite (2) Use of selective pesticides and natural enemies (beneficial predators) as control measures Selective pesticides are toxic to a narrow range of pests and are usually less harmful to the natural enemies Their use requires careful monitoring of pests and more precise timing and application to be effective Many selective pesticides do not persist for long-term control Preserving beneficial predatory and parasitic populations can reduce the potential resurgence and secondary outbreaks of pests However some minor pests such as citricola scale may become economic pests once broad spectrum pesticides are not used Pest management practices used in this study follow the first strategy described (currently this is the more typical pest management program used in this region)
Growth Regulators for Navels Growth regulators are applied to mature Navel orange trees only Gibberellic acid (Gib Gro) and 2 4-D (Citrus Fix) treatments are made on mid-to-late harvested Navels Gibberellic acid maintains a juvenile rind and 24-D applied in OctoberNovember minimizes pre-harvest fruit drop In this study gibberellic acid (GA) is sprayed in October and 24-D in November Growth regulators are applied to 70 of the orchard because 30 of the orchard was picked earlier
Harvest Orange trees typically reach full production by the 10th or 11th year In this cost study the crop is hand picked and hauled by a contracted harvesting company
Typically one-third of the orchard is picked in each of three harvests over the growing season Navels are normally harvested from November to June while Valencias are harvested April through September Oranges are hand picked and put into field bins that hold 900 pounds (24 carton equivalent) of fruit The oranges are hauled from the field to a packinghouse where they are washed graded sized and packed Picking hauling packing and marketing costs from the field to the packinghouse are paid by the grower Current rates for these services vary picking and hauling costs are $135 per carton and the packinghouse cost is $485 per carton Delivering outside the local area will increase hauling costs The packing house cost includes costs for the carton packing marketing and miscellaneous fees charged by the packer The costs are based on typical costs as received from packinghouses and growers in the region
Yields Typical annual yields for the Navel and Valencia varieties are measured in 900-pound field bins per acre but are typically sold by packed cartons weighing 375 pounds although the industry often refers to them as 40-pound cartons A 900-pound bin is calculated as either 23 or 24 cartons Packed cartons represent 80 of the fruit picked The remaining 20 may go to juice or a small percentage may be culled
Returns An estimated price based on past returns of $12 per carton fob packinghouse is used in this study There is basically no income for juice products in Navels but there may be a small amount in Valencias Returns over a range of yields are shown in Table 6
2015 Oranges Costs and Returns Study San Joaquin Valley South UC Cooperative Extension 8
Assessments Commercial orange producers pay three assessments
Citrus Pest and Disease Prevention Program (CPDPP) The CPDPP was created to advise the Agricultural Secretary of California and the agricultural industry about efforts to combat serious pests and diseases that threaten Californiarsquos citrus crop Growers must pay a mandatory fee of $008 per 40-pound carton to support the disease prevention program
State Marketing Order Under a state marketing order mandatory assessment fees are collected and administered by the grower-directed Citrus Research Board This assessment currently $004 per 40 lb carton is used to fund industry research programs
Central California Tristeza Eradication Agency Tristeza disease can result in damage ranging from lower fruit quality to the death of the tree The Central California Tristeza Eradication Agency (CCTEA) manages an eradication program to keep the Central Valley tristeza-free The assessment varies by pest control district and not all districts participate Although not all growers participate in this program and pay assessments an average of $1009 per acre is charged in this study The charges are paid in the property assessment bill but are shown as an assessment line item cost in this study
PickupATV The grower uses a pickup for business and personal use It is assumed that 5000 miles are for business use An all terrain vehicle (ATV) is used for checking and monitoring the field irrigating and checking the irrigation system The cost is estimated and not based on any specific data The grower also uses the ATV for weed control and the operation cost is included in that cost
Labor Equipment and Interest
Labor Labor rates of $1692 per hour for machine operators and $1375 for general labor includes payroll overhead of 41 The basic hourly wages are $1200 for machine operators and $975 for general labor The overhead includes the employersrsquo share of federal and California state payroll taxes workers compensation insurance for orchardfruit crops (code 0016) and a percentage for other possible benefits Workersrsquo compensation costs will vary among growers but for this study the cost is based upon the average industry final rate as of March 1 2014 (personal e-mail from California Department of Insurance March 2015 unreferenced) Labor for operations involving machinery are 20 higher than the operation time given in Table 3 to account for the extra labor involved in equipment set up moving maintenance work breaks and field repair
Wages for management are not included as a cash cost Any return above total costs is considered a return to management and risk However growers wanting to account for management may wish to add a fee The manager makes all production decisions including cultural practices action to be taken on pest management recommendations and labor
Equipment Operating Costs Repair costs are based on purchase price annual hours of use total hours of life and repair coefficients formulated by American Society of Agricultural Engineers (ASAE) Fuel and lubrication costs are also determined by ASAE equations based on maximum Power Take Off (PTO) horsepower and fuel type Prices for on-farm delivery of red dye diesel and gasoline are $388 (excludes excise tax) and $379 per gallon respectively Fuel costs are derived from the Energy Information Administration averaging January to December 2014 fuel prices The cost includes a 2 local sales tax on diesel fuel and 8 sales tax on gasoline Gasoline also includes federal and state excise tax which are refundable for on-farm use when filing your income taxes The fuel lube and repair cost per acre for each operation in Table 3 is determined by multiplying the total hourly operating cost in Table 7 for each piece of equipment used for the selected operation by the hours per acre Tractor time is 10 higher than implement time for a given operation to account for setup travel and down time 2015 Oranges Costs and Returns Study San Joaquin Valley South UC Cooperative Extension 9
Interest On Operating Capital Interest on operating capital is based on cash operating costs and is calculated monthly until harvest at a nominal rate of 575 per year A nominal interest rate is the typical market cost of borrowed funds The interest cost of post harvest operations is discounted back to the last harvest month using a negative interest charge The interest rate will vary depending upon various factors The rate is this study is considered a typical lending rate by a farm lending agency as of January 2015
Risk The risks associated with crop production should not be minimized While this study makes every effort to model a production system based on typical real world practices it cannot fully represent financial agronomic and market risks which affect profitability and economic viability Crop insurance is a risk management tool available to growers
Cash Overhead Costs
Cash overhead consists of various cash expenses paid out during the year that are assigned to the whole farm and not to a particular operation
Property Taxes Counties charge a base property tax rate of 1 on the assessed value of the property In some counties special assessment districts exist and charge additional taxes on property including equipment buildings and improvements For this study county taxes are calculated as 1 of the average value of the property Average value equals new cost plus salvage value divided by 2 on a per acre basis
Insurance Insurance for farm investments varies depending on the assets included and the amount of coverage Property insurance provides coverage for property loss and is charged at 0843 of the average value of the assets over their useful life Liability insurance covers accidents on the farm and costs $638 for the entire farm
Crop Insurance Crop insurance is available to growers but is not included as a cost in this study
Office Expense Office and business expenses are estimated at $75 per acre These expenses include office supplies telephones bookkeeping accounting legal fees shop and office utilities and miscellaneous administrative charges
ManagementSupervisor Salaries The grower farms the orchard so no cash cost is allocated to management Returns above costs are considered a return to management
Compliance Costs Compliance costs are estimated by a study conducted for California Citrus Mutual examining compliance costs for citrus production across California The study estimates total compliance cost per acre at $35620 which includes education and training air quality compliance water quality compliance pesticide regulation labor regulation and capital expenditures
Investment Repairs Annual maintenance is calculated as 2 of the purchase price except orchard establishment is calculated at 050 to account for tree replacement and orchard repairs
2015 Oranges Costs and Returns Study San Joaquin Valley South UC Cooperative Extension 10
Non-Cash Overhead Costs
Non-cash overhead is calculated as the capital recovery cost for equipment and other farm investments
Capital Recovery Costs Capital recovery cost is the annual depreciation and interest costs for a capital investment It is the amount of money required each year to recover the difference between the purchase price and salvage value (unrecovered capital) It is equivalent to the annual payment on a loan for the investment with the down payment equal to the discounted salvage value This is a more complex method of calculating ownership costs than straight-line depreciation and opportunity costs but more accurately represents the annual costs of ownership because it takes the time value of money into account (Boehlje and Eidman) The formula for the calculation of the annual capital recovery costs is ((Purchase Price ndash Salvage Value) x Capital Recovery Factor) + (Salvage Value x Interest Rate)
Salvage Value Salvage value is an estimate of the remaining value of an investment at the end of its useful life For farm machinery (tractors and implements) the remaining value is a percentage of the new cost of the investment (Boehlje and Eidman) The percent remaining value is calculated from equations developed by the American Society of Agricultural Engineers (ASAE) based on equipment type and years of life The life in years is estimated by dividing the wear out life as given by ASAE by the annual hours of use in this operation For other investments including irrigation systems buildings and miscellaneous equipment the value at the end of its useful life is zero The salvage value for land is the purchase price because land does not depreciate
Capital Recovery Factor Capital recovery factor is the amortization factor or annual payment whose present value at compound interest is 1 The amortization factor is a table value that corresponds to the interest rate used and the life of the machine
Interest Rate An interest rate of 475 is used to calculate capital recovery The rate will vary depending upon loan amount and other lending agency conditions but is the basic suggested rate by a farm lending agency as of January 2015
Establishment Cost Costs to establish the orchard are used to determine capital recovery expenses depreciation and interest on investment for the production years Establishment cost is the sum of the costs for land preparation planting trees cash overhead and production expenses for growing the trees through the first year that oranges are harvested minus any returns from production The ldquoTotal Accumulated Net Cash Costrdquo on Table 1 in the fourth year represents the establishment cost For this study the cost is $8337 per acre or $83370 for the 10-acre orchard The establishment cost is spread over the remaining 36 years of the 40 years the orchard is in production Establishment costs in this study are based on typical basic operations but can vary considerably depending upon terrain soil type local regulations and other factors For example development on marginal soils will require additional land preparation and soil amendments ManagementDevelopment companies will have additional labor costs
Irrigation System Water is delivered under pressure to the orchard through a low-volume irrigation system Low-volume emitters discharge 10 gallons per hour and are spaced at one per tree The cost for the low-volume irrigation system includes the cost of a pump filtration system hoses emitters and installation The life of the irrigation system is estimated at 40 years The above ground portion of the irrigation system will probably have to be replaced once per ten years but is not separated out in this study
2015 Oranges Costs and Returns Study San Joaquin Valley South UC Cooperative Extension 11
Land 2014 land values for bare or row crop land in Kern and Tulare Counties range between $8000 to $18000 per acre (Trends amp Leases) depending on available water Land with citrus orchards ranges from $14000 to $24000 per acre Current real estate listings for bare land values range from $15000 to $20000 per acre The land on which the orchard is planted in this study is valued at $15000 per acre Building The shop building is a 1800 square foot metal building or buildings on a cement slab
Tools This includes shop tools hand tools and miscellaneous field tools such as pruning tools The value is estimated and not taken from any specific data
Fuel Tanks Two 250-gallon fuel tanks using gravity feed are on metal stands The tanks are setup in a cement containment pad that meets federal state and county regulations
Wind Machines Each machine will cover approximately 10-acres The cost includes six machines on the farm with one being in the new planting and five on the remaining acres Cost includes installation of the propane-powered machines The machines are assumed to use 15 gallons of propane per hour
Gypsum Machine The machine is used to inject the soluble gypsum into the irrigation system The machine costs are allocated to the 10-acres of newly established oranges
Equipment Farm equipment is purchased new or used but the study shows the current purchase price for new equipment The new purchase price is adjusted to 60 to indicate a mix of new and used equipment Equipment costs are composed of three parts non-cash overhead cash overhead and operating costs Both of the overhead factors have been discussed in previous sections The operating costs consist of repairs fuel and lubrication and are discussed under operating costs
Table Values Due to rounding the totals may be slightly different from the sum of the components
2015 Oranges Costs and Returns Study San Joaquin Valley South UC Cooperative Extension 12
REFERENCES
American Society of Agricultural Engineers 1992 American Society of Agricultural Engineers Standards Yearbook St Joseph MI
American Society of Farm Managers and Rural Appraisers 2014 Trends in Agricultural Land amp Lease Values California Chapter of the American Society of Farms Managers and Rural Appraisers
Boehlje Michael D and Vernon R Eidman 1984 Farm Management John Wiley and Sons New York NY
California State Board of Equalization 2015 Fuel Tax Division Tax Rates Internet accessed January 2015 httpwwwboecagovsptaxprogspftdrateshtm
Dreistadt Steve 2012 Integrated Pest Management for Citrus Third Edition University of California Statewide Integrated Pest Management Program ANR
Energy Information Administration 2015 Gasoline and Diesel Fuel Update Internet accessed January 2014 httptontoeiadoegovooginfogdugasdieselasp
Ferguson L E Grafton-Cardwell 2014 Citrus Production Manual University of California Agriculture and Natural Resources
Hamilton Lynn 2006 Comparing Californiarsquos Cost of Regulation to Other States A Case Study Approach for Agriculture California Institute for the Study of Specialty Crops
OrsquoConnell Neil V Craig E Kallsen Karen M Klonsky and Richard L De Moura 2009 Sample Costs to Establish an Orange Orchard and Produce Oranges Navels amp Valencias San Joaquin Valley South University of California Cooperative Extension Department of Agricultural and Resource Economics Davis CA
University of California Statewide Integrated Pest Management Program UC Integrated Pest Management Guidelines Citrus 2014 University of California Davis CA httpwwwipmucdaviseduPMGselectnewpestcitrushtml
Venner Raymond and Steven C Blank 1995 Reducing Citrus Revenue Losses From Frost Damage Wind Machines and Crop Insurance Giannini Foundation Information Series No 95-1 University of Calif Oakland CA
2015 Oranges Costs and Returns Study San Joaquin Valley South UC Cooperative Extension 13
UC COOPERATIVE EXTENSION Table 1 COSTS PER ACRE TO ESTABLISH AN ORANGE ORCHARD
Land Preparation Remove Old Orchard (Dig Stack Chip) 375 Land Preparation Ripping 300 Land Preparation Disc 2X 100 Land Preparation Level (Triplane) 175 Trees 110 per acre (Replant 2 of trees in 2nd Year) 1265 23 Plant Layout Plant Stake amp Wrap Trees ($209Tree) 230 4
TOTAL CASH OVERHEAD COSTS 700 700 769 769 773 TOTAL CASH COSTS 3896 1294 1425 2057 3566 INCOME FROM PRODUCTION 0 0 0 336 2556 NET CASH COSTS FOR THE YEAR 3896 1294 1425 1721 1010 PROFIT ABOVE CASH COSTS TOTAL ACCUMULATED NET CASH COSTS 3896 5190 6616 8337 9347
2015 Oranges Costs and Returns Study San Joaquin Valley South UC Cooperative Extension 14
TOTAL NON-CASH OVERHEAD COSTS 1015 1015 1217 1217 1248 TOTAL COST FOR THE YEAR 4911 2309 2642 3274 4814 INCOME FROM PRODUCTION 336 2556 NET TOTAL COST FOR THE YEAR 4911 2309 2642 2938 2258 NET PROFIT FOR THE YEAR ACCUMULATED NET TOTAL COST 4911 7220 9863 12801 15059
Assumes a year with normal water costs In drought years water costs can increase to between $1000 and $1800 per acre-foot
2015 Oranges Costs and Returns Study San Joaquin Valley South UC Cooperative Extension 15
UC COOPERATIVE EXTENSION Table 2 MATERIALS AND CUSTOM WORK COSTS PER ACRE - ESTABLISHMENT YEARS
Disease Brown Rot (Lime Kocide) Oct Spray Ground Copper 100 acre
Hydrated Lime 1000 lb
Kocide 2020 1000 lb
Growth Regulator (Fruit Fix) [Navel Only] Oct
Spray Ground 100 acre
Citrus Fix 250 floz
Growth Regulator (GibGro or GA) [Navel Only] Nov Spray Grnd 100 acre
Gib Gro 4LS 4000 gram
Pickup Truck Use Nov Pickup Truck 12 T Equipment Operator Labor 400 hours
ATV Use Nov ATV 4WD Equipment Operator Labor 400 hours
PCAConsultant Services Nov PCA Fees 100 acre
Pick amp Haul Fruit Feb Harvest Pick amp Haul 22900 ctn
Apr Harvest Pick amp Haul 22800 ctn
Nov Harvest Pick amp Haul 22900 ctn
Pack Feb HarvestSort amp Pack 18300 ctn
Apr HarvestSort amp Pack 18300 ctn
Nov HarvestSort amp Pack 18400 ctn
Assessments Feb CitrusReserch 40 lb 15200 ctn
Tristeza Eradication 033 acre
CPDPP 18300 ctn
Apr CitrusReserch 40lb 15600 ctn
Tristeza Eradication 033 acre
CPDPP 18300 ctn
Nov CitrusReserch 40lb 15900 ctn
Tristeza Eradication 034 acre
CPDPP 18400 ctn
2015 Oranges Costs and Returns Study San Joaquin Valley South UC Cooperative Extension 25
REFERENCES
American Society of Agricultural Engineers 1992 American Society of Agricultural Engineers Standards Yearbook St Joseph MI
American Society of Farm Managers and Rural Appraisers 2014 Trends in Agricultural Land amp Lease Values California Chapter of the American Society of Farms Managers and Rural Appraisers
Boehlje Michael D and Vernon R Eidman 1984 Farm Management John Wiley and Sons New York NY
California State Board of Equalization 2015 Fuel Tax Division Tax Rates Internet accessed January 2015 httpwwwboecagovsptaxprogspftdrateshtm
Dreistadt Steve 2012 Integrated Pest Management for Citrus Third Edition University of California Statewide Integrated Pest Management Program ANR
Energy Information Administration 2015 Gasoline and Diesel Fuel Update Internet accessed January 2014 httptontoeiadoegovooginfogdugasdieselasp
Ferguson L E Grafton-Cardwell 2014 Citrus Production Manual University of California Agriculture and Natural Resources
Hamilton Lynn 2006 Comparing Californiarsquos Cost of Regulation to Other States A Case Study Approach for Agriculture California Institute for the Study of Specialty Crops
OrsquoConnell Neil V Craig E Kallsen Karen M Klonsky and Richard L De Moura 2009 Sample Costs to Establish an Orange Orchard and Produce Oranges Navels amp Valencias San Joaquin Valley South University of California Cooperative Extension Department of Agricultural and Resource Economics Davis CA
University of California Statewide Integrated Pest Management Program UC Integrated Pest Management Guidelines Citrus 2014 University of California Davis CA httpwwwipmucdaviseduPMGselectnewpestcitrushtml
Venner Raymond and Steven C Blank 1995 Reducing Citrus Revenue Losses From Frost Damage Wind Machines and Crop Insurance Giannini Foundation Information Series No 95-1 University of Calif Oakland CA
2015 Oranges Costs and Returns Study San Joaquin Valley South UC Cooperative Extension 13
UC COOPERATIVE EXTENSION Table 1 COSTS PER ACRE TO ESTABLISH AN ORANGE ORCHARD
Land Preparation Remove Old Orchard (Dig Stack Chip) 375 Land Preparation Ripping 300 Land Preparation Disc 2X 100 Land Preparation Level (Triplane) 175 Trees 110 per acre (Replant 2 of trees in 2nd Year) 1265 23 Plant Layout Plant Stake amp Wrap Trees ($209Tree) 230 4
TOTAL CASH OVERHEAD COSTS 700 700 769 769 773 TOTAL CASH COSTS 3896 1294 1425 2057 3566 INCOME FROM PRODUCTION 0 0 0 336 2556 NET CASH COSTS FOR THE YEAR 3896 1294 1425 1721 1010 PROFIT ABOVE CASH COSTS TOTAL ACCUMULATED NET CASH COSTS 3896 5190 6616 8337 9347
2015 Oranges Costs and Returns Study San Joaquin Valley South UC Cooperative Extension 14
TOTAL NON-CASH OVERHEAD COSTS 1015 1015 1217 1217 1248 TOTAL COST FOR THE YEAR 4911 2309 2642 3274 4814 INCOME FROM PRODUCTION 336 2556 NET TOTAL COST FOR THE YEAR 4911 2309 2642 2938 2258 NET PROFIT FOR THE YEAR ACCUMULATED NET TOTAL COST 4911 7220 9863 12801 15059
Assumes a year with normal water costs In drought years water costs can increase to between $1000 and $1800 per acre-foot
2015 Oranges Costs and Returns Study San Joaquin Valley South UC Cooperative Extension 15
UC COOPERATIVE EXTENSION Table 2 MATERIALS AND CUSTOM WORK COSTS PER ACRE - ESTABLISHMENT YEARS