Fig. 1.2 (i) Using Fig. 1.2, record ts, the starting temperature, and tm, the maximum temperature
in Table 1.1. [2]
Table 1.1
starting temperature
ts / °C
maximum temperature
tm / °C
temperature rise
T = (tm - ts) / °C
mass of bread mb / g
mass of water mw / g
12.6 20
(ii) Calculate T, the temperature rise of the water, using T = tm - ts. Record it in Table 1.1. [1] (iii) The energy content of the bread can be determined by using the formula
mw
x T x 4.2
mb
x 1000kJ / gE =
Calculate the energy content of the bread. Show your working.
(b) (i) The true energy content of bread is much higher than the value that you have calculated. By reference to the experiment, suggest reasons for the difference.
[2]
(ii) Suggest one way in which the accuracy of the experiment could be improved.
[1]
(c) Suggest how the results will change if the experiment is repeated with bread covered
with an equal mass of butter. Explain your answer.
2 (a) A student is investigating three liquid fuels, A, B and C to find which one gives the largest temperature rise.
beaker with
50 cm3 water
wick
spirit burner
Fig. 2.1
• She fills a spirit burner with fuel A. Its mass is measured and recorded in Table 2.1.
• She places 50 cm3 of water in the beaker on the tripod above the spirit burner, as in Fig. 2.1. She measures the temperature of the water and records it in Table 2.2.
• She lights the wick and allows it to burn for 5 minutes, then extinguishes the flame.
• She measures the temperature of the water after heating and records it in Table 2.2.
• She measures the mass of the spirit burner again and records this in Table 2.1.
• Then she repeats all the steps using fuel B and then fuel C. Table 2.1
fuel A fuel B fuel C
mass of burner and fuel before burning / g
57.0
mass of burner and fuel after burning / g
55.5 57.9 58.2
mass of fuel used / g 1.5
60
59
58
g
fuel B
Fig. 2.2
61
60
59
g
fuel C
Fig. 2.3 (i) Use Fig. 2.2 to find, and record in Table 2.1, the mass of the spirit burner and
(ii) Use Fig. 2.3 to find, and record in Table 2.1, the mass of the spirit burner and fuel C. [1]
(iii) Calculate the mass of fuel used in each experiment and record it in Table 2.1. [1]
Table 2.2
fuel A fuel B fuel C
temperature of water before heating / °C
15.5 15.5 15.5
temperature of water after heating / °C
56.8
temperature rise / °C
41.3
(iv) The thermometers in Fig. 2.4 show the temperatures of the 50 cm3 of water after
being heated for 5 minutes. Read the thermometers for each fuel and record the temperatures in Table 2.2. [2]
51
50
49
°C
fuel B
63
62
61
°C
fuel C Fig. 2.4 (v) Use the data in Table 2.2 to calculate the temperature rise caused by fuels B
and C. Record these values in Table 2.2. [1] (b) Not all the heat produced by the fuel is used to heat the water. Suggest one improvement to the experiment so that more heat is used in heating the
(c) The temperature rise per gram, T, for fuel A is 27.5 °C / g. Calculate the temperature rise per gram for fuels B and C. Use the formula
temperature rise
mass of fuelT =
T for fuel B = °C / g
T for fuel C = °C / g [2]
(d) The liquid with the highest value of T may not be suitable for use as a fuel in the home. Suggest a property that could make this liquid unsuitable to use as a fuel.
3 (a) A student is finding the mass of a metre rule using the principle of moments. He sets up the apparatus as in Fig. 3.1. A pin to act as a pivot is pushed through the 100 mm mark of a metre rule into a cork
clamped to the stand. The rule is kept horizontal by a newton meter at the 900 mm mark.
100
500 g
mass
200 900
pivot
newton meter
d
Fig. 3.1 A 500 g mass is hung at the 200 mm mark, 100 mm from the pivot, this is distance d. The force on the newton meter required to keep the rule horizontal is measured and
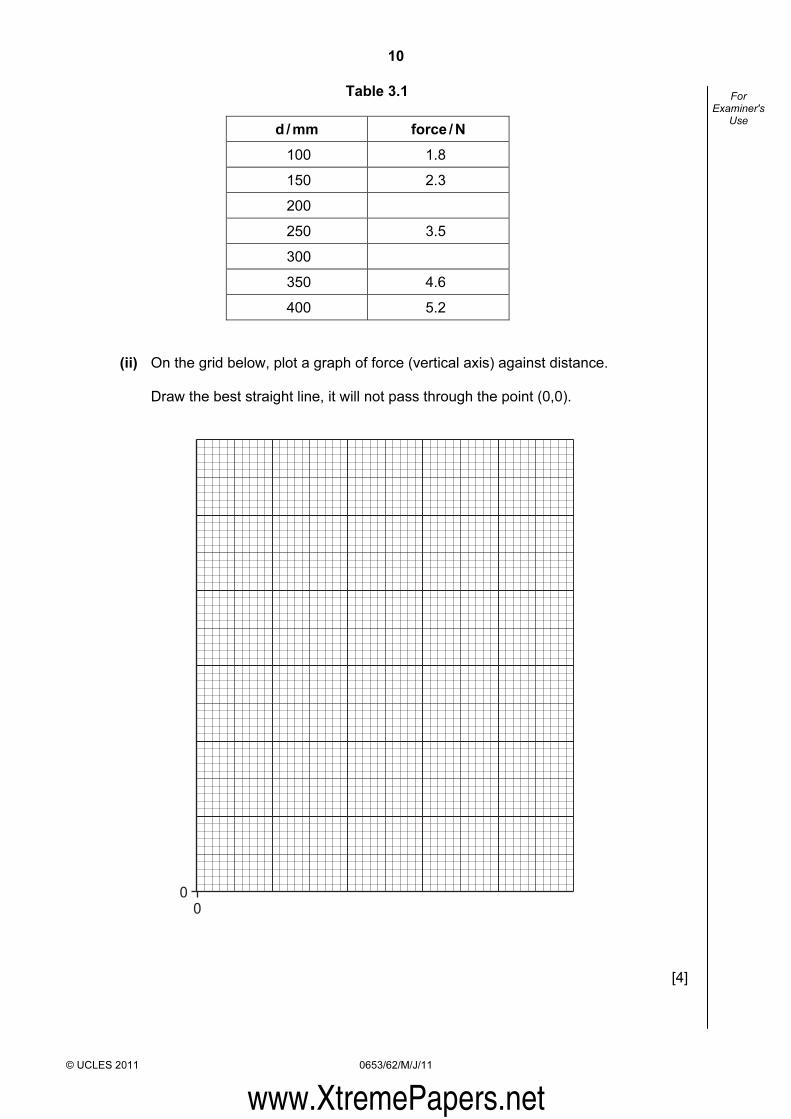
recorded in Table 3.1. (i) Read the newton meters in Fig. 3.2, for, d = 200 mm and d = 300 mm and record
(a) Measure the maximum distance, d, as in Fig. 4.2 of each whole fruit in the photographs. Include all parts of the fruit including petioles (stalks) and enter the distance d in Table 4.1.
d
fruit stalk
Fig. 4.2
Table 4.1
fruit actual size of fruit / mm
distance d / mm
fraction of actual size
melon 120
fig 58
kiwifruit 77
mango 125
[2] (b) The photographs show the fruits to be of similar sizes. However the actual sizes of the
fruits varied considerably. Use your measurements for d to find how much each photograph was scaled down. Use the following equation for each fruit and enter the values in Table 4.1.
(c) The student created a key for these fruits. A key is used to identify living organisms. An example of a key to identify different arthropods is shown.
arthropods
4 pairs of legs
arachnid3 pairs of legs
insect
fewer than 5 pairs of legs
legs similar to
each other
myriapod
large variation
in leg structure
crustacean
5 or more pairs of legs
Using information from Fig. 4.1 and Table 4.1 construct a key for the fruits. Use the
given example of a key to help you. Check that the key would enable all of the fruits to be identified.
5 (a) A student is trying to confirm Hooke’s Law which states “The extension of a spring is directly proportional to the force extending it.” The apparatus is set up as shown in Fig. 5.1.
55 mmstand
clamp
spring
loop
Fig. 5.1 He records in Table 5.1 the position of the pointer on the rule. He now hangs a holder, weight 1 N, to the loop and reads the new position of the pointer.
He calculates the extension. These measurements are placed in Table 5.1.
60
70
80
90
100
110
120
130
2 N
60
70
80
90
100
110
120
130
3 N
60
70
80
90
100
110
120
130
6 N
Fig. 5.2 (i) Fig. 5.2 shows the springs with 2 N, 3 N and 6 N weights attached. Read off the
position of the pointer each time, and record the values in Table 5.1. [3]
6 (a) Solid X is a mixture of two compounds, each containing different ions. A student places solid X into a large test-tube, adds about 10 cm3 water, stoppers the
tube and shakes it for a minute. She filters the mixture, and saves the filtrate for part (b). (i) She scrapes the residue into a test-tube and adds 2 cm3 of hydrochloric acid.
Bubbles of carbon dioxide gas are given off. Describe the test for carbon dioxide.
test
result
[2]
(ii) Give the name of the anion that gives off carbon dioxide when hydrochloric acid is
added.
[1]
(iii) To the mixture from (a)(i) she adds aqueous sodium hydroxide, drop by drop, until
no further reaction occurs. She sees a white precipitate which dissolves to form a colourless solution. Name the cation in the mixture.
(b) The filtrate from part (a) is a blue colour. She divides the filtrate into three test-tubes.
• To the first test-tube she adds aqueous sodium hydroxide, drop by drop until it is in excess.
• To the second test-tube she adds aqueous ammonia, again drop by drop until it is in excess.
• She determines that copper ions are present.
Describe the observations she sees.
observations with aqueous sodium hydroxide
observations with aqueous ammonia
[4]
(c) (i) To the third test-tube of the filtrate, she adds a few drops of dilute hydrochloric acid
followed by aqueous barium chloride. A white precipitate is formed. What anion causes this?
[1]
(ii) Why does hydrochloric acid need to be added in the test in (c)(i)?
[1]
www.XtremePapers.net
20
Permission to reproduce items where third-party owned material protected by copyright is included has been sought and cleared where possible. Every reasonable effort has been made by the publisher (UCLES) to trace copyright holders, but if any items requiring clearance have unwittingly been included, the publisher will be pleased to make amends at the earliest possible opportunity. University of Cambridge International Examinations is part of the Cambridge Assessment Group. Cambridge Assessment is the brand name of University of Cambridge Local Examinations Syndicate (UCLES), which is itself a department of the University of Cambridge.


![SALT-RISING BREAD...“[M]ake up your [salt -risen] bread into rather a soft dough … [T]he softer is the dough, the more light and spongy will the bread be.” Lettice Bryan, The](https://static.documents.pub/doc/80x56/602ddecb7c4e7d2d5736caa9/salt-rising-bread-aoemake-up-your-salt-risen-bread-into-rather-a-soft-dough.jpg)


