University of Dundee DOCTOR OF PHILOSOPHY Population dynamics of potato cyst nematodes in relation to temperature Kaczmarek, Agata Award date: 2014 Link to publication General rights Copyright and moral rights for the publications made accessible in the public portal are retained by the authors and/or other copyright owners and it is a condition of accessing publications that users recognise and abide by the legal requirements associated with these rights. • Users may download and print one copy of any publication from the public portal for the purpose of private study or research. • You may not further distribute the material or use it for any profit-making activity or commercial gain • You may freely distribute the URL identifying the publication in the public portal Take down policy If you believe that this document breaches copyright please contact us providing details, and we will remove access to the work immediately and investigate your claim. Download date: 11. Dec. 2021
Transcript
University of Dundee
DOCTOR OF PHILOSOPHY
Population dynamics of potato cyst nematodes in relation to temperature
Kaczmarek, Agata
Award date:2014
Link to publication
General rightsCopyright and moral rights for the publications made accessible in the public portal are retained by the authors and/or other copyright ownersand it is a condition of accessing publications that users recognise and abide by the legal requirements associated with these rights.
• Users may download and print one copy of any publication from the public portal for the purpose of private study or research. • You may not further distribute the material or use it for any profit-making activity or commercial gain • You may freely distribute the URL identifying the publication in the public portal
Take down policyIf you believe that this document breaches copyright please contact us providing details, and we will remove access to the work immediatelyand investigate your claim.
Population dynamics of potato cystnematodes in relation to temperature
Agata Kaczmarek
2014
University of Dundee
Conditions for Use and DuplicationCopyright of this work belongs to the author unless otherwise identified in the body of the thesis. It is permittedto use and duplicate this work only for personal and non-commercial research, study or criticism/review. Youmust obtain prior written consent from the author for any other use. Any quotation from this thesis must beacknowledged using the normal academic conventions. It is not permitted to supply the whole or part of thisthesis to any other person or to post the same on any website or other online location without the prior writtenconsent of the author. Contact the Discovery team ([email protected]) with any queries about the useor acknowledgement of this work.
Population dynamics of potato cyst nematodes in relation to temperature
Agata Monika Kaczmarek
Thesis submitted for the degree of
Doctor of Philosophy in Science
University of Dundee
May 2014
ii
CONTENTS
CONTENTS ........................................................................................................ ii
LIST OF FIGURES ............................................................................................ vi
LIST OF TABLES ............................................................................................ xvi
ACKNOWLEDGEMENTS ............................................................................. xviii
DECLARATION ............................................................................................... xix
STATEMENT ................................................................................................... xix
PUBLICATION ARISING FROM THIS WORK ................................................. xx
ABBREVIATIONS ........................................................................................... xxi
Table 4-2 Results after digestion with a restriction enzyme TaqI of s222 PCR
amplification products from field samples. ...................................................... 168
Table 4-3 Summary of Cytochrome B sequence polymorphisms from 39 single
cysts from field samples. ................................................................................. 174
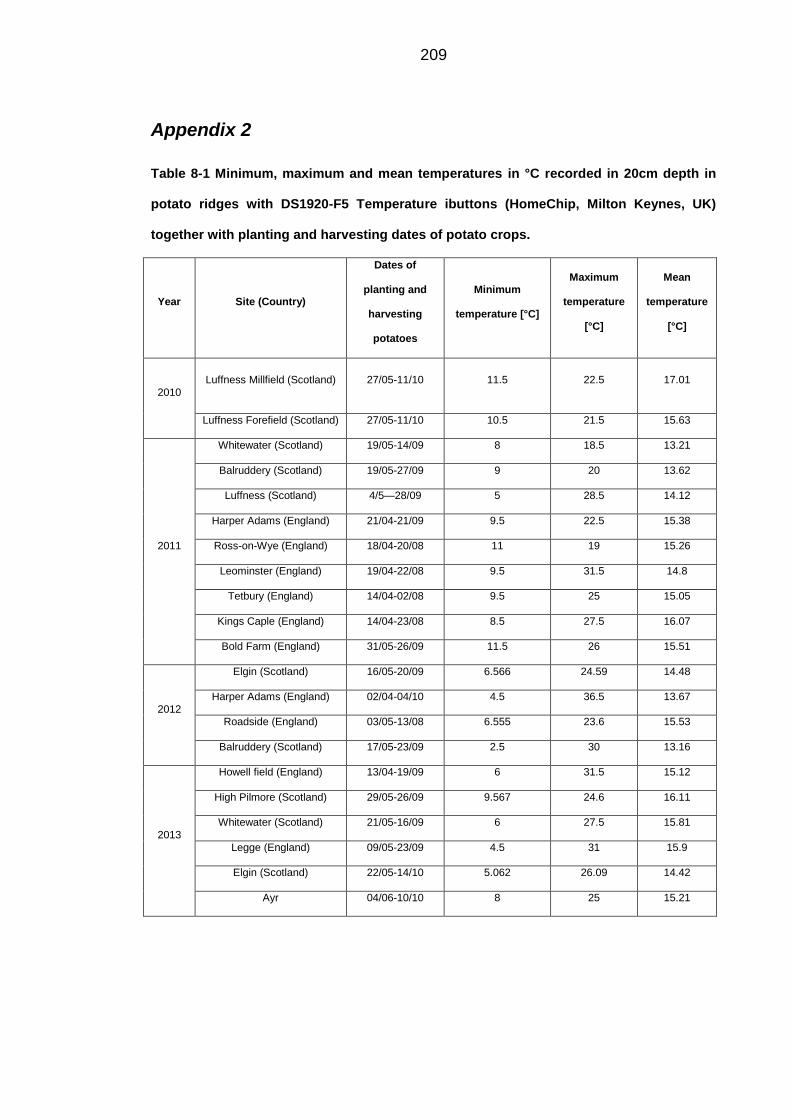
Table 8-1 Minimum, maximum and mean temperatures in °C recorded in 20cm
depth in potato ridges with DS1920-F5 Temperature ibuttons. ....................... 209
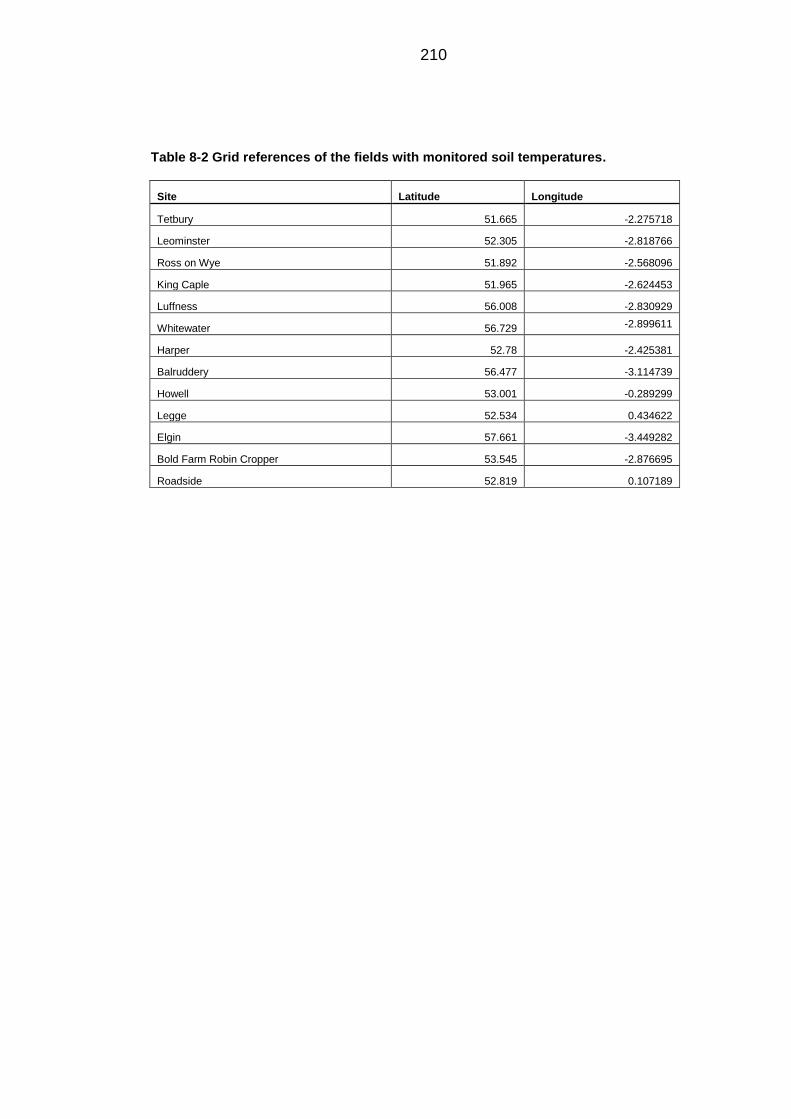
Table 8-2 Grid references of the fields with monitored soil temperatures. ...... 210
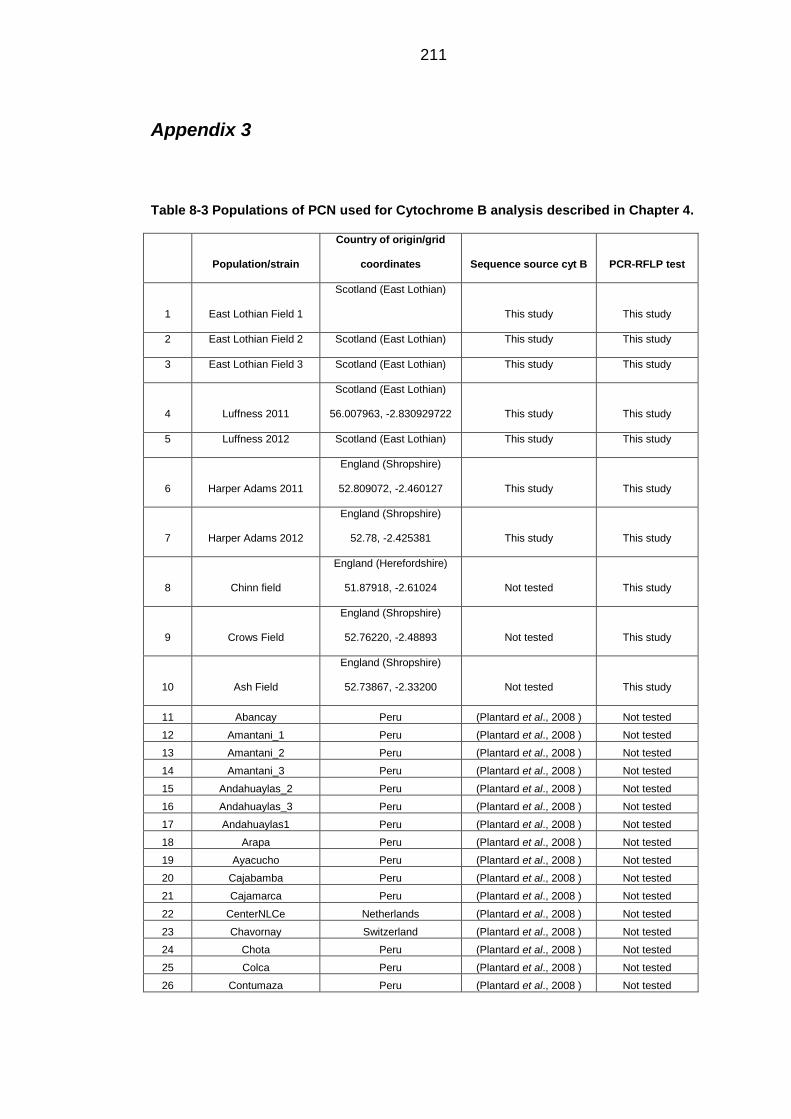
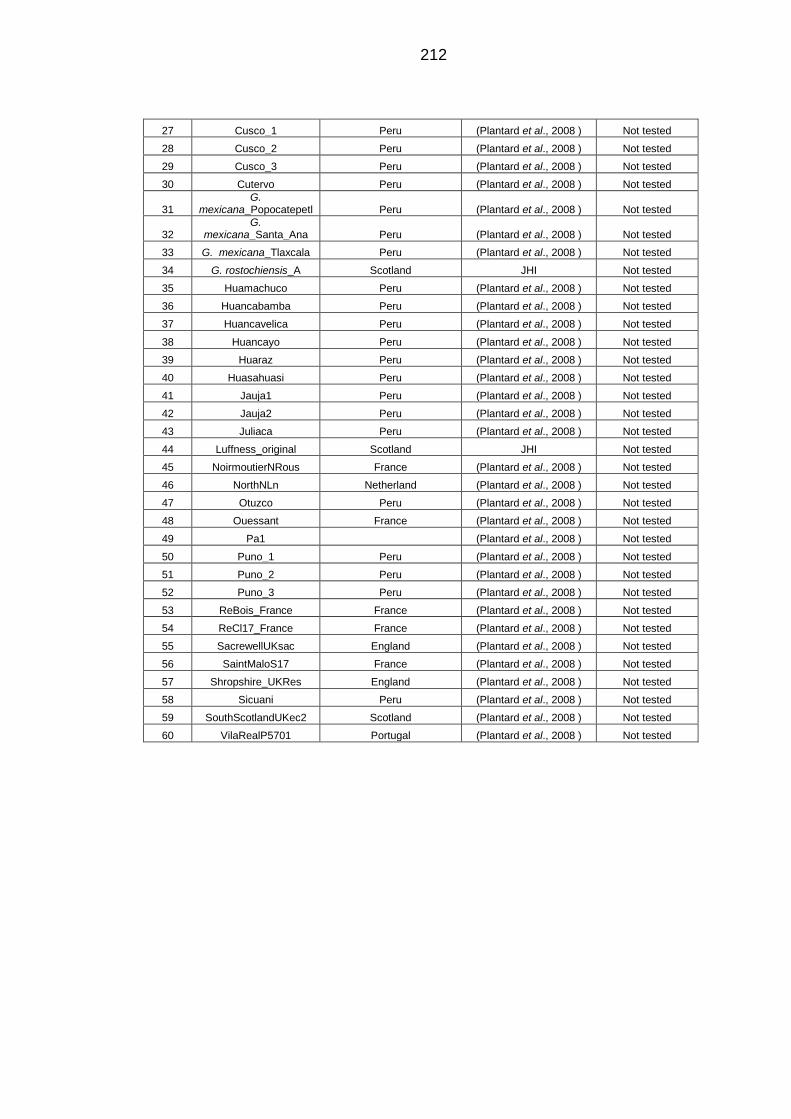
Table 8-3 Populations of PCN used for Cytochrome B analysis. .................... 211
xviii
ACKNOWLEDGEMENTS
Firstly, I would like to thank my supervisor Dr Vivian C. Blok for her guidance,
support and encouragement over the course of studies. Thanks to Dr M. Finlay
B. Dale for his assistance, suggestions, and help with the field experiments.
I would like to extend my thanks to Dr Patrick Haydock and Dr Matthew Back at
Harper Adams University College, Alex Reid, David Kanyon, Jon Pickup and
Yvone Cole at SASA and Prof Paul R. J. C. Birch from the University of
Dundee.
I would like to thank my thesis committee Dr Tracy Valentine and Prof. John
Jones for all their useful suggestions and comments during the meetings.
Thanks to Alison Paterson, Anne Holt, Dr Juan E. Palomares-Rius and Dr Mark
Phillips and also my nematology blondes Peter and Sebastian for their help in
experiments, moral support and assistance with all aspects of the nematology
used throughout this project. I would also like to thank: Ralph Wilson for
supplying potatoes, Katrin MacKenzie and Helen Kettle for advice on statistical
and modelling approaches and Philip Smith for proofreading my thesis.
Thanks to all great people, I have met here at JHI: Ashleigh, Amar, Monika and
Yannick and the rest of my friends and colleagues whom I have worked with.
Finally, I would like to thank my mum and the rest of my family and friends for
their support and for keeping me going when things got tough. The completion
of my dissertation and subsequent Ph.D. has been a journey that taught me IT
IS NEVER SO BAD as you expect.
Funding for this work was received from the Potato Council and The James
Hutton Institute.
Pracę dedykuję mojej mamie oraz Małgosi z Irkiem i Dorocie, bez wsparcia
których nigdy by ona nie powstała.
xix
DECLARATION
This thesis is my own composition. The results presented here are of
investigations conducted by myself. Work other than my own is clearly indicated
with references to relevant researchers and/or their publications. This work has
not, in whole or in part, been previously presented for a higher degree.
The research was carried out at The James Hutton Institute, Invergowrie,
Scotland, under the supervision of Dr Vivian C. Blok, Dr M. Finlay B. Dale and
Prof. Paul R. J. C. Birch.
Agata Monika Kaczmarek
STATEMENT
I certify that Agata Monika Kaczmarek, a candidate for the degree of Doctor of
Philosophy in the University of Dundee, has fulfilled the relevant Ordinance and
Regulations of the University Court, and is qualified to submit this thesis.
Dr Vivian C. Blok
The James Hutton Institute
Prof. Paul R. J. C. Birch
University of Dundee
xx
PUBLICATIONS ARISING FROM THIS WORK
Kaczmarek A., McKenzie K., Kettle H., and Blok V. C., 2014. The influence of temperature on the plant parasitic nematodes Globodera rostochiensis and G. pallida. Assessing the impact of soil temperature. Phytopathologia Mediterranea, [S.I.], (accepted).
Kaczmarek A., McKenzie K., Kettle H., and Blok V. C., 2014., Increasing soil temperatures will likely benefit potato cyst nematodes, Proceedings Crop Protection in Northern Britain 2014 (accepted).
Kaczmarek A., McKenzie K., Kettle H., and Blok V. C., 2014. Life cycle of the
Potato Cyst Nematodes in the field conditions in Scotland and England in terms of soil temperatures. (in preparation).
Kettle H., Kaczmarek A., and Blok V. C., 2014. Modelling the Population
Dynamics of Potato Cyst Nematodes. (in preparation)
xxi
ABBREVIATIONS
ANOVA Analysis of variance
BioSS Bioinformatics and Statistics Scotland
CV Cultivar
CytB Cytochrome B
dNTPs Deoxynucleotide Triphosphates
EDTA Ethylenediaminetetraacetic acid
EPPO The European and Mediterranean Plant Protection
UK), 3 µl 10x E buffer provided with restriction enzyme and 5 µl of HPLC water,
for 3 hours at 65°C. Loading dye was added to the digestion mix which was
loaded on a 2% TBE agarose gel to obtain an RFLP image. The digested
products were separated by electrophoresis and visualised with UV illumination.
As controls, plasmid DNA from clones of the three amplification types previously
obtained from different populations from the JHI PCN collection were also
amplified and digested as described above (Grujić, 2010).
4.2.6. Cytochrome B sequencing
Two specific primers INRAcytbR and INRAcytbL(Table 4-1) were used to
amplify most of the CytB gene (Picard et al., 2007). The CytB amplification was
carried out using PureTaq Ready-To-Go PCR Beads (GE Healthcare UK Ltd,
Little Chalfont, UK) in a 25 μl PCR reaction containing 21 μl HPLC water, 1 μl of
each primer and 2 μl of template DNA. Amplification conditions were: 94°C for
2 min followed by 40 cycles at 94°C for 30 s, 55°C for 30 s, 72°C for 30 s with
the extension at 72°C for 5 min and a hold at 20°C. 25 µl of the PCR product
was loaded in 2% agarose gel in TBE buffer.
The CytB PCR products were extracted from the agarose gel using a sterile
scalpel and purified with a Qiagen MinElute Gel Extraction Kit (Qiagen,
Crawley, West Sussex, UK) according to manufacturer’s protocol. The purified
DNA concentration was measured using a NanoDrop spectrophotometer
(ThermoScientific, Wilmington, USA), appropriately diluted, and sequenced in
166
the JHI sequencing facility in both directions using primers INRAcytbR and
INRAcytbL.
Table 4-1 List of the primers used in this study, their sequences, use and sources.
Primer Primer sequence Use of primers Source
PITSr3 5’-AGCGCAGACATGCCGCAA-3’ Distinguishing
PCN species
(Bulman and
Marshall,
1997),
PITSp4 5’-ACAACAGCAATCGTCGAG-3’ Distinguishing
PCN species
Bulman and
Marshall,
1997
UNI 5’-CGTAACAAGGTAGCTGTAG-3’ Distinguishing
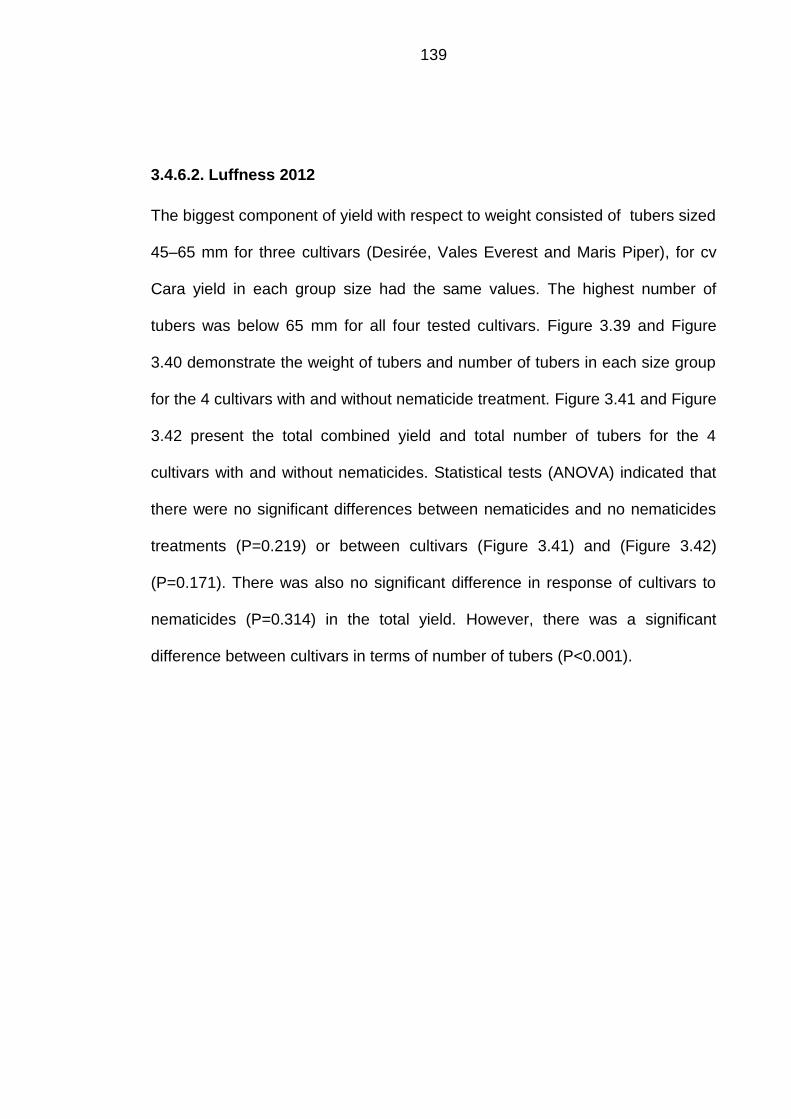
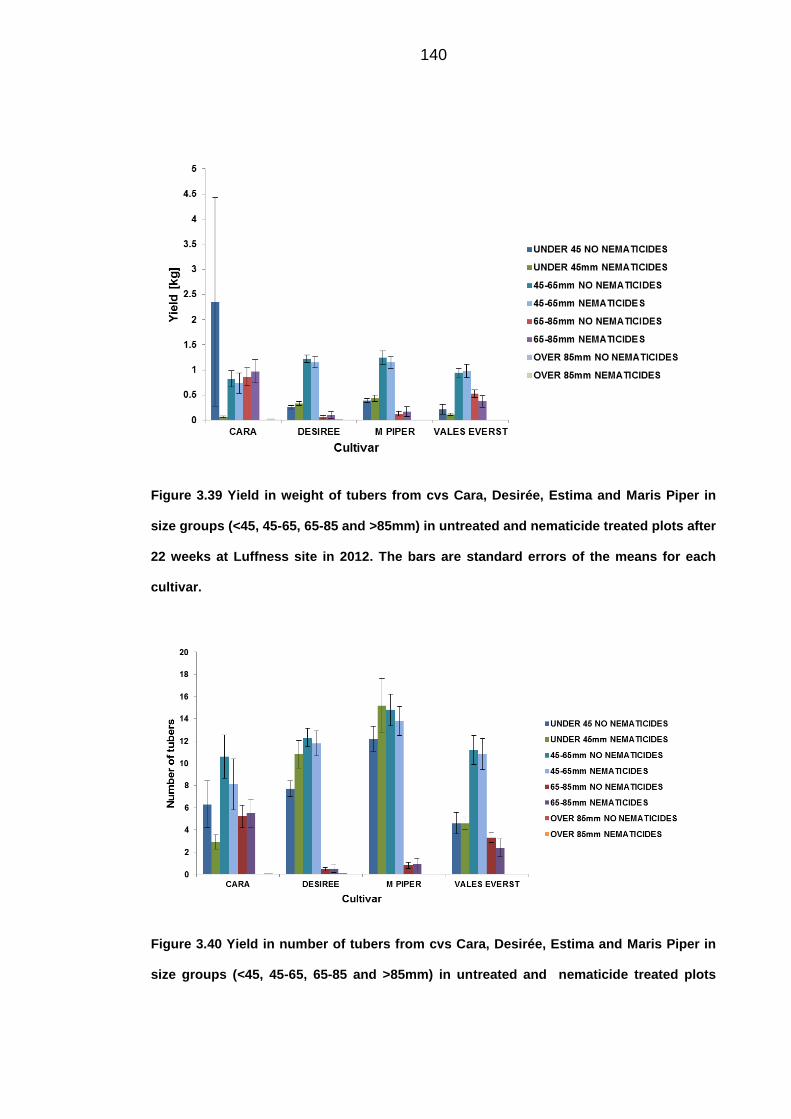
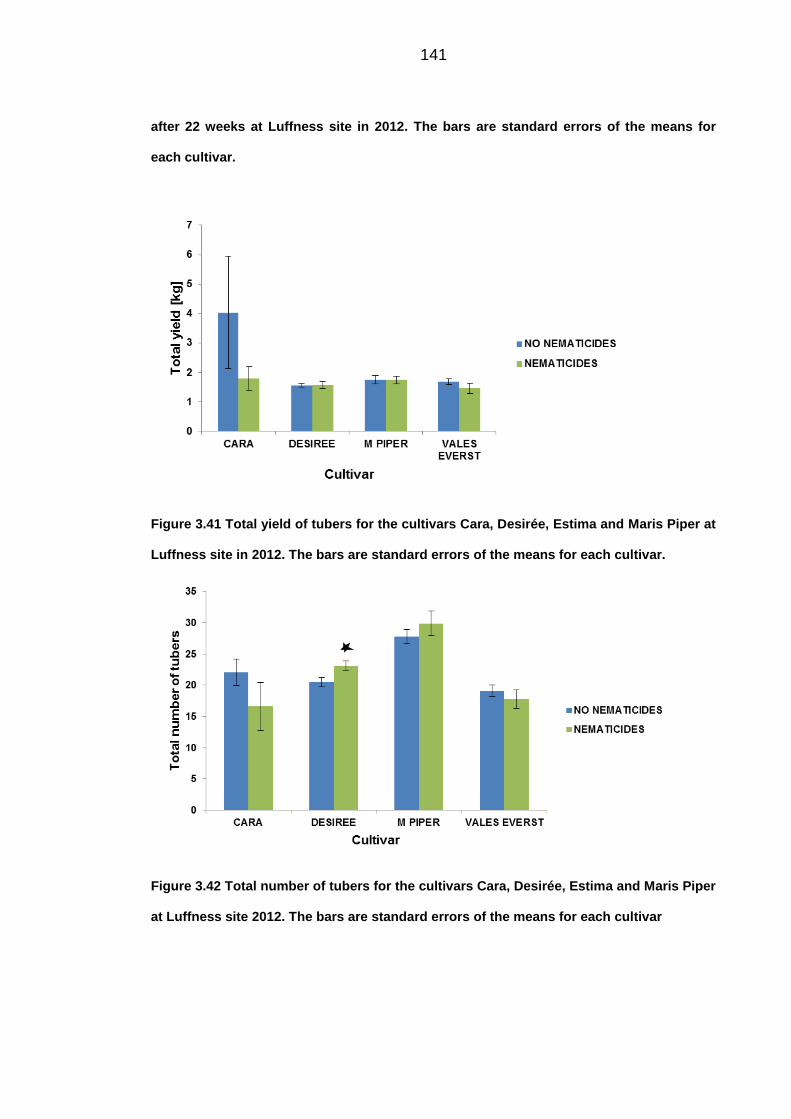
PCN species
(Ferris et al.,
1993)
F3mtDNA
222
5-
ATTAGACCGATAAGTTTACACCTTG-
3’
S222 noncoding
region (Grujić, 2010)
scmt 4-8 5’-GACTAGGTCCATCAATCTGAACC-
3’
S222 noncoding
region (Grujić 2010)
INRAcytbL 5’-GGGTGTGGCCTTGTTATTTC-3’ CytB gene
amplification
(Picard et al.
2007)
INRAcytbR 5’-ACCAGCTAAAACCCCATCCT-3’ CytB gene
amplification
(Picard et al.
2007)
4.2.7. Bioinformatic analysis
The CytB sequences obtained were edited and consensus sequences of
forward and reverse sequences produced using Sequencher 4.9 (Gene Codes
Corporation, Ann Arbor, USA) and Jalview (Clamp et al., 2004). Sequences
167
were aligned with those obtained from G. pallida populations in the JHI PCN
collection including UK, European and S. America populations or from the
NCBI database. The phylogenetic analysis was performed by constructing a
maximum likelihood tree using the HKY model using TOPALi (Milne et al.,
2004). Bootstrap analyses were based on 1000 iterations. The phylogenetic
tree was rooted with G. rostochiensis (JHI sequence collection) and G.
mexicana (Plantard et al., 2008) CytB sequences as outgroups and edited in
FigTree v1.4.0 (Rambaut, 2009).
4.3. Results
4.3.1. PCR RFLP
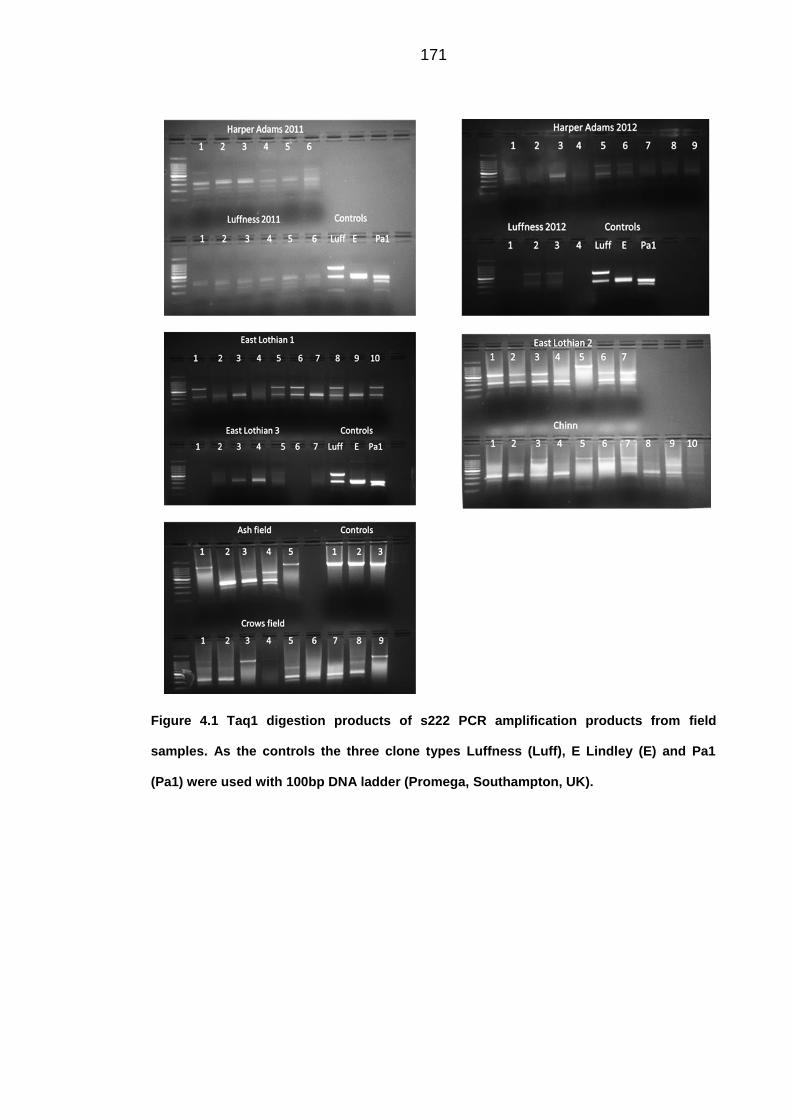
The comparison between field populations and the three plasmid clone types
(Lindley, Luffness and Pa1) is shown in Figure 4.1. Cysts extracted from the
fields located in the East Lothian region showed three groups of digestion
patterns. The field used for the 2011 experimental plots had cysts of the “E
Lindley” type, and the site used for trials in 2012 showed mixtures of the
“Luffness” and “E Lindley” type. Three other fields sampled also located in East
Lothian showed the presence of mixtures of Lindley and Luffness types with the
predominance of the Luffness type. One cyst from field number 2 in East
Lothian was not digested and two from number 3 failed to digest. Interestingly
one of the cysts had the same digest pattern as the “Pa1” type (Table 4-2).
Cysts extracted from the samples taken from Shropshire gave an identical
pattern to the “E Lindley” type, however two singles cyst from the Ash field and
one from the Chinn field belonged to the “Luffness” type. Similar results were
168
obtained from the cysts collected from experimental plots in 2012 at Harper
Adams. Surprisingly, the results suggest that within one cyst there was a
mixture of both “E Lindley” and “Luffness” mitochondrial types.
Table 4-2 Results after digestion with a restriction enzyme TaqI of s222 PCR amplification
products from field samples.
Population RFLP result Number of cysts
HARPER ADAMS 2011 Luffness type 3
HARPER ADAMS 2011 Lindley type 3
HARPER ADAMS 2012 Luffness type 3
HARPER ADAMS 2012 Lindley type 2
HARPER ADAMS 2012 Pa1 type 1
LUFFNESS 2011 Lindley type 6
LUFFNESS 2012 Luffness type 2
EAST LOTHIAN 1 Luffness type 5
EAST LOTHIAN 1 Lindley type 4
EAST LOTHIAN 2 Luffness type 5
EAST LOTHIAN 2 Pa1 type 1
EAST LOTHIAN 3 Luffness type 2
EAST LOTHIAN 3 Lindley type 2
CHINN Luffness type 2
CHINN Lindley type 6
ASH Luffness type 1
ASH Lindley type 2
CROWS Luffness type 1
CROWS Lindley type 5
169
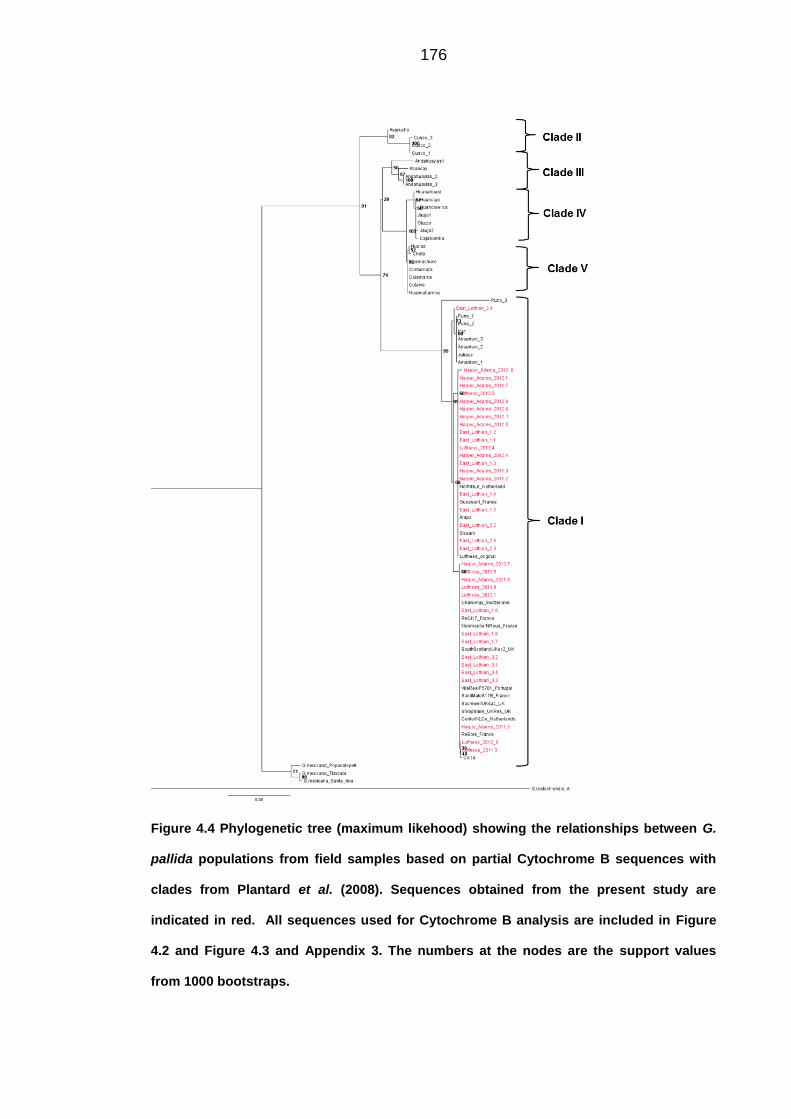
4.3.2. Cytochrome B sequences
Partial sequences of the mitochondrial cytochrome B from single cysts sampled
from seven fields were aligned with sequences obtained by Plantard et al.
(2008), Pylypenko et al., (2008), and The James Hutton Institute collection
(unpublished). An alignment of these sequences is presented in Figure 4.2 and
Figure 4.3. The differences between single cysts in their sequence
polymorphisms are shown in Table 4-3. A phylogenetic tree, representing the
relationships between these sequences was created and is presented in Figure
4.4 with populations of G. mexicana and G. rostochiensis used as outgroups.
Populations obtained from this study were clustered into one big clade, with two
subclades. In the first subclade only one sample (East Lothian 2.4) was
clustered together with the Peruvian populations (Puno, Amantani, and Juliaca)
and Pa1 from Scotland. The second subclade consisted of two groups and
separated the Luffness and E Lindley populations. The first group consisted of
three European populations, Oussant from France, the second from North of
Netherlands and a third from Scotland (Luffness), which were clustered with two
Peruvian populations (Arapa and Sicuani). In the second group, three cysts
from Harper Adams (2011 and 2012) and from East Lothian were clustered
together with European populations (Portuguese Vila real, Swiss Chavornay,
French Noirmoutier Rei bois and Saint Meloir, British from Shropshire,
Sacrewell Peterborough, South Scotland and Dutch from the Centre of
Netherlands). The phylogenetic tree shows that in most of the sites the
populations consisted of mixtures of the different mitochondrial types. Therefore
this indicates that the sites used for field experiments (Chapter 3) were infested
170
by a mixture of population types (Luffness and E Lindley) which probably
represent 2 different introductions from S. America. The field 1 from East
Lothian also had two types (Lindley and Luffness) like the Luffness field in
2012. Only the E Lindley type was found in the Luffness experimental plots in
2011 whereas the East Lothian field number 2 was populated by the Pa1 or
Luffness and number 3 by E Lindley.
171
Figure 4.1 Taq1 digestion products of s222 PCR amplification products from field
samples. As the controls the three clone types Luffness (Luff), E Lindley (E) and Pa1
(Pa1) were used with 100bp DNA ladder (Promega, Southampton, UK).
172
Figure 4.2 First part of the alignment of the edited sequences in Jalview (Clamp et al.,
2004) showing the relationships between G. pallida Peruvian and European populations
(Appendix 3) based on partial Cytochrome B sequences.
173
Figure 4.3 Second part of the alignment of the edited sequences in Jalview (Clamp et al.,
2004) showing the relationships between G. pallida Peruvian and European populations
(Appendix 3) based on partial Cytochrome B sequences.
174
Table 4-3 Summary of Cytochrome B sequence polymorphisms from 39 single cysts from
field samples. Populations in green are the sequences that showed similarity to Luffness
clone, in yellow to E Lindley and in red to Pa1. The SNP positions are indicated with
reference to the sequences shown in Figure 4.2 and Figure 4.3. At position 221 both G
and A were observed in the electrophenograms in some samples. Missing values are due
to short sequences.
cyst Population 47 66 140 155 221 237 305 327 345
1 HARPER ADAMS 2011.2 T T C A G (A) A T T T
2 HARPER ADAMS 2011.3 T T C A G A T T T
3 HARPER ADAMS 2011.4 C T C C G A G
4 HARPER ADAMS 2011.5 C T C C G A G C C
5 HARPER ADAMS 2011.7 T T C A G A
6 HARPER ADAMS 2012.1 T T C A G (A) A T T
7 HARPER ADAMS 2012.2 C T C C
8 HARPER ADAMS 2012.3 T T C A G (A) A T
9 HARPER ADAMS 2012.4 T T C A G (A) A T T T
10 HARPER ADAMS 2012.5 T T C A
11 HARPER ADAMS 2012.6 T T C A G (A) A T
12 HARPER ADAMS 2012.7 C T C C G (A) A
13 HARPER ADAMS 2012.8 C T C A/C G/A A T T T
14 HARPER ADAMS 2012.9 T T C A G (A) A T
15 HARPER ADAMS 2012.10 T T C A G (A) A T
16 LUFFNESS 2011.3 C T C C
17 LUFFNESS 2011.6 C T C C G (A) A G C
18 LUFFNESS 2012.1 C/T T C A/C G (A) A G (T)
19 LUFFNESS 2012.2 T T C C
20 LUFFNESS 2012.3 T T C A G (A) A
21 LUFFNESS 2012.4 T T C A G (A) A T T T
22 LUFFNESS 2012.5 C T C C G (A) A G
23 LUFFNESS 2012.6 C T C C G
24 EAST LOTHIAN 1.1 T T C A G (A) A T T T
25 EAST LOTHIAN 1.2 T T C A G (A) A T T T
26 EAST LOTHIAN 1.3 T T C A G (A) A T T T
27 EAST LOTHIAN 1.4 T T C A G (A) A T T T
28 EAST LOTHIAN 1.5 T T C A G (A) A T T T
29 EAST LOTHIAN 1.6 C T C C G (A) A G C C
175
30 EAST LOTHIAN 1.7 C T C C G (A) A G C C
31 EAST LOTHIAN 1.8 C T C C G (A) A G C C
32 EAST LOTHIAN 3.1 C T C C G (A) A G C C
33 EAST LOTHIAN 3.2 C T C C G (A) A G C C
34 EAST LOTHIAN 3.3 C T C C G (A) A G C C
35 EAST LOTHIAN 3.4 C T C C G (A) A G C C
36 EAST LOTHIAN 2.2 T T C A G (A) A T T T
37 EAST LOTHIAN 2.3 T T C A G (A) A T T T
38 EAST LOTHIAN 2.4 T C T C G (A) G T T C
39 EAST LOTHIAN 2.6 T T C A G (A) A T T T
“LUFF” T T C A G A T T T
“PA1” T C T C G G T T C
“E” C T C C G A G C C
176
Figure 4.4 Phylogenetic tree (maximum likehood) showing the relationships between G.
pallida populations from field samples based on partial Cytochrome B sequences with
clades from Plantard et al. (2008). Sequences obtained from the present study are
indicated in red. All sequences used for Cytochrome B analysis are included in Figure
4.2 and Figure 4.3 and Appendix 3. The numbers at the nodes are the support values
from 1000 bootstraps.
177
4.4. Discussion
The present study was designed to molecularly characterise the populations at
the field sites in Luffness and Harper Adams and to examine the composition of
PCN populations in several fields near Luffness in Scotland and in England. All
cysts examined belonged to one of the three European types previously
described with the mitochondrial markers used. Almost all of the cysts
corresponded to the E Lindley and Luffness (Pa2/3) types with 2 cysts of the
Pa1 type. This finding accords with Plantard et al. (2008) and Pylypenko et al.
(2008) who reported that European populations originated from southern Peru.
All of the sequences from this study were clustered into clade I (Plantard et al.,
2008) containing the Southern Peruvian populations Puno, Amantani, Juliaca,
Arapa, Sicuani and Colca which are located in the vicinity of Lake Titicaca. This
also accords with observations of Pylypenko et al. (2008) and Grujić (2010),
suggesting that the populations represented by the E Lindley and Luffness
types are widespread in Europe and are likely to have originated from founder
populations from S. America that are continuing to be spread within Europe,
which has become a secondary distribution source. One of the most interesting
findings was a cyst that clustered together with the south Peruvian populations
that includes the Pa1 population. Pathotype Pa1 populations differ from Pa2/3
populations in their virulence on hosts with the H2 resistance gene and in their
isozyme profiles (Fleming and Marks, 1983). The Luffness population was also
differentiated by PCR-RFLP and isozyme studies (Phillips et al., 1992) and is
known to be more virulent than other British Pa2/3 (Phillips et al., 1991). The
widespread occurrence of cysts with the Luffness type was also not expected.
178
Cysts originally collected from Luffness that are in the JHI PCN cyst collection
have the Luffness type and E Lindley cysts have the E Lindley types. The
finding of fields that have mixtures of these 2 types, and also the occasional
presence of the Pa1 types has implications for the virulence characteristics of
the field population and raises the possibility of interbreeding between these
types to create hybrids with unknown virulence characteristics. The results
reported in this thesis demonstrate that more than one virulence establishing
protocol should be applied when investigating the populations of PCN.
Comparison of the digestion results of the noncoding scmtDNA IV with the
phylogenetic analyses of the cytochrome B revealed that both methods
successfully determined the same populations of G. pallida: E Lindley, Pa1 and
Luffness. Due to the limited replication (only ten cyst per field were tested)
variations within the fields might not have been detected by a single method,
however a combined data set of both scmtDNA and CytB markers gave a better
perspective of the virulence of analysed populations.
179
SUMMARY AND CONCLUSIONS 5.
Potato cyst nematodes (PCN) are major parasites of potato and other members
of the Solanaceae family. PCN causes substaintial crop yield loss to world-wide
agriculture. Infected plants usually have a smaller root system, which explores a
smaller volume of soil (Trudgill, 1983) and the damaged roots are adversely
affected by water stress and disturbances of nutrient metabolism (see Chapter
1). Generally, the population of Globodera spp. in the field at the time of
planting correlates with the level of yield losses (Chapter 3). The population
dynamics of PCN and related yield loss of the potato crop, are dependent on
the initial population of PCN in the field as well as environmental factors, soil
type, and cultivar tolerance and resistance.
This thesis reports the results of experiments conducted on the life cycle of
PCN under laboratory (Chapter 2) and the field conditions (Chapter 3) to obtain
a better understanding of factors that affect population dynamics of PCN in
different agroecological conditions. The initial aim was to determine the duration
of the life cycle of PCN and the number of generations per year in different
temperature regimes. Establishing the total hatch in potato root diffusate (PRD)
and expressing the number of hatched juveniles in the different temperature
conditions, as a percentage of total eggs allowed a comparison between both
species (Globodera pallida and G. rostochiensis). The species significantly
differ in hatching and temperature preferences. These differences in the
hatching responses have implications for the rates and amounts of
multiplication and competition between the two species in particular soil
180
temperature profiles. G. pallida was more efficient in overall hatching, whereas
G. rostochiensis generally hatched more quickly. Also, G. pallida had a broader
temperature range over which similar amounts of hatching occurred and low soil
temperatures are likely to favour G. pallida, whereas warmer temperatures are
likely to favour G. rostochiensis. The results also suggest that the hatching
response for both species of PCN is greater and faster at the higher
temperatures tested and therefore increases in soil temperatures due to
regional climatic differences or climate change are likely to favour PCN
multiplication.
Motile juveniles and adult life stage PCN were examined for their response to
temperature variation. Chapter 2 describes a series of experiments, which were
carried out in pots in semi natural conditions. The occurrence of juveniles in the
soil reflects the time period, amount of hatching that has occurred in the
different temperature regimes and also indicated whether a second hatch had
occurred. At higher soil temperatures the amount and the speed of population
multiplication was greater. In the growth cabinet experiments the presence of a
second peak of juveniles indicates that diapause was not obligatory in these
conditions. The results from Chapter 2 and Chapter 3 suggest that one
generation of G. pallida takes <10 weeks at average soil temperatures found in
UK and therefore it is possible that 2 generations could be completed in <20
weeks at warmer temperatures. The experiment examining the emergence of
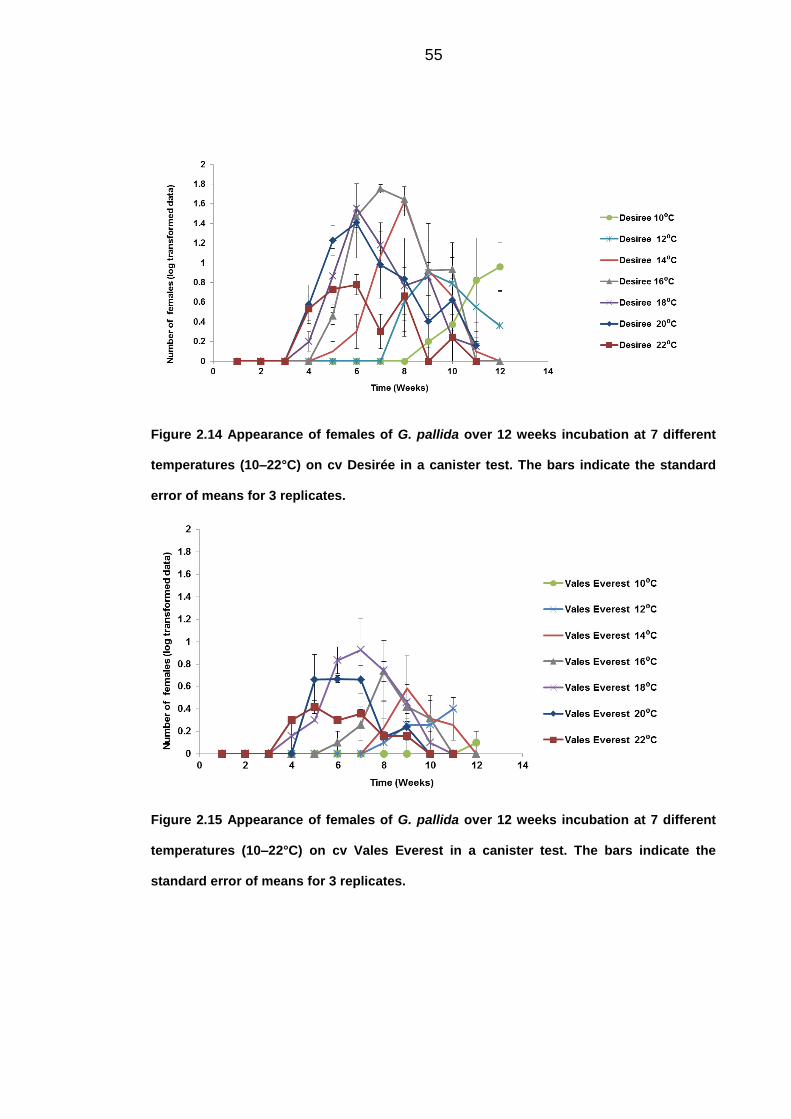
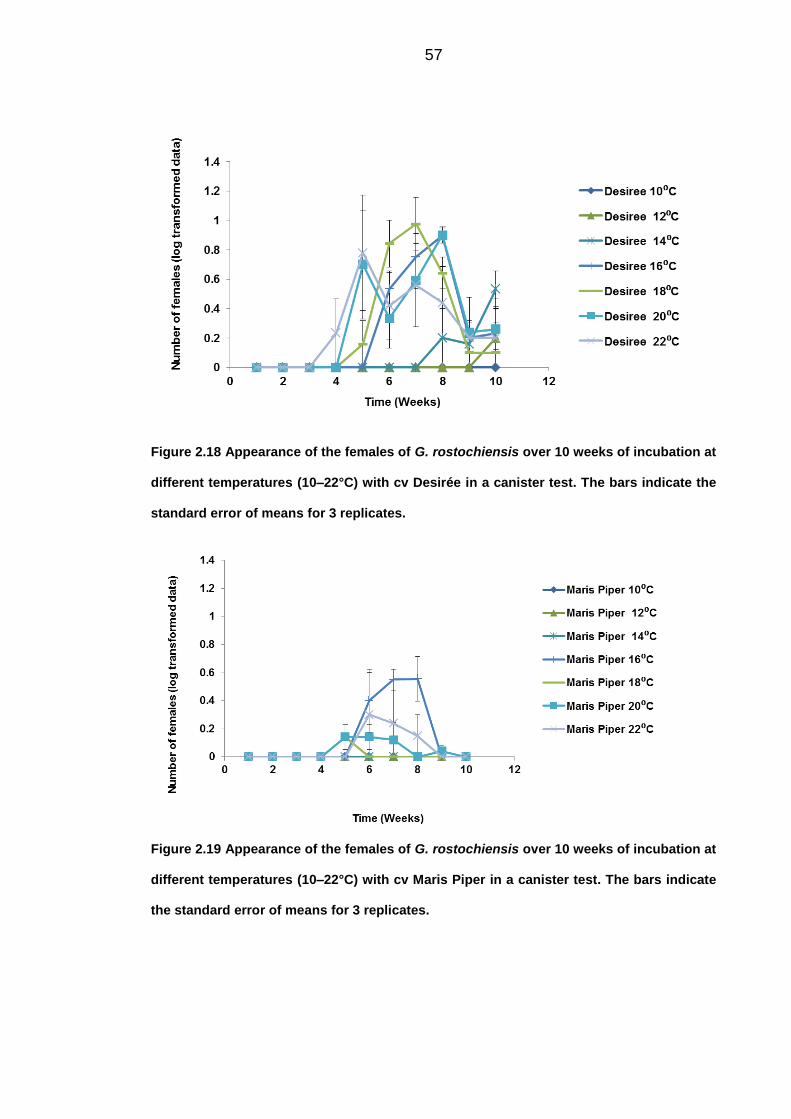
females at different temperatures and on different cultivars revealed also the
response in the number of females observed. The most optimal temperature for
the development of females was 16°C on the susceptible cv Desirée, with the
181
first appearance 4 weeks after inoculation. Although, the numbers of females
observed was greatly reduced with the partially resistant cultivar Vales Everest,
there was still an effect on the response at different temperatures. The
difference in occurrence of the first males (5 weeks) and females (4 weeks)
could be due to the less efficient recovery of males from the soil.
The field experiments were undertaken to compare and relate the results from
the life cycle experiments performed in controlled conditions to those in
naturally infested potato fields. The trials were located in 2 different
agroecosystems with different soil temperature profiles.
The findings observed in the field trials support the results from those in
laboratory conditions, and support the hypothesis that parts of the UK with
higher soil temperatures, or years in which crop planting coincides with warmer
soil temperatures, are likely to have higher levels of hatching of PCN and thus
greater multiplication. The presence of juveniles inside the stained root samples
at the end of the growing season might support the possibility that the diapause
stage can be omitted leading to a second hatch and consequently a second
generation of PCN in the fields with warmer soil temperatures. This might lead
to greater challenges in controlling population levels through use of nematicides
and rotation, and in limiting spread. However, if the timing of harvest is correct
the second hatch might be an opportunity to decrease the population in the
field. These experiments, which provide data from which the impact of
temperature on PCN population dynamics can be predicted, should assist
growers in making appropriate management decisions for their particular
circumstances.
182
Although a small number of field trials were conducted in this study, the findings
suggest that the nematicide treatments were not able to prevent all hatching or
root invasion by juveniles in field conditions, but that, they delayed these
processes significantly. Woods et al., (1999) came to the conclusion that
fosthiazate inhibits hatching temporarily of G. pallida in an in vitro test and
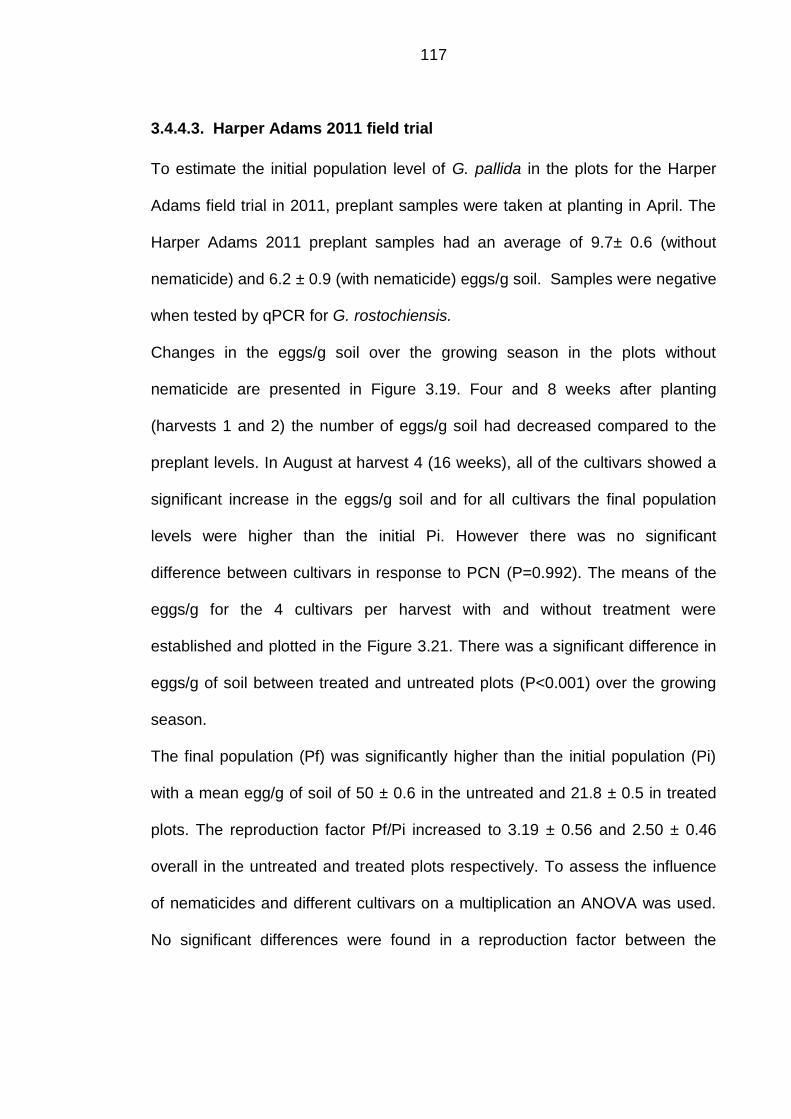
delayed hatching in soil. Results from the Harper Adams 2011 field trail
supported this hypothesis, emphasising the temporality of the hatch inhibition.
This indicates the importance of the harvest time, for example at the end of field
experiments there was no difference in reproduction factor between treated with
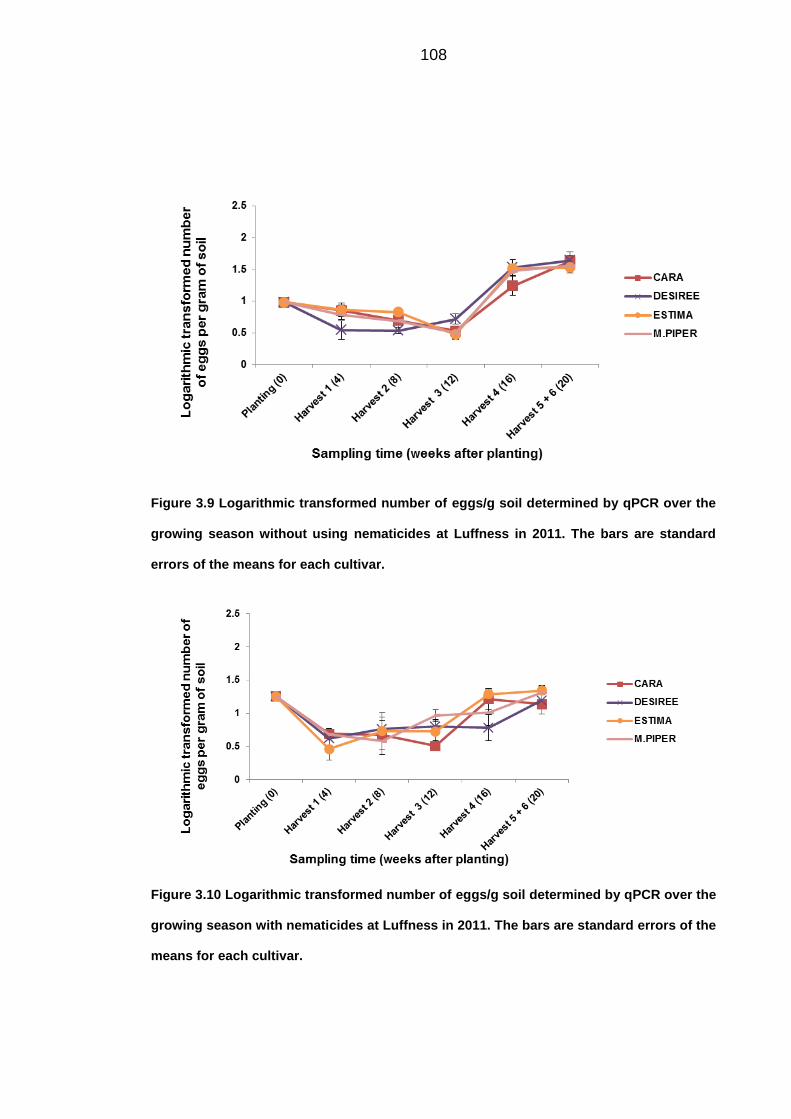
nematicide and untreated experimental plots. At the Luffness (2011) field site,
the Vydate (oxamyl) treatment reduced the population significantly. However, it
is hard to determine whether the difference between a reduction in the
multiplication rate is caused by the nematicide application or due to the higher
initial number of eggs in the soil. Low initial densities and cold- wet weather in
2012 made it difficult to reveal differences between the cultivars and nematicide
treatment. At Harper Adams the multiplication rate was extremely high on the
untreated fields. At both sites Vydate was used as a control method, and there
was no difference in multiplication rates between the nematicide and non-
nematicide treated plots. In both treatments the Pf/Pi rate was significantly
higher at Harper Adams than at Luffness, which might be related to the low
densities and poor environmental conditions, as well as differences in the
virulence between two populations of G. pallida (Phillips et al., 1991; Trudgill et
al., 2014).
183
The field experiments in Chapter 3 also showed that there is a strong
relationship between PCN multiplication and initial density (Pi), moreover
indicated that Pi is negatively correlated with the reproduction rate of PCN. The
results also suggest that the lower initial population correlates with a higher
reproduction rate. Therefore low densities of PCN might significantly increase
crop losses in subsequal planting years. This finding also has important
implications for modelling PCN population dynamics for use in establishing
control methods.
The results in Chapters 2 and 3 confirmed that resistant and partially resistant
cultivars are effective in suppressing multiplication of PCN and thus are
important control methods. The cultivar Vales Everest greatly stopped
population multiplication of G. pallida in the laboratory experiments (female
canister experiment and competition experiment), and in the field experiments
slowed down multiplication of PCN in the plots resulting in the lowest Pf/Pi rate
compared to other cultivars at Harper Adams.
Furthermore, Chapter 3 included an investigation of the relationship between
the population dynamics of PCN in terms of species composition and initial
density in the field. The results showed a significant reduction in the
multiplication rate of both species in pots inoculated with mixed populations.
A decrease in G. rostochiensis multiplication rate was found when G. pallida
was present in higher or equal initial densities on cultivars Desirée and Vales
Everest.
One explanation is that G. pallida hatched more efficiently thereby allowing this
species to occupy the roots more effectively and reducing available sites for G.
184
rostochiensis development. The opposite effect was observed on Vales Everest
when the main species in the inoculum was G. rostochiensis. Partial resistance
combined with higher density of G. rostochiensis reduced multiplication rate of
G. pallida, implying that there could be feeding site competition between the 2
species.
In chapter 4 molecular markers were used to characterise populations of PCN
in the field trial sites and in other potato fields in the 2 regions. Two
mitochondrial DNA markers (s222 and partial Cytochrome B) were used to
characterise individual cysts. The majority of examined cysts were classified as
G. pallida pathotype Pa2/3 which is consistent with these populations belonging
to the same molecular groups as those of the majority of the other European
populations that have been characterised, and indicates that they could have
resulted from the continuing spread of G. pallida within Europe. In one of the
East Lothian fields and in one from Shropshire, Pa1 cysts were found, which
indicates that this pathotype is not restricted to Duddingston, Scotland as
described (Stone et al., 1986). The presence of Pa1 and Pa2/3 molecular types
within the same field raises the potential for interbreeding between a
populations and the possibility of novel virulence characteristics.
The work presented in this thesis is the first example of the application of
quantitative PCR to investigate population dynamics of PCN in field conditions
and as reported in detail in the results section in Chapter 3, the application of
qPCR provided less variable results. Both of these methods were combined to
investigate the life cycle and the population dynamics of PCN from two field
185
sites in the United Kingdom where PCN were naturally present,The results of
the application of qPCR provided less variable results compared to visual
analysis of the root infestation. The ability to detect the nematode infestation in
the field using qPCR is an important step forward which provides a more
reliable estimate of the level of infestation, and can help monitor the results of
control of PCN population.
Due to limited resources and space, technical replication was not at a
satisfactory level (for the growth cabinet experiments in Chapter 2). This meant
that it was not possible to obtain the significant statistical power and the
statistical analysis could not be performed. A second limitation was the
dependence on natural PCN infestation within the fields chosen for the field
trails, as shown in Chapter 3. The populations of PCN varied between year and
locations. For example, in 2012 infestations of the potato fields were extremely
low, which made it hard to investigate the population dynamics of PCN in this
year.
Nevertheless, in conclusion warmer soil temperatures increase population
levels on susceptible hosts and increase damage to the crop. Regions of the
UK with relatively higher soil temperatures, or years in which crop planting
coincides with warmer soil temperatures are thus more likely to have greater
multiplication and have greater challenges in controlling population levels. Once
introduced to the field PCN is difficult to control, mainly due to of the lack of fully
resistant cultivars (G. pallida) and the fact that nematicides are at risk of
complete withdrawn from the market due to their hazardous nature. The
presence of different pathotypes for each potato cyst nematode species
186
complicates further the control of PCN as some pathotypes are more virulent
than others. When the species composition in the field is known, appropriate
control method can be employed. For successful control of PCN a combination
of the timing of the harvest to limit population multiplication, use of resistant
varieties and crop rotation with limited nematicide application can be used in
integrated pest management strategies. Knowledge of this background variation
allows a more precise assessment of the performance of various PCN control
measures in different environments and application of low risk control
strategies.
187
FUTURE WORK 6.
The data obtained in this thesis could be used for the further development of the
PC PCN integrated pest management system as a selection and timing tool.
The data is also being used for the development of a dynamic stage-structured
simulation model for PCN based on time delay differential equations with
determination by climate parameters. The model is designed to study the
dynamics of various life stages (egg-juvenile-adult) using the data obtained in
this study.
Chapter 2 and Chapter 3 indicated that there are significant differences in the
population dynamics, yield loss due to differences in soil temperature between
seasons, and species-specific temperature responses in development, all of
which the current PC PCN model does not describe. Combining the dynamic
model of PCN population development from hatching to formation of eggs in
new cysts, including the possibility of second generation within one growing
season, with the model of potato crop growth from planting to harvest would
broadly predict the mechanisms of yield reduction and population increase.
Improving assays for pathotyping PCN is also worth further investigation, as
pathotype differentiation is important for choosing the best potato cultivar with
tolerance and resistance against potato cyst nematodes. In this research,
molecular techniques of sequence comparison of cytochrome B and PCR RFLP
were used to examine the intraspecific composition of the PCN in field samples.
These tools combined with other diagnostic methods for species determination,
could provide additional information about the intra-specific characteristics of
188
potato cyst nematodes populations but they still require validation to show that
the molecular markers are associated with specific phenotypes.
Finally, taken together, the opportunity for developing better tools for PCN
management presented above, i.e.: updating the PCN model and improving
pathotyping methods that would allow control strategies that are most
appropriate for a certain region and agroecological situation to be employed.
This will be beneficial for future intergrated pest management approaches used
within sustainable agriculture strategies. Further work needs to be done to
establish the role of temperature on competition between the two species and
how this effects competition at feeding sites directly in the roots in different
potato genotypes. Inter and intra-specific competition and the impact of
temperature on decline rates merit further investigation to assess whether these
variables should be included in the PCN population dynamics model.
Another area that would be interesting to investigate in the future is the second
generation nematodes that were able to avoid entry into diapause. Chapter 2
and 3 indicated that in suitable conditions PCN is able to avoid the diapause
stage. A comparison of these nematodes with those that do enter diapause
could help identify which genes are responsible for the diapause stage and
what triggers them.
189
REFERENCES 7.
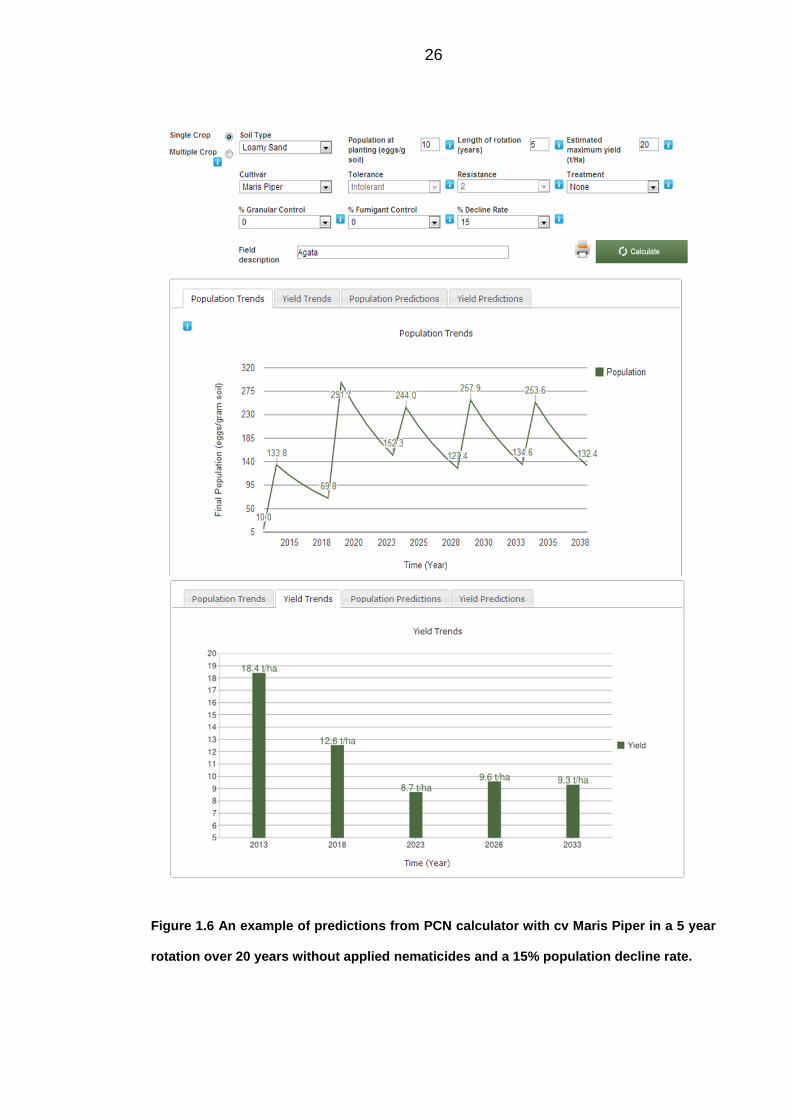
AHDB, 2009. PCN Calculator, Integrated Control of Globodera pallida. The Agriculture and Horticulture Development Board http://www.potato.org.uk/online-toolbox/pcn-calculator.
Ambrogioni L., Tiziana I., and Caroppo S., 2000. Basal threshold temperature and life cycle of Globodera tabacum on eggplant in relation to accumulated day degrees. Nematologia Mediterranea 28, 73–76.
Armstrong M. R., Husmeier D., Phillips M. S., and Blok V. C., 2007. Segregation and recombination of a multipartite mitochondrial DNA in populations of the potato cyst nematode Globodera pallida. Journal of Molecular Evolution 64, 689–701.
Bakker J., Bouwman-Smits L., and Gommers F. J., 1992. Genetic Relationships Between Globodera pallida Pathotypes in Europe Assessed by Using Two Dimensional Gel Electrophoresis of Proteins. Fundamental and Applied Nematology 15, 481–490.
Behrens E., 1975. Globodera Skarbilovich, 1959 an independent genus in the subfamily Heteroderinae Skarbilovich, 1949. (Nematoda: Heteroderidae). Vortragstagung zu Aktuellen Problemen der Phytonematologie 1,12–26.
Bendezu I. F.,. Russell M. D., and Evans K., 1998. Virulence of populations of potato cyst nematodes (Globodera spp.) from Europe and Bolivia towards differential potato clones frequently used for pathotype classification. Nematologica 44, 667–681.
Blok V. C., Phillips M. S., and Harrower B. E., 1997. Comparison of British populations of potato cyst nematodes with populations from continental Europe and South America using RAPDs. Genome 40, 286–293.
Blok V. C., Malloch G., Harrower B., Phillips M. S., and Vrain T. C., 1998. Intraspecific variation in ribosomal DNA in populations of the potato cyst nematode Globodera pallida. Journal of Nematology 30, 262–274.
Blok V. C., 2005. Achievements in and future prospects for molecular diagnostics of plant-parasitic nematodes. Canadian Journal of Plant Pathology 27, 176–185.
Blok V., Kaczmarek A., and Palomares-Rius J. E., 2011. Influence of temperature on the life-cycle of Globodera spp. Communications in Agricultural and Applied Biological Sciences 76, 307–310.
Brodie B. B., Blow R. E., Brace N. L., and King J. H., 1976. A new technique for handling cysts of Heterodera rostochiensis during routine laboratory procedures. Plant Disease Reporter 60 936–938.
Brown E. B., 1983. The relationship of potato yield with and without nematicide to density of potato cyst nematodes, Globodera rostochiensis and G. pallida. Annals of Applied Biology 103, 471–476.
Bulman S. R., and Marshall J. W., 1997. Differentiation of Australasian potato cyst nematode (PCN) populations using the polymerase chain reaction (PCR). New Zealand Journal of Crop and Horticultural Science 25, 123–129.
Chitwood D. J., 2003. Nematicides. In Plimmer, J. R. (ed.), Encyclopedia of Agrochemicals. Wiley-Interscience, New York, USA, 1104–1115.
Clamp M., Cuff J., Searle S. M., and Barton G. J., 2004. The Jalview Java alignment editor. Bioinformatics 20, 426–427.
Clayton R., Storey M., Parker B., Ballingall M., and Davies K., 2008. Impact of reduced pesticide availability on control of potato cyst nematodes and weeds in potato crops. Knowledge Hub. Agriculture and Horticulture Development Board.
Da Cunha M. J. M., Da Conceição I. L. P. M., Abrantes I. M. de O., and Santos M. S. N. de A., 2012. Virulence assessment of Portuguese isolates of potato cyst nematodes (Globodera spp.). Phytopathologia Mediterranea 52, 51–68.
Dalamu, Bhardwaj V., Umamaheshwari R., Sharma R., Kaushik S. K., Joseph T. A., Singh B. P., and Gebhardt C. 2012. Potato cyst nematode (PCN) resistance: genes, genotypes and markers-an update. SABRAO Journal of Breeding and Genetics 44:202-228.
Dale M. F. B., Phillips M. S., Ayres R. M., Hancock M., Holliday M., Mackay G. R., and Tones S. J., 1988. The assessment of the tolerance of partially resistant potato clones to damage by the potato cyst nematode Globodera pallida at different sites and in different years. Annals of Applied Biology 113, 79–88.
Dale M. F. B., Scurrah M. M., Marks R. J., and Brodie B. B., 1998. Breeding for resistance to the potato cyst nematodes Globodera rostochiensis and Globodera pallida: strategies, mechanisms and genetic resources. In Marks R. J. and Brodie B. B. (eds), Potato cyst
191
nematodes, biology, distribution and control. CABI, Wallingford, UK, 167–195.
Dalzell J. J., Kerr R., Corbett M. D., Fleming C. C., and Maule A. G., 2011. Novel bioassays to examine the host-finding ability of plant-parasitic nematodes. Nematology 13, 211–220.
De Boer J. M., Smant G., Goverse A., Davis E. L., Overmars H. A., Pomp H., van Gent-Pelzer M., Zilverentant J. F., Stokkermans J. P., Hussey R. S., Gommers R. S., Bakker F. J., and Schots A., 1996. Secretory granule proteins from the subventral esophageal glands of the potato cyst nematode identified by monoclonal antibodies to a protein fraction from second-stage juveniles. Molecular Plant–Microbe Interactions 9, 39–46.
den Nijs L., 1992. Interaction between Globodera rostochiensis and G. pallida in simultaneous infections on potatoes with different resistance properties. Fundamental and Applied Nematology 15, 173–178.
Eisenback J. D., and Griffin G. D., 1987. Interactions with other nematodes. in: Veech, J. A. and Dickson, D. W. (eds) Vistas on nematology: a commemoration of the 25th anniversary of the Society of Nematologists, 313-320. Society of Nematologists, De Leon Springs, FL, USA.
Ellenby C., and Smith L., 1975. Temperature adaptation in the potato cyst nematode, Heterodera rostochiensis. Nematologica 21, 114–115.
Elliott M. J., Trudgill D. L., McNicol J. W., Phillips M. S., MacKerron D. K. L., and Haverkort A. J., 2004. Projecting PCN population changes and potato yields in infested soils. In MacKerron D. K. L. and Haverkort A. J. (eds), Decision support systems in potato production: bringing models to practice, Wageningen Academic Publishers, Wageningen, the Netherlands, 143–152.
Elston D. A., Phillips M. S., and Trudgill D. L., 1991. The Relationship Between Initial Population Density of Potato Cyst Nematode Globodera pallida and the Yield of Partially Resistant Potatoes. Revue de Nematologie 14, 213–220.
EPPO, 2014 PRQ-EPPO Plant Quarantine Data Retrieval System 5.3.1. http://www.eppo.org/DATABASES/pqr/pqr.htm
EPPO, 2006 Standard PM 3/68(1) Testing of potato varieties to assess resistance to Globodera rostochiensis and Globodera pallida. Bulletin OEPP/EPPO Bulletin 36, 419–420.
EPPO, 2013 Diagnostic Protocol PM 7/40(3) for Globodera rostochiensis and G. pallida. Bulletin OEPP/EPPO Bulletin 43, 119–138.
EU, 2007 Council Directive 2007/33/EC of 11 June 2007 on the control of potato cyst nematodes (and repealing Directive 64/465/EEC).
Evans K., 1969. Changes in a Heterodera rostochiensis population through the growing season. Annals of Applied Biology 64, 31–41.
Evans K., Franco J., and Descurrah M. M., 1975. Distribution of Species of Potato Cyst-Nematodes in South America. Nematologica 21, 365–369.
Evans, K., and Haydock P. P. J., 1990. A review of tolerance by potato plants of cyst nematode attack, with consideration of what factors may confer tolerance and methods of assaying and improving it in crops. Annals of Applied Biology 117, 703–740.
Evans K., 1993. New Approaches for Potato Cyst Nematode Management. Nematropica 23, 221–231.
Evans K., Webster R., Barker A., Halford P., Russell M., Stafford J., and Griffin S., 2003. Mapping infestations of potato cyst nematodes and the potential for spatially varying application of nematicides. Precision Agriculture 4, 149–162.
Ferris H., Castro C., Caswell E., Jaffee B., Roberts P., Westerdahl B., and Williamson V., 1992. Biological approaches to the management of plant-parasitic nematodes. In Beyond pesticides: biological approaches to pest management in California. Division of Agriculture and Natural Resources, University of California, CA, USA, 68–101.
Ferris H., Du Vernay H. S., and Small R. H., 1978. Development of A Soil-Temperature Data Base on Meloidogyne arenaria for A Simulation Model. Journal of Nematology 10, 39-42.
Ferris V., Ferris J. M., and Faghihi J., 1993. Variation in spacer ribosomal DNA in some cyst-forming species of plant parasitic nematodes. Fundamental and Applied Nematology 2, 177–184.
Fleming C. C., and Marks R. J., 1983. The identification of the potato cyst nematodes Globodera rostochiensis and G. pallida by isoelectric focusing of proteins on polyacrylamide gels. Annals of Applied Biology 103, 277–281.
Fleming C. C., and Powers T. O., 1998. Potato cyst nematode diagnostics: morphology, differential hosts and biochemical techniques. In Marks R. J. and Brodie B. B. (eds), Potato Cyst Nematodes, Biology, Distribution and Control. CABI, Wallingford, UK, 91–114.
193
Fox P. C., and Atkinson, H. J., 1984. lsoelectric focusing of general proteins and specific enzymes from pathotypes of Globodera rostochiensis and G. pallida. Parasitology 88, 131–139.
Foot M. A., 1977. Laboratory rearing of potato cyst nematode; a method suitable for pathotyping and biological studies. New Zealand Journal of Zoology 4, 183–186.
Foot, M. A., 1978. Temperature responses of three potato-cyst nematode populations from New Zealand. Nematologica 24, 412-417
Forrest J. M. S., and Phillips M. S., 1984. The effect of continuous rearing of a population of Globodera pallida (Pa 2) on susceptible or partially resistant potatoes. Plant Pathology 33, 53–56.
Franco J., 1979. Effect of Temperature on Hatching and Multiplication of Potato Cyst Nematodes. Nematologica 25, 237–244.
Franco J., 1986. Potato cyst nematode Globodera spp. Technical Information Bulletin, International Potato Center (CIP), no. 9.
Gheysen G., and Fenoll C., 2002. Gene expression in nematode feeding sites. Annual Review of Phytopathology 40, 191–219.
Greco, N., Di Vito M., Brandonisio A., Giordano I., and de Marinis G., 1982. The effect of Globodera pallida and G. rostochiensis on potato yield. Nematologica 28, 379–386.
Greco N., Inserra R., Brandonisio A., Tirro A., and de Marinis G., 1988. Life-cycle of Globodera rostochiensis on potato in Italy. Nematologia Mediterranea 16, 69–73.
Greco N., and Moreno I. L., 1992. Development of Globodera rostochiensis during three different growing seasons in Chile. Nematropica 22, 175–181.
Greco N., and Di Vito M., 2009. 11 Population Dynamics and Damage. In Perry R., Moens M. and Starr J. L. (eds), Root-knot nematodes. CABI Publishing, Wallingford, UK, 246.
Grenier E., Bossis M., Didier F., Renault L., and Mugniéry D., 2001. Molecular approaches to the taxonomic position of Peruvian potato cyst nematodes and gene pool similarities in indigenous and imported populations of Globodera. Heredity 86, 277–290.
Grujić N., 2010. Intra-specific diversity in noncoding regions of the mitochondrial DNA of Globodera pallida. European Master of Science in Nematology. Faculty of Science, Ghent University, Ghent, Belgium.
194
Halford P. D., Russell M. D., and Evans K., 1999. Use of resistant and susceptible potato cultivars in the trap cropping of potato cyst nematodes, Globodera pallida and G. rostochiensis. Annals of Applied Biology 134, 321–327.
Hancock M., 1996. Trends in PCN distribution in England and Wales. Potato cyst nematode review meeting organised by The Scottish Office Agriculture, Environment and Fisheries Department, SASA, East Craigs.
Haydock P. P. J., 2010. The use and further development of a potato cyst management expert system to educate agronomists, growers and students. Aspects of Applied Biology 3rd Symposium on Potato Cyst Nematodes 103, 83–84.
Haydock P. P. J., Woods S. R., Grove I. G., and Hare M. C., 2013. Chemical control of nematodes. In Perry R. N. and Moens M. (eds), Plant nematology. CABI Publishing, Wallingford, UK, 459–479.
Hillocks R., 2013. Impact of EU Pesticide Reduction Strategy and Implications for Crop Protection in the UK and the Rest of Europe. Outlooks on Pest Management 24, 206–209.
Hockland, S., J. Pickup, and S. Turner. 2000. Potato cyst nematode - a plant health perspective for Great Britain and Northern Ireland. Aspects of Applied Biology, 59, 11-18.
Hockland S., Niere B., Grenier E., Blok V., Phillips M., Den Nijs L., Anthoine G., Jon Pickup, and Viaene N., 2012. An evaluation of the implications of virulence in non-European populations of Globodera pallida and G. rostochiensis for potato cultivation in Europe. Nematology 14, 1–13.
Hominick W. M., 1982. Selection of A Rapidly Maturing Population of Globodera rostochiensis by Continuous Cultivation of Early Potatoes in Ayrshire, Scotland. Annals of Applied Biology 100, 345–351.
Hominick W. M., Forrest J. M. S., and Evans A. A. F., 1985. Diapause in Globodera rostochiensis and variability in hatching trials. Nematologica 31, 159–170.
Hoolahan A. H., Blok V. C., Gibson T., and Dowton M., 2012. A Comparison of Three Molecular Markers for the Identification of Populations of Globodera pallida. Journal of Nematology 44, 7–17.
195
Hooper D. J., 1970. Handling, fixing, staining and mounting nematodes. Technical Bulletin. Ministry of Agriculture, Fisheries and Food, 5th ed., 39–54.
Janssen R., 1990. Genetics of virulence in potato cyst nematodes. PhD. thesis. Wageningen Agricultural University. Wageningen, The Netherlands, 71 pp.
Jimenéz-Pérez N., Crozzoli R., and Greco N., 2009. Life-cycle and emergence of second stage juveniles from cysts of Globodera rostochiensis in Venezuela. Nematologia Mediterranea 37, 155–160.
Jones F. G. W., 1950. Observations on the Beet Eelworm and Other Cyst-Forming Species of Heterodera. Annals of Applied Biology 37, 407–440.
Jones F., and Kempton R., (1978). Population dynamics, population models and integrated control. ADAS, Coded Publications 333-361.
Kaczmarek A., McKenzie K., Kettle H., Blok VC, 2014. The influence of temperature on the plant parasitic nematodes Globodera rostochiensis and G. pallida. Assessing the impact of soil temperature. Phytopathologia Mediterranea, [S.I.], (accepted).
Kakaire S., Grove I. G., and Haydock P. P. J., 2012. Effect of temperature on the life cycle of Heterodera schachtii infecting oilseed rape (Brassica napus L.). Nematology 14, 855–867.
Kerry B., 1997. Biological control of nematodes; prospects and opportunities. In Plant nematode problems and their control in the Near East region. FAO Plant Production and Protection Paper, no. 144. Food and Agriculture Organisation of the United Nations (FAO), Rome, Italy, 79–92.
Kerry B., Barker A, and Evans K. 2002. Investigation of potato cyst nematode control. Commissioned by Defra
Khan Z., and Kim Y. H., 2007. A review on the role of predatory soil nematodes in the biological control of plant parasitic nematodes. Applied Soil Ecology 35, 370–379.
Koenning S.R., and Sipes B.S. 2000. Biology. In Sharma S. B. (ed.), The cyst nematodes. Chapman & Hall, London, UK. 156–190.
Kort J., Ross H., Rumpenhorst H. J., Stone A. R., 1977. An international scheme for identifying and classifying pathotypes of potato cyst nematodes Globodera rostochiensis and G. pallida. Nematologica 23, 333–339.
196
Kühn J., 1881. Die Ergebnisse der Versuche zur Ermittelung der Ursache der Rubenmudigkeit und zur Erforschung der Natur der Nematoden. Berichte aus dem physiologischen Laboratorium und der Versuchsanstalt des Landwirtschaftlichen Instituts der Universität Halle. Schönfeld´s Verlagsbuchhandlung, Dresden, 1–153.
LaMondia J. A. and Brodie B. B., 1986. The effect of potato trap crops and fallow on decline of Globodera rostochiensis. Annals of Applied Biology 108, 347–352.
Madani M., Subbotin S. A., Ward L. J., Li X., and De Boer S. H., 2010. Molecular characterization of Canadian populations of potato cyst nematodes, Globodera rostochiensis and G. pallida using ribosomal nuclear RNA and cytochrome b genes. Canadian Journal of Plant Pathology 32, 252–263.
Mai W. F., 1977. Worldwide Distribution of Potato-Cyst Nematodes and Their Importance in Crop Production. Journal of Nematology 9, 30–34.
McSorley R., and Phillips M., 1993. Modelling population dynamics and yield losses and their use in nematode management. In Evans K., Trudgill D. L. and Webster J. M. (eds). Plant Parasitic Nematodes in Temperate Agriculture. CAB International, Wallingford, UK. 61–85.
Milne I., Wright F., Rowe G., Marshall D. F., Husmeier D., and McGuire G., 2004. TOPALi: software for automatic identification of recombinant sequences within DNA multiple alignments. Bioinformatics 20, 1806–1807.
Minnis S. T., Haydock P. P. J., Ibrahim S. K., Grove I. G., Evans K., and Russell M. D., 2002. Potato cyst nematodes in England and Wales – occurrence and distribution. Annals of Applied Biology 140, 187–195.
Minnis S. T., Haydock P. P. J., and Evans K., 2004. Control of potato cyst nematodes and economic benefits of application of 1, 3-dichloropropene and granular nematicides. Annals of Applied Biology 145, 145–156.
Moxnes J.F., and Hausken K., 2007. The population dynamics of potato cyst nematodes. Ecological Modelling 207, 339–348.
Mugniery D., Phillips M. S., Rumpenhorst H. J., Stone A. R., Treur A. and Trudgill D. L., 1989. Assessment of partial resistance of potato to, and pathotype and virulence differences in, potato cyst nematodes. EPPO Bulletin, 19, 7–25.
197
Mulder A., 1988. Temperature response of Globodera rostochiensis and G. pallida. ESN 19. International Nematology Symposium, Uppsala (Sweden).
Mulvey R. H., and Stone A. R., 1976. Description of Punctodera matadorensis n. gen., n. sp. (Nematoda: Heteroderidae) from Saskatchewan with lists of species and generic diagnoses of Globodera (n. rank), Heterodera, and Sarisodera. Canadian Journal of Zoology 54, 772–785.
Munir, A., M. S. Phillips, D. L. Trudgill, F. Shahina, A. R. Kazmi, and K. Firoza. 2009. Effect of exposure to high temperatures on the hatching and reproduction of Globodera rostochiensis. Pakistan Journal of Nematology 27, 203-211
Nusbaum, C.J. and Ferris, H. 1973. The role of cropping systems in nematode population management. Annual Review of Phytopathology, 11: 423-440
Neilson R., and Boag B., 1996. The predicted impact of possible climatic change on virus-vector nematodes in Great Britain. European Journal of Plant Pathology 102, 193–199.
Nijboer H., and Parlevliet J. E., 1990. Pathotype-specificity in potato cyst nematodes, a reconsideration. Euphytica 49, 39–47.
Oostenbrink M., 1968. Major characteristics of the relation between nematodes and plants. Mededelingen Landbouwhogeschool Wageningen 66, 1–46.
Parker D. E., Legg T. P., and Folland C. K., 1992. A new daily central England temperature series, 1772–1991. International Journal of Climatology 12, 317–342.
Phillips M. S., Forrest J. M. S., and Wilson L. A., 1980. Screening for resistance to potato cyst nematode using closed containers. Annals of Applied Biology 96, 317–322.
Phillips M. S., Hackett C. A., and Trudgill D. L., 1991. The relationship between the initial and final population densities of the potato cyst nematode Globodera pallida for partially resistant potatoes. Journal of Applied Ecology 28, 109–119.
Phillips M. S., Harrower B. E., Trudgill D. L., Catley M. A., and Waugh R., 1992. Genetic variation in British populations of Globodera pallida as revealed by isozyme and DNA analyses. Nematologica, 38, 304–319.
198
Phillips M. S., Trudgill D. L., Hackett C. A., Hancock M., Holliday J. M., and Spaull A. M., 1998. A basis for predictive modelling of the relationship of potato yields to population density of the potato cyst nematode, Globodera pallida. The Journal of Agricultural Science 130, 45–51.
Phillips M. S., and Trudgill D. L., 1998. Variation of virulence, in terms of quantitative reproduction of Globodera pallida populations, from Europe and South America, in relation to resistance from Solanum vernei and S. tuberosum ssp. andigena CPC2802. Nematologica 44, 409–423.
Picard D., Plantard O., Scurrah M., Mugniéry D., 2004. Inbreeding and population structure of the potato cyst nematode (Globodera pallida) in its native area (Peru). Molecular Ecology 13, 2899–2908.
Picard D., and Plantard O., 2006. What constitutes a population for the plant parasitic nematode Globodera pallida in its native area (Peru)? International Journal for Parasitology 36, 115–122.
Picard D., Sempere T., and Plantard O., 2007. A northward colonisation of the Andes by the potato cyst nematode during geological times suggests multiple host-shifts from wild to cultivated potatoes. Molecular Phylogenetics and Evolution 42, 308–316.
Pickup, J. Potato cyst nematodes - a technical overview for Scotland. 2002
Plantard O., Picard D., Valette S., Scurrah M., Grenier E., and Mugniéry D., 2008. Origin and genetic diversity of Western European populations of the potato cyst nematode (Globodera pallida) inferred from mitochondrial sequences and microsatellite loci. Molecular Ecology 17, 2208–2218.
Powers T., 2004. Nematode molecular diagnostics: from bands to barcodes. Annual Review of Phytopathology 42, 367–383.
Pylypenko L. A., Uehara T., Phillips M. S., Sigareva D. D., and Blok V. C., 2005. Identification of Globodera rostochiensis and G. pallida in the Ukraine by PCR. European Journal of Plant Pathology 111, 39–46.
Pylypenko L. A., Phillips M. S., and Blok V. C., 2008. Characterisation of two Ukrainian populations of Globodera pallida in terms of their virulence and mtDNA, and the biological assessment of a new resistant cultivar Vales Everest. Nematology 10, 585–590.
Rambaut A., 2009. FigTree. Institute of Evolutionary Biology, University of Edinburgh, United Kingdom. http://tree.bio.ed.ac.uk/software/figtree/.
Rawsthorne D., and Brodie B. B., 1986. Relationship Between Root Growth of Potato, Root Diffusate Production, and Hatching of Globodera rostochiensis. Journal of Nematology 18, 379-384.
Reid A., Kenyon D. M., Evans F. F., Mulholland V., Pickup J.,. Blok V. C., Paterson A., and Phillips M. S., 2010. Development of a high-throughput method for the detection and species determination of PCN. Aspects of Applied Biology 103, 13–16.
Renco M. 2007. Comparison of the life cycle of potato cyst nematode (Globodera rostochiensis) pathotype Ro1 on selected potato cultivars. Biologia 62, 195–200.
Robinson M. P., Atkinson H. J., and Perry R N., 1987. The influence of temperature on the hatching activity and lipid utilization of second stage juveniles of the potato cyst nematodes Globodera rostochiensis and G. pallida. Revue de Nematologie 10, 349–354.
Science and Advice for Scottish Agriculture (SASA), 2013. Control of potato cyst nematodes official programme for sampled units recorded as infested. Guidance for growers and landowners. http://www.sasa.gov.uk.
Schans J., and Arntzen F. K., 1991. Photosynthesis, Transpiration and plant growth characters of different potato cultivars at various densities of Globodera pallida. Netherlands Journal of Plant Pathology 97, 297–310.
Schmidt K., Sikora R. A., and Richter O., 1993. Modeling the population dynamics of the sugar beet cyst nematode Heterodera schachtii. Crop Protection 12, 490–496.
Schnick D., Rumpenhorst H. J., and Burgermeister W., 1990. Differentiation of closely related Globodera pallida (Stone) populations by means of DNA restriction fragment length polymorphisms (RFLPs). Journal of Phytopathology 130, 127–136.
Scholte K., 2000. Screening of non-tuber bearing Solanaceae for resistance to and induction of juvenile hatch of potato cyst nematodes and their potential for trap cropping. Annals of Applied Biology 136, 239–246.
Seinhorst J. W., 1965. The relation between nematode density and damage to plants. Nematologica 11, 137–154.
Seinhorst J. W., 1967. The relationships between population increase and population density in plant parasitic nematodes. Nematologica 13, 157–171.
200
Seinhorst J., 1980. The relation between population density of Globodera rostochiensis at planting time and tuber yield of potatoes. European Society of Nematologists: Abstracts of the 15th International Nematology Symposium of the European Society of Nematologists, Bari, Italy, 24–30 August, 1980, 70.
Seinhorst J. W., 1982. The Relationship in field experiments between population density of Globodera rostochiensis before planting potatoes and yield of potato tubers. Nematologica 28, 277–284.
Skarbilovich T. S., 1959. On the structure of systematics of the nematode order Tylenchida Thorne. Acta Parasitica Polonica 7, 117–132.
Spence K. O., Lewis E. E., and Perry R. N., 2008. Host finding and invasion by entomopathogenic and plant-parasitic nematodes: Evaluating the ability of laboratory bioassays to predict field results. Journal of Nematology 40, 93–98.
Stanton J. M., and Sartori M., 1990. Hatching and reproduction of the potato cyst nematode, Globodera rostochiensis, from potato fields in Western Australia as influenced by soil temperature. Nematologica 36, 457–464.
Stone A. R., 1972. Heterodera pallida n. sp. (Nematoda: Heteroderidae), a second species of potato cyst nematode. Nematologica 18, 591–606.
Stone A. R., Holliday, J. M., Mathias, P. C. and Parrott, D. M., 1986. A selective survey of potato cyst nematode pathotypes in Great Britain. Plant Pathology 35, 18-24.
Strajnar P., Sirca S., Knapic M., and Urek G., 2011. Effect of Slovenian climatic conditions on the development and survival of the root-knot nematode Meloidogyne ethiopica. European Journal of Plant Pathology 129, 81–88.
Sturz, A. V., and Kimpinski J., 1999. Effects of fosthiazate and aldicarb on populations of plant-growth-promoting bacteria, root lesion nematodes and bacteria-feeding nematodes in the root zone of potatoes. Plant Pathology 48, 26–32.
Subbotin S. A., Halford P. D., Warry A., and Perry R. N., 2000. Variations in ribosomal DNA sequences and phylogeny of Globodera parasitising solanaceous plants. Nematology 2, 591–604.
Tiilikkala K., 1987. Life cycle of the potato cyst nematode in Finland. Annales Agriculturae Fenniae 26, 171–179.
201
Timmermans B. H. G., 2005. Solanum sisymbriifolium (Lam.): a trap crop for potato cyst nematodes.: PhD Thesis, Wageningen University, 135
Tobin J. D., Haydock P. P. J., Hare M. C., Woods S. R., and Crump D. H., 2008. Effect of the fungus Pochonia chlamydosporia and fosthiazate on the multiplication rate of potato cyst nematodes (Globodera pallida and G. rostochiensis) in potato crops grown under UK field conditions. Biological Control 46, 194–201.
Trenberth K. E., Jones P. D., Ambenje P. G., Bojariu R., Easterling D. R., Klein Tank A., Parker D. E., Rafimzadeh F., Renwick J. A., Rusticucci M., Soden B., and Zhai P., 2007. Observations: surface and atmospheric climate change. In Solomon, S., Qin D., Manning M., Chen Z., Marquis M., Averyt K. B., Tignor M., and Miller H. L. (eds), Climate Change 2007: The Physical Science Basis. Contribution of Working Group I to the Fourth Assessment Report of the Intergovernmental Panel on Climate Change. Cambridge University Press, Cambridge, UK, 235–336.
Trudgill D. L., 1967. The effect of environment on sex determination in Heterodera rostochiensis. Nematologica 13, 263-272
Trudgill D. L., and Cotes L. M., 1983. Tolerance of potato to potato cyst nematodes (Globodera rostochiensis and Globodera pallida) in relation to the growth and efficiency of the root system. Annals of Applied Biology 102, 385–397.
Trudgill D. L., 1986. Yield Losses Caused by Potato Cyst Nematodes – A Review of the Current Position in Britain and Prospects for Improvements. Annals of Applied Biology 108, 181–198.
Trudgill D. L. 1991. Resistance to and tolerance of plant parasitic nematodes in plants. Annual Review of Phytopathology 29, 167–192.
Trudgill D. L., Kerry B. R., and Phillips M. S., 1992. Seminar: Integrated control of nematodes (with particular reference to cyst and root knot nematodes). Nematologica, 38, 482–487.
Trudgill D. L., and Phillips M. S., 1997. Nematode population dynamics, threshold levels and estimation of crop losses. FAO Plant Production and Protection Paper (FAO).
Trudgill D. L., Elliott M. J., Evans K., and Phillips M. S., 2003. The white potato cyst nematode (Globodera pallida) – a critical analysis of the threat in Britain. Annals of Applied Biology 143, 73–80.
Trudgill D. L., Honek A., and Van Straalen N. M., 2005. Thermal time – concepts and utility. Annals of Applied Biology 146, 1–14.
202
Trudgill D. L., Phillips M. S., and Elliott M. J., 2014. Dynamics and management of the white potato cyst nematode Globodera pallida in commercial potato crops. Annals of Applied Biology 164, 18–34.
Turner S. J., 1990. The identification and fitness of virulent potato cyst-nematode populations (Globodera pallida) selected on resistant Solanum vernei hybrids for up to eleven generations. Annals of Applied Biology 117, 385–397.
Turner S. J., and Evans K., 1998. The origins, global distribution and biology of potato cyst nematodes (Globodera rostochiensis (Woll.) and Globodera pallida (Stone). In Marks R. J., and Brodie B. B., eds, Potato Cyst Nematodes. Biology, Distribution and Control. CAB International, Wallingford, UK, 7–26.
Turner S. J., and Fleming C. C., 2002. Multiple selection of potato cyst nematode Globodera pallida virulence on a range of potato species. I. Serial selection on Solanum-hybrids. European Journal of Plant Pathology 108, 461–467.
Turner S. J., Fleming C. C., Moreland B. P., and Martin T. J. G., 2009. Variation in hatch among pathotypes of the potato cyst nematodes, Globodera rostochiensis and Globodera pallida, in response to potato root diffusate from Solanum spp. Preliminary assessments to establish optimal testing conditions. Nematology 11, 749–756.
Van der Waals J. E., Krüger K., Franke A. C., Haverkort A. J., and Steyn J. M., 2013. Climate change and potato production in contrasting South African agro-ecosystems 3. Effects on relative development rates of selected pathogens and pests. Potato Research 56, 67–84.
Viglierchio D. R., and Schmitt R. V., 1983. On the methodology of nematode extraction from field samples: Baermann funnel modifications. Journal of Nematology 15, 438–444.
Whitehead A. G., and Turner S. J., 1998. Management and regulatory control strategies for potato cyst nematodes (Globodera rostochiensis and Globodera pallida). In Marks R. J. and Brodie B. B. (eds), Potato cyst nematodes: Biology, distribution and control. CAB International, Wallingford, UK, 135-152.
Williams G. K., Kubelik, A. R., Livak, K. J., Rafalski, J. A., and Tingey, S. V., 1990. DNA polymorphisms amplified by arbitrary primers are useful genetic markers. Nucleic Acids Research 18, 6531–6535.
Wollenweber, H. W., 1923. Krankheiten und Beschädigungen der Kartoffel: P. Parley, Berlin, Germany.
203
Woods S. R., Haydock P. P. J., and Edmunds C., 1999. Mode of action of fosthiazate used for the control of the potato cyst nematode Globodera pallida. Annals of Applied Biology 135, 409–415.
204
APPENDICES 8.
Appendix 1
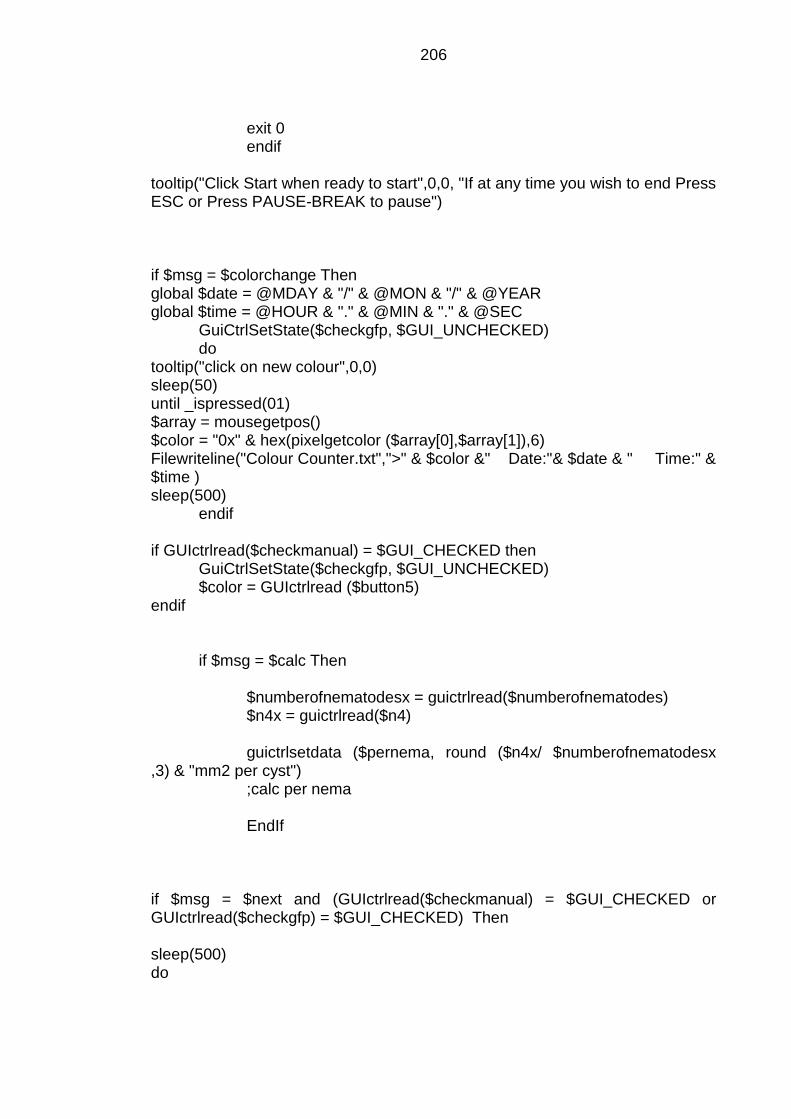
#cs ---------------------------------------------------------------------------- AutoIt Version: 3.3.6.1 Author: Sebastian Eves-van den Akker Script Function: Measure Cyst size #ce ---------------------------------------------------------------------------- Global $Paused Global $test HotKeySet("{PAUSE}", "TogglePause") HotKeySet("{ESC}", "Terminate") HotKeySet("{PGUP}", "Stoploop") Func TogglePause() $Paused = NOT $Paused While $Paused sleep(100) ToolTip('Script is "Paused"',0,0) WEnd ToolTip("") EndFunc $count = 0 #Include <Misc.au3> #include <Array.au3> #include <File.au3> #include <GUIConstantsEx.au3> #include <SliderConstants.au3> #Include <GUIConstantsEx.au3> #Include <WindowsConstants.au3> #Include <WinAPI.au3> #include <ScreenCapture.au3> ;============================================================================================================ _DwmEnable(False) ;=====================Creates the Graphical User Interface of the Program================================= GUICreate("Colour Counter", 240,320,@DesktopWidth -245,0)
exit 0 endif tooltip("Click Start when ready to start",0,0, "If at any time you wish to end Press ESC or Press PAUSE-BREAK to pause") if $msg = $colorchange Then global $date = @MDAY & "/" & @MON & "/" & @YEAR global $time = @HOUR & "." & @MIN & "." & @SEC GuiCtrlSetState($checkgfp, $GUI_UNCHECKED) do tooltip("click on new colour",0,0) sleep(50) until _ispressed(01) $array = mousegetpos() $color = "0x" & hex(pixelgetcolor ($array[0],$array[1]),6) Filewriteline("Colour Counter.txt",">" & $color &" Date:"& $date & " Time:" & $time ) sleep(500) endif if GUIctrlread($checkmanual) = $GUI_CHECKED then GuiCtrlSetState($checkgfp, $GUI_UNCHECKED) $color = GUIctrlread ($button5) endif if $msg = $calc Then $numberofnematodesx = guictrlread($numberofnematodes) $n4x = guictrlread($n4) guictrlsetdata ($pernema, round ($n4x/ $numberofnematodesx ,3) & "mm2 per cyst") ;calc per nema EndIf if $msg = $next and (GUIctrlread($checkmanual) = $GUI_CHECKED or GUIctrlread($checkgfp) = $GUI_CHECKED) Then sleep(500) do
207
do tooltip("click top left",0,0) sleep(50) until _ispressed(01) $array = mousegetpos() sleep(500) do tooltip("click bottom right",0,0) sleep(50) until _ispressed(01) $array1 = mousegetpos() $y = $array[1] $x = $array[0] $xb = $array1[0] $yb = $array1[1] $shades = GUIctrlread($slider1) $xta = $x $yta = $y $xba = $xb $yba = $yb $time = timerinit () tooltip("working, wait",0,0) if GUIctrlread($checkgfp) = $GUI_CHECKED then $color = 0xFEFEFE ;white ish bit endif $color2 = 0x000000 $hDC = _WinAPI_GetWindowDC(0) do Do $x = $x + 1 $pix = pixelsearch($x,$y,$x+1,$y+1,$color,$shades) if @error then $count = $count + 1 if GUIctrlread($check) = $GUI_CHECKED then _WinAPI_DrawLine($hDC,$x,$y,$x+1,$y) endif