1 ASSESSING BURN HISTORY, FIRE SEVERITY, AND MAPPING FUELS MITIGATION TREATMENTS IN THE WILDLAND URBAN INTERFACE OF NORTH CENTRAL FLORIDA By MATTHEW WILLIAM GRAHAM A THESIS PRESENTED TO THE GRADUATE SCHOOL OF THE UNIVERSITY OF FLORIDA IN PARTIAL FULFILLMENT OF THE REQUIREMENTS FOR THE DEGREE OF MASTER OF SCIENCE UNIVERSITY OF FLORIDA 2010
Transcript
1
ASSESSING BURN HISTORY, FIRE SEVERITY, AND MAPPING FUELS MITIGATION TREATMENTS IN THE WILDLAND URBAN INTERFACE OF NORTH CENTRAL
FLORIDA
By
MATTHEW WILLIAM GRAHAM
A THESIS PRESENTED TO THE GRADUATE SCHOOL OF THE UNIVERSITY OF FLORIDA IN PARTIAL FULFILLMENT
OF THE REQUIREMENTS FOR THE DEGREE OF MASTER OF SCIENCE
2 RETROACTIVELY MAPPING WORK AREA: A GIS CASE STUDY OF WILDLAND URBAN INTERFACE FUELS MITIGATION PROJECTS IN NORTH CENTRAL FLORIDA............................................................................................... 36
Table page 1-1 A Kolmogorov-Smirnoff test for the 2004 Impassable Bay Fire NBR
histogram and the 2007 Bugaboo Fire NBR Histogram. ..................................... 26
1-2 A Kruskal-Wallis test for 2004 Impassable Bay Fire and 2007 Bugaboo Fire severity classes. ................................................................................................. 27
1-3 A change matrix of how hectares changed severity classes between the 2004 Impassable Bay Fire and the 2007 Bugaboo Fire. ..................................... 28
1-4 Normalized Burn Ratio (NBR) thresholds for severity classes’ developed using Composite Burn Index (CBI) protocol ....................................................... 28
2-1 State level fuels treatments from Master Database, January 2004 to December 2007. ................................................................................................. 49
7
LIST OF FIGURES
Figure page 1-1 The location of the Impassable Bay Fire and the Bugaboo Fire in north
central Florida. .................................................................................................... 29
1-2 The 2004 and 2007 NBR values for the overlapping area set within their respective perimeters ......................................................................................... 30
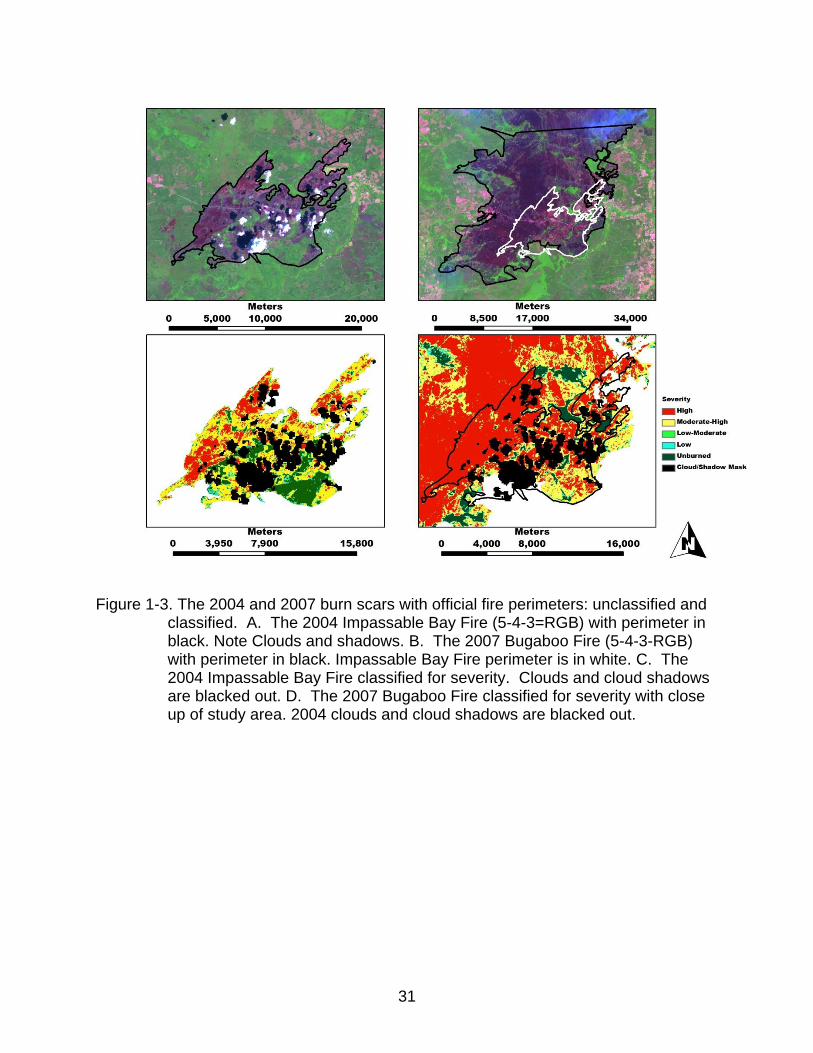
1-3 The 2004 and 2007 burn scars with official fire perimeters: unclassified and classified ............................................................................................................. 31
1-4 The Palmer Drought Severity Index for January 2001-December 2007. ............ 32
1-5 The 2004 Impassable Bay Fire severity classification derived from the Normalized Burn Ration (NBR) ........................................................................... 32
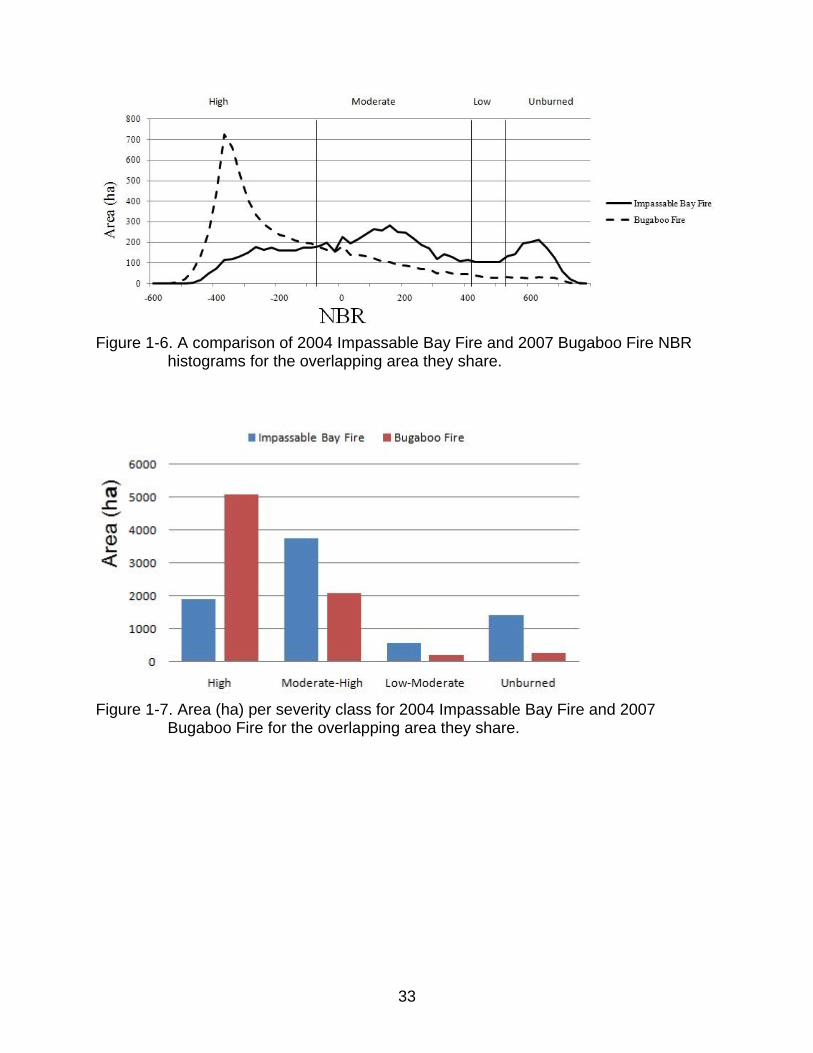
1-6 A comparison of 2004 Impassable Bay Fire and 2007 Bugaboo Fire NBR histograms for the overlapping area ................................................................... 33
1-7 Area (ha) per severity class for 2004 Impassable Bay Fire and 2007 Bugaboo Fire for the overlapping area. .............................................................. 33
1-8 A map of the severity change trajectory between 2004 Impassable Bay Fire and 2007 Bugaboo Fire.. .................................................................................... 34
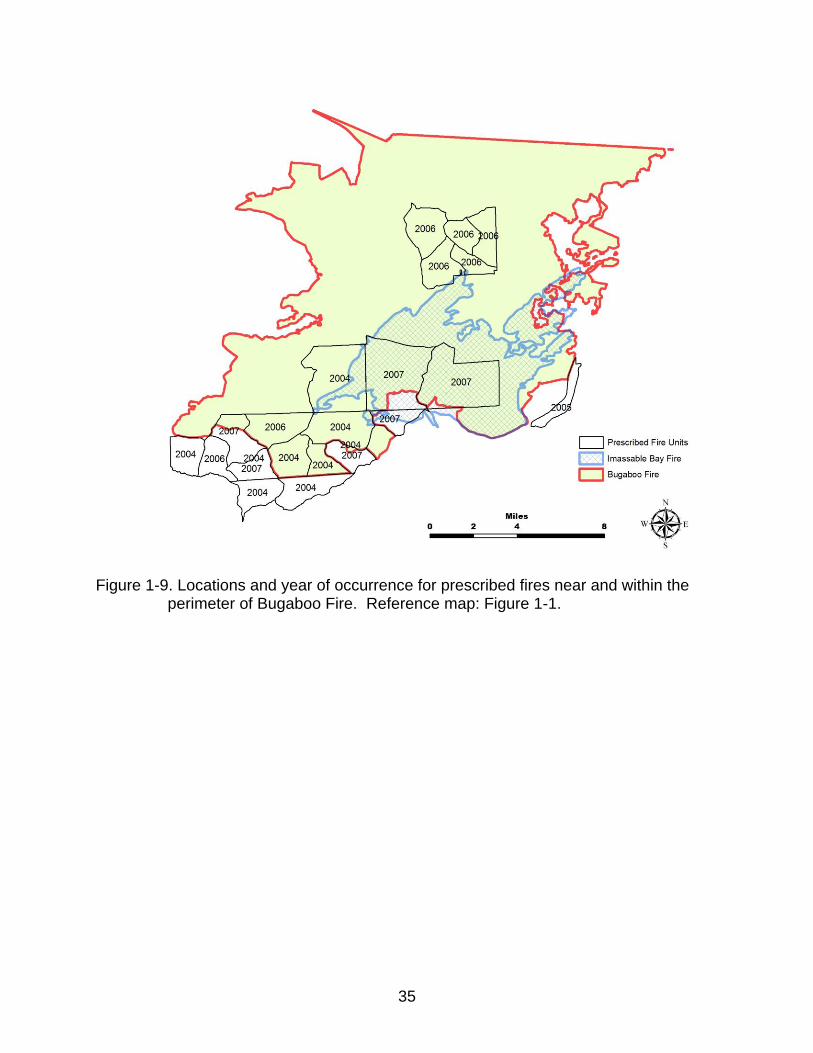
1-9 Locations and year of occurrence for prescribed fires near and within the perimeter of Bugaboo Fire. ................................................................................. 35
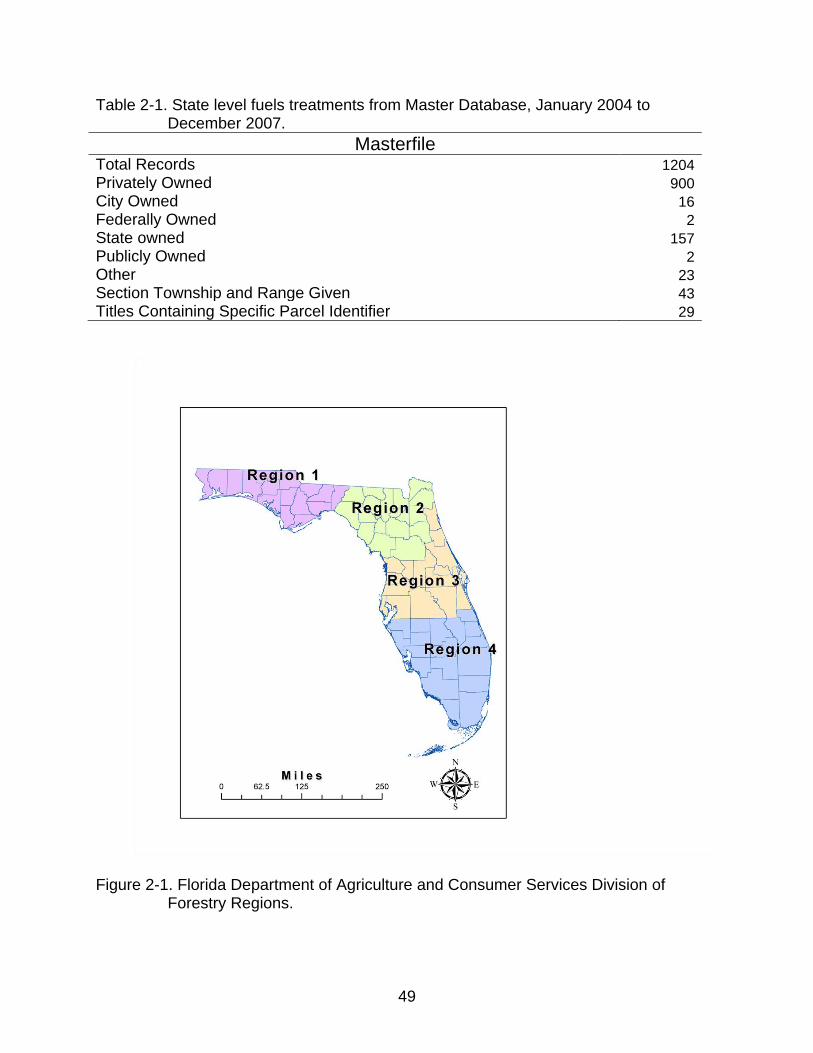
2-1 Florida Department of Agriculture and Consumer Services Division of Forestry Regions. ............................................................................................... 49
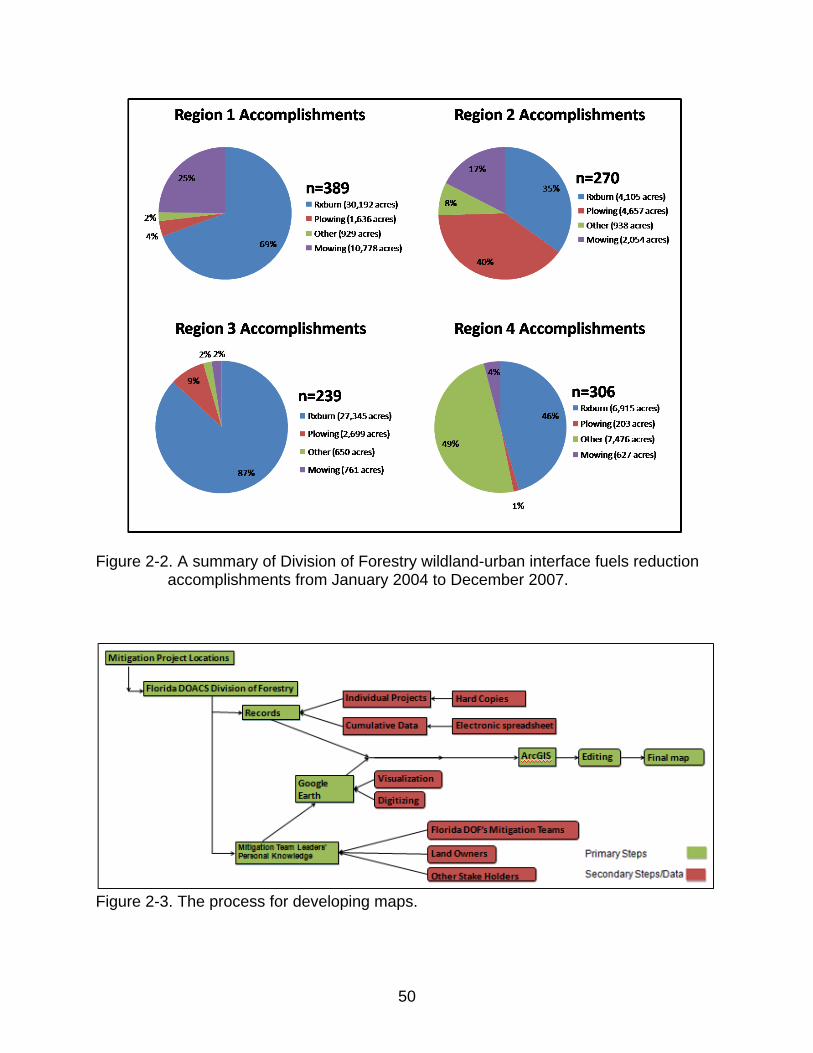
2-2 A summary of DOF wildland-urban interface fuels reduction accomplishments from January 2004 to December 2007. .................................. 50
2-3 The process for developing maps. ...................................................................... 50
2-4 A distribution of existing records and located project sites respective to Florida DACS Division of Forestry Regions ........................................................ 51
2-5 Total projects completed in FDACS DOF Region 2 during 2004- 2007. ............. 51
2-6 Taylor Community’s firebreaks and Bugabbo Fire .............................................. 52
2-7 The Lamplighter Estates Mitigation Project. ....................................................... 53
FDACS Florida Department of Agriculture and Consumer Services
FDOF Division of Forestry (Florida)
GIS Geographic Information System
GPS Global Positioning System
GRS1980 Geodetic Reference System 1980
MRLC Multi-Resolution Land Characteristics Consortium
MTBS Monitoring Trends in Burn Severity
NAD 1980 North American Datum
NBR Normalized Burn Ratio
NED National Elevation Dataset
NIR Near-Infrared
NLAPS National Landsat Archive Production System
NWCG National Wildfire Coordinating Group
ONF Osceola National Forest
USGS United States Geological Survey
WUI Wildland-Urban Interface
11
Abstract of Thesis Presented to the Graduate School of the University of Florida in Partial Fulfillment of the Requirements for the Degree of Master of Science
ASSESSING BURN HISTORY AND FIRE SEVERITY, AND MAPPING FUELS
MITIGATION TREATMENTS IN THE WILDLAND URBAN INTERFACE OF NORTH CENTRAL FLORIDA
By
Matthew William Graham
December 2010
Chair: Michael Binford Major: Geography
The pyrogenic forest ecosystems of north central Florida were historically
maintained by frequent low severity fires. Portions of two wildfires burned the same
area in 2004 and 2007 in Osceola National Forest and these were tested to see if the
second fire experienced lower severity as a result of the earlier fire. This was done
using remotely sensed images enhanced with the Normalized Burn Ratio, classified,
and compared. The second fire was more severe than the first showing no contribution
from the 2004 fire in reducing the 2007 fire. Drought conditions contributed to the
severity of the 2007 fire, but cannot be concluded to be the only driver of severity as fuel
loads, stand ages, and management are not accounted for. During this same time
period, the Florida Division of Forestry Region Two Wildfire Mitigation Team conducted
fuels reduction treatments on private property throughout north central Florida. Spatial
record keeping was analyzed and it was determined that 46 of the 272 projects in the 18
county region had location specific data. Prototype maps were developed to improve
the understanding of where and what type of work was performed and format them in
ways that could be useful to decision makers in wildfire suppression situations. Working
12
directly with mitigation personnel, 22 additional project locations were identified. During
the 2007 season, four wildfires impacted mitigation projects and fire fighters did attribute
the ease of containment to fuels reduction. Factors that contributed to lack of spatial
data are addressed and suggestions for improving the institutional structure of data
management in the future are given.
13
CHAPTER 1 WILDFIRE BURN SEVERITY: DOES BURN HISTORY DETERMINE SUBSEQUENT
WILDFIRE BURN SEVERITY IN NORTH FLORIDA
Introduction
There is a belief in fire management that maintaining the historical fire regime is
critical in reducing the occurrence and severity of large wildfires where the historical fire
frequency was high and severity low. Despite the interest of land mangers and others
in the fire science community, little research has been done to identify the effects burn
history has on wildfire severity. The absence of these studies results from the limited
number of study sites where wildfires overlap with well documented older fires or
Further study of the additional smaller prescribed fires conducted by USFS prior to
the Bugaboo Fire would be worthwhile. These included burn units during 2004, 2005,
2006 and 2007 that fall along the southern terminus of the containment line for the
Bugaboo fire (Fig. 1-10). It is apparent that these burn units fall on both sides of the
burn scar and could have made containment in this area possible do to fuel reduction
which was the intention and result of those prescribed fires.
The belief that maintaining the historical fire regime through fuels reduction will
reduce fire severity is incomplete. Indeed the periodic fuels removal of the historic fire
regime is only one of several factors that affect wildfire burn severity. Climate (or
weather) in between fires is a major one and the outcome of severity in a wildfire is
often dependant on multiple factors that are unable to be mitigated.
26
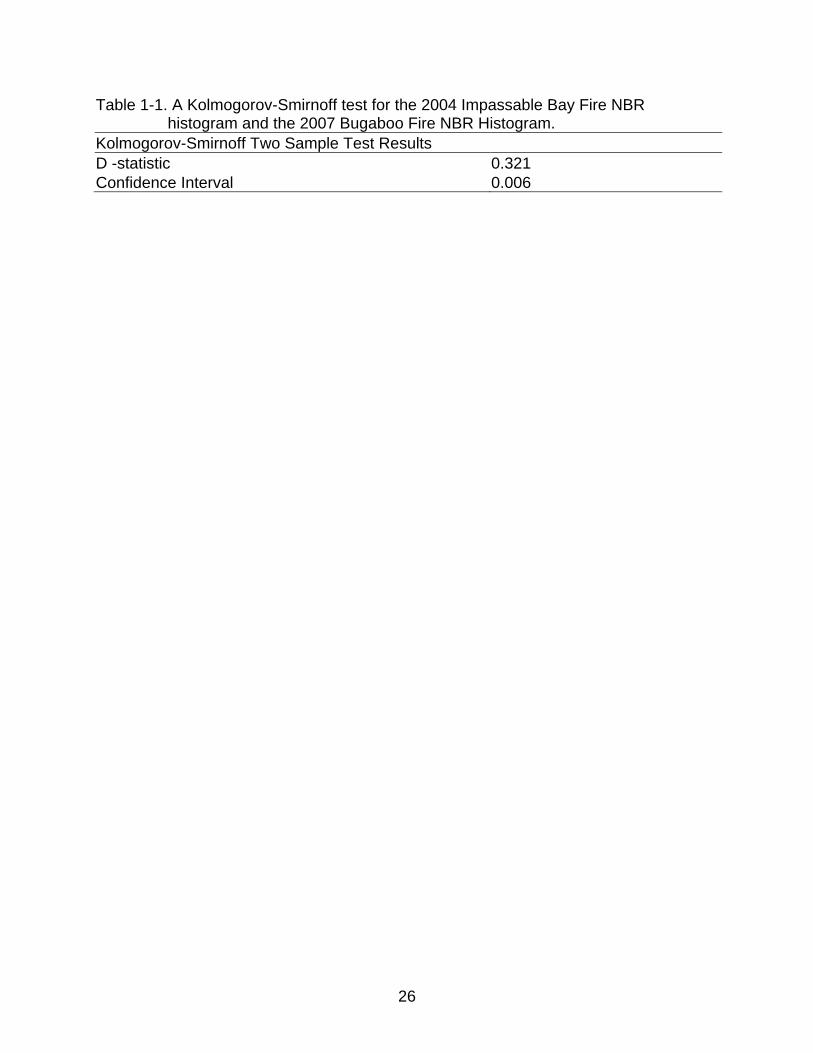
Table 1-1. A Kolmogorov-Smirnoff test for the 2004 Impassable Bay Fire NBR histogram and the 2007 Bugaboo Fire NBR Histogram.
Kolmogorov-Smirnoff Two Sample Test Results
D -statistic 0.321
Confidence Interval 0.006
27
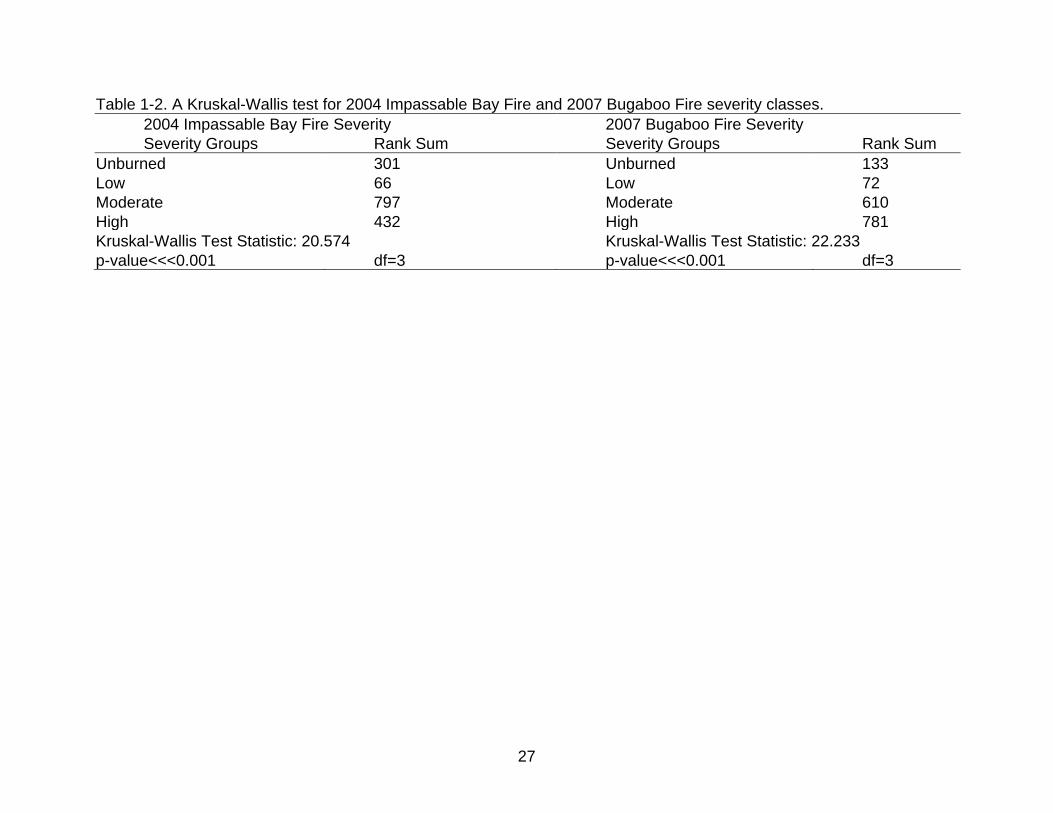
Table 1-2. A Kruskal-Wallis test for 2004 Impassable Bay Fire and 2007 Bugaboo Fire severity classes.
2004 Impassable Bay Fire Severity 2007 Bugaboo Fire Severity
Severity Groups Rank Sum Severity Groups Rank Sum
Unburned 301 Unburned 133
Low 66 Low 72
Moderate 797 Moderate 610
High 432 High 781
Kruskal-Wallis Test Statistic: 20.574 Kruskal-Wallis Test Statistic: 22.233
p-value<<<0.001 df=3 p-value<<<0.001 df=3
28
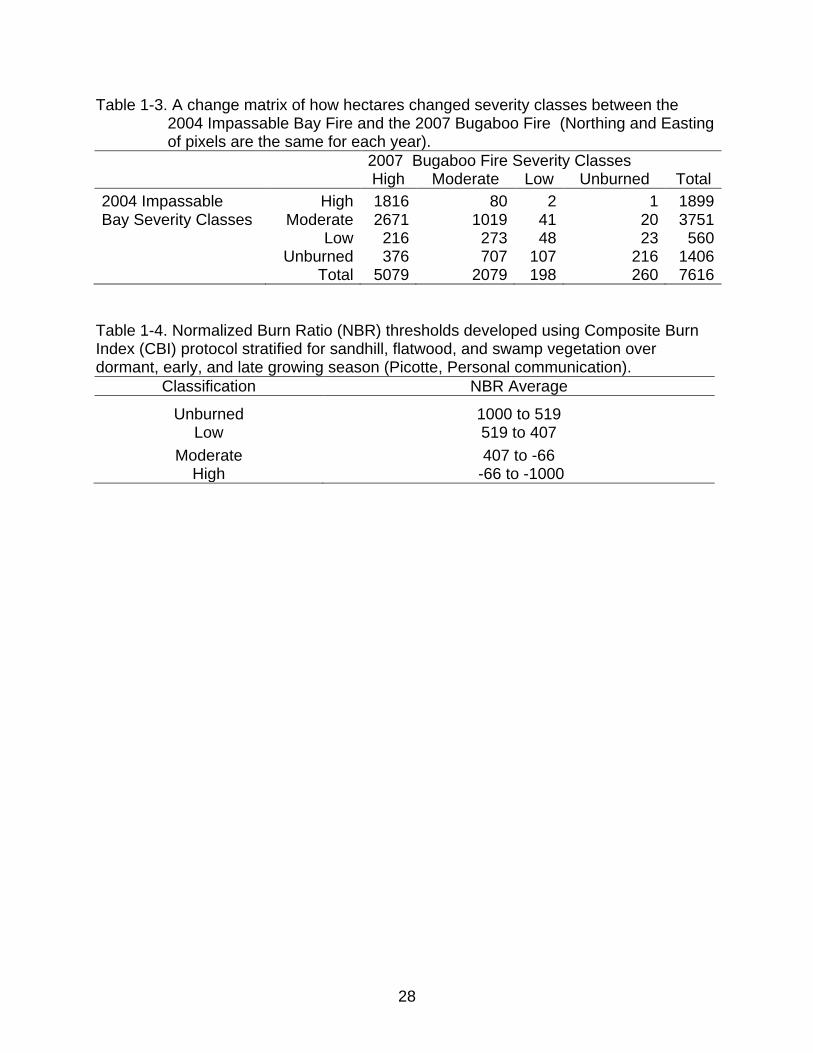
Table 1-3. A change matrix of how hectares changed severity classes between the 2004 Impassable Bay Fire and the 2007 Bugaboo Fire (Northing and Easting of pixels are the same for each year).
2007 Bugaboo Fire Severity Classes High Moderate Low Unburned Total
2004 Impassable High 1816 80 2 1 1899 Bay Severity Classes Moderate 2671 1019 41 20 3751
Low 216 273 48 23 560
Unburned 376 707 107 216 1406
Total 5079 2079 198 260 7616
Table 1-4. Normalized Burn Ratio (NBR) thresholds developed using Composite Burn Index (CBI) protocol stratified for sandhill, flatwood, and swamp vegetation over dormant, early, and late growing season (Picotte, Personal communication).
Classification NBR Average
Unburned 1000 to 519 Low 519 to 407
Moderate 407 to -66 High -66 to -1000
29
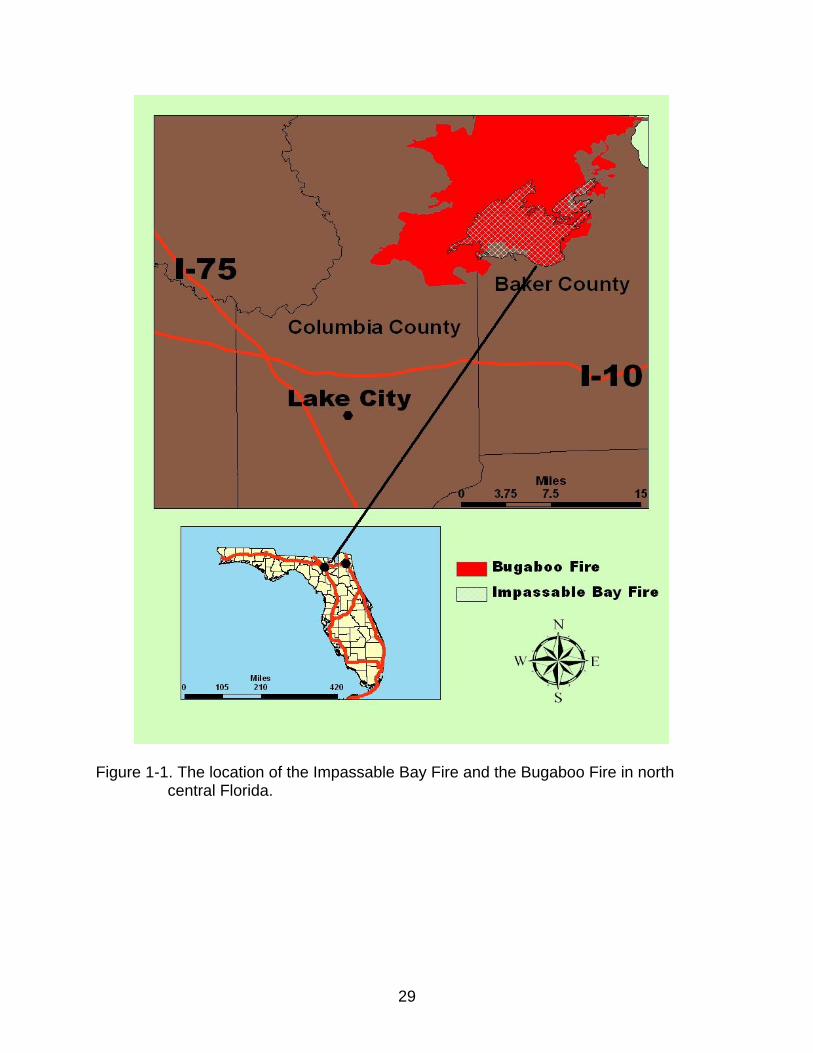
Figure 1-1. The location of the Impassable Bay Fire and the Bugaboo Fire in north central Florida.
30
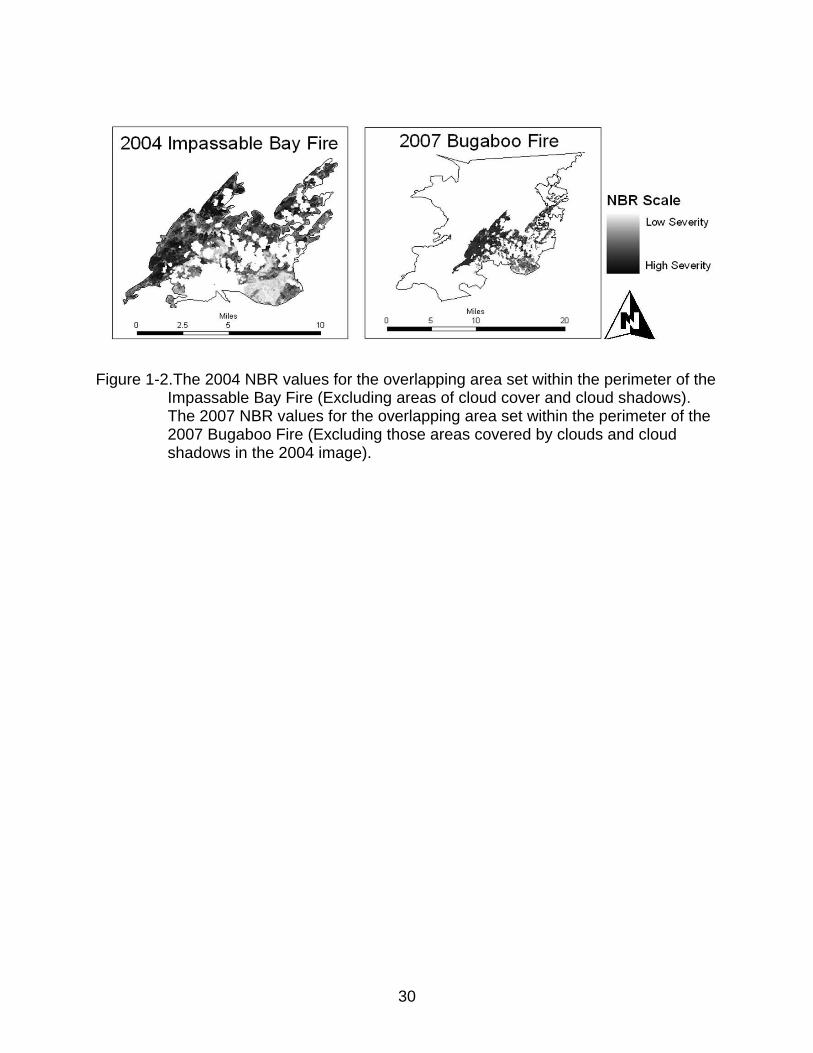
Figure 1-2.The 2004 NBR values for the overlapping area set within the perimeter of the
Impassable Bay Fire (Excluding areas of cloud cover and cloud shadows). The 2007 NBR values for the overlapping area set within the perimeter of the 2007 Bugaboo Fire (Excluding those areas covered by clouds and cloud shadows in the 2004 image).
31
Figure 1-3. The 2004 and 2007 burn scars with official fire perimeters: unclassified and classified. A. The 2004 Impassable Bay Fire (5-4-3=RGB) with perimeter in black. Note Clouds and shadows. B. The 2007 Bugaboo Fire (5-4-3-RGB) with perimeter in black. Impassable Bay Fire perimeter is in white. C. The 2004 Impassable Bay Fire classified for severity. Clouds and cloud shadows are blacked out. D. The 2007 Bugaboo Fire classified for severity with close up of study area. 2004 clouds and cloud shadows are blacked out.
32
Figure. 1-4.The Palmer Drought Severity Index for January 2001-December 2007.
0=normal, -2=moderate drought, -3=severe drought, and -4=extreme drought. Positive numbers correspond, e.g. +2= moderate rainfall, etc.
Figure 1-5. The 2004 Impassable Bay Fire severity classification derived from the
Normalized Burn Ration (NBR) for the overlapping area shared with the Bugaboo Fire. The 2007 Bugaboo Fire severity classification for the overlapping area shared with the impassable Bay Fire.
33
Figure 1-6. A comparison of 2004 Impassable Bay Fire and 2007 Bugaboo Fire NBR
histograms for the overlapping area they share.
Figure 1-7. Area (ha) per severity class for 2004 Impassable Bay Fire and 2007
Bugaboo Fire for the overlapping area they share.
34
Figure 1-8. A map of the severity change trajectory between 2004 Impassable Bay Fire and 2007 Bugaboo Fire. Change is specific to location.
35
Figure 1-9. Locations and year of occurrence for prescribed fires near and within the
perimeter of Bugaboo Fire. Reference map: Figure 1-1.
36
CHAPTER 2 RETROACTIVELY MAPPING WORK AREA: A GIS CASE STUDY OF WILDLAND
URBAN INTERFACE FUELS MITIGATION PROJECTS IN NORTH CENTRAL FLORIDA
Introduction
Fire exclusion along the wildland-urban interface (WUI) and years of fire
suppression have resulted in unnaturally high fuel loads that have caused an increase
in wildfire size, adverse behavior, total number of wildfires, and cost of suppression
(Conard, 2001). Substantial resources are spent on fuel treatments and little is known
concerning their effectiveness (Martinson, 2003).
Federal, state, and local agencies have responsibility for protecting homes in the
wildland-urban interface during prescribed fire and wildfire events (Cohen, 1999). Fuel
mitigation is performed with an understanding that the outcome will influence the size
and severity of wildland fires and/or enable increased suppression response (Finney,
2001) and increased home defensibility. Fuels mitigation options for the most part
involve surface fuels reduction by mechanical means or prescribed fire. Prescribed fire
reintroduces ecological processes and mechanical manipulating of forest structure
broadens the toolset for achieving hazard mitigation (Johnson, 2007).
The research question that this paper addresses is: What is the state of spatial
record keeping of fire mitigation in north Florida, and what can be done to make if more
useful for fire control efforts? Ten years of data exist on Florida’s mitigation efforts but
spatial records are practically non-existent. Knowledge about the location of fuels
reductions may help in suppression situations and increases the value of performing
mitigation. The information must be available and in a format accessible to fire fighters.
Knowledge of project locations, parcel boundaries, and the time of and extent of prior
37
fuels reduction enables decision makers to make informed choices on where and how
resources are deployed. There is a need to evaluate fuels management options to
effectively address local, regional, and national priorities. Remote sensing and
Geographical Information Systems are spatial tools that managers can use in their effort
to mitigate fire hazards and reduce risks to public well-being (Conard, 2001).
Fire exclusions effects on ecosystem function and fuel reduction are two separate
issues. (Cohen, 1999). To reach desired outcomes in fuel reduction and ecological
improvement, land managers and fire planners need a variety of techniques to apply
including stand thinning, surface fuel roller chopping/mastication, chemical treatment,
and grazing (Fernandes, 2003; Johnson, 2007; Kalabokidis, 1998). The effectiveness
of fuels reduction treatments may be improved when they are conducted with ecological
restoration in mind (Martinson, 2003). Prescribed fire is only one of a handful of fuels
mitigation options that results in ecological restoration (Miller, 2003). The use of
prescribed fire is limited to days where management of smoke, control, and severity are
judged to be safe.
Prescribed fire may reduce wildfire severity and provide various benefits for
wildfire control operations. These include decreasing the quantity and type of fire
fighting resources that would otherwise be needed, influencing the overall suppression
strategy, reduction in the risk of back-burn operations used in indirect attack, decreasing
the amount of mopping-up, and providing better access and anchor points for
In 2004, DOF prescribe burned 30 acres of heavily wooded lot to the SE, East and
along a strip to the North of the Brandy Branch Baptist Church in Nassau County. The
$420 dollar burn was estimated to protect fifty-four structures valued at 3.4 million. A
wildfire on March 19, 2008 on the north side of the property threatened the Church and
a close residence. The mitigated acreage had not been maintained by the landowner,
but still had reduced fuel loads relative to the surrounding landscape. The fire crept
across the old fire line into the churchyard, but the responding FDOF crew was able to
re-plow existing breaks and relatively easily contain the fire which was exhibiting
manageable behavior in the light fuel bed. All structures within proximity to the fire were
able to be protected (Winter, Unpublished results b).
Discussion/Recommendations
Each regional mitigation team is independent of the others. They are funded with
different budgets and both crew sizes and available resources vary. The composition of
the WUI in Florida is dependent on the history and scale of local development and
46
varies significantly within and between each region. Thus treatment costs vary between
regions. Additionally the transfer of geospatial technology to local and regional offices
has been slow. Most district offices are not equipped with technology, training or
personnel to effectively collect spatial data or produce usable products.
One step towards improving the collection of spatial data for fuels reduction
projects should be the use of GPS units by each mitigation crew to record geographic
coordinates. Personnel need to be trained in the proper operation of GPS units.
Additionally, personnel capable of performing GIS analysis need to be retained at either
the district, regional, or state level. FDOF needs computers sufficiently powerful for
operating GIS software. Potentially, a single employee could create GIS maps for the
entire state. Maps took an average of three hours to create. With three hundred
mitigation projects state wide per year on average, this represents 900 man hours.
Standard methods of data collection in the field and streamlined channels for
transmitting the data in detail to a state level analyst would need to be instituted. Once
maps are created, the centralized information could be available to anyone planning or
implementing projects, or instantaneously on the fireline via Wi-Fi or mobile phone
internet access.
Hard copies of project paperwork contain the only indication of project locations.
The decentralized storage of these documents is a major obstacle in their use for
locating project sites. Each district should centralize hardcopies of service reports and
landowner agreements in the office of that district’s mitigation specialist and Regional
Team leaders should retain the paperwork. Districts without mitigation specialists would
send their hardcopies to the office of the Regional Team leader.
47
Although personnel responsible for project completions since 2004 are
knowledgeable and available, specifics and details are not easily recalled. Workin
directly with personnel produced an additional 8% of projects that could be mapped.
Not only were these projects that otherwise would not have been located, but in most
cases, when a parcel was located by the team leader, additional details on the extent of
fuels reduction were immediately recalled.
The 2004 USGS color infrared digital orthophotos were not available as base
layers for a small portion of the state. The 2004 imagery used for base layers does not
necessarily reflect the landcover as it existed at the time the mitigation project was
implemented or since. In some instances, these details could mislead map users.
The task of developing a spatial database encompassing projects from previous
fiscal years has difficulties, which may not make it worthwhile. To collect such spatial
data after the fact when a lack of equipment and GIS trained personnel still exists is to
add a burden to a system already dealing with many responsibilities. If efforts are costly
and no wildfires immediately occur, then treatments become ineffective within a few
years. Treatments are a type of calculated gamble. Florida will always be a fire prone
landscape and homes along the WUI will periodically be exposed to danger. Resources
could be better utilized by improving the capacity for DOF crews to meet in-house goals
on collecting spatial data for the near and ongoing future.
To facilitate wildfire suppression operations, locations and maps of treatments
need to be developed and available. If the case that fuel reductions are effective as an
aid to suppression operations is significant, then it is significant to have information
concerning them available to decision makers dealing with wildfire occurrence. There
48
exists a disconnect between the work performed for fuel reductions out of fire season
and the work performed to suppress numerous fires during wildfire periods. This
disconnect exists in spite of DOF personnel often being involved with both operations
and is due chiefly to the way data are managed, processed and disseminated internally
within the organization.
Fuel manipulations coupled with measures to improve structural resistance to
ignition are the best defense. It is necessary to work from the home outwards.
Accomplishing goals establishing connectivity between preventative fire management
options and the accessibility of relevant information to suppression operations is a
fundamental step in optimizing FDOF’s existing resources. An approach to
management that establishes a communications link throughout the hierarchy within
witch work is performed is necessary. Integrating links between field work, data
management, and decision making in the field, results in the generation of relevant data
sets (including spatial) available to enhance the decision making capacity of higher ups.
With strategy in place for performing work, developing maps, and then disseminating
maps in real time to responsible agencies during wildfire situations, additional benefit is
derived from pre-suppression fire operations.
49
Table 2-1. State level fuels treatments from Master Database, January 2004 to December 2007.
Masterfile Total Records 1204
Privately Owned 900
City Owned 16
Federally Owned 2
State owned 157
Publicly Owned 2
Other 23
Section Township and Range Given 43
Titles Containing Specific Parcel Identifier 29
Figure 2-1. Florida Department of Agriculture and Consumer Services Division of Forestry Regions.
50
Figure 2-2. A summary of Division of Forestry wildland-urban interface fuels reduction accomplishments from January 2004 to December 2007.
Figure 2-3. The process for developing maps.
51
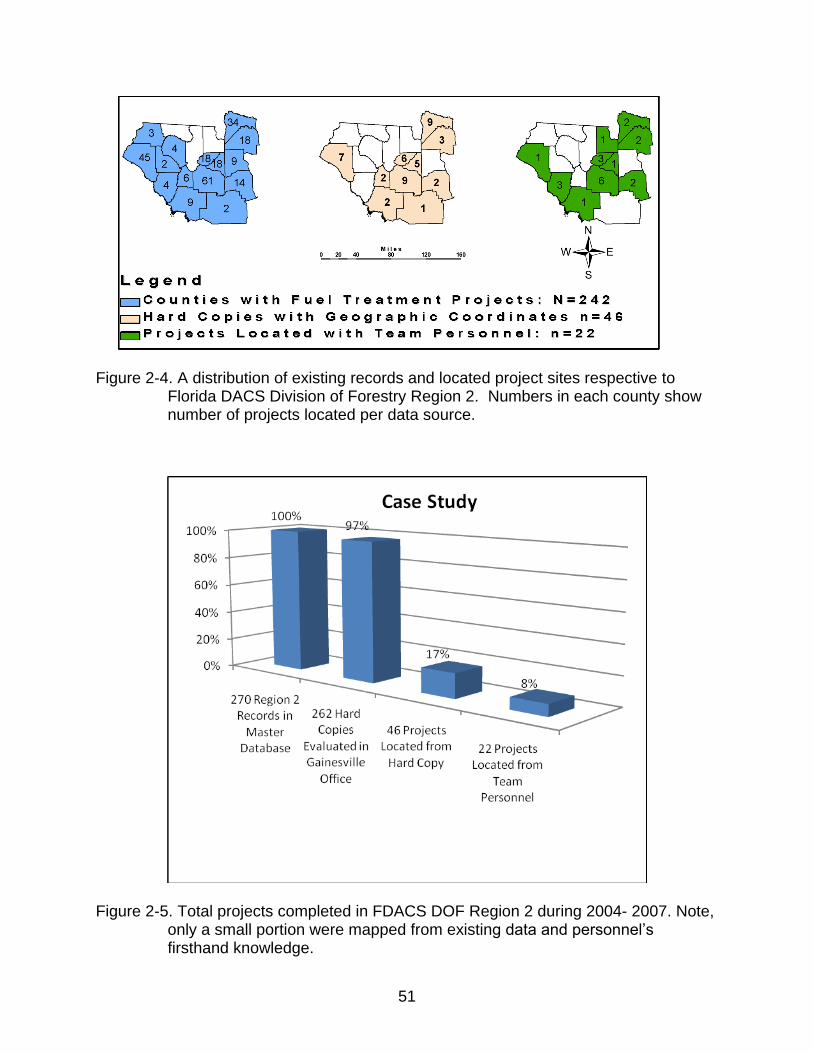
Figure 2-4. A distribution of existing records and located project sites respective to Florida DACS Division of Forestry Region 2. Numbers in each county show number of projects located per data source.
Figure 2-5. Total projects completed in FDACS DOF Region 2 during 2004- 2007. Note,
only a small portion were mapped from existing data and personnel’s firsthand knowledge.
52
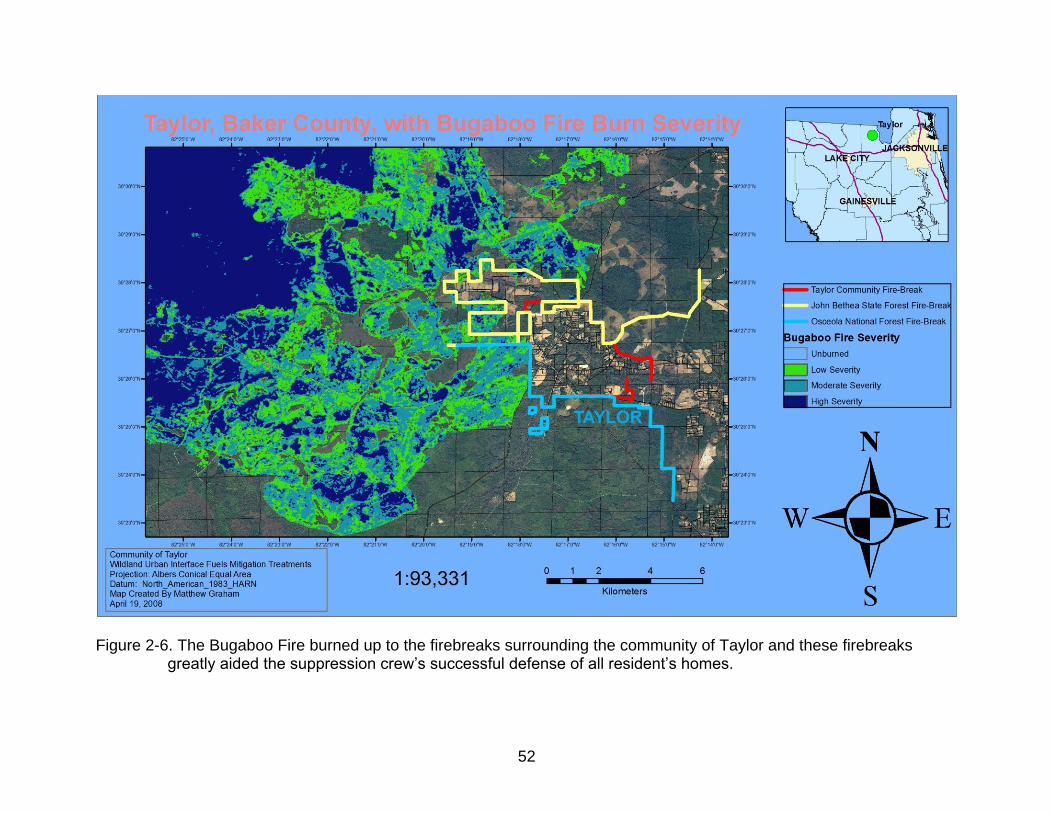
Figure 2-6. The Bugaboo Fire burned up to the firebreaks surrounding the community of Taylor and these firebreaks greatly aided the suppression crew’s successful defense of all resident’s homes.
53
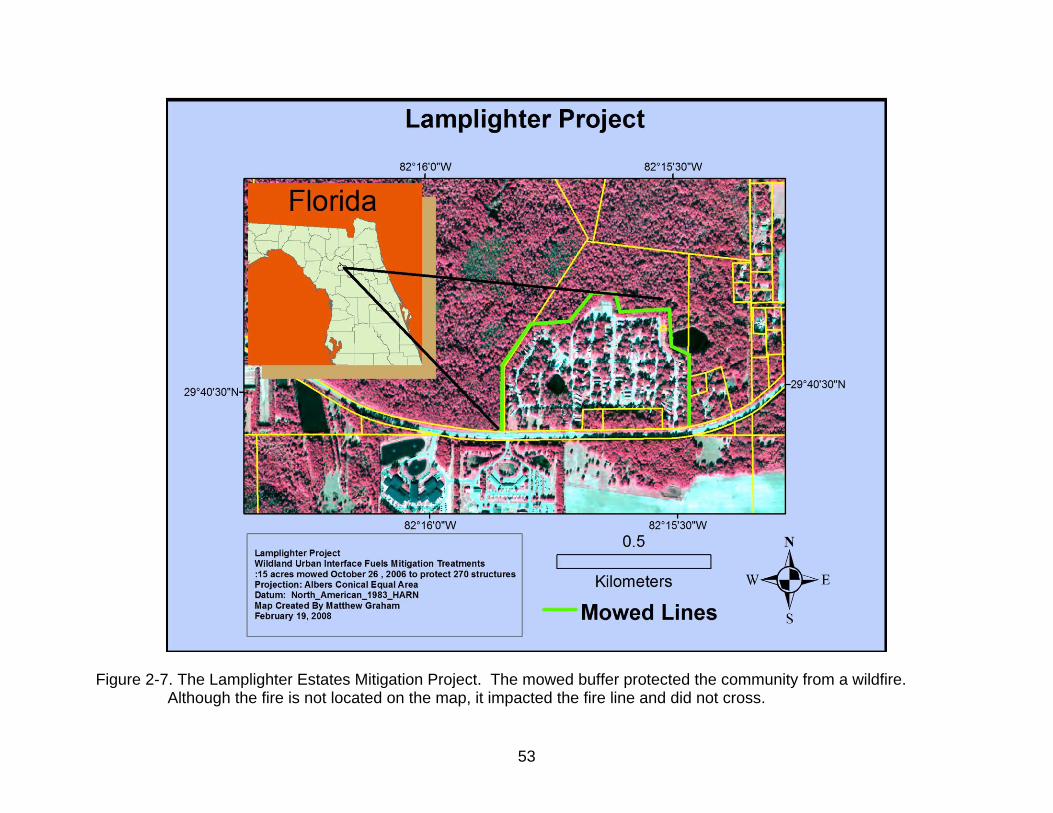
Figure 2-7. The Lamplighter Estates Mitigation Project. The mowed buffer protected the community from a wildfire. Although the fire is not located on the map, it impacted the fire line and did not cross.
54
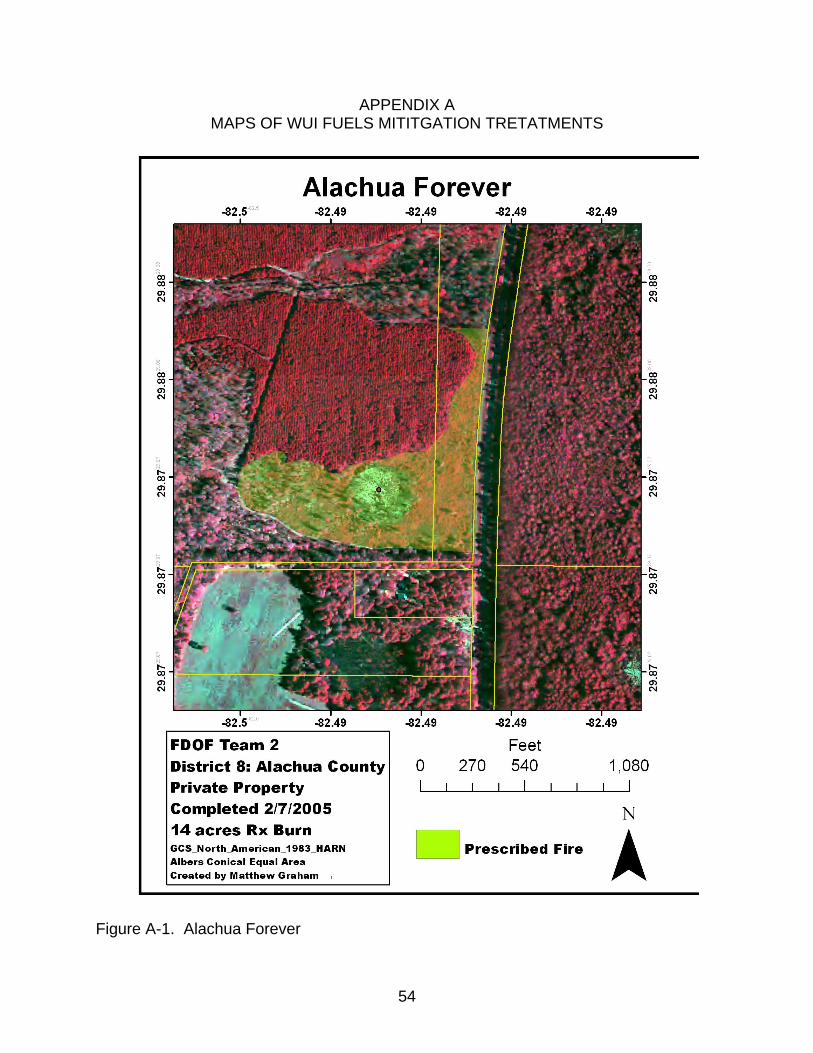
APPENDIX A MAPS OF WUI FUELS MITITGATION TRETATMENTS
Figure A-1. Alachua Forever
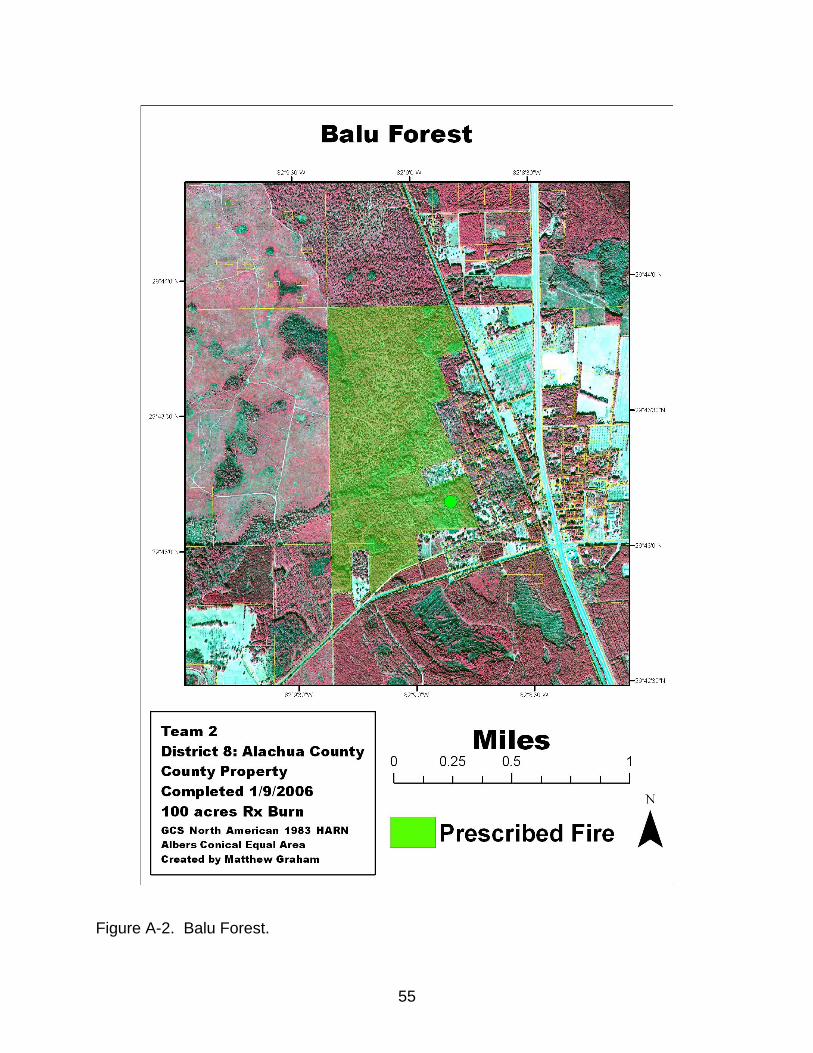
55
Figure A-2. Balu Forest.
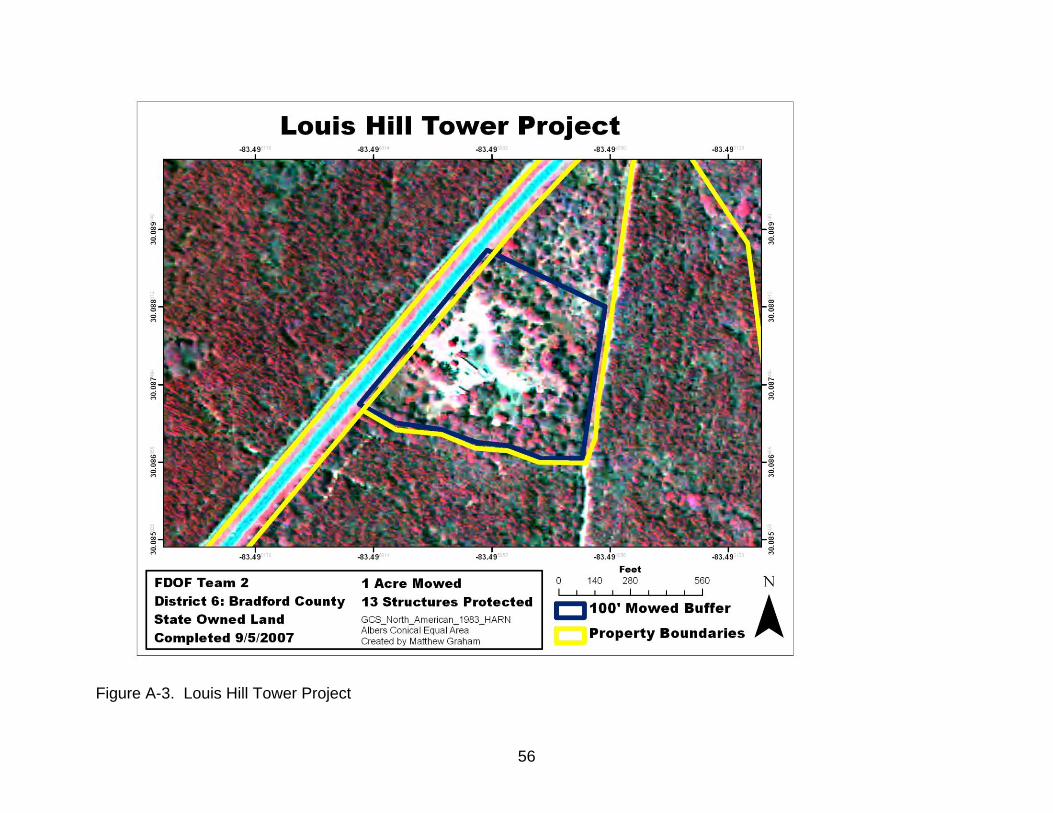
56
Figure A-3. Louis Hill Tower Project
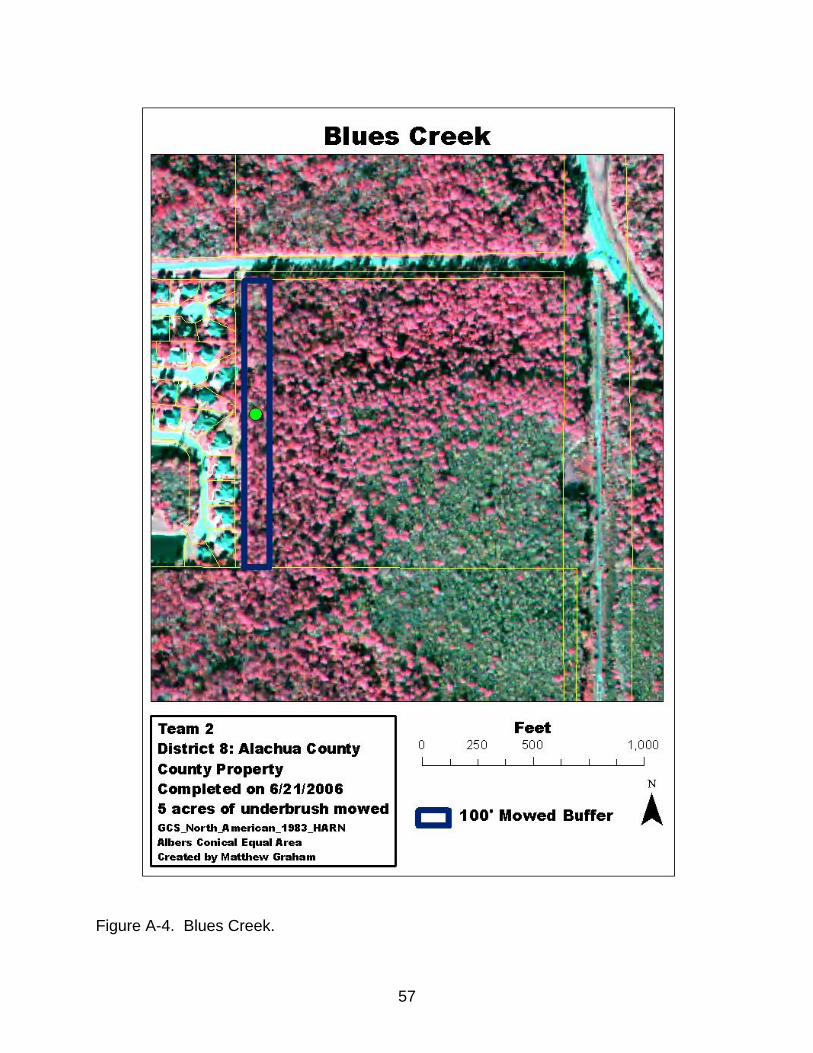
57
Figure A-4. Blues Creek.
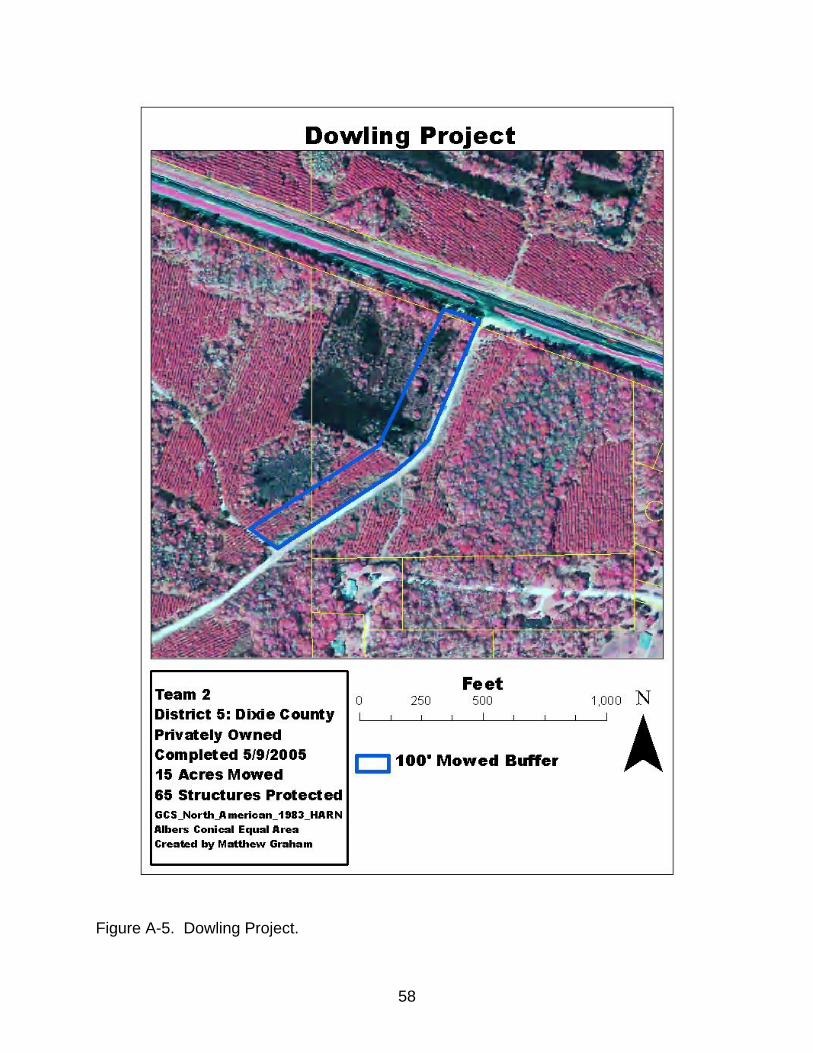
58
Figure A-5. Dowling Project.
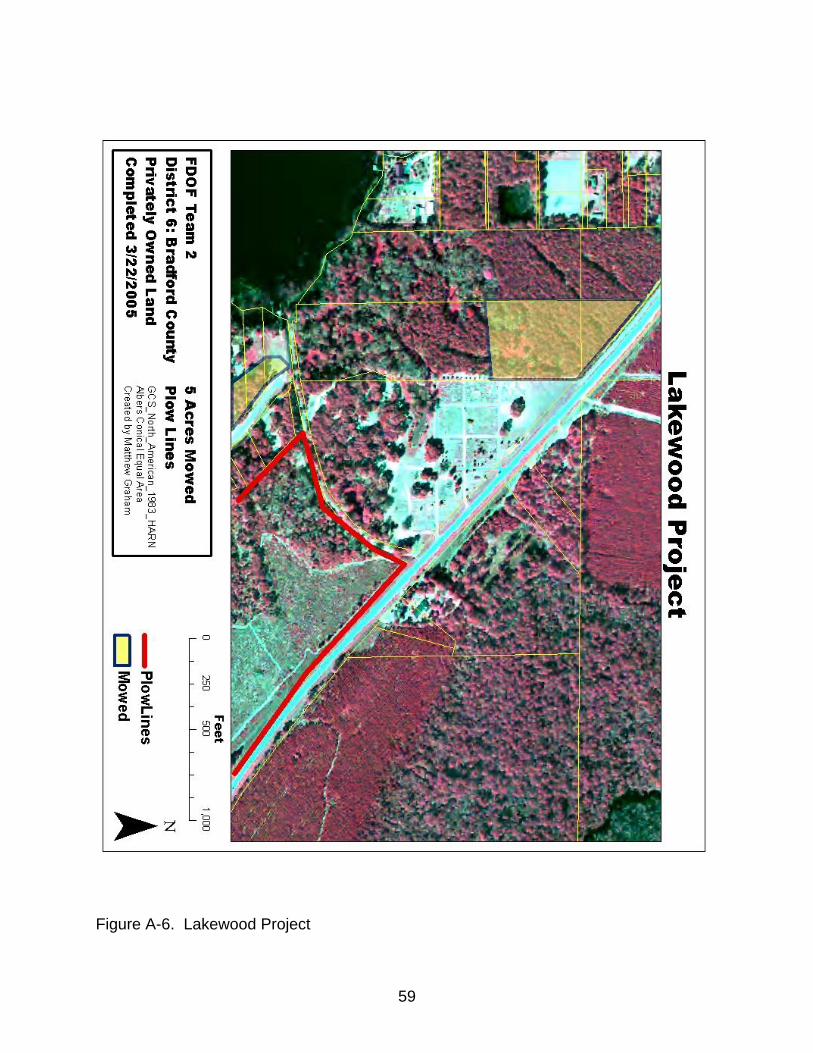
59
Figure A-6. Lakewood Project
60
Figure A-7. Manning Cemetery Project
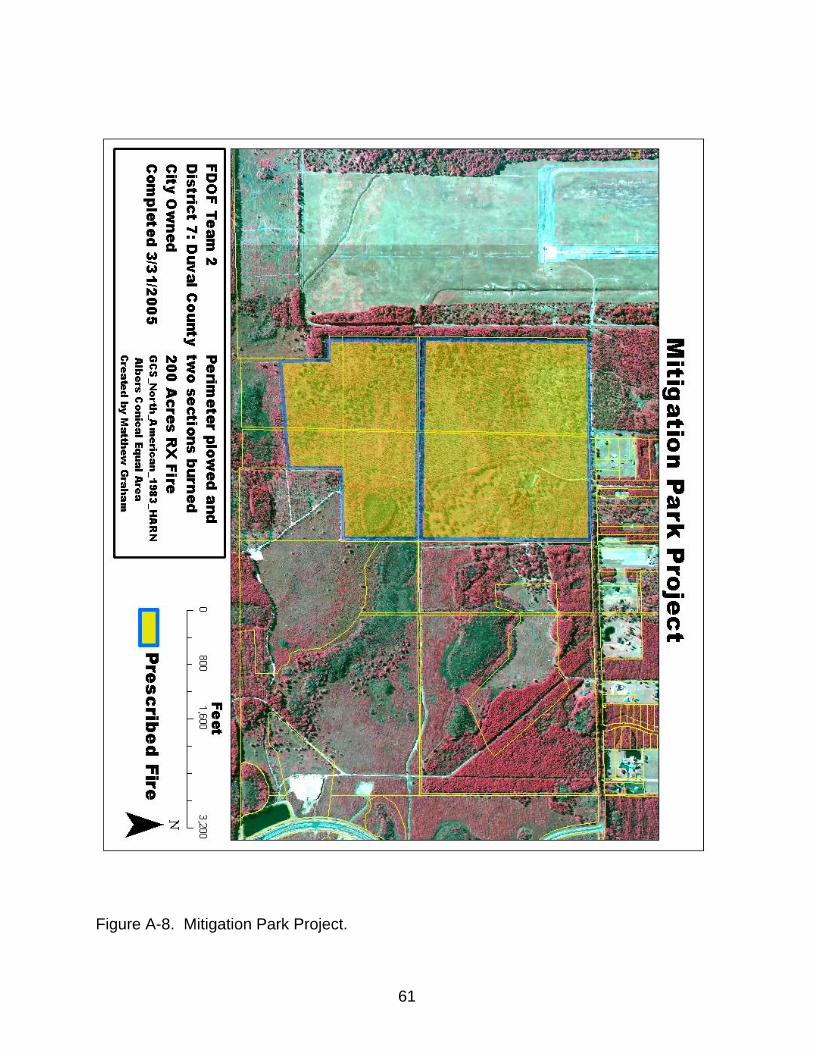
61
Figure A-8. Mitigation Park Project.
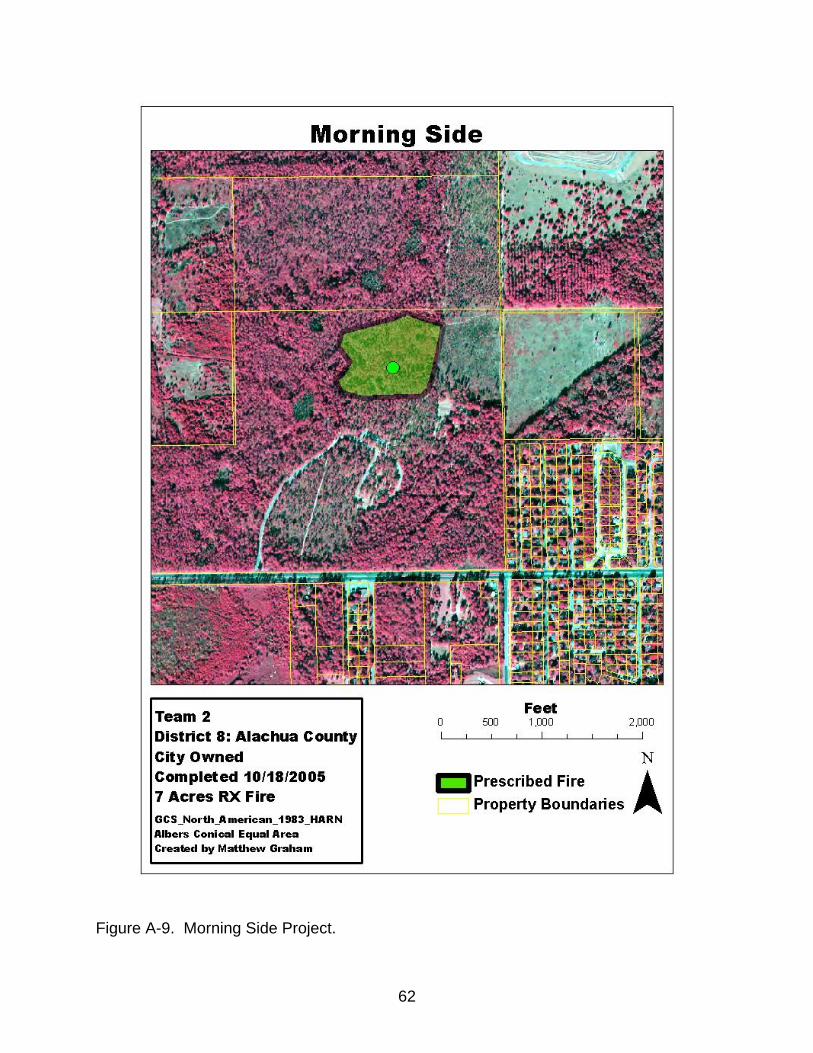
62
Figure A-9. Morning Side Project.
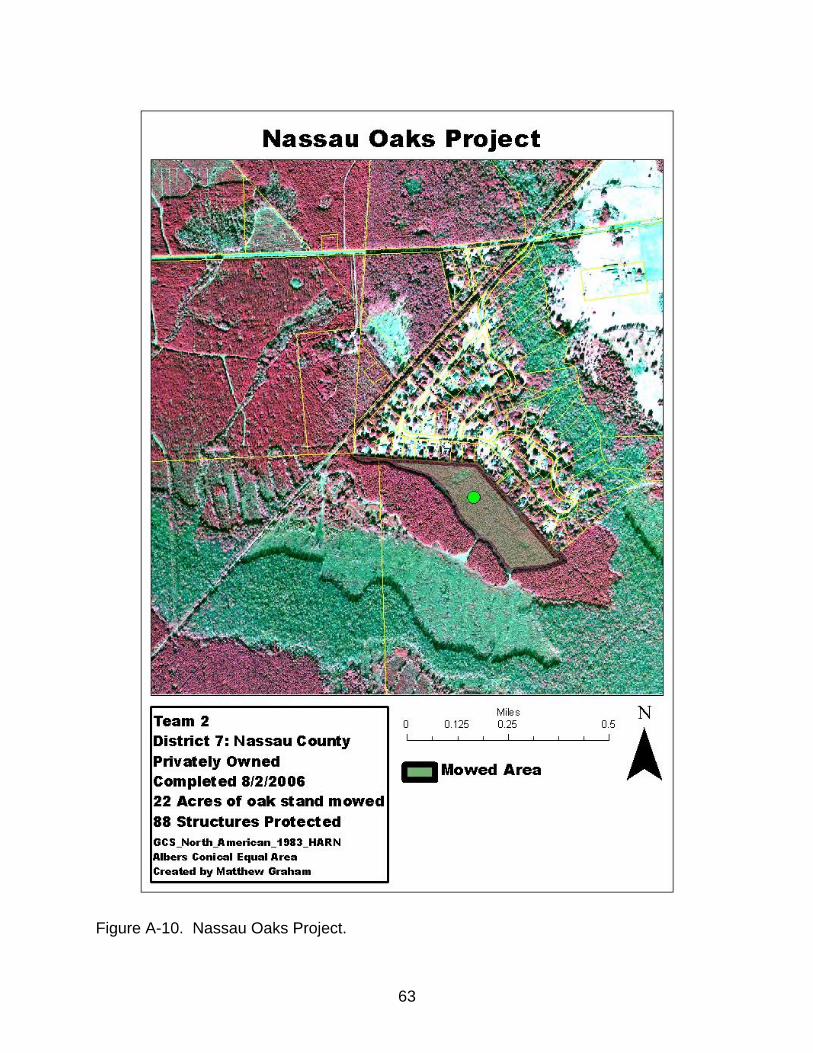
63
Figure A-10. Nassau Oaks Project.
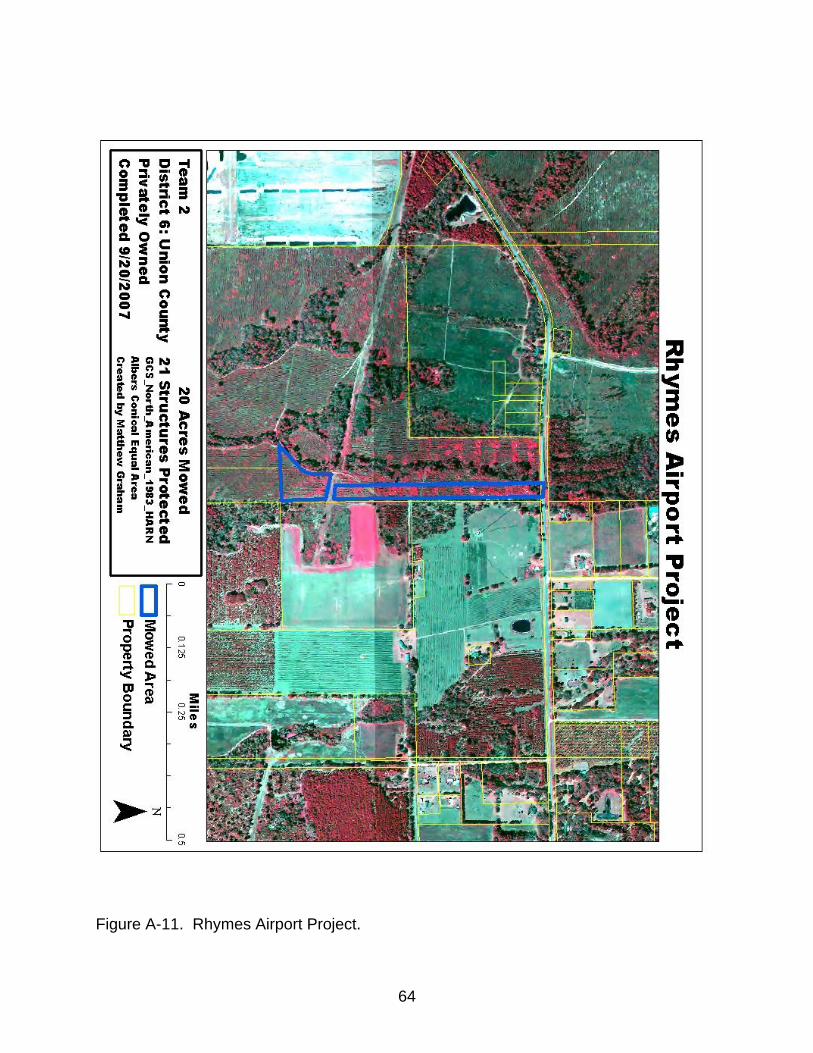
64
Figure A-11. Rhymes Airport Project.
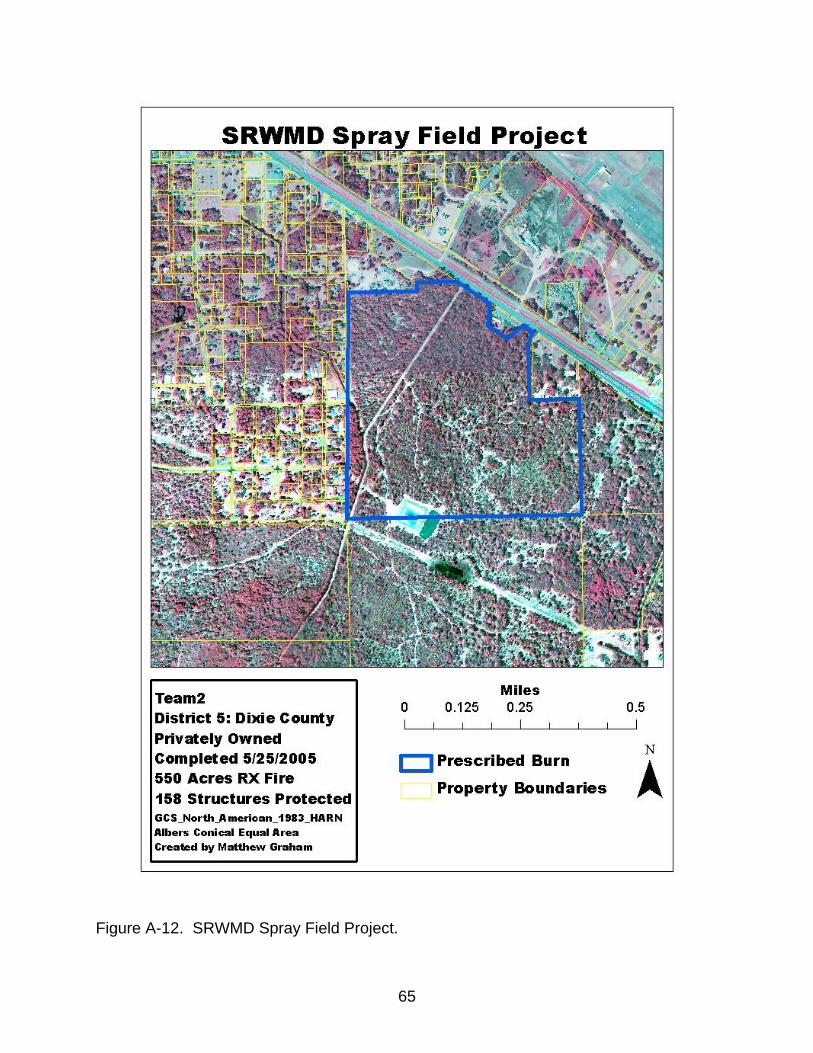
65
Figure A-12. SRWMD Spray Field Project.
66
Figure A-13. Ron Weiss/Turkey Creek Project.
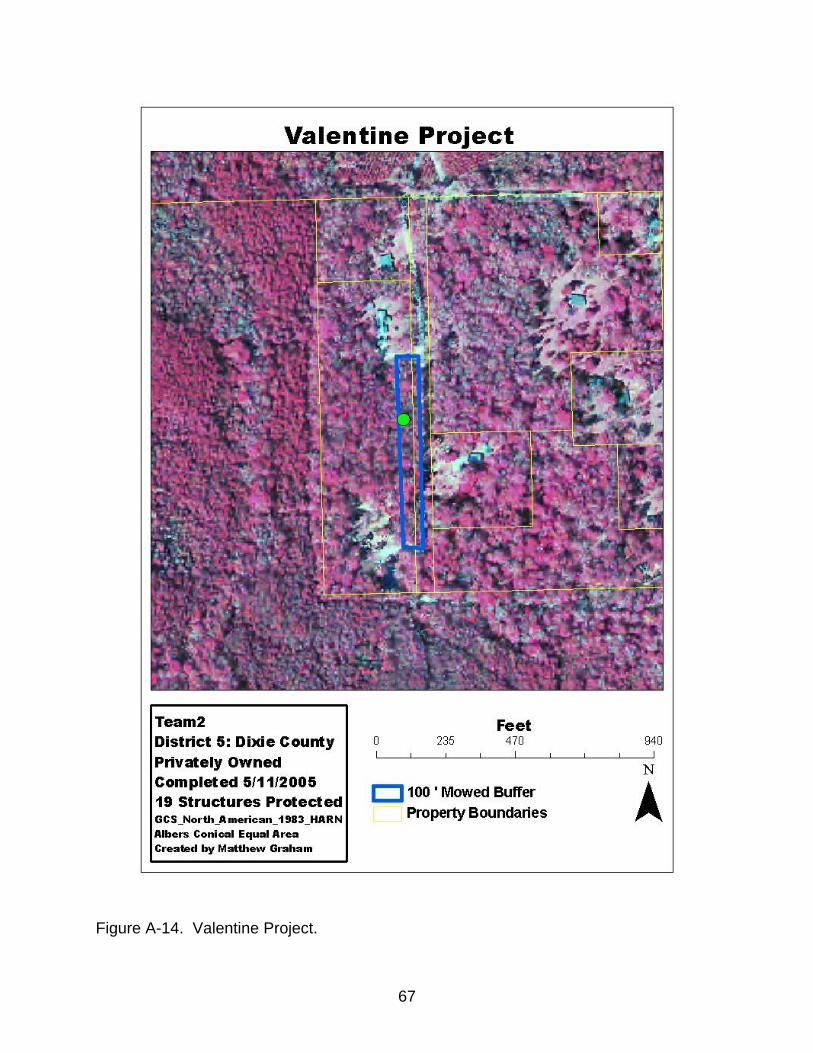
67
Figure A-14. Valentine Project.
68
APPENDIX B MAPS OF WUI FUELS MITITGATION TRETATMENTS II
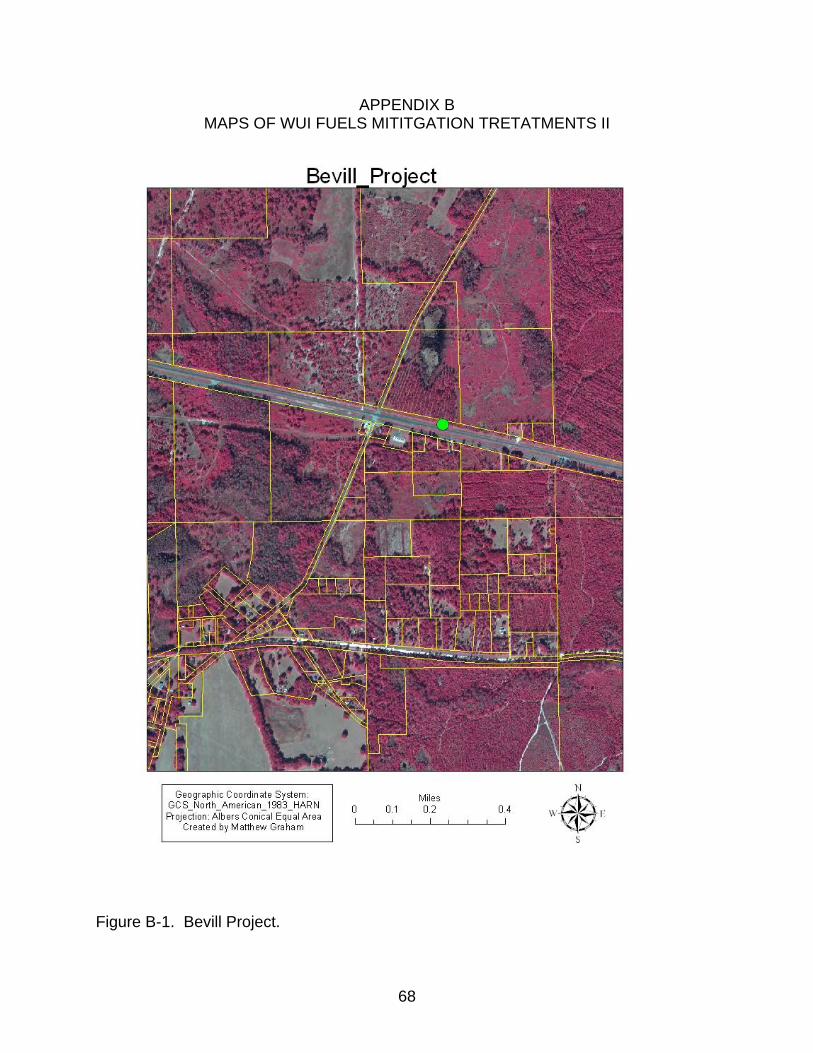
Figure B-1. Bevill Project.
69
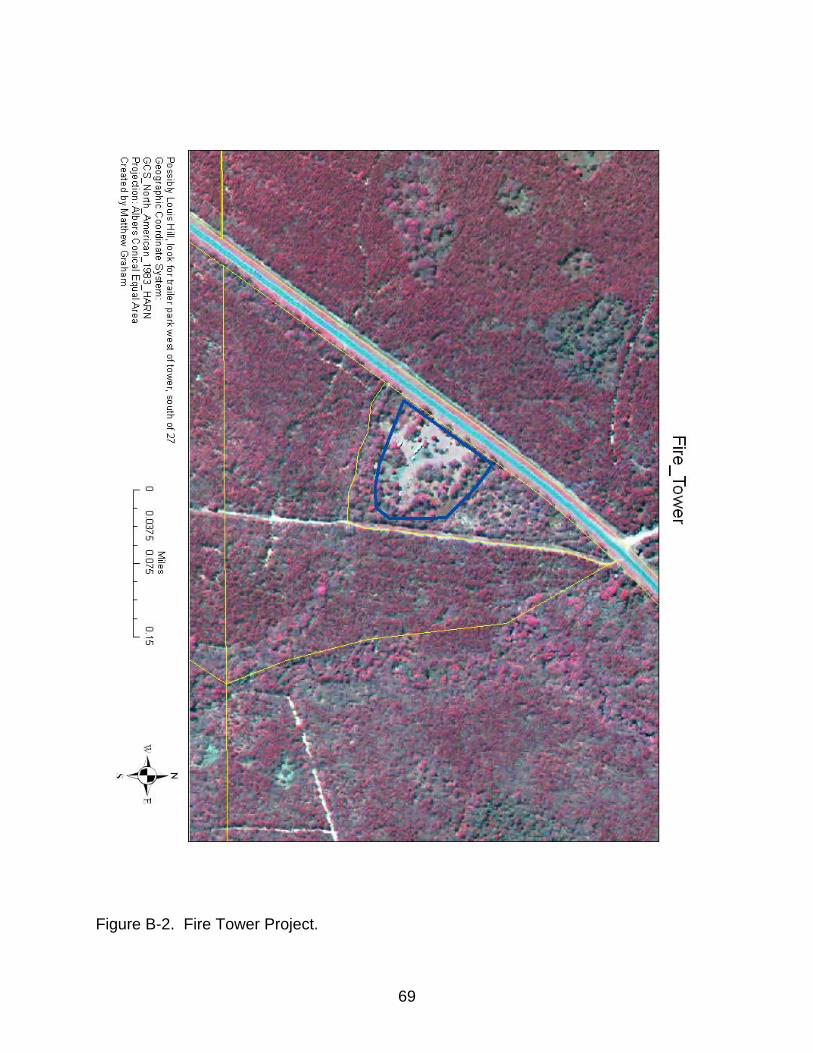
Figure B-2. Fire Tower Project.
70
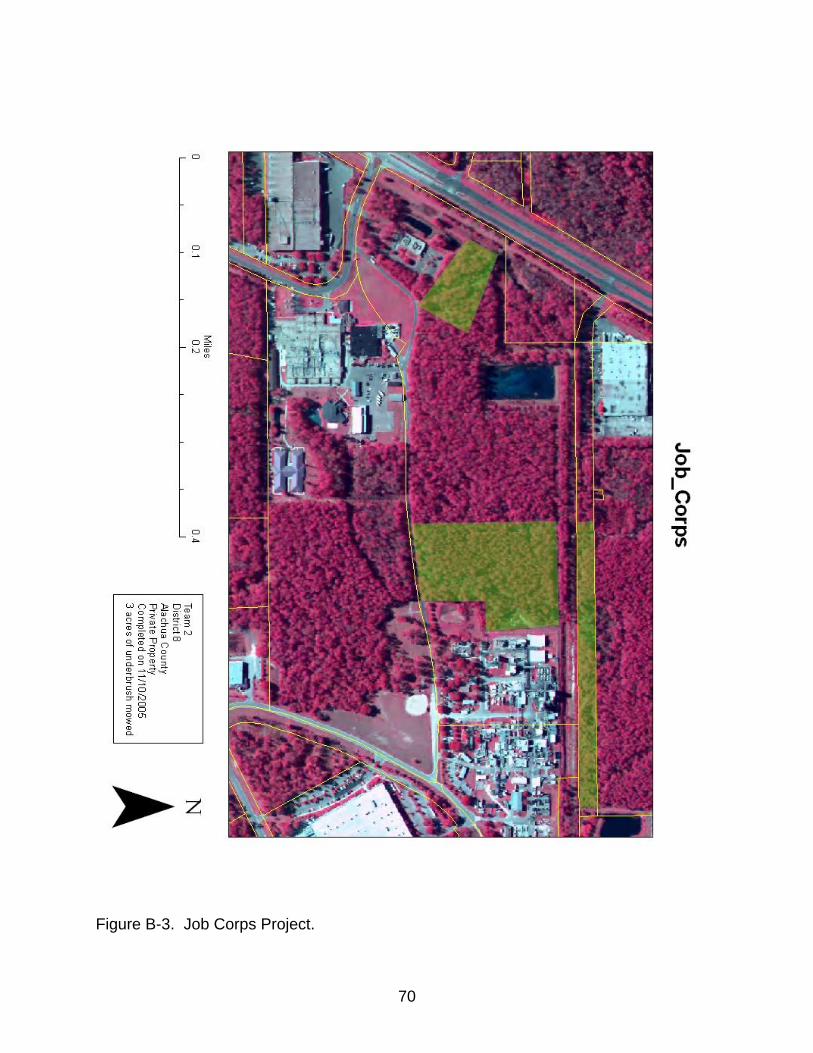
Figure B-3. Job Corps Project.
71
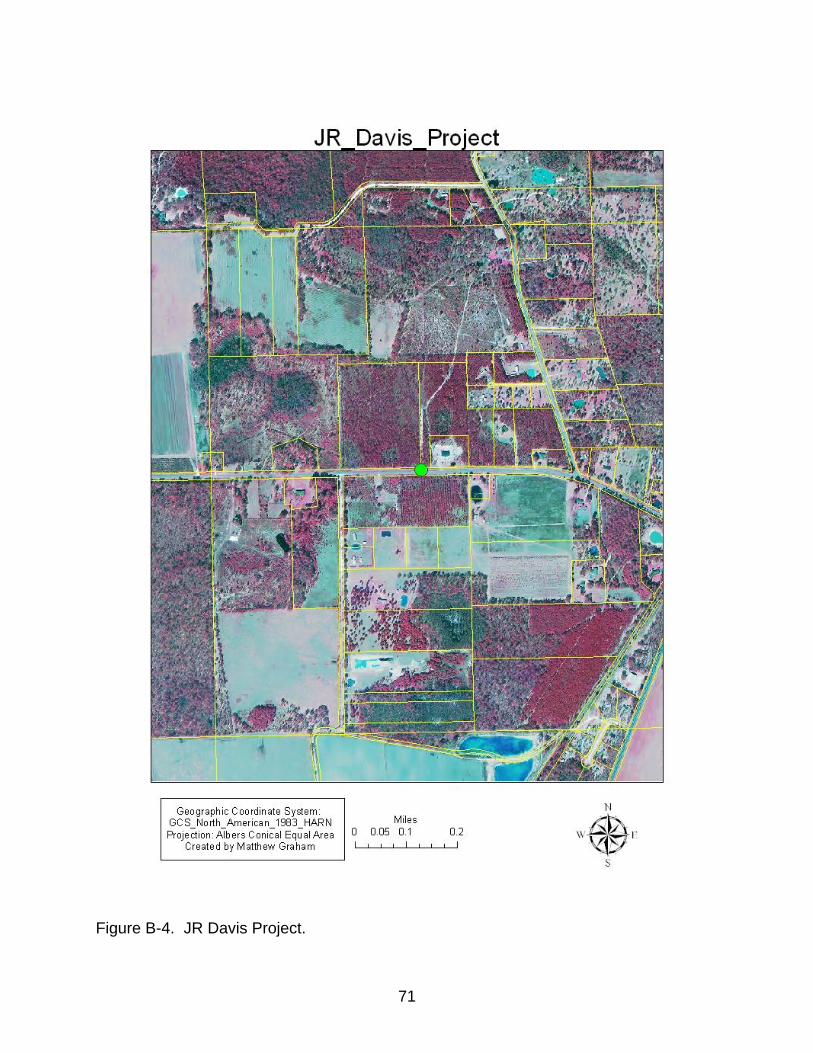
Figure B-4. JR Davis Project.
72
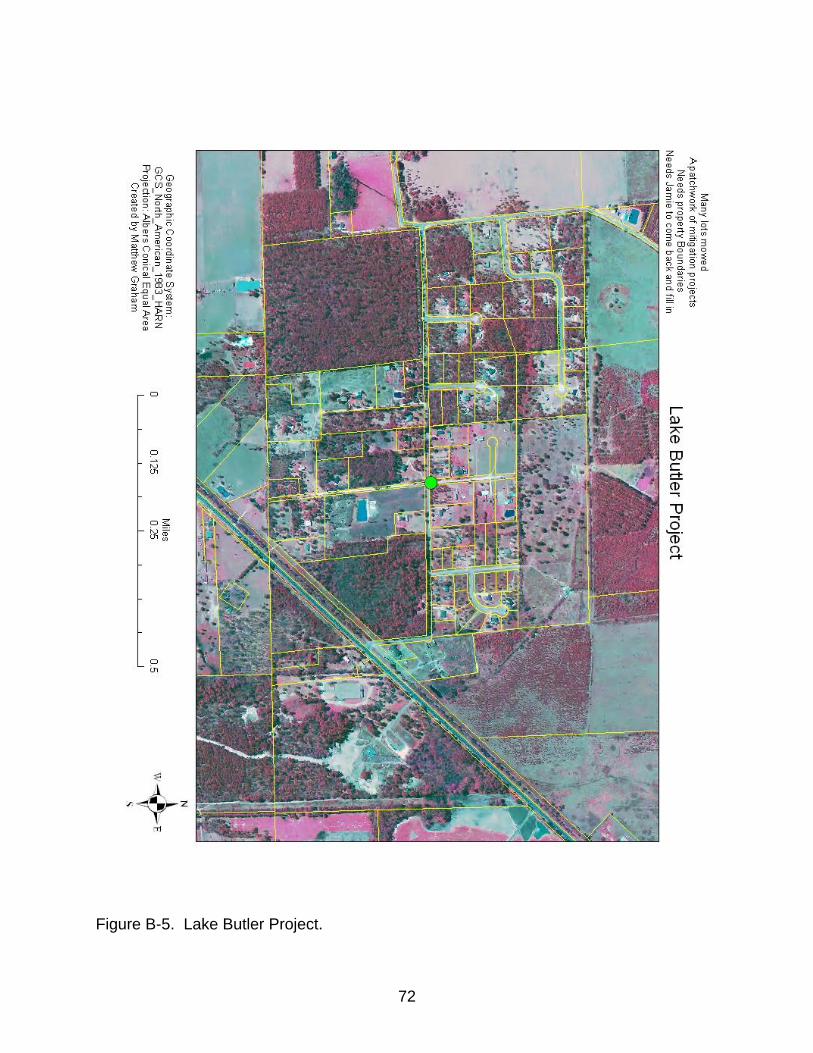
Figure B-5. Lake Butler Project.
73
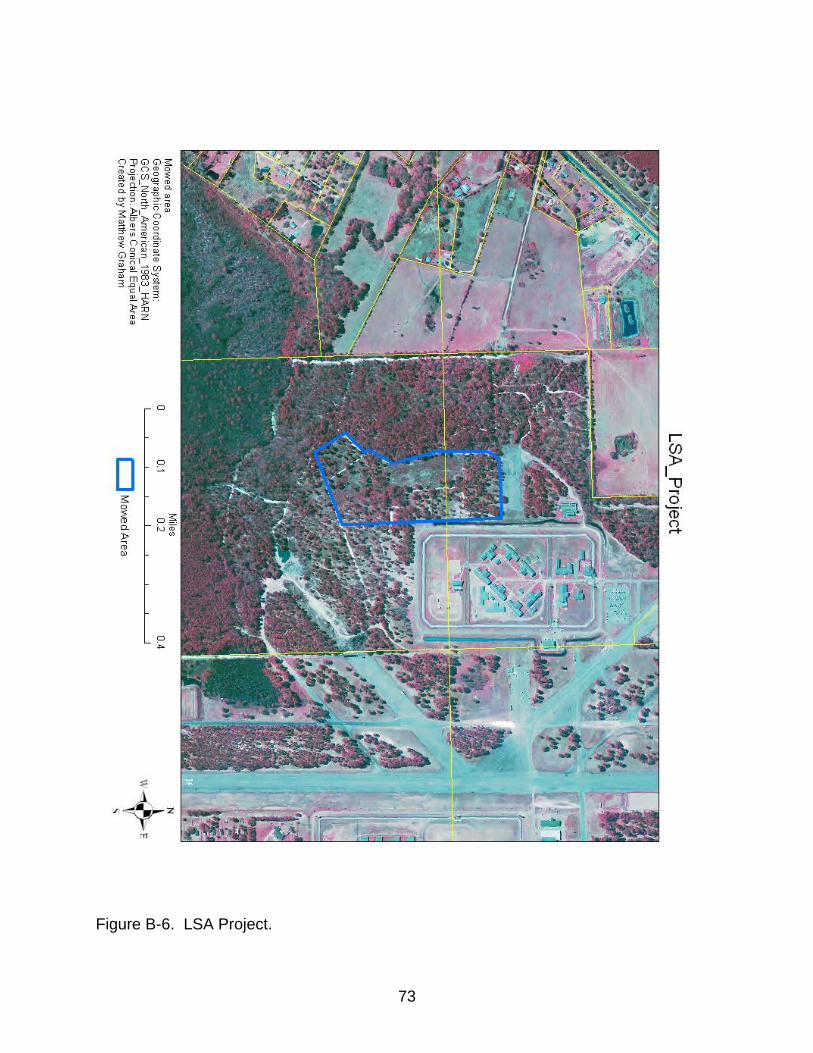
Figure B-6. LSA Project.
74
Figure B-7. Mason Road Project.
75
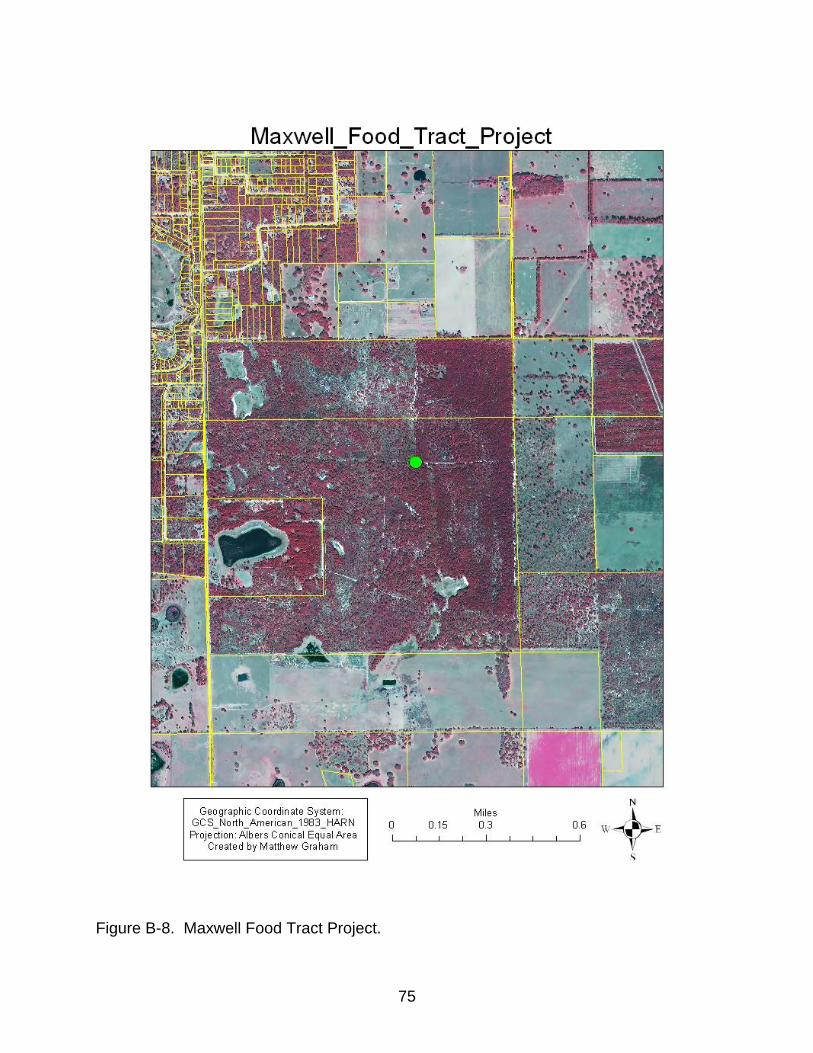
Figure B-8. Maxwell Food Tract Project.
76
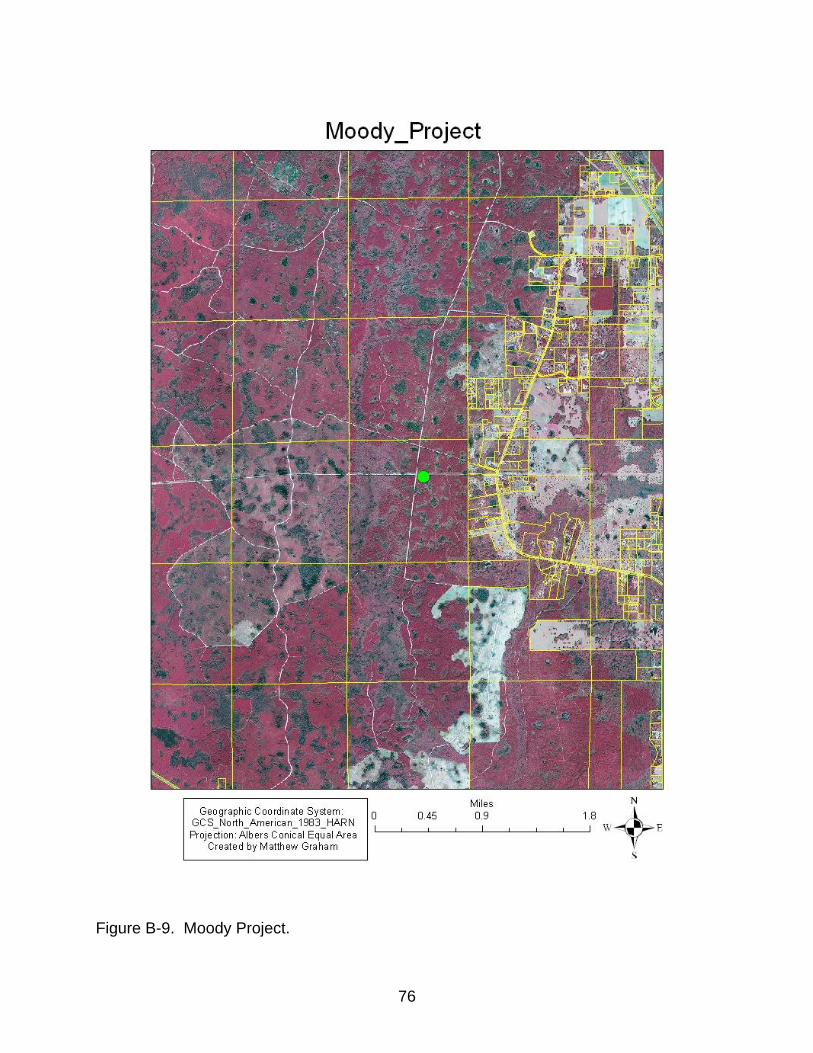
Figure B-9. Moody Project.
77
Figure B-10. Pinkoson Gladstone Project.
78
Figure B-11. Putnam EOC Project.
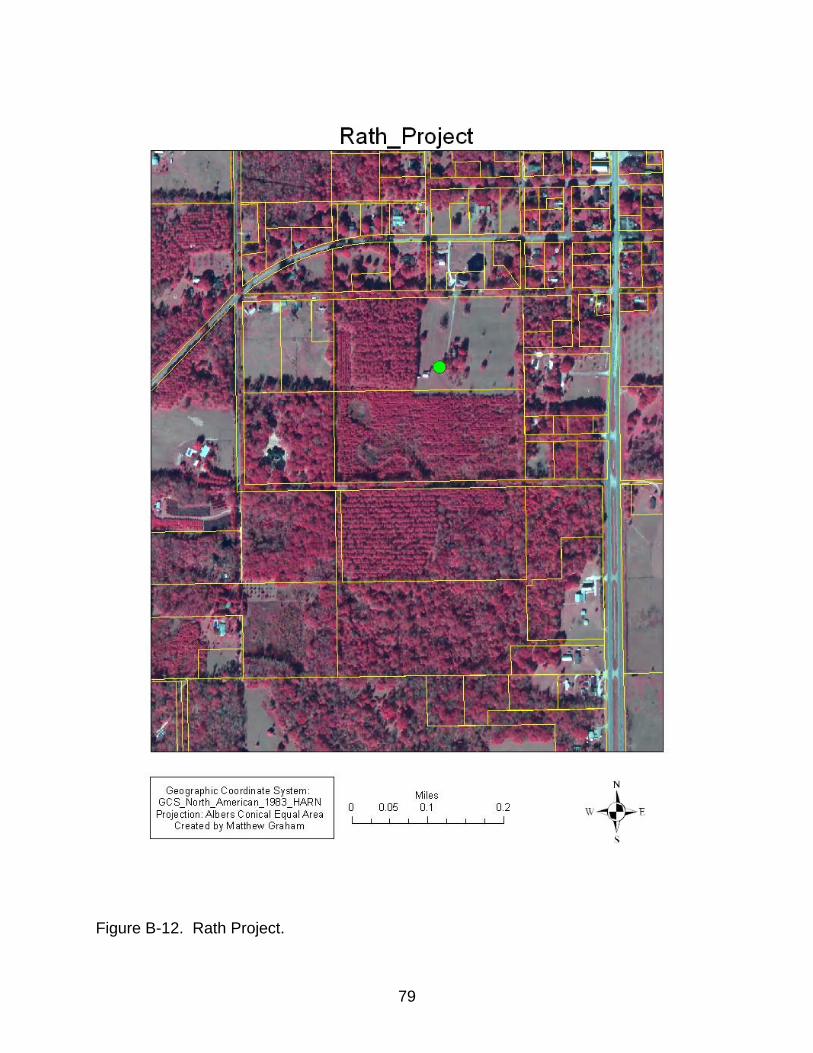
79
Figure B-12. Rath Project.
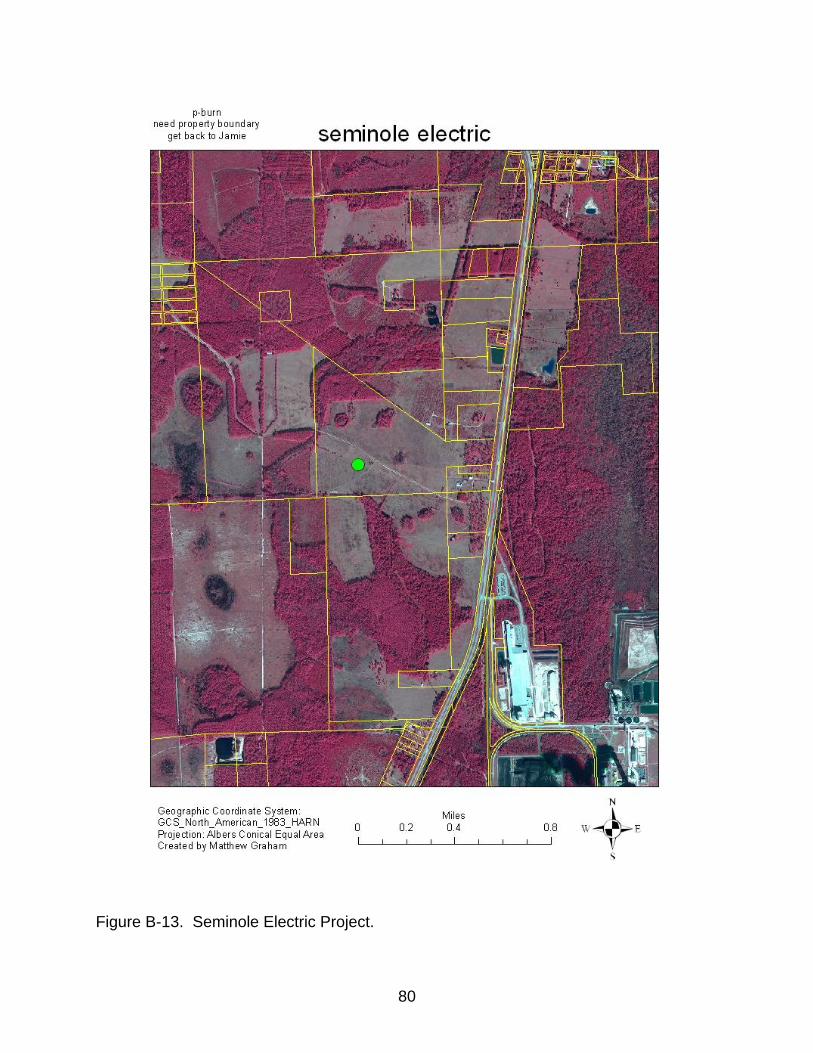
80
Figure B-13. Seminole Electric Project.
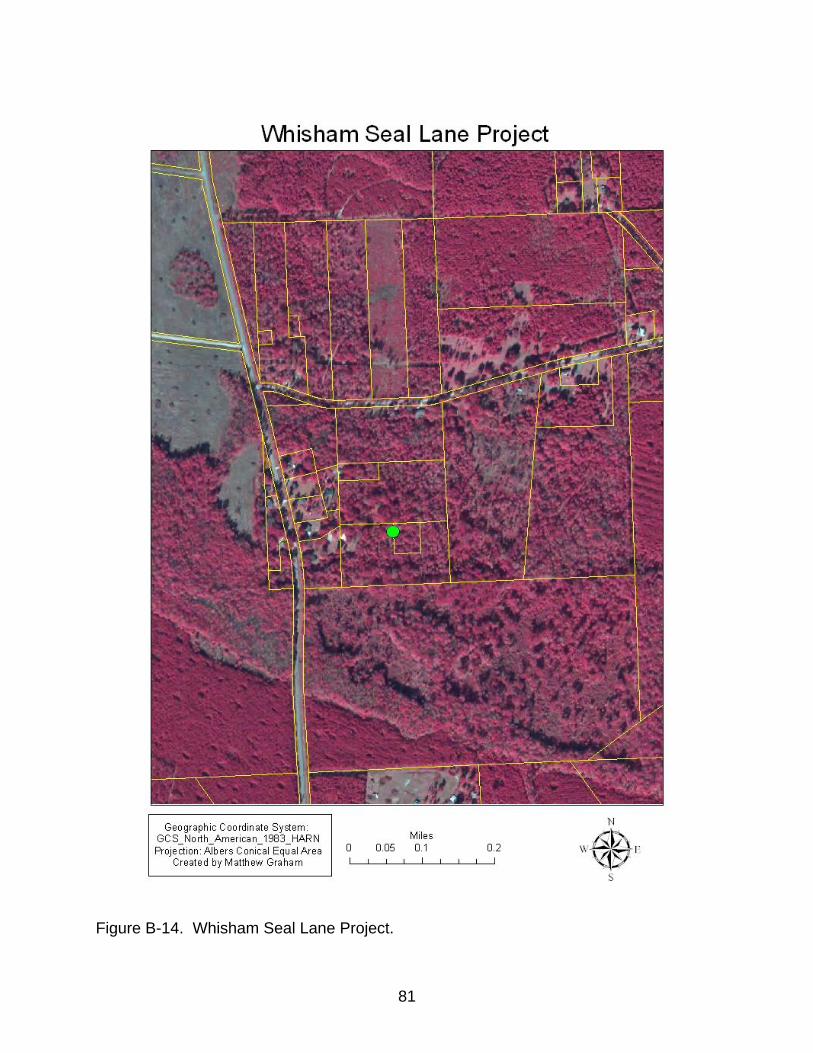
81
Figure B-14. Whisham Seal Lane Project.
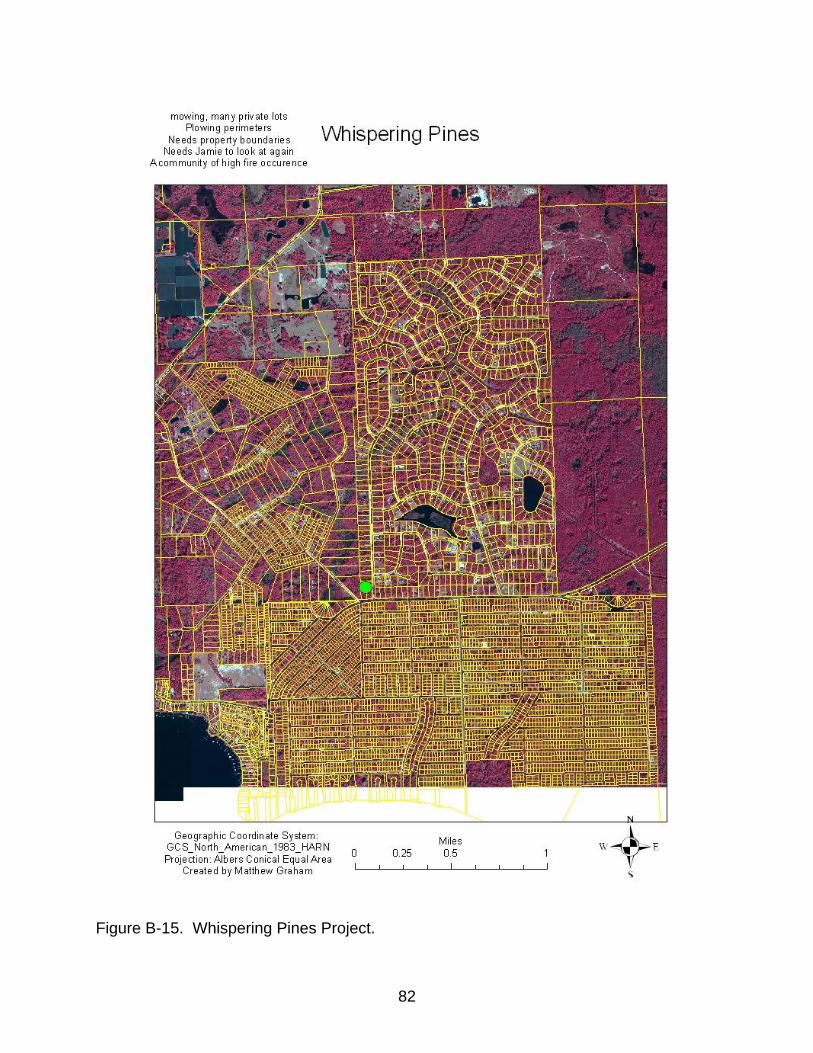
82
Figure B-15. Whispering Pines Project.
83
LIST OF REFERENCES
Bond, L. Lamplighter Project. National Fire Plan. Unpublished results. Brown, R. B., Stone, E. I., & Carlisle, V. W. (1990). In R. L. Myers & J. J. Ewel (Eds.),
Ecosystems of Florida (35-69). Orlando: University of Central Florida Press. Chen, E., & Gerber, J.F. (1990). Climate. In R. L. Myers & J. J. Ewel (Eds.),
Ecosystems of Florida (11-29). Orlando: University of Central Florida Press. Cocke, A. E., Fule, P. Z., & Crouse, J.E. (2005). Comparison of burn severity
assessments using differenced normalized burn ratio and ground data. International Journal of Wildland Fire, 14, 189-198.
Cohen, J. D. (1999). Reducing the Wildland Fire Threat to Homes: Where and How
Much. USDA Forest Service General Technical Report PSW-GTR-173, 189-195. Collins, F. M., Kelly, M., vanWagtendonk, J. W., & Stephens, S.L. (2007). Spatial
patterns of large natural fires in Sierra Nevada wilderness areas. Landscape Ecology, 22, 545-557.
Conard, S. G., Hartzell, T., Hilbruner, M. W., & Zimmerman, G. T. (2001). Changing
Fuel Management Strategies: The Challenge of Meeting New Information and Analysis Needs. Int. J. Wildland Fire, 10, 267-275.
Duffy, P. A., Epting, J., Graham, J. M., Rupp, T. S. & McGuire, A.D. (2007). Analysis of
Alaskan burn severity patterns using remotely sensed data. International Journal of Wildland Fire, 16, 277-284.
Epting, J., Verblya, D., & Sorbel, B. (2005). Evaluation of remotely sensed indices for
assessing burn severity in interior Alaska using Landsat TM and ETM+. Remote Sensing of Environment, 96, 328-339.
Esquin, S., Navarro, R., & Fernandez, P. (2008). Fire severity assessment by using
NBR (Normalized Burn Ratio) and NDVI (Normalized Difference Vegetation Index) derived from Landsat TM/ETM images. International Journal of Remote Sensing, 29, 1053-1073.
Fernandes, P. M., & Botelho, H. S. (2003). A review of prescribed burning effectiveness
in fire hazard reduction. International Journal of Wildland Fire, 12, 117-128. Finney, M. A. (2001). Design of Regular Landscape Fuel Treatment Patterns for
Modifying Fire Growth and Behavior. Forest Science, 47 (2), 219-228. Finney, M. A., McHugh, C. W., & Grenfell, I.C. (2005). Stand- and landscape-level
effects of prescribed burning on two Arizona wildfires. Canadian Journal of Forest Research, 35, 1714-1722.
84
Hammill, K. A., & Bradstock, R. A. (2006). Remote sensing of fire severity in the Blue Mountains: influence of vegetation type and inferring fire intensity. International Journal of Wildland Fire, 15, 213-226.
Jensen,J. (2005). Introductory Digital Image Processing: A Remote Sensing
Perspective. New Jersey: Pearson Education Hall. Johnson, M. C., Peterson, D. L., & Raymond, C. L. (2007). Managing Forest Structure
and Fire Hazard: A Tool for Planners. J. Forestry, 77-83. Kalabokidis, K. D. and Omi, P. N. 1998. Reduction of Fire Hazard through
Thinning/Residue Disposal in the Urban Interface. International Journal of Wildland Fire, 8, 29-35.
Key, C. H., & Benson, N. C. (1999a). The Normalized Burn Ratio: a Landsat TM
radiometric index for burn severity. http://nrmsc.usgs.gov/research/nbr.htm. Martinson, E. J., & Omi, P. N. (2003). Performance of Fuel Treatments Subjected to
Wildfires. USDA Forest Service Proceedings RMRS-P-29, 7-13. Martinson, E.J., & Omi, P.N., (2006). Assessing Mitigation of Wildfire Severity by Fuel
Treatments – An Example From the Coastal Plain of Mississippi. USDA Forest Service Proceedings RMRS-P-41, 429-439.
Miller, J. D., & Yool, S.R. (2002). Mapping post-fire canopy consumption in several
overstory types using multi-temporal Landsat TM and ETM data. Remote Sensing of Environment, 82 , 481-496.
Miller, J. D., & Thode, A. E. (2007). Quantifying burn severity in a heterogeneous
landscape with a relative version of the delta Normalized Burn Ratio (dNBR). Remote sensing of Environment, 109, 66-80.
Miller, S. R. & Wade, D. (2003). Re-introducing fire at the urban/wild-land
interface:planning for success. Forestry, 76, 253-260. Multi-Resolution Land Characteristics (MRLC2001). (Revised 05/23/2006). Image
Processing Procedure. EROS Data Center. http://landcover.usgs.gov/pdf/image_preprocessing.pdf
National Wildfire Coordinating Group. (1996). Glossary of Wildland Fire Terminology.
Boise ID, USA: National Interagency Fire Center. Pub. PMS 205./NFES 1832. 141pp.
Outcalt, K. W., & Wade, D.D. (1999). The value of fuel management in reducing wildfire damage. Proceedings of the Joint Fire Science Conference and workshop on crossing the millennium: integrating spatial technologies and ecological principals for a new age in fire management, (2). Moscow: University of Idaho.
Patterson, M. W., & Yool, S. R. (1998). Mapping fire-induced vegetation mortality using
landsat ehtmatic mapper data: A comparison of linear transformation techniques. Remote Sensing of Environment, 65, 132-142.
Picotte, J., (2009). Personnal communication. Unpublished raw data. Pollet, J., & Omi, P. N. (2002). Effect of thinning and prescribed burning on crown fire
severity in ponderosa pine forests. International Journal of Wildland Fire, 11, 1-10.
Robichaud, P. R., Lewis, S. A., Laes, D. Y. M., Hudak, A. T., Kokaly, R. F., & Zamudio,
J. A. (2007). Postfire soil burn severity mapping with hyperspectral image unmixing. Remote Sensing of Environment, 108, 467-480.
Rogan, J., & Yool, S. R. (2001). Mapping fire-induced vegetation depletion in the
Peloncillo Mountains Arizona and New Mexico. International Journal of Remote Sensing, 22, 3101-3121.
Salazar, L. A., & Gonzalez-Caban, A. (1987). Spatial Relationship of a Wildfire,
Fuelbreaks, and Recently Burned Areas. Western Journal of Applied Forestry, 2 (2), 55-58.
Sunar, F., & Ozkan, C. (2001). Forest fire analysis with remote sensing data.
International Journal of Remote Sensing, 22, 2265-2277. Thompson, J. R., Spies, T. A., & Ganio, L. M. (2007). Re-burn severity in managed and
unmanaged vegetation in the Bisuit Fire. Proceedings National Academy of Sciences, 104, 10743-10748.
van Wagtendonk, J. W., Root, R. R., & Key, C. H. (2004). Comparison of AVIRIS and
Landsat ETM detection capabilities for burn severity. Remote Sensing of Environment, 92, 397-408.
White, J. D., Ryan, K. C., Key, C. C., & Running, S. W. (1996). Remote Sensing of
Forest Fire Severity and Vegetation Recovery. International Journal of WIldland Fire, 6,125-136.
Wimberly, M., & Reilly, M. (2007). Assessment of fire severity and species diversity in
the southern Appalachians using Landsat TM and ETM+ imagery. Remote Sensing of Environment, 108, 189-197.
86
Winter, A. Cone Property Mowing Project & Wildfire Success Story. National Fire Plan. Unpublished results.
Winter, A. Bennett Prescribed Burn/ Church Fire Success Story. National Fire Plan.
Unpublished results.
87
BIOGRAPHICAL SKETCH
Matthew Graham received his Bachelors in Environmental Studies and
Anthropology, Cum Laude, from Florida State University in 2001. He worked
professionally as an Instrument Man for a number of engineering and surveying
companies using the money to travel prior to enrolling in the Department of Geography
at the University of Florida in 2005. During his time at UF, he has worked as a
Teaching Assistant for the Department of Geography at UF, a Prescribed Fire
Technician for The Nature Conservancy, and as a Geospatial Analyst for the Kobziar
Fire Science Lab of UF’s School of Forest Resources and Conservation. He leaves UF
employed as a Land Surveyor in Mine Planning for Dupont Titanium Technologies
primarily working on projects involving mining, storm water systems, and topographic
reclamation. He is a native Floridian who hopes to see continued and improved
conservation and sustainability initiatives implemented by the government on behalf of