Page 1
University of Groningen
Charge extraction from colloidal inorganic nanocrystalsSzendrei, Krisztina
IMPORTANT NOTE: You are advised to consult the publisher's version (publisher's PDF) if you wish to cite fromit. Please check the document version below.
Document VersionPublisher's PDF, also known as Version of record
Publication date:2011
Link to publication in University of Groningen/UMCG research database
Citation for published version (APA):Szendrei, K. (2011). Charge extraction from colloidal inorganic nanocrystals Groningen: s.n.
CopyrightOther than for strictly personal use, it is not permitted to download or to forward/distribute the text or part of it without the consent of theauthor(s) and/or copyright holder(s), unless the work is under an open content license (like Creative Commons).
Take-down policyIf you believe that this document breaches copyright please contact us providing details, and we will remove access to the work immediatelyand investigate your claim.
Downloaded from the University of Groningen/UMCG research database (Pure): http://www.rug.nl/research/portal. For technical reasons thenumber of authors shown on this cover page is limited to 10 maximum.
Download date: 08-07-2018
Page 2
Chapter 4
Solar cells based on PbS
nanocrystals
Abstract The development of solar cells incorporating PbX nanocrystals (NCs) has been in
the focus of NC photovoltaics in the last couple of years. The main motivation to
use PbX NCs is to extend the absorption of the solar radiation in the near-infrared
region as well. In this chapter, the fabrication of efficient PbS solar cells, showing
power conversion efficiencies approaching 4% and fill factors of 60% under
AM1.5 illumination is presented. The effect of the size of the NCs on the
performance and key parameters of the devices are discussed together with
peculiar features of the device functioning. The results prove that the devices are
not under space charge limitation and the performance is influenced by charge
trapping which depends on the size of the NCs.∗
∗ K. Szendrei, W. Gomulya, M. Yarema, W. Heiss, M. A. Loi, Applied Physics Letters, 2010, 97,
203501
Page 3
Charge extraction from colloidal inorganic nanocrystals
60
4.1 Introduction
Photovoltaic devices1-3
and photodetectors4-6
based on solution-processable
colloidal inorganic nanocrystals (NCs) have recently received increasing attention
thanks to the unique optical and electrical properties7 of the NCs. Due to quantum
confinement, the effective band gap of the NCs can be fine-tuned by varying their
size. In the case of narrow band gap semiconductors such as PbS and PbSe the
tunability of the band gap allows to maximize the absorption of solar radiation in
the near-infrared region. Until now, the presence of the insulating molecular shell
around the NCs was considered to be the major drawback preventing their use in
electronics and optoelectronics. Recently, several methods8-13
have been developed
to replace long insulating molecules such as oleic acid (OA) by shorter and
conductive ligands which can reduce inter-particle spacing and increase the
electronic coupling between NCs. In most of these reports, ethanedithiol14,15
(EDT)
or benzenedithiol11,12,16
(BDT) are used as bidentate ligands to exchange the
original insulating ligands and crosslink the NCs after thin film deposition.
The post deposition ligand exchange method enabled the fabrication of more
conductive films and their utilization as active layer in optoelectronic devices such
as solar cells. The active layer of these solar cells is generally fabricated by
sequential layer by layer (LBL) deposition such as dipping14,17
or spin coating11,16
of the NC and thiol solutions. Promising solar cells have been reported using
PbS,15,18
PbSe14
or PbSxSe1-x NCs19
as active layer, boosting power conversion
efficiencies (PCE) up to 3.6%.16
Solar cells based on junctions between PbX NCs
and other semiconductors have also been reported.11,20-23
In a recent report,22
the
figure of merit of different device architectures are compared and the major
limitations of NCs photovoltaic devices are identified as: i) low open-circuit
voltage (Voc), approximately equal to half of the band gap of the NCs and ii) low
fill factor (FF).
In this chapter, we report on the fabrication of efficient PbS solar cells,
showing PCE approaching 4% and FFs of 60%. Our results exceed the previously
reported literature record16
where a PCE of 3.6% and a FF of 51% were obtained
on a device active area of 2.9 mm2. The effect of the NCs` size on the performance
and key parameters of the devices are discussed together with peculiar features of
the device functioning.
Page 4
CHAPTER 4
61
4.2 Results and discussion
4.2.1 Device preparation and characterization
The device active layer is fabricated by LBL deposition of PbS NCs treated
with 1,4-BDT in each iteration to replace the OA, being present on the NCs
surface. The bidentate BDT coordinates its two thiol groups to the surface of
neighboring NCs, cross linking them to each other, as is schematically illustrated in
Figure 4.1 (b).
(a) (b)
(c)
0 1.0 mm
1.0 mm
00.5
0.5
0 nm
10 nm
5 nm
0 1.0 mm
1.0 mm
00.5
0.5
0 nm
10 nm
5 nm
Figure 4.1 (a) FTIR spectroscopy characterization of PbS thin films before and after BDT treatment.
(b) Schematic of PbS NCs cross-linked with BDT. (c) AFM topography image of BDT treated PbS
thin films.
Possible reaction mechanisms17
for the exchange of OA with BDT on the
surface of the PbS NCs are depicted in Figure 4.2. The first reaction mechanism is
based on the nucleophilic attack of OA by BDT followed by Pb-S bond formation
and desorption of OA. The second possible route is the dissociative adsorption of
BDT on the NC surface which results in adsorbed HS(C6H4)S- and H again
followed by the desorption of OA. In any case, the inter-particle distance
decreases, as it is confirmed by TEM measurements (Figure 4.3).
The TEM images show that replacing the OA ligands by BDT molecules
reduces the inter-particle spacing, which can be explained by the interpenetration
of thiol end groups and cross-linking of the neighboring NCs. The separation
between the surfaces of adjacent NCs can be estimated to be ~ 2 nm with OA
passivation and ~ 0.5 nm after BDT treatment, which is in close agreement with
Page 5
Charge extraction from colloidal inorganic nanocrystals
62
literature data.12
The cross-linking reaction results in the formation of cracks and
pinholes in the active layer due to a loss of volume.24
The LBL technique allows
fabricating the device active layer without the presence of these defects.
S Pb
Pb S
S
Pb
O O
C
R
BDT
S Pb
Pb S
S
Pb
O
C
R
O
SH
SH
S Pb
Pb S
S
Pb
O
C
R
HO
S
SH
-RCOOHS Pb
Pb S
S
Pb
S
SH
S Pb
Pb S
S
Pb
O O
C
R
BDT
Pb
S
S
SH
S Pb
Pb S
S
Pb
O O
C
R
Pb
S
-RCOOH
S
SH
S Pb
Pb S
S
Pb
Pb
S
H
(a)
(b)
Figure 4.2 Possible reaction mechanisms for the exchange of OA by BDT on the PbS NCs` surface
(a) (b)
Figure 4.3 TEM images of PbS NCs a) before and b) after ligand exchange
The active layer is sandwiched between two electrodes, indium tin oxide (ITO)
serving as the anode, while the cathode is formed by LiF/Al (Figure 4.4). The
ligand exchange in the PbS thin film was followed by Fourier Transform Infrared
Spectroscopy (FTIR). The FTIR spectra reported in Figure 4.1(a) confirm that the
original insulating oleic acid ligands are replaced by the much shorter BDT in
agreement with a previous report.12
The characteristic vibrations of oleic acid (top
part Figure 4.1 (a)) such as the strong symmetrical and asymmetrical –(COO)–
Page 6
CHAPTER 4
63
vibrations at ~1400 and 1550 cm-1
and the –(C–H)– vibrations at ~ 2856 and
2925 cm-1
are strongly reduced in the BDT treated film (bottom Figure 4.1 (a)). In
contrast, the typical vibrations of BDT such as –(C=C)– at ~ 1465 cm-1
, p-benzene
at ~ 805 cm-1
and the –(C–S)– stretch peaks at ~ 660 cm-1
appeared. The peaks at ~
1093 cm-1
in the FTIR spectra of the BDT treated NCs layer is attributed to the Si
substrate, being here more evident because of the smaller film thickness respect to
the OA-NCs film. Moreover, the BDT treated sample shows a feature at 487 cm-1
which can be attributed to the formation of –(S–S)– bonds. The topography of the
layers formed by the NCs cross-linked with BDT is shown in Figure 4.1 (c). The
surface of the active layer appears to be quite smooth with a RMS roughness of
1.7 nm.
Figure 4.4 Device structure of PbS solar cells
The current density-voltage (J -V) characteristics of the best performing BDT
treated PbS solar cells are shown in Figure 4.5 (a). The devices were fabricated
using 2 different sizes of PbS NCs with diameters of 3.5 (band gap of 1.3 eV) and
4.3 nm (band gap of 1.1 eV), resulting in PCEs of 3.48% and 3.93%, respectively.
The inset of Figure 4.5 (a) shows the current density-voltage characteristics of both
devices plotted on logarithmic scale. The PbS solar cells made with the smaller
NCs exhibit higher Voc (0.55 V instead of 0.46 V) due to the larger band gap. On
the contrary, the Jsc of the device fabricated with the 4.3 nm PbS NCs is much
larger. This higher short circuit current could be due to the reduced band gap,
resulting in more extended absorption, as shown by the IPCE measurements in
Figure 4.5 (b), or by the reduced amount of trapping sites at the interface in the
films composed of bigger NCs.
Page 7
Charge extraction from colloidal inorganic nanocrystals
64
(a)
(b)
Figure 4.5 (a) J-V characteristics of PbS solar cells composed of 2 different types of NCs. Inset: J-V
curves on a logarithmic scale in dark and under illumination. (b) IPCE spectra of PbS solar cells.
For both NCs the external quantum efficiency shows a maximum of ~ 60% in the
visible region and ~20% in the infrared region, where the peaks correspond to the
excitonic peak of the PbS NCs. The calculated Jsc of the devices from the IPCE
data under 100 mW/cm2 of AM 1.5G solar irradiation were 113.6 A/m
2 in the case
of smaller NCs and 144.5 A/m2 for the NCs with a band gap of 1.1 eV. These
values show good agreement with the measured short circuit current of 115.45 and
144.64 A/m2 (see Figure 4.5 (a)).
The devices fabricated using larger NCs show FF exceeding 60% (64% the
best FF achieved), while in the case of the smaller NCs the FF is as high as 56%.
This lower value of the FF could be a sign of slightly more efficient recombination
of the electron-hole pairs in the active layer. In both cases the measured FFs are the
highest reported in literature for this class of solar cells. Similar FFs were only
presented recently by Zhao et al., however for bilayer hybrid devices using PbS
Page 8
CHAPTER 4
65
NCs and fullerene derivatives as active layers.25
The very high FF values of our
devices also suggests that the photocurrent is not space charge limited, since space-
charge limited solar cells are not expected to reach FFs higher than 42%.
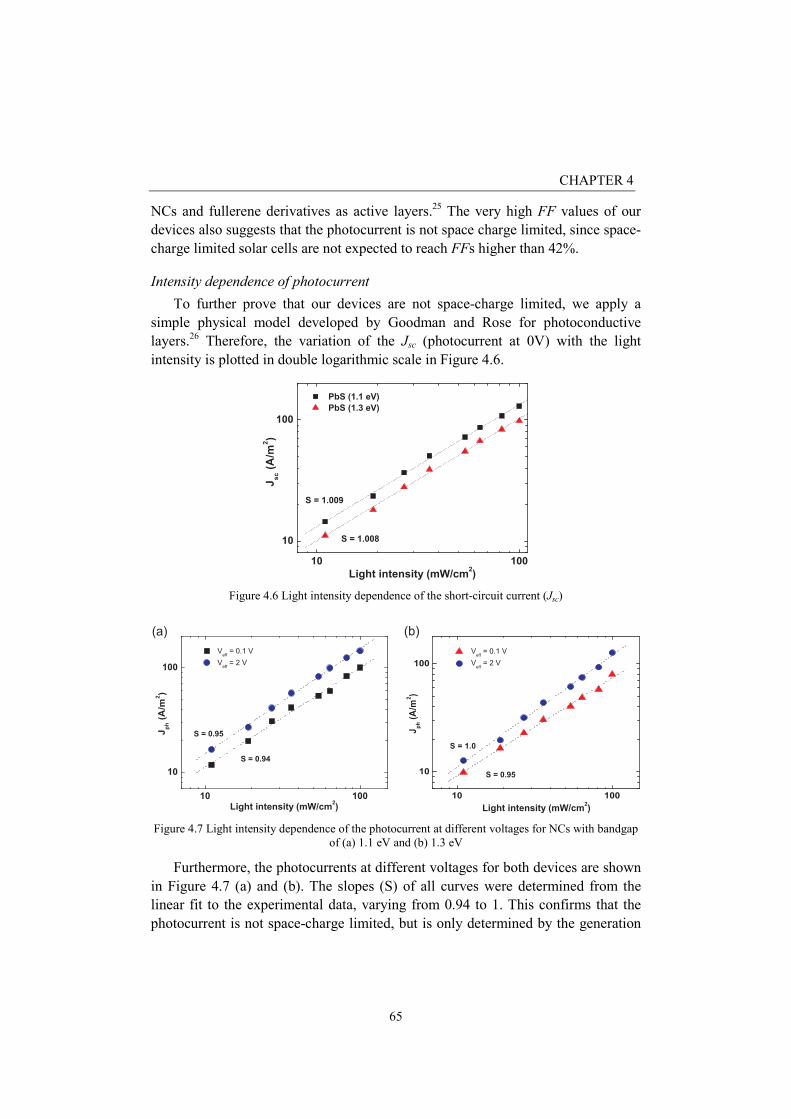
Intensity dependence of photocurrent
To further prove that our devices are not space-charge limited, we apply a
simple physical model developed by Goodman and Rose for photoconductive
layers.26
Therefore, the variation of the Jsc (photocurrent at 0V) with the light
intensity is plotted in double logarithmic scale in Figure 4.6.
Figure 4.6 Light intensity dependence of the short-circuit current (Jsc)
(a) (b)
Figure 4.7 Light intensity dependence of the photocurrent at different voltages for NCs with bandgap
of (a) 1.1 eV and (b) 1.3 eV
Furthermore, the photocurrents at different voltages for both devices are shown
in Figure 4.7 (a) and (b). The slopes (S) of all curves were determined from the
linear fit to the experimental data, varying from 0.94 to 1. This confirms that the
photocurrent is not space-charge limited, but is only determined by the generation
Page 9
Charge extraction from colloidal inorganic nanocrystals
66
rate of photoexcitations upon illumination. It has been shown that for a space-
charge limited device the photocurrent shows a square root dependence on the
effective voltage and a slope S ~ 0.75 due to the formation of space-charge regions
or recombination-limited photocurrent.27
Figure 4.8 shows the photocurrent Jph = JL-JD, where JL and JD are the current
densities under illumination and in dark, respectively, as a function of the effective
voltage (V0-V). The effective voltage was obtained by subtracting the applied
voltage (V) from the compensation voltage (V0) which is defined as Jph = 0. In
Figure 4.8 only two regimes can be distinguished: i) small effective voltages (V0-V
< 0.1 V) where the drift and diffusion currents compete and vary linearly with the
voltage and ii) increasing effective voltages (V0-V > 0.1 V) when the Jph tends to
saturate. The 3rd regime where the Jph would be characterized by the square root of
the effective voltage does not appear, confirming once more that the devices are
not space charge limited. When space-charge effects do not play any role, and the
recombination is neglected, the photocurrent can be expressed by Jph = qGL where
q is the electric charge, G the generation rate of the photoexcitations and L the
device layer thickness.26
Using the maximum Jph values obtained from the
saturation regime of the plots, the generation rates Gmax were calculated to be
7*1027
m-3
s-1
(for NCs of 1.1 eV) and 5.4*1027
m-3
s-1
(for NCs of 1.3 eV). Clearly,
the devices composed by larger NCs absorb more light which leads to the
generation of more photoexcitations.
Figure 4.8 Photocurrent (Jph) of the PbS devices versus the effective applied voltage (V0-V).
Light intensity dependence of Voc
The device active layer can be treated as one intrinsic semiconducting material
with relatively low mobility,13,25
according to the metal-insulator-metal (MIM)
Page 10
CHAPTER 4
67
model. To further understand the working mechanism and limiting factors of these
solar cells, the Voc of the two different NC devices were plotted versus the
logarithm of the light intensity in Figure 4.9. For trap-free solar cells, the slope (S)
of the Voc should follow S = (kT/q), where k is the Boltzmann constant, T is the
temperature and q is the elementary charge.28,29
However, it has been demonstrated
that trap-assisted recombination could enhance the dependence of the Voc on the
light intensity.30
For our devices, the slopes were calculated from the linear fits,
resulting in S = 1.38(kT/q) for smaller NCs and S = 1.25(kT/q) for the bigger NCs,
indicating the presence of traps in the active layers. We suggest that the difference
between the 2 devices originates from the depth lowering of the traps and a
decrease of the amount of interfaces in the active layer when increasing the size of
the NCs. When the size of the NCs is increased, the bandgap of the NCs decreases,
reducing the relative position of trap levels. These results support the idea of a
recent report where the performance of PbSe devices are considered to improve by
changing the depth of trap states with NCs` band gap.31
Figure 4.9 Open-circuit voltage (Voc) versus the natural logarithmic of the light intensity of PbS solar
cells.
Thickness dependence of PbS solar cells
To find the optimal layer thickness for both of our PbS solar cells, devices with
layer thicknesses of ~80-190 nm were fabricated by the LBL method. From a light
harvesting point of view, increasing the active layer thickness of solar cells is
expected to improve the photocurrent due to increased absorption which would
result in enhanced device efficiency. The key parameters (Jsc, Voc, FF and η) of the
PbS solar cells are shown in Figure 4.10 as a function of the active layer thickness.
According to expectations, the Jsc of the both types of devices increases with the
active layer thickness due to the enhanced absorption. As can be seen, the devices
Page 11
Charge extraction from colloidal inorganic nanocrystals
68
fabricated with larger NCs generate higher Jsc, which is due to the fact that the
absorption of larger NCs is red-shifted with respect to the absorption of smaller
NCs and therefore covers a broader absorption range of the solar spectrum. The Voc
stays approximately constant in both cases. However, corresponding to a larger
bandgap, the smaller crystals produce a higher Voc than the larger ones.
Surprisingly, the FF of both devices only slightly decreases over 140 nm and larger
NCs produce higher FFs. The larger FF of larger NCs could be explained by the
presence of shallower traps due to the reduction of the bandgap, leading to less
recombination in comparison to smaller NCs. It has already been proven that the
devices are not space-charge limited, which would lead to a dramatic decrease of
the FF, therefore the small losses in the FF here can simply be attributed to more
charge recombination. In thicker devices, the charge carriers have to travel longer
distances to reach their respective electrodes, giving more opportunity for charges
to recombine. (a)
(c)
(b)
(d)
Figure 4.10 Thickness dependence of the key parameters (a) Jsc, b) Voc, c) FF and d) η) of PbS solar
cells for two different NC sizes
Page 12
CHAPTER 4
69
Stability of PbS solar cells
After fabrication, the devices were stored in a nitrogen-filled glove box and the
degradation of the devices was systematically followed in time. Figure 4.11 shows
the degradation of all characteristic parameters (such as efficiency, Jsc, Voc and FF)
of NC solar cells based on PbS with a bandgap of 1.1 eV. Notably, after 21 days of
storage in N2 the device efficiency decreased to ~ 80% of the original value.
Surprisingly, the Jsc of the devices remained constant and only the Voc and FF
started to decrease exponentially with time resulting in lower overall efficiencies.
The degradation can be attributed to oxidation (the samples were exposed to air
shortly for IPCE measurements) which could lead to the formation of lead-sulfite
(PbSO3) or lead-sulfate (PbSO4).18
PbSO3 and PbSO4 are known to introduce trap
states lying below the conduction band.32
These trap states can act as
recombination centers reducing the FF of the devices. Moreover, the cross-linking
BDT molecules can also contribute to the degradation processes since dithiols tend
to form disulfides in the presence of oxygen.33
(a) (b)
(c)
Figure 4.11 Stability of key parameters (a) Jsc, b) η, c) Voc and FF) of NC solar cells based on PbS
NCs with 1.1 eV band gap
Page 13
Charge extraction from colloidal inorganic nanocrystals
70
4.3 Conclusions
In summary, we fabricated efficient PbS solar cells, showing PCE approaching
4% and FFs of 60% under AM1.5 illumination. Our results exceed the previously
reported literature record where a PCE of 3.6% and a FF of 51% were obtained.
Moreover, the effect of 2 different NC sizes on the performance and key
parameters of the devices are discussed for the first time together with peculiar
features of the device functioning.
The successful ligand exchange is evidenced by Fourier Transform Infrared
Spectroscopy (FTIR). Besides the standard characterization of the devices, a simple
physical model is used to get deeper insights into the working mechanism and
limiting factors of our solar cells. The results prove that the devices are not under
space charge limitation, since the photocurrent depends linearly on the light
intensity.
In addition, we show that the device performance is influenced by charge
trapping and the degree of this effect depends on the size of the NCs.
The reported results facilitate the understanding of the working mechanism of
PbS solar cells and demonstrate that a further improvement in the NC layer
fabrication (limiting the charge trapping) will lead to highly efficient solar cells.
4.4 Experimental
Prior to solar cell fabrication, ITO covered glass substrates were
cleaned with soap and deionised water, followed by ultrasonic treatment in acetone
and 2-isopropanol. Afterwards they were dried in an oven at 140°C for 10 minutes
in ambient conditions, followed by UV-ozone treatment for 20 minutes. The active
layer was prepared with a layer-by-layer sequential spin coating method using
5 mg/mL solutions of PbS, in chloroform and 0.02 M 1,4-BDT in acetonitrile. PbS
NCs were synthesized by hot injection method. To replace the insulating OA
ligands by 1,4-BDT, in each iteration PbS was spin coated at 4000 rpm for 1 min
followed by soaking of the PbS layer in the 1,4-BDT solution for 30 s and spin-
coating at 4000 rpm for 1 min to remove residual solution. These steps were
applied (approximately 25 times) until the desired thickness (~140 nm) was
achieved. Each iteration produces 6-7 nm of PbS film which allows to precisely
control the overall layer thickness. The devices with active area of 4 mm2 were
finished by thermal evaporation of 1 nm LiF/100 nm Al to form the cathode.
FTIR measurements were performed in vacuum with a Bruker IFS 66v/S
spectrometer equipped with a DTGS detector. All spectra were measured with a
Page 14
CHAPTER 4
71
resolution of 4 cm−1
and are averages of 4800 scans. The spectrum of a clean
silicon wafer was used as a reference. Spectra were recorded and evaluated with
the software OPUS version 4.2 (Bruker).
AFM image of the PbS-BDT active layer was recorded with a MultiMode
AFM NanoScope IV Scanning Probe Microscope Controller functioning in tapping
mode.
Current-voltage characteristics were recorded using a Keithley 2400
SourceMeter in a nitrogen filled glove-box. Measurements were performed in the
dark and under illumination from a Steuernagel SolarConstant 1200 metal halide
lamp calibrated to 1 sun intensity and corrected for spectral mismatch with the
AM1.5G spectrum using a Si reference cell. The calculated mismatch factors for
PbS (1.1 eV) and PbS (1.3 eV) in this setup amounted to 1.17 and 1.22,
respectively. Contributions to the photocurrent from regions outside the
anode/cathode overlap area were eliminated using illumination masks with slightly
smaller apertures than the device area.
Incident photon to current conversion efficiency (IPCE) spectra were measured
from 400 to 1400 nm using a custom-built setup comprising a 50 W quartz
tungsten halogen lamp (Newport Research Series) with a highly stable radiometric
power supply, 33 narrow band-pass interference filters (CVI laser), a trans-
impedance amplifier and a Stanford Research Systems SR830 lock-in amplifier.
The spectral response was measured relative to that of a calibrated Si (Newport
818-SL) and a Ge (Oriel 71653) photodiode. Layer thickness measurements were
done with a Veeco Dektak 6M profilometer.
Page 15
Charge extraction from colloidal inorganic nanocrystals
72
References
(1) Nozik, A. J. Physica E 2002, 14, 115-120.
(2) Sargent, E. H. Adv. Mater. 2008, 20, 3958-3964.
(3) Hillhouse, H. W.; Beard, M. C. Curr. Opin. Colloid Interface Sci. 2009, 14,
245-259.
(4) McDonald, S. A.; Konstantatos, G.; Zhang, S.; Cyr, P. W.; Klem, E. J. D.;
Levina, L.; Sargent, E. H. Nat. Mater. 2005, 4, 138-142.
(5) Rauch, T.; Boberl, M.; Tedde, S. F.; Furst, J.; Kovalenko, M. V.; Hesser,
G.; Lemmer, U.; Heiss, W.; Hayden, O. Nat. Photonics 2009, 3, 332-336.
(6) Szendrei, K.; Cordella, F.; Kovalenko, M. V.; Böberl, M.; Hesser, G.;
Yarema, M.; Jarzab, D.; Mikhnenko, O. V.; Gocalinska, A.; Saba, M.;
Quochi, F.; Mura, A.; Bongiovanni, G.; Blom, P. W. M.; Heiss, W.; Loi,
M. A. Adv. Mater. 2009, 21, 683-687.
(7) Alivisatos, A. P. J. Phys. Chem. 1996, 100, 13226-13239.
(8) Talapin, D. V.; Murray, C. B. Science 2005, 310, 86-89.
(9) Law, M.; Luther, J. M.; Song, Q.; Hughes, B. K.; Perkins, C. L.; Nozik, A.
J. J. Am. Chem. Soc. 2008, 130, 5974-5985.
(10) Barkhouse, D. A. R.; Pattantyus-Abraham, A. G.; Levina, L.; Sargent, E. H.
ACS Nano 2008, 2, 2356-2362.
(11) Tsang, S. W.; Fu, H.; Wang, R.; Lu, J.; Yu, K.; Tao, Y. Appl. Phys. Lett.
2009, 95, 183505.
(12) Choi, J. J.; Luria, J.; Hyun, B.-R.; Bartnik, A. C.; Sun, L.; Lim, Y.-F.;
Marohn, J. A.; Wise, F. W.; Hanrath, T. Nano Lett. 2010, 10, 1805-1811.
(13) Klem, E. J. D.; Shukla, H.; Hinds, S.; MacNeil, D. D.; Levina, L.; Sargent,
E. H. Appl. Phys. Lett. 2008, 92, 212105.
(14) Luther, J. M.; Law, M.; Beard, M. C.; Song, Q.; Reese, M. O.; Ellingson,
R. J.; Nozik, A. J. Nano Lett. 2008, 8, 3488-3492.
(15) Tang, J.; Wang, X.; Brzozowski, L.; Barkhouse, D. A. R.; Debnath, R.;
Levina, L.; Sargent, E. H. Adv. Mater. 2010, 22, 1398-1402.
(16) Debnath, R.; Tang, J.; Barkhouse, D. A.; Wang, X.; Pattantyus-Abraham,
A. G.; Brzozowski, L.; Levina, L.; Sargent, E. H. J. Am. Chem. Soc. 2010,
132, 5952-5953.
(17) Luther, J. M.; Law, M.; Song, Q.; Perkins, C. L.; Beard, M. C.; Nozik, A. J.
ACS Nano 2008, 2, 271-280.
(18) Tang, J.; Brzozowski, L.; Barkhouse, D. A. R.; Wang, X.; Debnath, R.;
Wolowiec, R.; Palmiano, E.; Levina, L.; Pattantyus-Abraham, A. G.;
Jamakosmanovic, D.; Sargent, E. H. ACS Nano 2010, 4, 869-878.
Page 16
CHAPTER 4
73
(19) Ma, W.; Luther, J. M.; Zheng, H.; Wu, Y.; Alivisatos, A. P. Nano Lett.
2009, 9, 1699-1703.
(20) Choi, J. J.; Lim, Y.-F.; Santiago-Berrios, M. B.; Oh, M.; Hyun, B.-R.; Sun,
L.; Bartnik, A. C.; Goedhart, A.; Malliaras, G. G.; Abruña, H. D.; Wise, F.
W.; Hanrath, T. Nano Lett. 2009, 9, 3749-3755.
(21) Leschkies, K. S.; Beatty, T. J.; Kang, M. S.; Norris, D. J.; Aydil, E. S. ACS
Nano 2009, 3, 3638-3648.
(22) Pattantyus-Abraham, A. G.; Kramer, I. J.; Barkhouse, A. R.; Wang, X.;
Konstantatos, G.; Debnath, R.; Levina, L.; Raabe, I.; Nazeeruddin, M. K.;
Grätzel, M.; Sargent, E. H. ACS Nano 2010, 4, 3374-3380.
(23) Tsang, S.-W.; Fu, H.; Ouyang, J.; Zhang, Y.; Yu, K.; Lu, J.; Tao, Y. Appl.
Phys. Lett. 2010, 96, 243104.
(24) Sarasqueta, G.; Choudhury, K. R.; So, F. Chem. Mater. 2010, 22, 3496-
3501.
(25) Zhao, N.; Osedach, T. P.; Chang, L.-Y.; Geyer, S. M.; Wanger, D.; Binda,
M. T.; Arango, A. C.; Bawendi, M. G.; Bulovic, V. ACS Nano 2010, 4,
3743-3752.
(26) Goodman, A. M. J. Appl. Phys. 1971, 42, 2823.
(27) Mihailetchi, V. D.; Wildeman, J.; Blom, P. W. M. Phys. Rev. Lett. 2005,
94, 126602.
(28) Sze, S. M.; Ng, K. K. Physics of Semiconductor Devices; John Wiley &
Sons, Inc.: Hoboken, NJ, USA, 2006.
(29) Koster, L. J. A.; Mihailetchi, V. D.; Ramaker, R.; Blom, P. W. M. Appl.
Phys. Lett. 2005, 86, 123509.
(30) Mandoc, M. M.; Kooistra, F. B.; Hummelen, J. C.; de Boer, B.; Blom, P.
W. M. Appl. Phys. Lett. 2007, 91, 263505.
(31) Liu, Y.; Gibbs, M.; Puthussery, J.; Gaik, S.; Ihly, R.; Hillhouse, H. W.;
Law, M. Nano Lett. 2010, 10, 1960-1969.
(32) Konstantatos, G.; Sargent, E. H. Appl. Phys. Lett. 2007, 91, 173505.
(33) Witt, D. Synthesis 2008, 2008, 2491-2509.