University of Groningen Pathways systematically associated to Hirschsprung's disease Fernandez, Raquel M.; Bleda, Marta; Luzon-Toro, Berta; Garcia-Alonso, Luz; Arnold, Stacey; Sribudiani, Yunia; Besmond, Claude; Lantieri, Francesca; Doan, Betty; Ceccherini, Isabella Published in: Orphanet journal of rare diseases DOI: 10.1186/1750-1172-8-187 IMPORTANT NOTE: You are advised to consult the publisher's version (publisher's PDF) if you wish to cite from it. Please check the document version below. Document Version Publisher's PDF, also known as Version of record Publication date: 2013 Link to publication in University of Groningen/UMCG research database Citation for published version (APA): Fernandez, R. M., Bleda, M., Luzon-Toro, B., Garcia-Alonso, L., Arnold, S., Sribudiani, Y., ... Borrego, S. (2013). Pathways systematically associated to Hirschsprung's disease. Orphanet journal of rare diseases, 8, [187]. https://doi.org/10.1186/1750-1172-8-187 Copyright Other than for strictly personal use, it is not permitted to download or to forward/distribute the text or part of it without the consent of the author(s) and/or copyright holder(s), unless the work is under an open content license (like Creative Commons). Take-down policy If you believe that this document breaches copyright please contact us providing details, and we will remove access to the work immediately and investigate your claim. Downloaded from the University of Groningen/UMCG research database (Pure): http://www.rug.nl/research/portal. For technical reasons the number of authors shown on this cover page is limited to 10 maximum. Download date: 05-07-2019
Transcript
University of Groningen
Pathways systematically associated to Hirschsprung's diseaseFernandez, Raquel M.; Bleda, Marta; Luzon-Toro, Berta; Garcia-Alonso, Luz; Arnold, Stacey;Sribudiani, Yunia; Besmond, Claude; Lantieri, Francesca; Doan, Betty; Ceccherini, IsabellaPublished in:Orphanet journal of rare diseases
DOI:10.1186/1750-1172-8-187
IMPORTANT NOTE: You are advised to consult the publisher's version (publisher's PDF) if you wish to cite fromit. Please check the document version below.
Document VersionPublisher's PDF, also known as Version of record
Publication date:2013
Link to publication in University of Groningen/UMCG research database
Citation for published version (APA):Fernandez, R. M., Bleda, M., Luzon-Toro, B., Garcia-Alonso, L., Arnold, S., Sribudiani, Y., ... Borrego, S.(2013). Pathways systematically associated to Hirschsprung's disease. Orphanet journal of rare diseases,8, [187]. https://doi.org/10.1186/1750-1172-8-187
CopyrightOther than for strictly personal use, it is not permitted to download or to forward/distribute the text or part of it without the consent of theauthor(s) and/or copyright holder(s), unless the work is under an open content license (like Creative Commons).
Take-down policyIf you believe that this document breaches copyright please contact us providing details, and we will remove access to the work immediatelyand investigate your claim.
Downloaded from the University of Groningen/UMCG research database (Pure): http://www.rug.nl/research/portal. For technical reasons thenumber of authors shown on this cover page is limited to 10 maximum.
Fernández et al. Orphanet Journal of Rare Diseases 2013, 8:187http://www.ojrd.com/content/8/1/187
RESEARCH Open Access
Pathways systematically associated toHirschsprung’s diseaseRaquel M Fernández1,2, Marta Bleda2,3, Berta Luzón-Toro1,2, Luz García-Alonso3, Stacey Arnold4, Yunia Sribudiani5,Claude Besmond6, Francesca Lantieri7, Betty Doan4, Isabella Ceccherini7, Stanislas Lyonnet6, Robert MW Hofstra5,Aravinda Chakravarti4, Guillermo Antiñolo1,2, Joaquín Dopazo2,3,8* and Salud Borrego1,2*
Abstract
Despite it has been reported that several loci are involved in Hirschsprung’s disease, the molecular basis of thedisease remains yet essentially unknown. The study of collective properties of modules of functionally-related genesprovides an efficient and sensitive statistical framework that can overcome sample size limitations in the study ofrare diseases. Here, we present the extension of a previous study of a Spanish series of HSCR trios to an internationalcohort of 162 HSCR trios to validate the generality of the underlying functional basis of the Hirschsprung’s diseasemechanisms previously found. The Pathway-Based Analysis (PBA) confirms a strong association of gene ontology (GO)modules related to signal transduction and its regulation, enteric nervous system (ENS) formation and other processesrelated to the disease. In addition, network analysis recovers sub-networks significantly associated to the disease,which contain genes related to the same functionalities, thus providing an independent validation of thesefindings. The functional profiles of association obtained for patients populations from different countries werecompared to each other. While gene associations were different at each series, the main functional associationswere identical in all the five populations. These observations would also explain the reported low reproducibilityof associations of individual disease genes across populations.
BackgroundUnlike a minority of Mendelian traits, most human dis-eases have complex, multifactorial inheritance wherethe causation resides in small allelic differences in manygenes occurring in a complex manner. For these pheno-types, onset, penetrance, recurrence risk, etc., are fea-tures not dependent on one single gene, but are ratheremergent properties of the ensemble of genotypes atmany loci [1]. A representative example of this kind oftrait is Hirschsprung’s disease (HSCR, OMIM 142623),a neurocristopathy characterized by the absence ofintramural ganglion cells in the myenteric and sub-mucosal plexuses along a variable portion of the distalintestine. Based on the length of the aganglionic region,the disorder is classified into short segment (S-HSCR:
* Correspondence: [email protected]; [email protected] for Biomedical Network Research on Rare Diseases (CIBERER),Valencia, Spain1Department of Genetics, Reproduction and Fetal Medicine, Institute ofBiomedicine of Seville (IBIS), University Hospital Virgen del Rocío/CSIC/University of Seville, Av. Manuel Siurot s/n, 41013 Seville, SpainFull list of author information is available at the end of the article
aganglionosis up to the upper sigmoid colon, 80% ofcases), long-segment (L-HSCR: aganglionosis up to thesplenic flexure and beyond, 17% of cases) and totalcolonic aganglionosis forms (TCA, 3% of cases). Themost widely accepted etiopathogenetic hypothesis forHSCR is based on a defect of craniocaudal migration ofneuroblasts originating from the neural crest that,under normal circumstances, reach the small intestinein the week 7 of gestation and the rectum in the 12thweek [2,3]. HSCR constitutes a complex pathology withnon-Mendelian inheritance, sex-dependent penetrance,variable expression and suggestive of the involvement ofone or more gene(s) with low penetrance [2,3]. With arelative risk as high as 200, HSCR can be considered anexcellent model to study common multifactorial diseases.The major HSCR predisposing event is the presence ofa haplotype at the RET proto-oncogene [4,5] (OMIM164761, 10q.11) which comprises a SNP lying in an en-hancer element of the intron 1 [2,3,6-8]. To date, severalHSCR-associated regions, such as 10q11 [9-12], 13q22[10], 9q31 [9,13], 3p21 [11,14], 19q12 [11], 16q23 [10],
tral Ltd. This is an open access article distributed under the terms of the Creativeommons.org/licenses/by/2.0), which permits unrestricted use, distribution, andiginal work is properly cited.
Fernández et al. Orphanet Journal of Rare Diseases 2013, 8:187 Page 2 of 11http://www.ojrd.com/content/8/1/187
21q21 [12], 4q31.3-q32.3 [15] or 8p12 [16], have beendescribed. Moreover, in some cases, the HSCR gene withinthe associated region has been already identified, as it isthe case of RET at 10q11, EDNRB (OMIM 131244) at13q22, or NRG1 (OMIM 142445) within 8p12 [16]. Inaddition, a very recent study based on pathways andnetworks analyses of a Spanish series of HSCR patients,described associations of four new loci (RASGEF1A,IQGAP2, DLC1 and CHRNA7) to the disease [17].Conventional gene-based association tests present
obvious limitations, especially in the context of rarediseases, where the recruitment of large cohorts ofpatients is extremely difficult. However, Pathway-basedanalysis (PBA) strategies [18-20], which allows for thedetection of modules of functionally-related genes asso-ciated to the disease, have already been successfullyapplied to the study of a number of diseases [17,21-23].The recent description of HSCR-associated functionalmodules in Spanish population [17] constitutes an excel-lent example of how a PBA strategy can be successfullyapplied to define the molecular basis of the mechanism ofthe disease. Here we have extended such approach todifferent populations of the International Consortium forHirschsprung disease (ICHSCR) which have providedsamples from France, Italy, the Netherlands and the USA.The extended study allowed us to conclude that functional
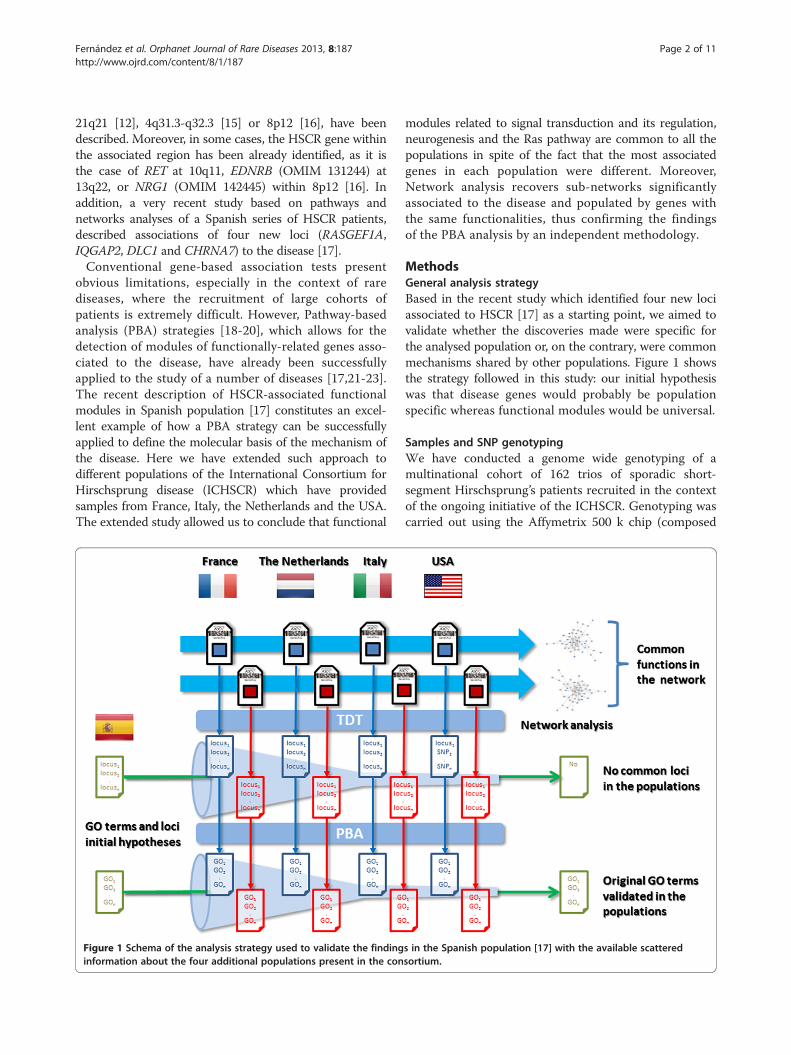
Figure 1 Schema of the analysis strategy used to validate the findinginformation about the four additional populations present in the con
modules related to signal transduction and its regulation,neurogenesis and the Ras pathway are common to all thepopulations in spite of the fact that the most associatedgenes in each population were different. Moreover,Network analysis recovers sub-networks significantlyassociated to the disease and populated by genes withthe same functionalities, thus confirming the findingsof the PBA analysis by an independent methodology.
MethodsGeneral analysis strategyBased in the recent study which identified four new lociassociated to HSCR [17] as a starting point, we aimed tovalidate whether the discoveries made were specific forthe analysed population or, on the contrary, were commonmechanisms shared by other populations. Figure 1 showsthe strategy followed in this study: our initial hypothesiswas that disease genes would probably be populationspecific whereas functional modules would be universal.
Samples and SNP genotypingWe have conducted a genome wide genotyping of amultinational cohort of 162 trios of sporadic short-segment Hirschsprung’s patients recruited in the contextof the ongoing initiative of the ICHSCR. Genotyping wascarried out using the Affymetrix 500 k chip (composed
s in the Spanish population [17] with the available scatteredsortium.
Fernández et al. Orphanet Journal of Rare Diseases 2013, 8:187 Page 3 of 11http://www.ojrd.com/content/8/1/187
of the 250 k Nsp and the 250 k Sty chips) (Table 1).Given that not all the trios were simultaneously genotypedwith both chips yet (only 26 of them), we considered twoindependent measurements, one for each chip (Sty andNsp, with 97 and 91 trios, respectively), of the samplesanalyzed. Quality controls were as follows: SNPs miss-ing in more than 20% of the samples in the callingprocess, SNPs with MAF < 0.5%, with Mendelian errorsor not in Hardy-Weinberg equilibrium (in unaffectedsamples; p-value < 10-5) and samples with more than 5%of the SNPs missing were discarded. Finally, incompletefamilies (trios) were also discarded. Additional file 1:Table S1 summarizes the effects of the different steps ofthe quality control.
Pathway-based analysisWe conducted a Transmission Disequilibrium Test (TDT)association analysis as implemented in the PLINK [24]software for the different sets of trios analyzed (seeFigure 1).The SNPs were ranked according to their p-values
obtained in the TDT test and then a PBA test [18], as im-plemented in the GESBAP [25] module of the Babelomics[26] software, was conducted. PBA seeks for gene sets(GO terms in this study) associated to low p-values. Thisassociation is found significant when a number of genes ofthe GO term, larger than expected by chance, simultan-eously display low (although not necessarily significant)individual p-values [18]. Given that only genes can berelated to GO terms, PBA tests use only SNPs mappingon genes, or in the close neighborhood, here defined as500 bps up-and downstream of the gene limits. Whenmultiple SNPs map onto the same gene, the SNP withlowest (most significant) p-value is retained. In this way alist of genes ranked by the best of the p-values of all theSNPs mapping onto them is constructed. Then, GO termssignificantly overrepresented among the genes associatedto low p-values are found upon the application of a logisticregression. GO terms are declared significantly associatedto HSCR when a number of its genes, larger than expectedpurely by chance, display a low p-value (i.e., are on the topof the list ranked by significance). To control the number
Table 1 Available trios for any of the chips distributedamong the five country populations analyzed
Chip France Italy USA Netherlands Total
Nsp 15 20 25 37 97
Sty 16 18 25 32 91
Nsp + Sty 5 1 9 11 26
Total trios 26 37 41 58 162
First and second rows refer to the trios genotyped with each specific chip(Nsp or Sty). Third file contains the trios simultaneously genotyped with bothchips (Nsp + Sty). Forth row is the total number of trios used in the study foreach population.
of false positives due to multiple-testing effects, only GOterms with a FDR-adjusted [27] p-value < 0.05 are declaredsignificant. The adjustment process takes into accountthat four populations and two chips have been tested,so all the individual tests were considered here. This isa widely accepted method for correcting p-values thataccount for multiple testing by controlling the rate offalse discoveries. By default the GESBAP software onlyanalyses GO terms between levels 3 and 13 of the GOhierarchy and exclude GO terms with more than 600genes or with less than 5 genes. In this way GO termswhich are either too specific or too unspecific, and onlycontribute to the decrease of the statistical power ofthe test, are avoided.
Network analysisLike in the PBA approach, a list of genes ranked fromlow to high p-values is explored in order to discoversubnets with connectivity values higher than expectedby chance. Briefly, the N (10 in this case) most signifi-cant genes are mapped onto the interactome and theminimum network connecting them is obtained. Theconnectivity of such sub-network is calculated as theaverage of all the individual connectivity values of allthe connected genes. The connectivity parameter ac-counts for the number of partners of direct interactionthat a particular node has. An empirical distribution ofthe random expectation of this parameter can be ob-tained by repeatedly sampling random sets of N genesfrom the complete genome and calculating the averageconnectivity of their corresponding minimum con-necting trees. Thus, the real value obtained for the Nmost associated genes can be contrasted with respectto its random empirical expectation. If the connectiv-ity is not significantly higher than its random expect-ation we repeat the procedure for the N + 1 mostsignificant genes. The procedure is repeated until asub-network of significant connectivity is found or avalue of N too high is reached (200 in this case). Thisprocedure [28] is a generalization of the network ana-lysis methodology applied to the study of networkscontained in gene expression signatures [29,30]. Animplementation of the procedure can be found in theBabelomics package [26].
ENCODE information for extra Genic SNPsExtra genic SNPs have been used to find extra supportfor the functionalities found as associated to HSCR. Wehave used the HaploReg [31] tool to retrieve the relevantinformation from the ENCODE project [32] correspond-ing to the chromosomal regions in which significantextra-genic SNPs map.
Fernández et al. Orphanet Journal of Rare Diseases 2013, 8:187 Page 4 of 11http://www.ojrd.com/content/8/1/187
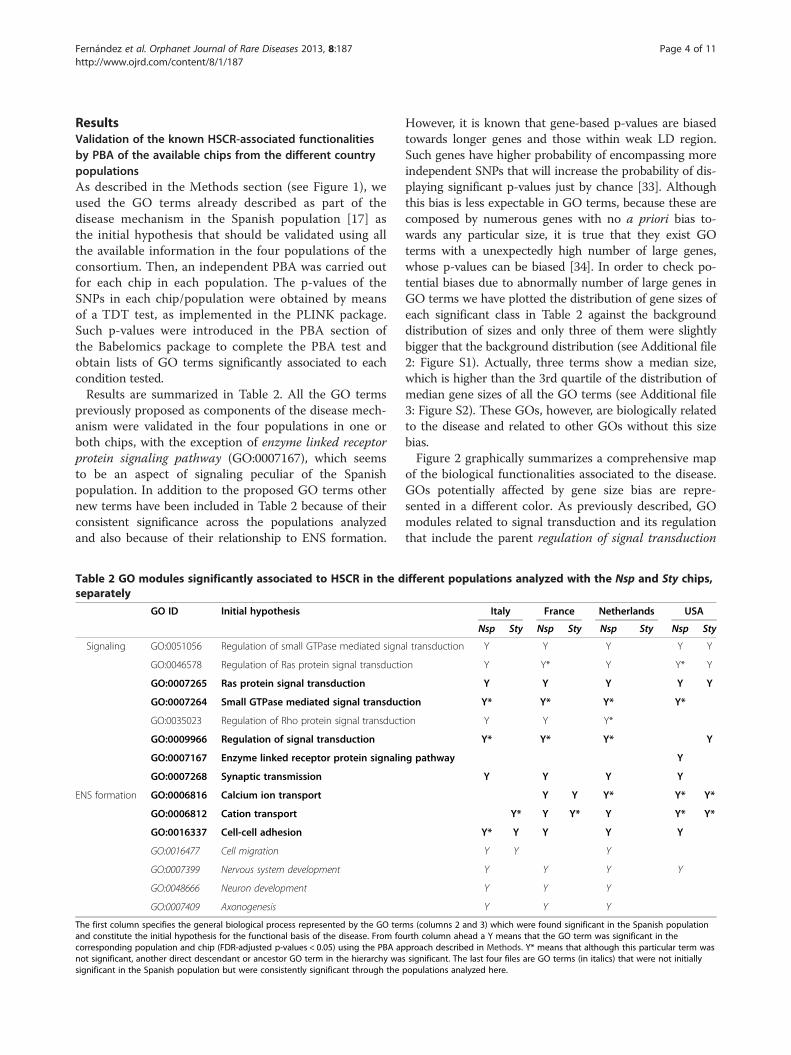
ResultsValidation of the known HSCR-associated functionalitiesby PBA of the available chips from the different countrypopulationsAs described in the Methods section (see Figure 1), weused the GO terms already described as part of thedisease mechanism in the Spanish population [17] asthe initial hypothesis that should be validated using allthe available information in the four populations of theconsortium. Then, an independent PBA was carried outfor each chip in each population. The p-values of theSNPs in each chip/population were obtained by meansof a TDT test, as implemented in the PLINK package.Such p-values were introduced in the PBA section ofthe Babelomics package to complete the PBA test andobtain lists of GO terms significantly associated to eachcondition tested.Results are summarized in Table 2. All the GO terms
previously proposed as components of the disease mech-anism were validated in the four populations in one orboth chips, with the exception of enzyme linked receptorprotein signaling pathway (GO:0007167), which seemsto be an aspect of signaling peculiar of the Spanishpopulation. In addition to the proposed GO terms othernew terms have been included in Table 2 because of theirconsistent significance across the populations analyzedand also because of their relationship to ENS formation.
Table 2 GO modules significantly associated to HSCR in the dseparately
GO ID Initial hypothesis
Signaling GO:0051056 Regulation of small GTPase mediated signa
GO:0046578 Regulation of Ras protein signal transducti
GO:0007265 Ras protein signal transduction
GO:0007264 Small GTPase mediated signal transduc
GO:0035023 Regulation of Rho protein signal transduct
GO:0009966 Regulation of signal transduction
GO:0007167 Enzyme linked receptor protein signalin
GO:0007268 Synaptic transmission
ENS formation GO:0006816 Calcium ion transport
GO:0006812 Cation transport
GO:0016337 Cell-cell adhesion
GO:0016477 Cell migration
GO:0007399 Nervous system development
GO:0048666 Neuron development
GO:0007409 Axonogenesis
The first column specifies the general biological process represented by the GO terand constitute the initial hypothesis for the functional basis of the disease. From focorresponding population and chip (FDR-adjusted p-values < 0.05) using the PBA apnot significant, another direct descendant or ancestor GO term in the hierarchy wasignificant in the Spanish population but were consistently significant through the
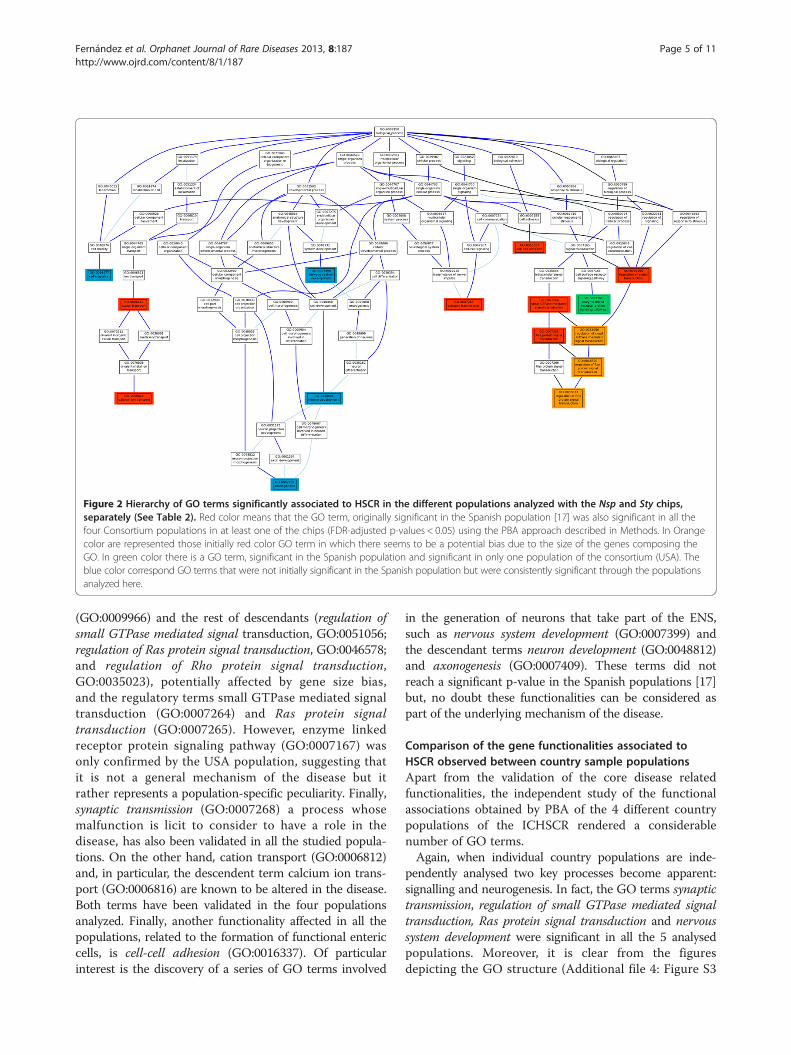
However, it is known that gene-based p-values are biasedtowards longer genes and those within weak LD region.Such genes have higher probability of encompassing moreindependent SNPs that will increase the probability of dis-playing significant p-values just by chance [33]. Althoughthis bias is less expectable in GO terms, because these arecomposed by numerous genes with no a priori bias to-wards any particular size, it is true that they exist GOterms with a unexpectedly high number of large genes,whose p-values can be biased [34]. In order to check po-tential biases due to abnormally number of large genes inGO terms we have plotted the distribution of gene sizes ofeach significant class in Table 2 against the backgrounddistribution of sizes and only three of them were slightlybigger that the background distribution (see Additional file2: Figure S1). Actually, three terms show a median size,which is higher than the 3rd quartile of the distribution ofmedian gene sizes of all the GO terms (see Additional file3: Figure S2). These GOs, however, are biologically relatedto the disease and related to other GOs without this sizebias.Figure 2 graphically summarizes a comprehensive map
of the biological functionalities associated to the disease.GOs potentially affected by gene size bias are repre-sented in a different color. As previously described, GOmodules related to signal transduction and its regulationthat include the parent regulation of signal transduction
ifferent populations analyzed with the Nsp and Sty chips,
Italy France Netherlands USA
Nsp Sty Nsp Sty Nsp Sty Nsp Sty
l transduction Y Y Y Y Y
on Y Y* Y Y* Y
Y Y Y Y Y
tion Y* Y* Y* Y*
ion Y Y Y*
Y* Y* Y* Y
g pathway Y
Y Y Y Y
Y Y Y* Y* Y*
Y* Y Y* Y Y* Y*
Y* Y Y Y Y
Y Y Y
Y Y Y Y
Y Y Y
Y Y Y
ms (columns 2 and 3) which were found significant in the Spanish populationurth column ahead a Y means that the GO term was significant in theproach described in Methods. Y* means that although this particular term wass significant. The last four files are GO terms (in italics) that were not initiallypopulations analyzed here.
Figure 2 Hierarchy of GO terms significantly associated to HSCR in the different populations analyzed with the Nsp and Sty chips,separately (See Table 2). Red color means that the GO term, originally significant in the Spanish population [17] was also significant in all thefour Consortium populations in at least one of the chips (FDR-adjusted p-values < 0.05) using the PBA approach described in Methods. In Orangecolor are represented those initially red color GO term in which there seems to be a potential bias due to the size of the genes composing theGO. In green color there is a GO term, significant in the Spanish population and significant in only one population of the consortium (USA). Theblue color correspond GO terms that were not initially significant in the Spanish population but were consistently significant through the populationsanalyzed here.
Fernández et al. Orphanet Journal of Rare Diseases 2013, 8:187 Page 5 of 11http://www.ojrd.com/content/8/1/187
(GO:0009966) and the rest of descendants (regulation ofsmall GTPase mediated signal transduction, GO:0051056;regulation of Ras protein signal transduction, GO:0046578;and regulation of Rho protein signal transduction,GO:0035023), potentially affected by gene size bias,and the regulatory terms small GTPase mediated signaltransduction (GO:0007264) and Ras protein signaltransduction (GO:0007265). However, enzyme linkedreceptor protein signaling pathway (GO:0007167) wasonly confirmed by the USA population, suggesting thatit is not a general mechanism of the disease but itrather represents a population-specific peculiarity. Finally,synaptic transmission (GO:0007268) a process whosemalfunction is licit to consider to have a role in thedisease, has also been validated in all the studied popula-tions. On the other hand, cation transport (GO:0006812)and, in particular, the descendent term calcium ion trans-port (GO:0006816) are known to be altered in the disease.Both terms have been validated in the four populationsanalyzed. Finally, another functionality affected in all thepopulations, related to the formation of functional entericcells, is cell-cell adhesion (GO:0016337). Of particularinterest is the discovery of a series of GO terms involved
in the generation of neurons that take part of the ENS,such as nervous system development (GO:0007399) andthe descendant terms neuron development (GO:0048812)and axonogenesis (GO:0007409). These terms did notreach a significant p-value in the Spanish populations [17]but, no doubt these functionalities can be considered aspart of the underlying mechanism of the disease.
Comparison of the gene functionalities associated toHSCR observed between country sample populationsApart from the validation of the core disease relatedfunctionalities, the independent study of the functionalassociations obtained by PBA of the 4 different countrypopulations of the ICHSCR rendered a considerablenumber of GO terms.Again, when individual country populations are inde-
pendently analysed two key processes become apparent:signalling and neurogenesis. In fact, the GO terms synaptictransmission, regulation of small GTPase mediated signaltransduction, Ras protein signal transduction and nervoussystem development were significant in all the 5 analysedpopulations. Moreover, it is clear from the figuresdepicting the GO structure (Additional file 4: Figure S3
Fernández et al. Orphanet Journal of Rare Diseases 2013, 8:187 Page 6 of 11http://www.ojrd.com/content/8/1/187
and Additional file 5: Figure S4) that a relevant numberof GO subcategories not shared by all the countrypopulations actually belong to three main branches:nervous system development, signal transduction andcell migration. Additional file 6: Table S2 and Additionalfile 7: Table S3 show a total of 49 and 29 GO modules,respectively, significantly associated to HSCR found inthe analysis individualized by population in any of thetwo chips. Additional file 4: Figure S3 and Additionalfile 5: Figure S4 show how all these modules are inter-related among them. For example, terms like axonogenesis,neuron development, neuron differentiation, generation ofneurons, are all descendants of neurogenesis, which isitself, a descendant of nervous system development.Cell-cell adhesion is also a parent term of many otherGO terms related with the formation of functional en-teric cells. And there is also the case of other processeswhose malfunction is relevant in the disease, such assynaptic transmission, the transport of several substances(cation transport or phospholipid transport) or differentsignalling-related functions, including the well-knownRAS/RHO intracellular signalling pathway.In order to know if the GO module associations found
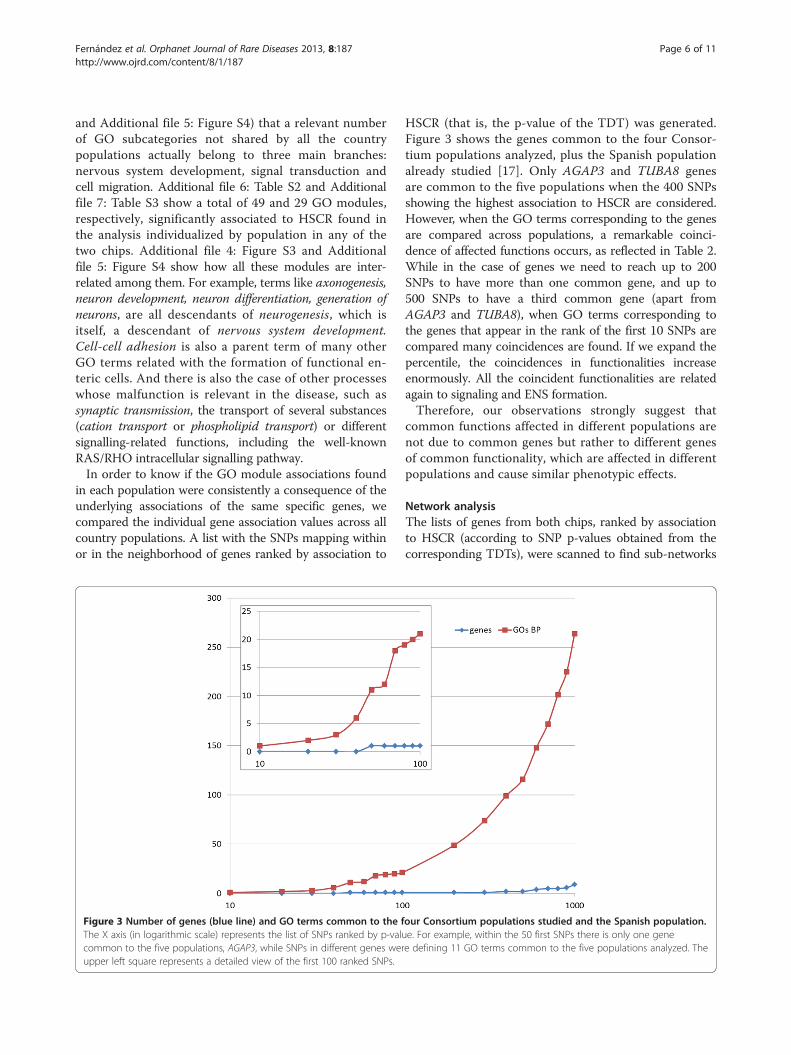
in each population were consistently a consequence of theunderlying associations of the same specific genes, wecompared the individual gene association values across allcountry populations. A list with the SNPs mapping withinor in the neighborhood of genes ranked by association to
Figure 3 Number of genes (blue line) and GO terms common to the fThe X axis (in logarithmic scale) represents the list of SNPs ranked by p-valucommon to the five populations, AGAP3, while SNPs in different genes werupper left square represents a detailed view of the first 100 ranked SNPs.
HSCR (that is, the p-value of the TDT) was generated.Figure 3 shows the genes common to the four Consor-tium populations analyzed, plus the Spanish populationalready studied [17]. Only AGAP3 and TUBA8 genesare common to the five populations when the 400 SNPsshowing the highest association to HSCR are considered.However, when the GO terms corresponding to the genesare compared across populations, a remarkable coinci-dence of affected functions occurs, as reflected in Table 2.While in the case of genes we need to reach up to 200SNPs to have more than one common gene, and up to500 SNPs to have a third common gene (apart fromAGAP3 and TUBA8), when GO terms corresponding tothe genes that appear in the rank of the first 10 SNPs arecompared many coincidences are found. If we expand thepercentile, the coincidences in functionalities increaseenormously. All the coincident functionalities are relatedagain to signaling and ENS formation.Therefore, our observations strongly suggest that
common functions affected in different populations arenot due to common genes but rather to different genesof common functionality, which are affected in differentpopulations and cause similar phenotypic effects.
Network analysisThe lists of genes from both chips, ranked by associationto HSCR (according to SNP p-values obtained from thecorresponding TDTs), were scanned to find sub-networks
our Consortium populations studied and the Spanish population.e. For example, within the 50 first SNPs there is only one genee defining 11 GO terms common to the five populations analyzed. The
Fernández et al. Orphanet Journal of Rare Diseases 2013, 8:187 Page 7 of 11http://www.ojrd.com/content/8/1/187
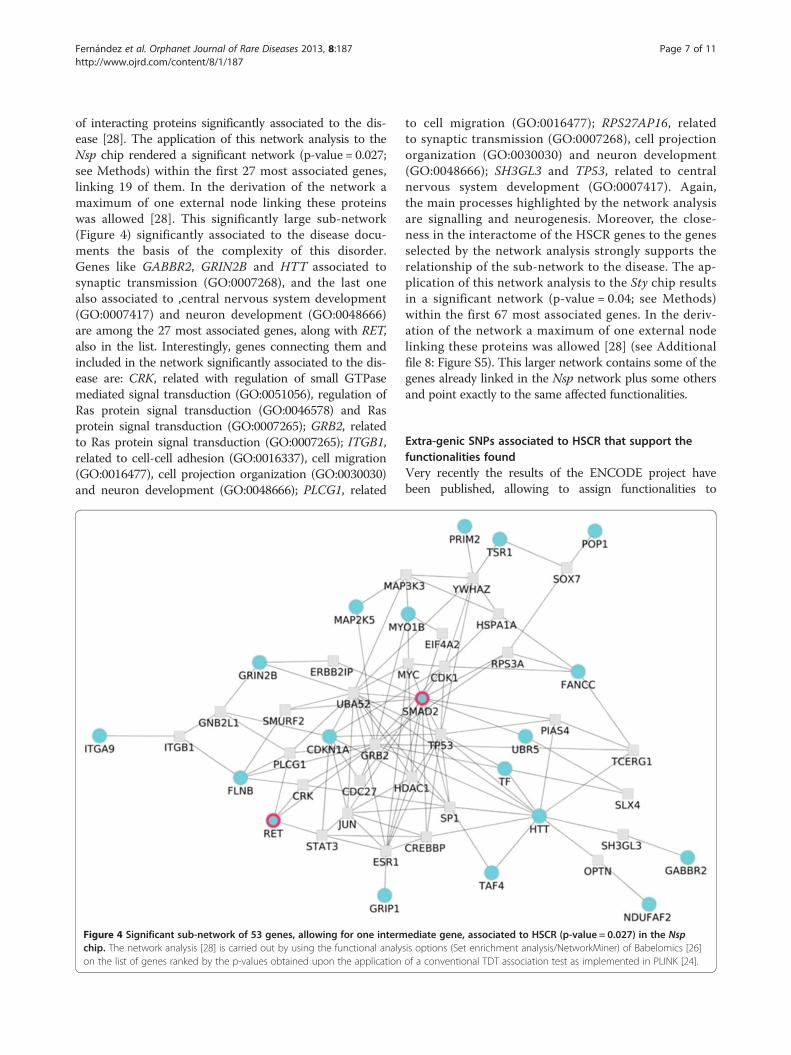
of interacting proteins significantly associated to the dis-ease [28]. The application of this network analysis to theNsp chip rendered a significant network (p-value = 0.027;see Methods) within the first 27 most associated genes,linking 19 of them. In the derivation of the network amaximum of one external node linking these proteinswas allowed [28]. This significantly large sub-network(Figure 4) significantly associated to the disease docu-ments the basis of the complexity of this disorder.Genes like GABBR2, GRIN2B and HTT associated tosynaptic transmission (GO:0007268), and the last onealso associated to ,central nervous system development(GO:0007417) and neuron development (GO:0048666)are among the 27 most associated genes, along with RET,also in the list. Interestingly, genes connecting them andincluded in the network significantly associated to the dis-ease are: CRK, related with regulation of small GTPasemediated signal transduction (GO:0051056), regulation ofRas protein signal transduction (GO:0046578) and Rasprotein signal transduction (GO:0007265); GRB2, relatedto Ras protein signal transduction (GO:0007265); ITGB1,related to cell-cell adhesion (GO:0016337), cell migration(GO:0016477), cell projection organization (GO:0030030)and neuron development (GO:0048666); PLCG1, related
Figure 4 Significant sub-network of 53 genes, allowing for one intermchip. The network analysis [28] is carried out by using the functional analyon the list of genes ranked by the p-values obtained upon the application
to cell migration (GO:0016477); RPS27AP16, relatedto synaptic transmission (GO:0007268), cell projectionorganization (GO:0030030) and neuron development(GO:0048666); SH3GL3 and TP53, related to centralnervous system development (GO:0007417). Again,the main processes highlighted by the network analysisare signalling and neurogenesis. Moreover, the close-ness in the interactome of the HSCR genes to the genesselected by the network analysis strongly supports therelationship of the sub-network to the disease. The ap-plication of this network analysis to the Sty chip resultsin a significant network (p-value = 0.04; see Methods)within the first 67 most associated genes. In the deriv-ation of the network a maximum of one external nodelinking these proteins was allowed [28] (see Additionalfile 8: Figure S5). This larger network contains some of thegenes already linked in the Nsp network plus some othersand point exactly to the same affected functionalities.
Extra-genic SNPs associated to HSCR that support thefunctionalities foundVery recently the results of the ENCODE project havebeen published, allowing to assign functionalities to
ediate gene, associated to HSCR (p-value = 0.027) in the Nspsis options (Set enrichment analysis/NetworkMiner) of Babelomics [26]of a conventional TDT association test as implemented in PLINK [24].
Fernández et al. Orphanet Journal of Rare Diseases 2013, 8:187 Page 8 of 11http://www.ojrd.com/content/8/1/187
regions in which some extra-genic SNPs associated toHSCR were found to map. Table 3 lists six extra-genicSNPs with a nominal p-value < 10-5 obtained for each chipanalyzing all the trios together, for which some annota-tion has been found. Thus, rs2435367, one of the SNPswith a lowest p-value, is mapping in a DNAse hypersen-sitivity region, typically related to gene expression, closeto the 5′ of RET. The SNP rs2505526 (p-value =8.353×10⁻⁷), changes a transcription factor binding site(TFBS), Pax-4, close to the RASGEF1A gene, related tosignal transduction (particularly the Ras pathway) andENS formation. The SNP rs16838932 (p-value = 4.459×10⁻⁷) maps in a ultraconserved [35] region and it is difficultto speculate any relation with the disease by itself orthrough the closest gene, SLC39A10. The SNPrs2659635 (p-value = 7.098×10⁻⁶) maps in a TFBS,Foxj2, in an ultraconserved [35,36] genomic region. TheSNP rs4570660 (p-value = 7.744×10⁻⁶) maps in a DNAsehypersensitive region and, within it, in the binding siteof the transcription factor Sox. Several Sox transcriptionfactors have been linked to neural crest evolution and de-velopment [37]. Finally, rs12067906 (p-value = 9.584×10⁻⁶)also maps in a DNAse hypersensitive region and onto twoTFBS (corresponding to Gfi1 and HLF, both related toleukemia and several related pathologies). In addition, thissite is bound by the protein RAD21, involved in DNArepair.
DiscussionUnderstanding the molecular and cellular processesrequired for proper ENS development, and therefore thecorresponding defects that lead to HSCR, requires of theknowledge of the functionalities affected by the genesaffected in the disease.The PBA strategy has already been successfully applied
to the study of some traits such as coronary heart diseaserisk [21], bipolar disorder [22], Crohn’s disease, hyperten-sion, rheumatoid arthritis or diabetes among others [23].These studies led to the identification of numerous path-ways implicated in disease predisposition that would havenot been revealed using standard single-locus GWAS
Table 3 Extra-genic SNPs with a nominal p-value < 10-5 mapp
SNP Nominal p-value Adj. p-value (BH) Chip RefSeq gene
rs2435367 8.067×10⁻¹¹ 2.2083×10-06 Sty 5.9 kb 5′ of RE
rs2505526 8.353×10-07 0.01506847 Sty 7.5 kb 3′ of RASG
rs4570660 7.744×10-06 0,08479448 Sty 65 kb 3′ of APO
rs12067906 9.584×10-06 0,09994469 Sty 96 kb 5′ of RG
In this case all the trios have been analysed together for each chip.
statistical analysis criteria. Many of such pathways hadlong been assumed to contain polymorphic genes thatlead to disease predisposition. The same conclusionscan be extracted from our results that reveal a clear asso-ciation of GO terms connected to Ras signalling, widelyknown as a pathway with a key role in ENS formation.Regarding network analysis, it exploits the information
contained in the interactome with the idea that proteinsclose in the interaction network will have a higher probabil-ity of causing the same disease and constitutes a powerfultechnique to detect gene-disease associations. Networkanalysis has been successfully applied to discover genes indifferent diseases, such as ataxias [38], Huntington disease[39], schizophrenia [40] or Alzheimer’s [41]. Therefore weconsidered it a really useful tool to be applied to the resultsderived from the multinational GWAS in the context ofHSCR.The recent description of HSCR-associated functional
modules in Spanish population [17] constitutes an excel-lent initial functional hypothesis of the molecular mech-anism of HSCR. We have used all the data available ofan international cohort of 162 trios of short-segmentHirschsprung’s disease to carry out a multi-populationPBA study that validate the initial functional hypothesis.Specifically, our study has led us to the confirmation ofa spectrum of different GOs related to the disease, beingof special interest those terms related to signal transduc-tion, such as the ones connected to Ras signaling. The Raspathway is known to be one of the intracellular signalingmediated by the RET receptor, and is involved in cellsurvival and proliferation, both of them key biologicalprocesses related to ENS formation [42]. Thus, in spiteof some apparent bias due to the size of the genes inthese GO terms, there are solid biological basis for theinvolvement of such pathways in the disease. Inaddition, previous studies have demonstrated that sig-naling through the small Rho GTPases is also importantfor colonization of the gut by enteric neural crest cellsand the concomitant growth of axons [42]. These resultsstrongly suggest that members of the Ras/Rho protein sig-nal transduction or regulators may play a key role in the
ing in regions recently annotated in ENCODE [32]
s Feature Proteins bound Motifs changed
T DNAse hypersensitivity
EF1A Pax-4
Ultraconserved region [35]
Ultraconserved region[35,36]
Foxj2
BEC1 DNAse hypersensitivity Sox
S21 DNAse hypersensitivity RAD21 Gfi1, HLF
Fernández et al. Orphanet Journal of Rare Diseases 2013, 8:187 Page 9 of 11http://www.ojrd.com/content/8/1/187
pathogenesis of HSCR (Figure 2). Previous studies haveproposed some specific genes included in these GOs aspotential candidate genes for HSCR. For instance, it hasbeen shown an under-expression of the gene Arhgef3 inmice deficient for RET when compared to wildtype mice,which suggests its role in ENS formation. Interestingly,the human homologue for this gene, ARHGEF3, maps to3p14, a chromosomal region previously described as a sus-ceptibility locus for HSCR [11,43], although to date itscandidature has not been further evaluated. On the otherhand, migration of enteric neural crest cells in the gut wallduring embryogenesis requires interactions between themigrating neural crest cells and the extracellular matrix(ECM) environment in different regions of the developinggut. It implies a key role of cell migration during entericnervous system formation, and would support the associ-ation to HSCR obtained for several related GO terms.Therefore, all these associated GOs might provide poten-tial candidate genes implicated in ENS formation and alsothe pathogenesis of HSCR.Our findings clearly show that, while the genes most
associated to HSCR are essentially different in the fiveanalyzed populations, gene modules with common func-tions (GO terms) are the same. Thus, the comparativeanalysis of the populations is revealing two importantfacts: a) the GO biological processes significantly associ-ated to the disease in the different series of the ICHSCRstrongly suggest that HSCR is caused in the differentpopulations by different particular genes belonging to thesame (or related) GO modules and b) such gene modulescarry out biological functions that can be assimilated(using the GO hierarchy) to neurogenesis and signaling.The network analysis also points to the same processes. Inother words, although we cannot exclude the existence ofsome causative genes common to all the populations,which still remain undetected, our results rather point to ascenario in which HSCR is the result of different genescausing approximately the same phenotypic effects indifferent populations.Additionally, the observations made with the extra-
genic SNPs suggest other possible disease mechanismsfor HSCR more related to regulation or DNA instability.Some of these SNPs were markers of DNA hypersensi-tivity regions in the neighborhood of genes such as RETand, moreover, some of them directly point to TFBSs.One of the SNPs was pointing out a region of binding ofa protein involved in DNA repair.
ConclusionsIndependent evidences obtained from common genefunctionality and from physical protein-protein interac-tions point to HSCR as a disease caused by variants ingenes belonging to some GO modules related to neuro-genesis, in particular within the context of ENS formation,
and signaling. Moreover, the analysis of extra-genic SNPsin a functional context provided by the recent publicationof the results of the ENCODE project [32] provides add-itional evidences in this direction. Interestingly, while thegene associations were different across populations the af-fected functionalities were always the same. This suggeststhat the known difficulty in validating genes in differentpopulations [1,44,45] could be more a consequence of themultigenic nature of the disease that a sampling problem.In this scenario, the low percentage of the variance oftraits explained by individual genes [46] is an obvious con-sequence of the fact that many complex diseases are theresult of different combinations of variants that occur indifferent populations just by founder effects. Such differentsets of variants collectively cause a malfunction of parti-cular functional modules, which constitute the ultimatecause of the disease.In summary, this comprehensive profile of functional
modules (GO) has proven to be a useful resource for fu-ture developmental, biochemical and genetic studies. Ourfindings indicate that this approach can help to identifycandidate genes for human disease susceptibility loci. Be-yond technical considerations on the advantages of usingfunctional modules in the analysis of genotype data, thebiological pathways highlighted by our study provideinsights into the complex nature of HSCR, opens newopportunities for validation of new disease genes andmay help in the definition of relatively tractable targetsfor therapeutic intervention.One known limitation of function-based approaches is
that variants not mapping within or close to genomic ele-ments with a functional annotation remain unused in thestudy. However, the recent availability of new functionaldomains provided by the ENCODE consortium will allowthe extension of theses function-based studies (PBA, net-work analysis, etc.) beyond the conventional studies basedon genes or known regulatory elements such as miRNAs.
Additional files
Additional file 1: Table S1. Summary of the effects of the differentsteps of the quality control.
Additional file 2: Figure S1. Gene length distribution of gene lengthswithin GO terms. Significant GO terms from Table 2 are plotted in blue.The background distribution of gene lengths in the rest ofnon-significant GO terms is represented in yellow.
Additional file 3: Figure S2. Boxplots of gene length distribution ofgene lengths within GO terms. The first boxplot on the left, in yellow,represents the distribution of genes in all the non-significant GO terms.The rest of boxplots in blue correspond to the significant GO terms fromTable 2.
Additional file 4: Figure S3. Tree hierarchy depicting the relationshipsbetween GO terms significantly associated to HSCR (FDR adjustedp-value < 0.05) using the PBA [25] as implemented in Babelomics [26] inthe four country populations of the Consortium: French, Italian, Dutchand USA for the Nsp chip. The results previously obtained for the Spanish
Fernández et al. Orphanet Journal of Rare Diseases 2013, 8:187 Page 10 of 11http://www.ojrd.com/content/8/1/187
population [17] have also been added. Significant terms have beencolor-coded according the number of populations in which the GO termswas found to be significant. The darkest values corresponds to GO termssignificant in five populations and the palest in only one population (seeAdditional file 6: Table S2).
Additional file 5: Figure S4. Tree hierarchy depicting the relationshipsbetween GO terms significantly associated to HSCR (FDR adjustedp-value < 0.05) using the PBA [25] as implemented in Babelomics [26] inthe four country populations of the Consortium: French, Italian, Dutchand USA for the Sty chip. The results previously obtained for the Spanishpopulation [17] have also been added. Significant terms have beencolor-coded according the number of populations in which the GO termswas found to be significant. The darkest values corresponds to GO termssignificant in two populations and the palest in only one population (seeAdditional file 7: Table S3).
Additional file 6: Table S2. GO modules significantly associated toHSCR (FDR adjusted p-value < 0.05) using the PBA [25] as implemented inBabelomics [26] found in the analysis individualized by population in theNsp chip.
Additional file 7: Table S3. GO modules significantly associated toHSCR (FDR adjusted p-value < 0.05) using the PBA [25] as implemented inBabelomics [26] found in the analysis individualized by population in theSty chip.
Additional file 8: Figure S5. Significant sub-network of 65 genes,allowing for one intermediate gene, associated to HSCR (p-value = 0.04)in the Sty chip. The network analysis [28] is carried out by using thefunctional analysis options (Set enrichment analysis/NetworkMiner) ofBabelomics [26] on the list of genes ranked by the p-values obtainedupon the application of a conventional TDT association test asimplemented in PLINK [24].
Competing interestsThe authors declare that they have no competing interests.
Authors’ contributionsRMF, BL-T, SB, GA and JD drafted the manuscript. SA, YS, CB, FL, BD, IC, SL,RMWH, AC produced the ICHSCR data. MB and LGA carried out the PBA andthe network analyses. JD conceived and coordinated the data analysis. SBconceived the study and coordinated all the laboratory tasks. All authors readand approved the final manuscript.
AcknowledgementsThis work was supported by the Instituto de Salud Carlos III (ISCIII), SpanishMinistry of Economy and Competitiveness, Spain (PI1001290); SpanishMinistry of Economy and Competitiveness (BIO2011-27069), GVA-FEDER(PROMETEO/2010/001) and Consejeria de Innovación Ciencia y Empresa dela Junta de Andalucia (CTS-7447). The CIBER de Enfermedades Raras is an ini-tiative of the ISCIII, Spanish Ministry of Economy and Competitiveness.LG-A is supported by fellowship PFIS FI10/00020 from the ISCIII.
Author details1Department of Genetics, Reproduction and Fetal Medicine, Institute ofBiomedicine of Seville (IBIS), University Hospital Virgen del Rocío/CSIC/University of Seville, Av. Manuel Siurot s/n, 41013 Seville, Spain. 2Centre forBiomedical Network Research on Rare Diseases (CIBERER), Valencia, Spain.3Department of Computational Genomics, Centro de Investigación PríncipeFelipe (CIPF), c/Eduardo Primo Yufera, 3, 46012 Valencia, Spain. 4Center forComplex Disease Genomics, McKusick-Nathans Institute of Genetic Medicine,Johns Hopkins University School of Medicine, Baltimore, MD, USA.5Department of Medical Genetics, University of Groningen, Groningen, TheNetherlands. 6INSERM U-781, AP-HP Hôpital Necker-Enfants Malades, Paris,
France. 7Laboratorio di Genetica Molecolare, Istituto Gaslini, Genova, Italy.8Functional Genomics Node (INB), CIPF, Valencia, Spain.
Received: 23 May 2013 Accepted: 19 November 2013Published: 2 December 2013
McCarthy MI, Ramos EM, Cardon LR, Chakravarti A, et al: Finding themissing heritability of complex diseases. Nature 2009, 461:747–753.
2. Amiel J, Sproat-Emison E, Garcia-Barcelo M, Lantieri F, Burzynski G, Borrego S,Pelet A, Arnold S, Miao X, Griseri P, et al: Hirschsprung disease, associatedsyndromes and genetics: a review. J Med Genet 2008, 45:1–14.
3. Borrego S, Ruiz-Ferrer M, Fernandez RM, Antinolo G: Hirschsprung’s diseaseas a model of complex genetic etiology. Histol Histopathol 2013,28:1117–1136.
4. Borrego S, Wright FA, Fernandez RM, Williams N, Lopez-Alonso M, DavuluriR, Antinolo G, Eng C: A founding locus within the RET proto-oncogenemay account for a large proportion of apparently sporadic Hirschsprungdisease and a subset of cases of sporadic medullary thyroid carcinoma.Am J Hum Genet 2003, 72:88–100.
5. Borrego S, Ruiz A, Saez ME, Gimm O, Gao X, Lopez-Alonso M, Hernandez A,Wright FA, Antinolo G, Eng C: RET genotypes comprising specific haplotypesof polymorphic variants predispose to isolated Hirschsprung disease. J MedGenet 2000, 37:572–578.
6. Emison ES, Garcia-Barcelo M, Grice EA, Lantieri F, Amiel J, Burzynski G,Fernandez RM, Hao L, Kashuk C, West K, et al: Differential contributions ofrare and common, coding and noncoding Ret mutations to multifactorialHirschsprung disease liability. Am J Hum Genet 2010, 87:60–74.
7. Emison ES, McCallion AS, Kashuk CS, Bush RT, Grice E, Lin S, Portnoy ME,Cutler DJ, Green ED, Chakravarti A: A common sex-dependent mutation ina RET enhancer underlies Hirschsprung disease risk. Nature 2005,434:857–863.
8. Fernandez RM, Boru G, Pecina A, Jones K, Lopez-Alonso M, Antinolo G,Borrego S, Eng C: Ancestral RET haplotype associated with Hirschsprung’sdisease shows linkage disequilibrium breakpoint at −1249. J Med Genet2005, 42:322–327.
9. Bolk S, Pelet A, Hofstra RM, Angrist M, Salomon R, Croaker D, Buys CH,Lyonnet S, Chakravarti A: A human model for multigenic inheritance:phenotypic expression in Hirschsprung disease requires both the RETgene and a new 9q31 locus. Proc Natl Acad Sci U S A 2000, 97:268–273.
10. Carrasquillo MM, McCallion AS, Puffenberger EG, Kashuk CS, Nouri N,Chakravarti A: Genome-wide association study and mouse model identifyinteraction between RET and EDNRB pathways in Hirschsprung disease.Nat Genet 2002, 32:237–244.
11. Gabriel SB, Salomon R, Pelet A, Angrist M, Amiel J, Fornage M, Attie-Bitach T,Olson JM, Hofstra R, Buys C, et al: Segregation at three loci explains familialand population risk in Hirschsprung disease. Nat Genet 2002, 31:89–93.
12. Lin S, Chakravarti A, Cutler DJ: Exhaustive allelic transmissiondisequilibrium tests as a new approach to genome-wide associationstudies. Nat Genet 2004, 36:1181–1188.
13. Tang CS, Sribudiani Y, Miao XP, de Vries AR, Burzynski G, So MT, Leon YY,Yip BH, Osinga J, Hui KJ, et al: Fine mapping of the 9q31 Hirschsprung’sdisease locus. Hum Genet 2010, 127:675–683.
14. Garcia-Barcelo MM, Fong PY, Tang CS, Miao XP, So MT, Yuan ZW, Li L, GuoWH, Liu L, Wang B, et al: Mapping of a Hirschsprung’s disease locus in3p21. Eur J Hum Genet 2008, 16:833–840.
15. Brooks AS, Leegwater PA, Burzynski GM, Willems PJ, de Graaf B, van LangenI, Heutink P, Oostra BA, Hofstra RM, Bertoli-Avella AM: A novel susceptibilitylocus for Hirschsprung’s disease maps to 4q31.3-q32.3. J Med Genet 2006,43:e35.
16. Garcia-Barcelo MM, Tang CS, Ngan ES, Lui VC, Chen Y, So MT, Leon TY, MiaoXP, Shum CK, Liu FQ, et al: Genome-wide association study identifiesNRG1 as a susceptibility locus for Hirschsprung’s disease. Proc Natl AcadSci U S A 2009, 106:2694–2699.
17. Fernandez RM, Bleda M, Nunez-Torres R, Medina I, Luzon-Toro B, Garcia-Alonso L, Torroglosa A, Marba M, Enguix-Riego MV, Montaner D, et al: Fournew loci associations discovered by pathway-based and networkanalyses of the genome-wide variability profile of Hirschsprung’s disease.Orphanet J Rare Dis 2012, 7:103.
Fernández et al. Orphanet Journal of Rare Diseases 2013, 8:187 Page 11 of 11http://www.ojrd.com/content/8/1/187
18. Wang K, Li M, Bucan M: Pathway-based approaches for analysis ofgenomewide association studies. Am J Hum Genet 2007, 81:1278–1283.
19. Wang K, Li M, Hakonarson H: Analysing biological pathways ingenome-wide association studies. Nat Rev Genet 2010, 11:843–854.
20. Fridley BL, Biernacka JM: Gene set analysis of SNP data: benefits,challenges, and future directions. Eur J Hum Genet 2011, 19:837–843.
21. Aulchenko YS, Ripatti S, Lindqvist I, Boomsma D, Heid IM, Pramstaller PP,Penninx BW, Janssens AC, Wilson JF, Spector T, et al: Loci influencing lipidlevels and coronary heart disease risk in 16 European populationcohorts. Nat Genet 2009, 41:47–55.
22. Askland K, Read C, Moore J: Pathways-based analyses of whole-genomeassociation study data in bipolar disorder reveal genes mediating ionchannel activity and synaptic neurotransmission. Hum Genet 2009,125:63–79.
23. Torkamani A, Topol EJ, Schork NJ: Pathway analysis of seven commondiseases assessed by genome-wide association. Genomics 2008,92:265–272.
24. Purcell S, Neale B, Todd-Brown K, Thomas L, Ferreira MA, Bender D, Maller J,Sklar P, de Bakker PI, Daly MJ, Sham PC: PLINK: a tool set for whole-genome association and population-based linkage analyses. Am J HumGenet 2007, 81:559–575.
25. Medina I, Montaner D, Bonifaci N, Pujana MA, Carbonell J, Tarraga J,Al-Shahrour F, Dopazo J: Gene set-based analysis of polymorphisms:finding pathways or biological processes associated to traits ingenome-wide association studies. Nucleic Acids Res 2009, 37:W340–W344.
26. Medina I, Carbonell J, Pulido L, Madeira SC, Goetz S, Conesa A, Tarraga J,Pascual-Montano A, Nogales-Cadenas R, Santoyo J, et al: Babelomics: anintegrative platform for the analysis of transcriptomics, proteomics andgenomic data with advanced functional profiling. Nucleic Acids Res 2010,38:W210–W213.
27. Benjamini Y, Hochberg Y: Controlling the false discovery rate: a practicaland powerful approach to multiple testing. J R Stat Soc Ser B 1995,57:289–300.
28. Garcia-Alonso L, Alonso R, Vidal E, Amadoz A, de Maria A, Minguez P,Medina I, Dopazo J: Discovering the hidden sub-network component in aranked list of genes or proteins derived from genomic experiments.Nucleic Acids Res 2012, 40:e158.
29. Minguez P, Dopazo J: Assessing the biological significance of geneexpression signatures and co-expression modules by studying theirnetwork properties. PLoS One 2011, 6:e17474.
30. Minguez P, Gotz S, Montaner D, Al-Shahrour F, Dopazo J: SNOW, aweb-based tool for the statistical analysis of protein-protein interactionnetworks. Nucleic Acids Res 2009, 37:W109–W114.
31. Ward LD, Kellis M: HaploReg: a resource for exploring chromatin states,conservation, and regulatory motif alterations within sets of geneticallylinked variants. Nucleic Acids Res 2012, 40:D930–D934.
32. Bernstein BE, Birney E, Dunham I, Green ED, Gunter C, Snyder M: Anintegrated encyclopedia of DNA elements in the human genome. Nature2012, 489:57–74.
33. Liu JZ, McRae AF, Nyholt DR, Medland SE, Wray NR, Brown KM, Hayward NK,Montgomery GW, Visscher PM, Martin NG, Macgregor S: A versatilegene-based test for genome-wide association studies. Am J Hum Genet2010, 87:139–145.
34. Mirina A, Atzmon G, Ye K, Bergman A: Gene size matters. PLoS One 2012,7:e49093.
35. Davydov EV, Goode DL, Sirota M, Cooper GM, Sidow A, Batzoglou S:Identifying a high fraction of the human genome to be under selectiveconstraint using GERP++. PLoS Comput Biol 2010, 6:e1001025.
36. Garber M, Guttman M, Clamp M, Zody MC, Friedman N, Xie X: Identifyingnovel constrained elements by exploiting biased substitution patterns.Bioinformatics 2009, 25:i54–i62.
37. Meulemans D, Bronner-Fraser M: Gene-regulatory interactions in neuralcrest evolution and development. Dev Cell 2004, 7:291–299.
38. Lim J, Hao T, Shaw C, Patel AJ, Szabo G, Rual JF, Fisk CJ, Li N, Smolyar A, HillDE, et al: A protein-protein interaction network for human inheritedataxias and disorders of Purkinje cell degeneration. Cell 2006,125:801–814.
39. Goehler H, Lalowski M, Stelzl U, Waelter S, Stroedicke M, Worm U, Droege A,Lindenberg KS, Knoblich M, Haenig C, et al: A protein interaction networklinks GIT1, an enhancer of huntingtin aggregation, to Huntington’sdisease. Mol Cell 2004, 15:853–865.
40. Camargo LM, Collura V, Rain JC, Mizuguchi K, Hermjakob H, Kerrien S,Bonnert TP, Whiting PJ, Brandon NJ: Disrupted in Schizophrenia 1Interactome: evidence for the close connectivity of risk genes and apotential synaptic basis for schizophrenia. Mol Psychiatry 2007, 12:74–86.
41. Soler-Lopez M, Zanzoni A, Lluis R, Stelzl U, Aloy P: Interactome mappingsuggests new mechanistic details underlying Alzheimer’s disease.Genome Res 2011, 21:364–376.
42. Laranjeira C, Pachnis V: Enteric nervous system development: recentprogress and future challenges. Auton Neurosci 2009, 151:61–69.
43. Heanue TA, Pachnis V: Expression profiling the developing mammalianenteric nervous system identifies marker and candidate Hirschsprungdisease genes. Proc Natl Acad Sci U S A 2006, 103:6919–6924.
44. Hirschhorn JN, Lohmueller K, Byrne E, Hirschhorn K: A comprehensivereview of genetic association studies. Genet Med 2002, 4:45–61.