University of Groningen The link between coherent burst oscillations, burst spectral evolution and accretion state in 4U 1728-34 Zhang, Guobao; Méndez, Mariano; Zamfir, Michael; Cumming, Andrew Published in: Monthly Notices of the Royal Astronomical Society DOI: 10.1093/mnras/stv2482 IMPORTANT NOTE: You are advised to consult the publisher's version (publisher's PDF) if you wish to cite from it. Please check the document version below. Document Version Publisher's PDF, also known as Version of record Publication date: 2016 Link to publication in University of Groningen/UMCG research database Citation for published version (APA): Zhang, G., Méndez, M., Zamfir, M., & Cumming, A. (2016). The link between coherent burst oscillations, burst spectral evolution and accretion state in 4U 1728-34. Monthly Notices of the Royal Astronomical Society, 455(2), 2004-2017. [eprint arXiv:1510.07213]. https://doi.org/10.1093/mnras/stv2482 Copyright Other than for strictly personal use, it is not permitted to download or to forward/distribute the text or part of it without the consent of the author(s) and/or copyright holder(s), unless the work is under an open content license (like Creative Commons). Take-down policy If you believe that this document breaches copyright please contact us providing details, and we will remove access to the work immediately and investigate your claim. Downloaded from the University of Groningen/UMCG research database (Pure): http://www.rug.nl/research/portal. For technical reasons the number of authors shown on this cover page is limited to 10 maximum. Download date: 29-12-2019
Transcript
University of Groningen
The link between coherent burst oscillations, burst spectral evolution and accretion state in4U 1728-34Zhang, Guobao; Méndez, Mariano; Zamfir, Michael; Cumming, Andrew
Published in:Monthly Notices of the Royal Astronomical Society
DOI:10.1093/mnras/stv2482
IMPORTANT NOTE: You are advised to consult the publisher's version (publisher's PDF) if you wish to cite fromit. Please check the document version below.
Document VersionPublisher's PDF, also known as Version of record
Publication date:2016
Link to publication in University of Groningen/UMCG research database
Citation for published version (APA):Zhang, G., Méndez, M., Zamfir, M., & Cumming, A. (2016). The link between coherent burst oscillations,burst spectral evolution and accretion state in 4U 1728-34. Monthly Notices of the Royal AstronomicalSociety, 455(2), 2004-2017. [eprint arXiv:1510.07213]. https://doi.org/10.1093/mnras/stv2482
CopyrightOther than for strictly personal use, it is not permitted to download or to forward/distribute the text or part of it without the consent of theauthor(s) and/or copyright holder(s), unless the work is under an open content license (like Creative Commons).
Take-down policyIf you believe that this document breaches copyright please contact us providing details, and we will remove access to the work immediatelyand investigate your claim.
Downloaded from the University of Groningen/UMCG research database (Pure): http://www.rug.nl/research/portal. For technical reasons thenumber of authors shown on this cover page is limited to 10 maximum.
The link between coherent burst oscillations, burst spectral evolutionand accretion state in 4U 1728–34
Guobao Zhang,1,2‹ Mariano Mendez,2 Michael Zamfir3 and Andrew Cumming3
1New York University Abu Dhabi, PO Box 129188, Abu Dhabi, United Arab Emirates2Kapteyn Astronomical Institute, University of Groningen, PO BOX 800, NL-9700 AV Groningen, the Netherlands3Department of Physics and McGill Space Institute, McGill University, 3600 rue University, Montreal, QC H3A 2T8, Canada
Accepted 2015 October 23. Received 2015 October 21; in original form 2015 April 15
ABSTRACTCoherent oscillations and the evolution of the X-ray spectrum during thermonuclear X-raybursts in accreting neutron-star X-ray binaries have been studied intensively but separately. Weanalysed all the X-ray bursts of the source 4U 1728–34 with the Rossi X-ray Timing Explorer.We found that the presence of burst oscillations can be used to predict the behaviour of theblackbody radius during the cooling phase of the bursts. If a burst shows oscillations, duringthe cooling phase the blackbody radius remains more or less constant for ∼2– ∼ 8 s, whereasin bursts that do not show oscillations the blackbody radius either remains constant for morethan ∼2– ∼ 8 s or it shows a rapid (faster than ∼2 s) decrease and increase. Both the presenceof burst oscillations and the time-dependent spectral behaviour of the bursts are affected byaccretion rate. We also found that the rise time and convexity of the bursts’ light curve aredifferent in bursts with and without oscillations in 4U 1728–34. Bursts with oscillations have ashort rise time (∼0.5 s) and show both positive and negative convexity, whereas bursts withoutoscillations have a long rise time (∼1 s) and mostly positive convexity. This is consistent withthe idea that burst oscillations are associated with off-equator ignition.
Thermonuclear, Type-I, X-ray bursts (e.g. Lewin, van Paradijs &Taam 1993; Strohmayer & Bildsten 2003; Galloway et al. 2008)are due to unstable burning of accreted H and/or He on the sur-face of accreting neutron stars (NS) in low-mass X-ray binaries(LMXBs). Typical bursts exhibit rise times of 1–10 s, durations of afew tens of seconds to a few minutes, and have total energy outputsof 1039–1040 erg. Some X-ray bursts are strong enough to reachthe Eddington luminosity. In those so-called photospheric radiusexpansion (PRE) bursts, the radiation pressure is high enough totrigger the expansion of the outer layers of the NS atmosphere (e.g.Basinska et al. 1984; Kuulkers et al. 2002).
The inferred emission area of an NS can be estimated from thefitting of the energy spectra during the decaying phase of Type-I X-ray bursts, assuming that the thermonuclear flash expands to coverthe entire star during the radius expansion and cooling phases of theburst (van Paradijs 1978). There are a number of theoretical and ob-servational arguments that support this assumption (see e.g. Fryxell& Woosley 1982; Bildsten 1995; Spitkovsky, Levin & Ushomirsky
2002; Strohmayer & Bildsten 2003). Recent work has shown thatduring the cooling phase of the bursts, the relation between thebolometric flux and the temperature is significantly different fromthe canonical F ∝ T4 relation that is expected if the apparent emit-ting area on the surface of the NS remains constant as the fluxdecreases during the decay of the burst and if the spectrum is black-body (Suleimanov, Poutanen & Werner 2011a; Zhang, Mendez &Altamirano 2011; Garcıa, Zhang & Mendez 2013). This could bedue to either changes in the emitting area of the NS, or to changesin the colour-correction factor, fc, which accounts for hardening ofthe spectrum arising from electron scattering in the NS atmosphere,among other factors (van Paradijs 1982; Suleimanov et al. 2011a).
Coherent oscillations during bursts have been detected in manyNS-LMXBs; these oscillations likely reflect the spin frequency ofthe NS (e.g. Strohmayer, Zhang & Swank 1997; Chakrabarty et al.2003), but the mechanism of burst oscillations is still unclear (e.g.Strohmayer et al. 1996; Muno, Galloway & Chakrabarty 2004).Strohmayer & Markwardt (1999) suggested that burst oscillationsare caused by asymmetries due to initially localized nuclear burning(the hotspot) that later spreads over the surface of the NS in the risephase of the burst. This scenario has been supported by Chakraborty& Bhattacharyya (2014) using a large sample of bursts from 10 NSLMXB. This scenario, however, cannot explain oscillations thatpersist for as long as 5–10 s in the burst decay.
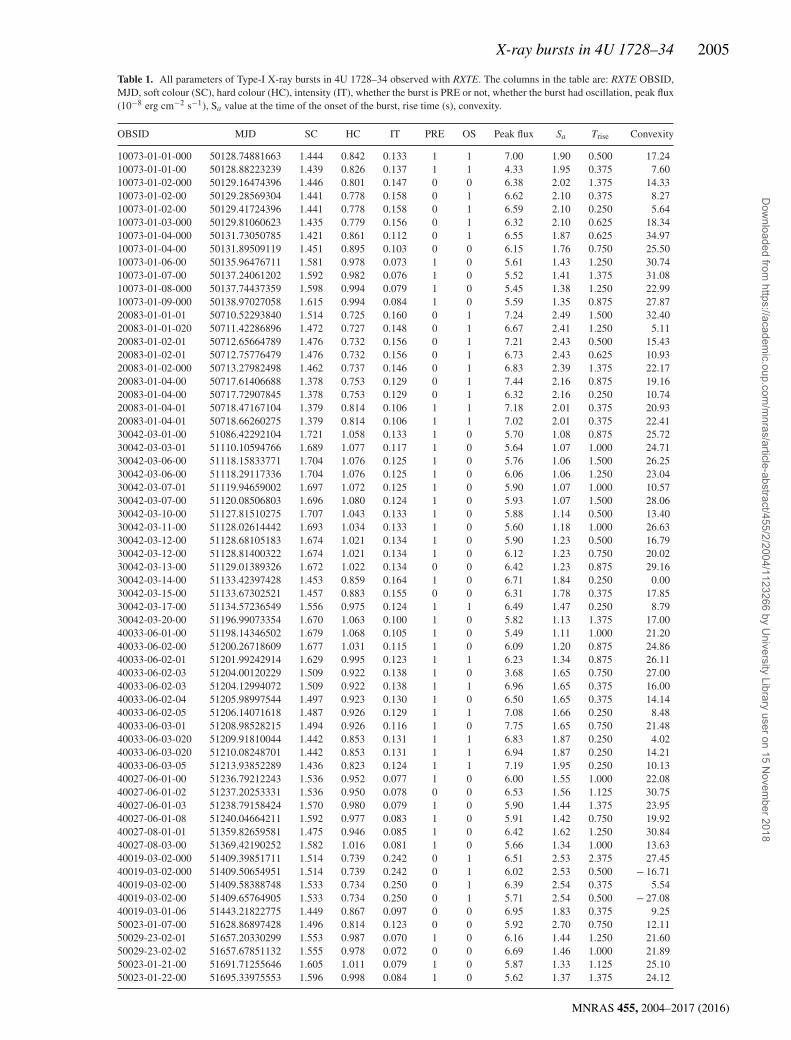
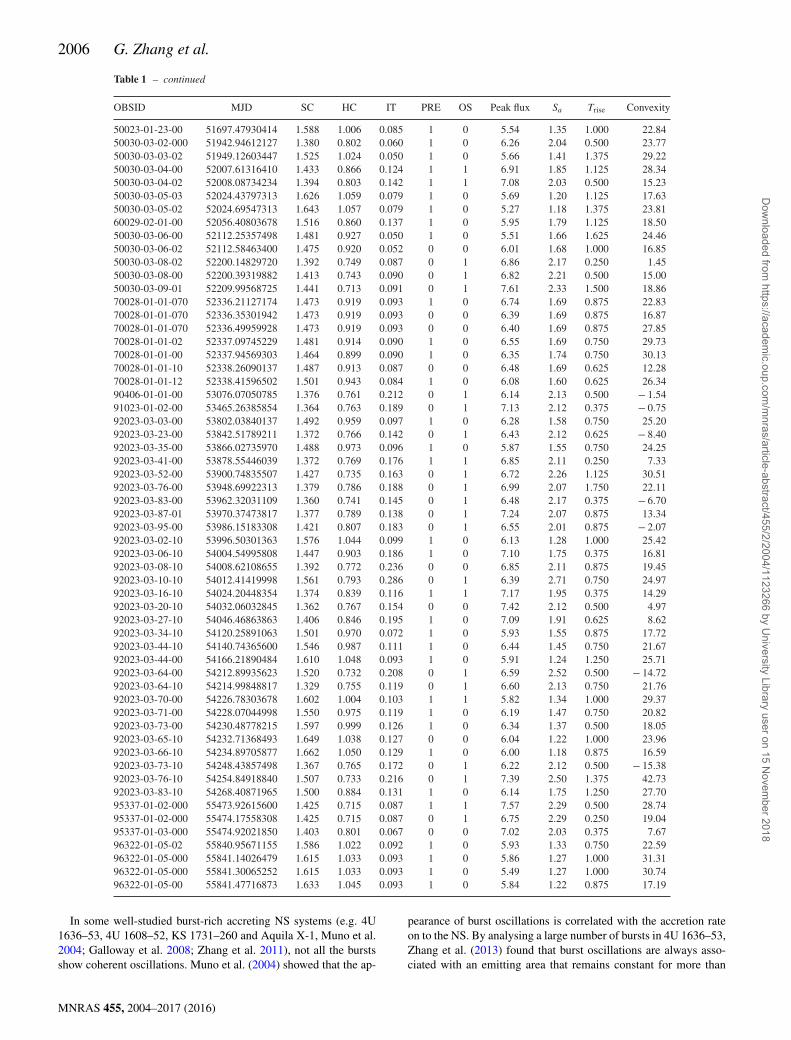
Table 1. All parameters of Type-I X-ray bursts in 4U 1728–34 observed with RXTE. The columns in the table are: RXTE OBSID,MJD, soft colour (SC), hard colour (HC), intensity (IT), whether the burst is PRE or not, whether the burst had oscillation, peak flux(10−8 erg cm−2 s−1), Sa value at the time of the onset of the burst, rise time (s), convexity.
OBSID MJD SC HC IT PRE OS Peak flux Sa Trise Convexity
In some well-studied burst-rich accreting NS systems (e.g. 4U1636–53, 4U 1608–52, KS 1731–260 and Aquila X-1, Muno et al.2004; Galloway et al. 2008; Zhang et al. 2011), not all the burstsshow coherent oscillations. Muno et al. (2004) showed that the ap-
pearance of burst oscillations is correlated with the accretion rateon to the NS. By analysing a large number of bursts in 4U 1636–53,Zhang et al. (2013) found that burst oscillations are always asso-ciated with an emitting area that remains constant for more than
MNRAS 455, 2004–2017 (2016)
Dow
nloaded from https://academ
ic.oup.com/m
nras/article-abstract/455/2/2004/1123266 by University Library user on 15 N
ovember 2018
X-ray bursts in 4U 1728–34 2007
2 s during the decaying phase of the burst. They suggested that tailoscillations could be due to the spread of a cooling wake, whichis formed by vortices during the cooling of the NS atmosphere(Spitkovsky et al. 2002). In this scenario, the speed of the coolingwake depends on the latitude at which the burst ignites, since thespeed of the burning front near the equator is higher than that nearthe poles. Zhang et al. (2013) suggested that in 4U 1636–53 thebursts with tail oscillations ignite at high latitude on the NS sur-face. Recently Kajava et al. (2014) found a correlation between thepersistent spectral properties and the time evolution of the black-body normalization during the burst decay. They suggested that thisobserved behaviour may be attributed to the accretion flow, whichinfluences the spectrum of the cooling NS. Its an interesting ques-tion whether the link is between burst oscillations and time-resolvedspectrum, or between accretion rate and burst oscillations and time-resolved spectrum. We investigate it here in another source – 4U1728–34.
Studying the burst morphology – rise shape – can also help usto understand the ignition latitude and other various processes op-erating during the burst rise. Maurer & Watts (2008) developeda simple phenomenological model and they simulated burst lightcurves with ignition at different latitudes on the NS surface. Theyfound that bursts that ignite near the equator always show convexrise shape, whereas bursts that ignite near the pole show eitherconvex or concave rise shape.
The NS LMXB 4U 1728–34 is one of the best studied sourcesof Type-I X-ray bursts (e.g. Forman, Tananbaum & Jones 1976;Hasinger & van der Klis 1989; van Straaten et al. 2001, 2002).The distance to the source is between 4 and 6 kpc, based on theEddington flux of the PRE bursts (e.g. Di Salvo et al. 2000; vanStraaten et al. 2001; Galloway et al. 2008). The bursts in 4U 1728–34 have all short rise times and similar duration (van Straaten et al.2001; Galloway et al. 2008), that is the characteristic behaviour ofhelium-rich bursts. Using an analytical model of X-ray burst spec-tral formation, Shaposhnikov, Titarchuk & Haberl (2003) claimedthat 4U 1728–34 is an ultracompact X-ray binary (UCXB) with anevolved, H-poor, donor. Nearly coherent oscillations during X-raybursts at 363 Hz from this source were first reported by Strohmayeret al. (1996). van Straaten et al. (2001) and Muno et al. (2001, 2004)analysed observations of 4U 1728–34 with Rossi X-ray Timing Ex-plorer (RXTE) and found a relationship between the appearance ofburst oscillations and the mass accretion rate.
In this paper, we present the X-ray spectral and burst oscillationproperties of all the Type-I bursts in 4U 1728–34 observed withRXTE. In particular, we investigate the difference between the burstswith and without oscillations. We find strong evidence for a linkbetween coherent oscillations and the evolution of the apparentemission area during the bursts. We also find that the rise timeand the shape of the light curve at the beginning of the bursts aredifferent for bursts with and without oscillations in 4U 1728–34.We describe the observations and data analysis in Section 2, and wepresent our results in Section 3. Finally, in Section 4 we discuss ourfindings and conclude in Section 5.
2 O B S E RVAT I O N A N D DATA R E D U C T I O N
We analysed all available data (411 observations for a total of ∼1750ks) of 4U 1728–34 from the Proportional Counter Array (PCA) onboard RXTE (Jahoda et al. 1996, 2006). Due to the affect by thepresence of the nearby transient 4U 1730–335 (the Rapid Burster),12 observations were not used in this work. The PCA consists of anarray of five collimated proportional counter units (PCUs) operating
in the 2–60 keV range. We produced 0.25-s light curves from theStandard-1 data (0.125-s time resolution with no energy resolution)and searched for X-ray bursts in these light curves following theprocedure described in Zhang et al. (2011). We detected a totalof 121 Type-I X-ray bursts in these data, and gave some of theirproperties in Table 1.
We used the Standard-2 data (16-s time resolution and 129 chan-nels covering the full 2–60 keV PCA band) to calculate X-raycolours of the source. We defined hard and soft colours as the9.7–16.0/6.0–9.7 keV and 3.5–6.0/2.0–3.5 keV count rate ratios,respectively (see Zhang et al. 2011, for details). We show the colour–colour diagram (CD) of all observations of 4U 1728–34 in Fig. 1.We parametrized the position of the source on the diagram by thelength of the solid curve Sa (see, e.g. Mendez et al. 1999; Zhanget al. 2011), fixing the values of Sa = 1 and 2 at the top-right andthe bottom-left vertex of the CD, respectively.
We used the high-time resolution modes that were available foreach observation to produce a spectrum every 0.25 s during thewhole duration of each burst. We generated the instrument responsematrix for each spectrum with the standard FTOOLS routine PCARSP,and we corrected each spectrum for dead time using the methodssupplied by the RXTE team. Due to the short exposure time usedto generate each spectrum, statistical errors were dominant, and wedid not include any additional systematic error to the spectra. Foreach burst, we extracted the spectrum of the persistent emission justbefore or after the burst to use as background in our fits.
We fitted the spectra using XSPEC version 12.8.0 (Arnaud 1996),restricting the spectral fits to the energy range 3.0–20.0 keV. Wefitted the time-resolved net burst spectra with a single-temperatureblackbody model (BBODYRAD in XSPEC), as generally burst spectra arewell fitted by a blackbody (e.g. van Straaten et al. 2001; Kuulkerset al. 2002; Galloway et al. 2008). We also included the effect ofinterstellar absorption along the line of sight using the XSPEC modelwabs. During the fitting we kept the hydrogen column density, NH,fixed at 2.3 × 1022 cm−2 (D’Aı et al. 2006), and to calculate theradius of the emitting blackbody area in km, Rbb, we assumed adistance of 5.2 kpc (e.g. Di Salvo et al. 2000; van Straaten et al.2001; Galloway et al. 2008).
For each burst, we computed Fourier power density spectra (PDS)from 2-s data segments for the duration of the burst using the125 µs binned data over the full PCA band pass, setting the starttime of each segment to 0.125 s after the start time of the previoussegment. We used these PDS to produce time-frequency plots (alsoknown as dynamic power spectra; see Berger et al. 1996) for eachburst. For coherent oscillations, we only searched the frequencyrange 360–365 Hz with a resolution of 0.5 Hz. We considered thata signal was significant if it had a probability of <10−4 that it wasproduced by noise accounting for the number of possible indepen-dent trials, and if the signal appeared in at least two PDS withinthe tail of a single burst. (See discussion in Zhang et al. 2013, fordetails about the detection and measurement of burst oscillations.)
3 R ESULTS
3.1 Time-resolved spectra and burst oscillations
In Figs 2(a) and (b), we show 12 examples of Type-I X-ray burstsof 4U 1728–34. In the left-hand panels of this figure we show sixcases of bursts with oscillations, while in the right-hand panels weshow six cases of bursts without oscillations. In each panel, thered histogram shows the shape of the light curve of the bursts at aresolution of 0.125 s. The contour lines show constant Fourier power
MNRAS 455, 2004–2017 (2016)
Dow
nloaded from https://academ
ic.oup.com/m
nras/article-abstract/455/2/2004/1123266 by University Library user on 15 N
ovember 2018
2008 G. Zhang et al.
Figure 1. CD of all RXTE observations of 4U 1728–34. The grey crosses represent the data of the source from all available RXTE observations. Each point inthis diagram corresponds to 256 s of data. We defined hard and soft colours as the 9.7–16.0/6.0–9.7 keV and 3.5–6.0/2.0–3.5 keV count rate ratios, respectively.The colours of 4U 1728–34 are normalized to the colours of Crab. The blue filled circles represent the colours of the persistent emission of the source at theonset of a PRE X-ray burst. The red star indicate the bursts with oscillations. PRE bursts with oscillations are therefore indicated with a red star inside a bluecircle. Black triangles represent bursts that show neither PRE nor oscillations. The position of the source on the diagram is parametrized by the length of theblack solid curve Sa.
values, increasing from 10 to 80 in steps of 10 (values are in Leahyunits), as a function of time (x-axis) and frequency (left y-axis).Black filled circles connected by a line show the fitted blackbodyradius as a function of time at 0.25-s time resolution (see the righty-axis). The burst light curve is aligned to the centre of each timeinterval used to calculate the power and energy spectra.
In the PRE bursts of 4U 1728–34, Fig. 2(a) shows that the be-haviour of the blackbody radius during the PRE phase is quitedifferent between bursts with and without oscillations. In the PREbursts with oscillations, the blackbody radius increases very fast(∼1 s) to a maximum value and then decreases, whereas in the PREbursts without oscillations the blackbody radius increases somewhatslower (∼2 s to reach the maximum value).
We also find that the behaviour of the blackbody radius after thetouch down point is not the same for all the PRE bursts in 4U 1728–34. In PRE bursts with oscillations, after the expansion phase theblackbody radius, Rbb, first decreases rapidly, it then stays constantfor a while, and finally it either increases slightly, or it remains moreor less constant towards the tail of the burst (see left-hand panels ofFig. 2a). In the PRE bursts without oscillations, after the expansionphase the blackbody radius first decreases rapidly to a minimum,then it immediately increases again very quickly, and finally it eitherdecreases slightly, or it remains more or less constant (see right-handpanel of Fig. 2a). This behaviour is similar to the one found in theLMXB 4U 1636–53 by Zhang et al. (2013).
We detected nine non-PRE bursts with tail oscillations in ourobservations of 4U 1728–34. Similar to the case of PRE bursts inthis source, after the peak of the burst these non-PRE bursts show aperiod in which Rbb remains more or less constant during the time
in which tail oscillations are present (see the left-hand panels ofFig. 2b).
In Zhang et al. (2013) we found that, for PRE bursts, in 4U 1636–53 the presence of burst oscillations is associated with the durationof the post touchdown phase. This distinction, however, only worksfor PRE bursts, since there is no touch down or post touch downphase in non-PRE bursts. In the following subsections, we exploreother properties of the bursts that, at least in the case of 4U 1728-34,appear to be associated with the presence of burst oscillations in thetail of the bursts.
3.2 The blackbody normalization as a function of flux
From blackbody fits to the time-resolved spectra of the thermonu-clear X-ray bursts, we can obtain Rbb and Tbb, the blackbody radiusand colour temperature, respectively, from which we can calculatethe bolometric flux of the NS. Zhang et al. (2011) and Garcıa et al.(2013) found that, in the cooling phase of bursts in 4U 1636–53 and4U 1820-30, the relation between the bolometric flux and the tem-perature is very different from the canonical Fb ∝ T 4
bb relation whichis expected if the apparent emitting area on the surface of the NSremains constant and if the spectrum is blackbody. Departures fromthe Fb ∝ T 4
bb relation have also been reported from other NS-LMXBsystems (Suleimanov et al. 2011b; Kajava et al. 2014; Poutanen et al.2014). This could be due to either changes in the emitting area ofthe NS during this phase, or to changes in the colour-correctionfactor, fc = Tbb/Teff = √
R∞/Rbb, where R∞ is the NS radius ob-served at infinity and Teff is the effective surface temperature. If the
MNRAS 455, 2004–2017 (2016)
Dow
nloaded from https://academ
ic.oup.com/m
nras/article-abstract/455/2/2004/1123266 by University Library user on 15 N
ovember 2018
X-ray bursts in 4U 1728–34 2009
(a)
Figure 2. (a) Left-hand panels: burst with tail oscillations. Right-hand panels: burst without tail oscillations. In each panel, the red histogram shows the lightcurve of the burst at a resolution of 0.125 s. The intensity, in units of 1000 counts s−1, is shown by the scale plotted to the right, outside of each panel. Thecontour lines show constant power values, increasing from 10 to 80 in steps of 10 (values are in Leahy units), as a function of time (x-axis) and frequency (lefty-axis). The power spectra were calculated from 2 s intervals, with the start time of each successive interval shifted by 0.125 s with respect to the start timeof the previous interval. Black filled circles connected by a line show the best-fitting blackbody radius as a function of time at a resolution of 0.25 s (see theright y-axis), with error bars at the 90 per cent confidence level. The burst light-curve profile is aligned to the centre of each data interval used to calculate thepower spectra and energy spectra. Note also the power contours at ∼363 Hz during the bursts, which are due to oscillations in the burst. The label on top ofeach panel indicates the OBSID in which the burst was detected and the burst number in that observation. All bursts in these panels are PRE bursts. (b) Someof the bursts in these panels are non-PRE bursts.
MNRAS 455, 2004–2017 (2016)
Dow
nloaded from https://academ
ic.oup.com/m
nras/article-abstract/455/2/2004/1123266 by University Library user on 15 N
ovember 2018
2010 G. Zhang et al.
(b)
Figure 2 – continued
apparent emitting area on the surface of the NS remains constant asthe flux decreases during the decay of the bursts, fc can be expressedin terms of the blackbody normalization: N
−1/4BB = fc × A, where
A = (R∞[km]/D10)−1/2, with D10 the distance to the source in unitsof 10 kpc (Suleimanov et al. 2011a).
In Figs 3(a) and (b), we show N−1/4BB as a function of flux during the
same 12 X-ray bursts shown in Figs 2(a) and (b). The flux in the x-
axis is normalized by the peak flux of each burst individually. In theleft-hand panels of these figures, we show bursts with oscillations,while in the right-hand panels we show bursts without oscillations.We found that in bursts with oscillations, especially in the case ofPRE bursts (see Fig. 3a), at the beginning of the cooling phase andimmediately after the touch down point, the value of N
−1/4BB remains
more or less constant as the flux decreases, whereas in bursts without
MNRAS 455, 2004–2017 (2016)
Dow
nloaded from https://academ
ic.oup.com/m
nras/article-abstract/455/2/2004/1123266 by University Library user on 15 N
ovember 2018
X-ray bursts in 4U 1728–34 2011
(A) (B)
(C) (D)
(E)
(a)
(F)
Figure 3. (a) The N1/4BB as a function of flux during the PRE Type-I X-ray burst from 4U 1728–34 shown in Fig. 2(a). The black filled circles correspond to
the time intervals in the decaying phase of the bursts in which the flux of the burst is between 40 and 100 per cent of, respectively, the touch down flux forPRE bursts or the peak flux for non-PRE bursts. The open grey circles correspond to the data outside those intervals. The error bars of N
−1/4BB represent the 1σ
confidence level. (b) Same as in Fig. 3(a) for the bursts in Fig. 2(b). Some of these are non-PRE bursts.
oscillations the value of N−1/4BB decreases when the flux decreases
in the decay phase of the bursts.In order to quantify this, and to see whether the differences appear
in all the bursts (including non-PRE) we did the following analysis.
We fitted a linear function to the data during the early cooling phaseof the bursts in the N
−1/4BB -flux diagram. For the PRE bursts, we
defined the early cooling phase of the bursts as the time intervalfrom the touch down point down to the moment when the burst flux
MNRAS 455, 2004–2017 (2016)
Dow
nloaded from https://academ
ic.oup.com/m
nras/article-abstract/455/2/2004/1123266 by University Library user on 15 N
ovember 2018
2012 G. Zhang et al.
(b)
(G) (H)
(I) (J)
(K) (L)
Figure 3 – continued
returned to 40 per cent of the touch down flux. For the non-PREbursts, we defined the early cooling phase of the bursts as the timeinterval from the peak of the burst to the moment when the burstflux returned to 40 per cent of the peak flux. The early cooling phaseas defined in the plots in black filled circles in Figs 3(a) and (b).
Since different bursts in 4U 1728–34 have slightly different peakor touch-down flux, we also used the Eddington flux to normalizethe bursts flux and repeated the analysis described above. In this
case, we used an Eddington flux of 84 ± 9 × 10⁻⁹ ergs cm−2 s−1
(e.g. Di Salvo et al. 2000; van Straaten et al. 2001; Galloway et al.2008).
The two different flux normalizations give slightly differentslopes in the fits of the N
−1/4BB −flux plots for each burst. In Fig. 4,
we show the fitted slope of each burst as a function of Sa. In the up-per panel, the burst flux is normalized by the Eddington flux, whilein the lower panel the burst flux is normalized by the peak flux of
MNRAS 455, 2004–2017 (2016)
Dow
nloaded from https://academ
ic.oup.com/m
nras/article-abstract/455/2/2004/1123266 by University Library user on 15 N
ovember 2018
X-ray bursts in 4U 1728–34 2013
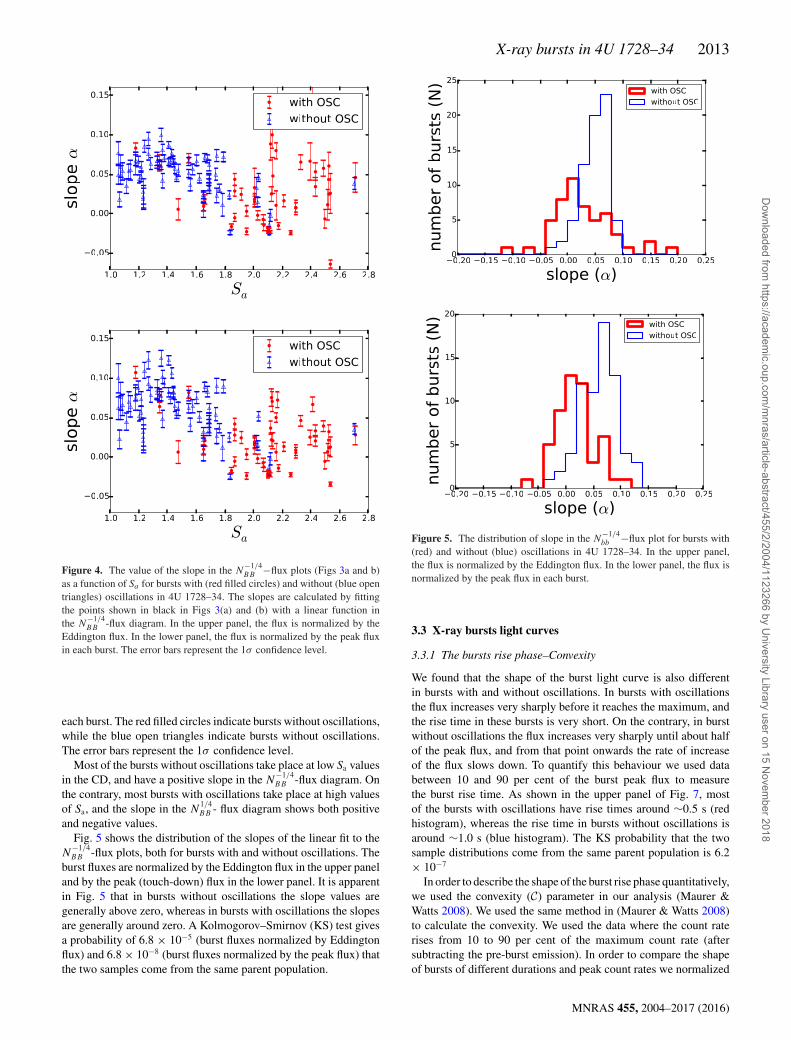
Figure 4. The value of the slope in the N−1/4BB −flux plots (Figs 3a and b)
as a function of Sa for bursts with (red filled circles) and without (blue opentriangles) oscillations in 4U 1728–34. The slopes are calculated by fittingthe points shown in black in Figs 3(a) and (b) with a linear function inthe N
−1/4BB -flux diagram. In the upper panel, the flux is normalized by the
Eddington flux. In the lower panel, the flux is normalized by the peak fluxin each burst. The error bars represent the 1σ confidence level.
each burst. The red filled circles indicate bursts without oscillations,while the blue open triangles indicate bursts without oscillations.The error bars represent the 1σ confidence level.
Most of the bursts without oscillations take place at low Sa valuesin the CD, and have a positive slope in the N
−1/4BB -flux diagram. On
the contrary, most bursts with oscillations take place at high valuesof Sa, and the slope in the N
1/4BB - flux diagram shows both positive
and negative values.Fig. 5 shows the distribution of the slopes of the linear fit to the
N−1/4BB -flux plots, both for bursts with and without oscillations. The
burst fluxes are normalized by the Eddington flux in the upper paneland by the peak (touch-down) flux in the lower panel. It is apparentin Fig. 5 that in bursts without oscillations the slope values aregenerally above zero, whereas in bursts with oscillations the slopesare generally around zero. A Kolmogorov–Smirnov (KS) test givesa probability of 6.8 × 10⁻⁵ (burst fluxes normalized by Eddingtonflux) and 6.8 × 10⁻⁸ (burst fluxes normalized by the peak flux) thatthe two samples come from the same parent population.
Figure 5. The distribution of slope in the N−1/4bb −flux plot for bursts with
(red) and without (blue) oscillations in 4U 1728–34. In the upper panel,the flux is normalized by the Eddington flux. In the lower panel, the flux isnormalized by the peak flux in each burst.
3.3 X-ray bursts light curves
3.3.1 The bursts rise phase–Convexity
We found that the shape of the burst light curve is also differentin bursts with and without oscillations. In bursts with oscillationsthe flux increases very sharply before it reaches the maximum, andthe rise time in these bursts is very short. On the contrary, in burstwithout oscillations the flux increases very sharply until about halfof the peak flux, and from that point onwards the rate of increaseof the flux slows down. To quantify this behaviour we used databetween 10 and 90 per cent of the burst peak flux to measurethe burst rise time. As shown in the upper panel of Fig. 7, mostof the bursts with oscillations have rise times around ∼0.5 s (redhistogram), whereas the rise time in bursts without oscillations isaround ∼1.0 s (blue histogram). The KS probability that the twosample distributions come from the same parent population is 6.2× 10⁻⁷
In order to describe the shape of the burst rise phase quantitatively,we used the convexity (C) parameter in our analysis (Maurer &Watts 2008). We used the same method in (Maurer & Watts 2008)to calculate the convexity. We used the data where the count raterises from 10 to 90 per cent of the maximum count rate (aftersubtracting the pre-burst emission). In order to compare the shapeof bursts of different durations and peak count rates we normalized
MNRAS 455, 2004–2017 (2016)
Dow
nloaded from https://academ
ic.oup.com/m
nras/article-abstract/455/2/2004/1123266 by University Library user on 15 N
ovember 2018
2014 G. Zhang et al.
Figure 6. Top panel of (a) shows a persistent subtracted burst light curve with 0.125 s time resolution. The data marked as thick red line are used for convexitycalculation. The bottom panel of (a) shows the re-normalized light curve of selected data. The convexity defined in equation (1) is integrated area above orbelow the diagonal line. The areas above the line is taken to be positive and areas below the line negative. Figure (a) shows a convex burst and figure (b) showsa concave burst.
the count rate and time axes so that the burst rises from 0 to 10normalized count rate units within 10 normalized time units,
C =N∑
i=0
(ci − xi)�t. (1)
In equation (1), ci is the re-normalized count rate in each bin,and xi is the identity function (shown as a diagonal dashed linein the lower panels of (a) and (b) in Fig. 6), N is the numberof re-normalized time bins and �t is the re-normalized time binsize. Convexity is effectively the integrated area of the curve aboveor below the diagonal line – areas above the line being positiveand areas below negative. The convexity describes the curvaturein the light curve rise and quantify whether the curve is convex(convexity > 0) or concave (convexity < 0). In Fig. 6, we show twoexamples of bursts with positive and negative convexity.
We calculated the convexity of the light curves of all X-ray burstsin 4U 1728–34. In the lower panel of Fig. 7, we show the distri-bution of convexity both for bursts with and without oscillations.It is apparent that bursts without oscillations always have positiveconvexity, whereas bursts with oscillations show both positive andnegative convexity. The KS probability that the two sample distri-butions come from the same parent population is 8.7 × 10⁻⁶
3.3.2 The bursts peaking phase
In the Fig. 8, we show two burst light curves. The light curves arenormalized by the count rate at the peak of the burst. Since it isclear that there are many fluctuations during the bursting time, inorder to study the bursts profile we smoothed these light curves;we show two examples of this in Fig. 8 with red colour. We choosethree points to characterize the burst profile around the peak: PointA indicates the time of the maximum of the burst light curve, andpoints B and C indicate the time at which the light curve of the burstis at 30 per cent of the maximum during the rise and the decay ofthe burst, respectively. With these definitions, we call burst durationto the time interval−BC, rise time to the time interval−BA, anddecaying time to the time interval−AC.
Figure 7. Upper panel: the distribution of the rise time of the bursts with(red) and without (blue) burst oscillations in 4U 1728–34. Lower panel: thedistribution of the convexity in the rise part of the light curve of bursts withand without oscillations in 4U 1728–34.
In the upper panel of Fig. 9, we show the distribution of the burstdurations. From a KS test (KS probability 0.18), we cannot dis-card the hypothesis that the two types of bursts have the same burstduration. In the lower panel of Fig. 9, we show the distribution of
MNRAS 455, 2004–2017 (2016)
Dow
nloaded from https://academ
ic.oup.com/m
nras/article-abstract/455/2/2004/1123266 by University Library user on 15 N
ovember 2018
X-ray bursts in 4U 1728–34 2015
Figure 8. Examples of the light curves of two X-ray bursts in 4U 1728–34. The burst on the left shows burst oscillations whereas the one on the right doesnot. In both panels, we show in black the light curve of the burst normalized to unity at the maximum, and in red the smoothed version of the same light curve.The point A indicate the time of the maximum of the smoothed light curve, while the points B and C indicate the times at which the flux is 30 per cent of themaximum during the rising and decaying phases of the burst, respectively.
Figure 9. Upper panel, the distribution of the burst duration, measured asthe interval in which the flux is larger than 30 per cent of the peak flux.Lower panel, the distribution of the ratio of the rise time divided by the burstduration for burst with (red) and without (blue) oscillations.
the rise time divided by the burst duration for bursts with (red) andwithout (blue) oscillations in 4U 1728–34. The KS probability thatthe two samples come from the same parent population is 6.4 ×10⁻¹⁰. The distribution of the ratio of rise time to the burst durationof bursts with and without oscillations are significantly different.
This indicates that the light-curve profiles of bursts with and with-out oscillations are significantly different, bursts with oscillationshaving a more asymmetric light-curve profile than bursts withoutoscillations.
4 D I SCUSSI ON
Out of the 121 Type-I X-ray bursts from the LMXB 4U 1728−34observed with RXTE, 73 are PRE bursts and 49 show burst oscilla-tions at 363 Hz. The convexity of the light curve during the earlyphase of a burst is a good predictor of the presence of oscillationsin the tail of the burst, regardless of whether the burst shows PREor not (see lower panel of Fig. 7). The distribution of the convex-ity for bursts with and without oscillations is significantly different(KS probabilities of 8.7 × 10⁻⁶). Similar to what we found in 4U1636−53 (Zhang et al. 2013), bursts in which the blackbody radiusremains more or less constant for 2 s or more during the coolingphase show burst oscillations, whereas those bursts in which theblackbody radius changes quickly do not show burst oscillations.
4.1 Bursts on the CD
Using a sample of 394 bursts in 12 sources, Muno et al. (2004)proposed that there is a relation between the presence of burstoscillations and accretion rate on to the NS. On the other hand,Zhang et al. (2011) and Kajava et al. (2014) studied the relationbetween source accretion state and burst spectral evolution, whileZhang et al. (2013) found a link between burst oscillations and burstspectral evolution in 4U 1636–53. In this paper, we found that thiskind of relations are much more clear in 4U 1728–34.
Fig. 1 shows the position of the source in the CD at the timewhen an X-ray bursts took place. Bursts with oscillations are locatedeverywhere along the CD, but appear preferentially in the so-calledlower branch, when the source is in a soft state (see also Fig. 4). Theposition of the source along the C-like shape in the CD is influencedby the accretion geometry, which itself may change with accretionrate and inferred mass accretion rate is high in this area of the CD(Hasinger & van der Klis 1989; Mendez et al. 1999). This suggeststhat the appearance of burst oscillations is correlated with accretionrate and geometry; however, it is not possible to determine whetherthis is a causal relation.
MNRAS 455, 2004–2017 (2016)
Dow
nloaded from https://academ
ic.oup.com/m
nras/article-abstract/455/2/2004/1123266 by University Library user on 15 N
ovember 2018
2016 G. Zhang et al.
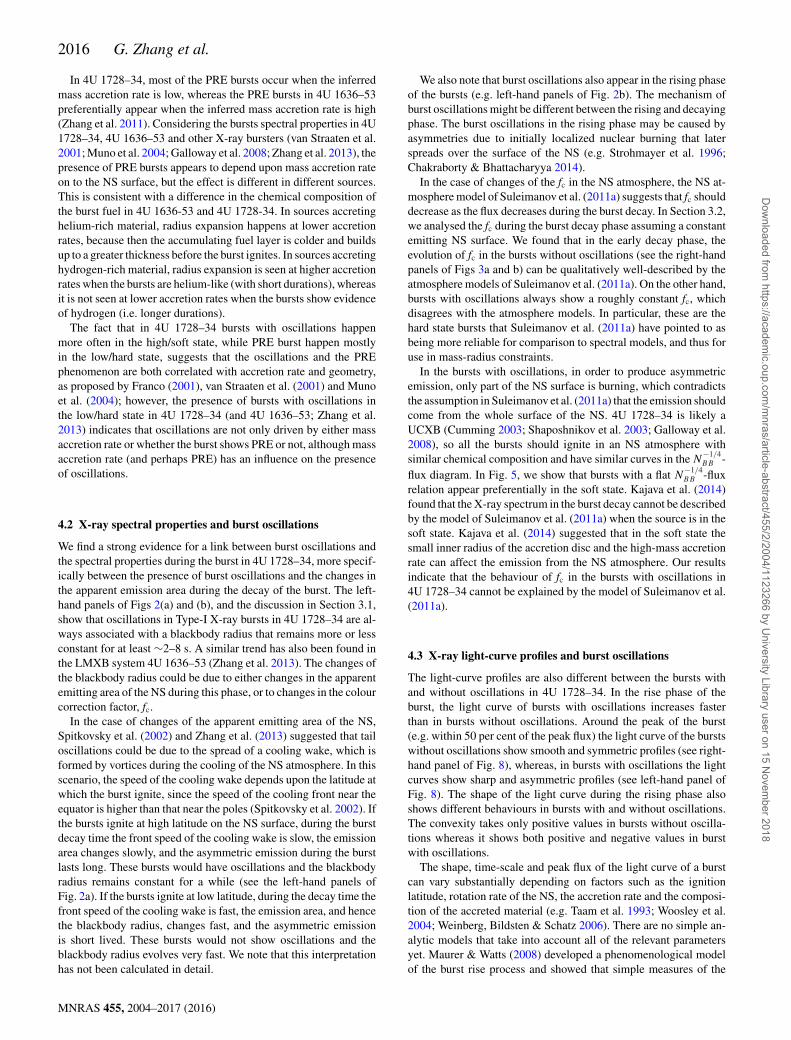
In 4U 1728–34, most of the PRE bursts occur when the inferredmass accretion rate is low, whereas the PRE bursts in 4U 1636–53preferentially appear when the inferred mass accretion rate is high(Zhang et al. 2011). Considering the bursts spectral properties in 4U1728–34, 4U 1636–53 and other X-ray bursters (van Straaten et al.2001; Muno et al. 2004; Galloway et al. 2008; Zhang et al. 2013), thepresence of PRE bursts appears to depend upon mass accretion rateon to the NS surface, but the effect is different in different sources.This is consistent with a difference in the chemical composition ofthe burst fuel in 4U 1636-53 and 4U 1728-34. In sources accretinghelium-rich material, radius expansion happens at lower accretionrates, because then the accumulating fuel layer is colder and buildsup to a greater thickness before the burst ignites. In sources accretinghydrogen-rich material, radius expansion is seen at higher accretionrates when the bursts are helium-like (with short durations), whereasit is not seen at lower accretion rates when the bursts show evidenceof hydrogen (i.e. longer durations).
The fact that in 4U 1728–34 bursts with oscillations happenmore often in the high/soft state, while PRE burst happen mostlyin the low/hard state, suggests that the oscillations and the PREphenomenon are both correlated with accretion rate and geometry,as proposed by Franco (2001), van Straaten et al. (2001) and Munoet al. (2004); however, the presence of bursts with oscillations inthe low/hard state in 4U 1728–34 (and 4U 1636–53; Zhang et al.2013) indicates that oscillations are not only driven by either massaccretion rate or whether the burst shows PRE or not, although massaccretion rate (and perhaps PRE) has an influence on the presenceof oscillations.
4.2 X-ray spectral properties and burst oscillations
We find a strong evidence for a link between burst oscillations andthe spectral properties during the burst in 4U 1728–34, more specif-ically between the presence of burst oscillations and the changes inthe apparent emission area during the decay of the burst. The left-hand panels of Figs 2(a) and (b), and the discussion in Section 3.1,show that oscillations in Type-I X-ray bursts in 4U 1728–34 are al-ways associated with a blackbody radius that remains more or lessconstant for at least ∼2–8 s. A similar trend has also been found inthe LMXB system 4U 1636–53 (Zhang et al. 2013). The changes ofthe blackbody radius could be due to either changes in the apparentemitting area of the NS during this phase, or to changes in the colourcorrection factor, fc.
In the case of changes of the apparent emitting area of the NS,Spitkovsky et al. (2002) and Zhang et al. (2013) suggested that tailoscillations could be due to the spread of a cooling wake, which isformed by vortices during the cooling of the NS atmosphere. In thisscenario, the speed of the cooling wake depends upon the latitude atwhich the burst ignite, since the speed of the cooling front near theequator is higher than that near the poles (Spitkovsky et al. 2002). Ifthe bursts ignite at high latitude on the NS surface, during the burstdecay time the front speed of the cooling wake is slow, the emissionarea changes slowly, and the asymmetric emission during the burstlasts long. These bursts would have oscillations and the blackbodyradius remains constant for a while (see the left-hand panels ofFig. 2a). If the bursts ignite at low latitude, during the decay time thefront speed of the cooling wake is fast, the emission area, and hencethe blackbody radius, changes fast, and the asymmetric emissionis short lived. These bursts would not show oscillations and theblackbody radius evolves very fast. We note that this interpretationhas not been calculated in detail.
We also note that burst oscillations also appear in the rising phaseof the bursts (e.g. left-hand panels of Fig. 2b). The mechanism ofburst oscillations might be different between the rising and decayingphase. The burst oscillations in the rising phase may be caused byasymmetries due to initially localized nuclear burning that laterspreads over the surface of the NS (e.g. Strohmayer et al. 1996;Chakraborty & Bhattacharyya 2014).
In the case of changes of the fc in the NS atmosphere, the NS at-mosphere model of Suleimanov et al. (2011a) suggests that fc shoulddecrease as the flux decreases during the burst decay. In Section 3.2,we analysed the fc during the burst decay phase assuming a constantemitting NS surface. We found that in the early decay phase, theevolution of fc in the bursts without oscillations (see the right-handpanels of Figs 3a and b) can be qualitatively well-described by theatmosphere models of Suleimanov et al. (2011a). On the other hand,bursts with oscillations always show a roughly constant fc, whichdisagrees with the atmosphere models. In particular, these are thehard state bursts that Suleimanov et al. (2011a) have pointed to asbeing more reliable for comparison to spectral models, and thus foruse in mass-radius constraints.
In the bursts with oscillations, in order to produce asymmetricemission, only part of the NS surface is burning, which contradictsthe assumption in Suleimanov et al. (2011a) that the emission shouldcome from the whole surface of the NS. 4U 1728–34 is likely aUCXB (Cumming 2003; Shaposhnikov et al. 2003; Galloway et al.2008), so all the bursts should ignite in an NS atmosphere withsimilar chemical composition and have similar curves in the N
−1/4BB -
flux diagram. In Fig. 5, we show that bursts with a flat N−1/4BB -flux
relation appear preferentially in the soft state. Kajava et al. (2014)found that the X-ray spectrum in the burst decay cannot be describedby the model of Suleimanov et al. (2011a) when the source is in thesoft state. Kajava et al. (2014) suggested that in the soft state thesmall inner radius of the accretion disc and the high-mass accretionrate can affect the emission from the NS atmosphere. Our resultsindicate that the behaviour of fc in the bursts with oscillations in4U 1728–34 cannot be explained by the model of Suleimanov et al.(2011a).
4.3 X-ray light-curve profiles and burst oscillations
The light-curve profiles are also different between the bursts withand without oscillations in 4U 1728–34. In the rise phase of theburst, the light curve of bursts with oscillations increases fasterthan in bursts without oscillations. Around the peak of the burst(e.g. within 50 per cent of the peak flux) the light curve of the burstswithout oscillations show smooth and symmetric profiles (see right-hand panel of Fig. 8), whereas, in bursts with oscillations the lightcurves show sharp and asymmetric profiles (see left-hand panel ofFig. 8). The shape of the light curve during the rising phase alsoshows different behaviours in bursts with and without oscillations.The convexity takes only positive values in bursts without oscilla-tions whereas it shows both positive and negative values in burstwith oscillations.
The shape, time-scale and peak flux of the light curve of a burstcan vary substantially depending on factors such as the ignitionlatitude, rotation rate of the NS, the accretion rate and the composi-tion of the accreted material (e.g. Taam et al. 1993; Woosley et al.2004; Weinberg, Bildsten & Schatz 2006). There are no simple an-alytic models that take into account all of the relevant parametersyet. Maurer & Watts (2008) developed a phenomenological modelof the burst rise process and showed that simple measures of the
MNRAS 455, 2004–2017 (2016)
Dow
nloaded from https://academ
ic.oup.com/m
nras/article-abstract/455/2/2004/1123266 by University Library user on 15 N
ovember 2018
X-ray bursts in 4U 1728–34 2017
burst morphology can be robust diagnostics of ignition latitude andburning regime.
They simulated burst light curves with ignition at different lati-tudes on the NS surface, and they found that bursts that ignite nearthe equator always show positive convexity, whereas bursts that ig-nite near the poles show either positive or negative convexity values.They also found that the chemical composition of the burning mate-rial has a strong influence on convexity, and the rise times increaseas the ignition point moves towards the poles.
4U 1728–34 is an UCXB (H-poor donor), and has only helium-rich bursts with short rise times and similar duration (Franco 2001;van Straaten et al. 2001; Shaposhnikov et al. 2003; Galloway et al.2008). Therefore, the chemical composition does not have a biginfluence on the convexity and rise time of the bursts in 4U 1728–34.Simulations from Maurer & Watts (2008) show that the differentinclinations and source rotation rate have a very small effect onconvexity. So, only the ignition latitude must have a strong influenceon the burst properties in 4U 1729–34. This suggests that bursts withoscillations in 4U 1728–34 ignite at high latitudes, whereas burstswithout oscillations ignite at low latitudes on the NS surface. Thisis consistent with the findings of Zhang et al. (2013) in the case of4U 1636–53.
5 C O N C L U S I O N
We analysed 121 Type-I X-ray bursts in the accreting NS LMXBsystem 4U 1728–34. We found that
(i) the rise time and convexity in bursts with and without oscilla-tions are different. Bursts with oscillations have short rise time andboth positive and negative convexity values, whereas bursts withoutoscillations have long rise time and only positive convexity values.
(ii) Around the peak of the burst, the light curves are more asym-metric in bursts with oscillations than in bursts without oscillations.
(iii) In the early decay phase of the bursts, the energy spectrumis different in bursts with and without oscillations. The spectrumcan be explained by the NS atmosphere model only in the burstswithout oscillations.
(iv) During the cooling phase, bursts in which the blackbodyradius remains more or less constant for >2 s show coherent os-cillations, whereas bursts in which the blackbody radius changesrapidly show no coherent oscillations.
(v) Bursts with oscillations ignite at high latitude when massaccretion rate on to the NS surface is high, whereas burst withoutoscillations ignite at low latitude when mass accretion rate is low.
AC K N OW L E D G E M E N T S
This research has made use of data obtained from the High EnergyAstrophysics Science Archive Research Center (HEASARC), pro-vided by NASAs Goddard Space Flight Center. We thank DuncanGalloway and Yuri Cavecchi for useful comments and discussions.GZ, MZ and AC are members of an International Team in SpaceScience on thermonuclear bursts sponsored by the InternationalSpace Science Institute in Bern, Switzerland. AC is supported byan NSERC Discovery Grant.
R E F E R E N C E S
Arnaud K. A., 1996, in Jacoby G. H., Barnes J., eds, ASP Conf. Ser. Vol.101, Astronomical Data Analysis Software and Systems V. Astron. Soc.Pac., San Francisco, p. 17
Basinska E. M., Lewin W. H. G., Sztajno M., Cominsky L. R., MarshallF. J., 1984, ApJ, 281, 337
Berger M. et al., 1996, ApJ, 469, L13Bildsten L., 1995, ApJ, 438, 852Chakrabarty D., Morgan E. H., Muno M. P., Galloway D. K., Wijnands R.,
van der Klis M., Markwardt C. B., 2003, Nature, 424, 42Chakraborty M., Bhattacharyya S., 2014, ApJ, 792, 4Cumming A., 2003, ApJ, 595, 1077D’Aı A. et al., 2006, A&A, 448, 817Di Salvo T., Iaria R., Burderi L., Robba N. R., 2000, ApJ, 542, 1034Forman W., Tananbaum H., Jones C., 1976, ApJ, 206, L29Franco L. M., 2001, ApJ, 554, 340Fryxell B. A., Woosley S. E., 1982, ApJ, 261, 332Galloway D. K., Muno M. P., Hartman J. M., Psaltis D., Chakrabarty D.,
2008, ApJS, 179, 360Garcıa F., Zhang G., Mendez M., 2013, MNRAS, 429, 3266Hasinger G., van der Klis M., 1989, A&A, 225, 79Jahoda K., Swank J. H., Giles A. B., Stark M. J., Strohmayer T., Zhang W.,
Morgan E. H., 1996, Proc. SPIE, 2808, 59Jahoda K., Markwardt C. B., Radeva Y., Rots A. H., Stark M. J., Swank
J. H., Strohmayer T. E., Zhang W., 2006, ApJS, 163, 401Kajava J. J. E. et al., 2014, MNRAS, 445, 4218Kuulkers E., Homan J., van der Klis M., Lewin W. H. G., Mendez M., 2002,
A&A, 382, L947Lewin W. H. G., van Paradijs J., Taam R. E., 1993, Space Sci. Rev., 62, 223Maurer I., Watts A. L., 2008, MNRAS, 383, L387Mendez M., van der Klis M., Ford E. C., Wijnands R., van Paradijs J., 1999,
ApJ, 511, L49Muno M. P., Chakrabarty D., Galloway D. K., Savov P., 2001, ApJ, 553,
L157Muno M. P., Galloway D. K., Chakrabarty D., 2004, ApJ, 608, 930Poutanen J., Nattila J., Kajava J. J. E., Latvala O.-M., Galloway D. K.,
Kuulkers E., Suleimanov V. F., 2014, MNRAS, 442, 3777Shaposhnikov N., Titarchuk L., Haberl F., 2003, ApJ, 593, L35Spitkovsky A., Levin Y., Ushomirsky G., 2002, ApJ, 566, 1018Strohmayer T., Bildsten L., 2003, preprint (astro-ph/0301544)Strohmayer T. E., Markwardt C. B., 1999, ApJ, 516, L81Strohmayer T. E., Zhang W., Swank J. H., Smale A., Titarchuk L., Day C.,
Lee U., 1996, ApJ, 469, L9Strohmayer T. E., Zhang W., Swank J. H., 1997, ApJ, 487, L77Suleimanov V., Poutanen J., Werner K., 2011a, A&A, 527, A139Suleimanov V., Poutanen J., Revnivtsev M., Werner K., 2011b, ApJ, 742,
122Taam R. E., Woosley S. E., Weaver T. A., Lamb D. Q., 1993, ApJ, 413, 324van Paradijs J., 1978, Nature, 274, 650van Paradijs J., 1982, A&A, 107, 51van Straaten S., van der Klis M., Kuulkers E., Mendez M., 2001, ApJ, 551,
907van Straaten S., van der Klis M., di Salvo T., Belloni T., 2002, ApJ, 568,
912Weinberg N. N., Bildsten L., Schatz H., 2006, ApJ, 639, 1018Woosley S. E. et al., 2004, ApJS, 151, 75Zhang G., Mendez M., Altamirano D., 2011, MNRAS, 413, 1913Zhang G., Mendez M., Belloni T. M., Homan J., 2013, MNRAS, 436, 2276
S U P P O RT I N G IN F O R M AT I O N
Additional Supporting Information may be found in the online ver-sion of this article:
Table 1. All parameters of Type-I X-ray bursts in 4U 1728–34 observed with RXTE (http://mnras.oxfordjournals.org/lookup/suppl/doi:10.1093/mnras/stv2482/-/DC1).
Please note: Oxford University Press is not responsible for thecontent or functionality of any supporting materials supplied bythe authors. Any queries (other than missing material) should bedirected to the corresponding author for the article.
This paper has been typeset from a TEX/LATEX file prepared by the author.
MNRAS 455, 2004–2017 (2016)
Dow
nloaded from https://academ
ic.oup.com/m
nras/article-abstract/455/2/2004/1123266 by University Library user on 15 N