Google.com University of Hawai`i at Mānoa Department of Economics Working Paper Series Saunders Hall 542, 2424 Maile Way, Honolulu, HI 96822 Phone: (808) 956 -8496 www.economics.hawaii.edu Working Paper No. 12-5 Fire-Sale FDI? The Impact of Financial Crisis on Foreign Direct Investment by Olga Bogach & Ilan Noy March 2012
Transcript
Google.com
University of Hawai`i at Mānoa Department of Economics
Working Paper Series
Saunders Hall 542, 2424 Maile Way,Honolulu, HI 96822
Phone: (808) 956 -8496www.economics.hawaii.edu
Working Paper No. 12-5
Fire-Sale FDI? The Impact of Financial Crisis on Foreign Direct Investment
by Olga Bogach & Ilan Noy
March 2012
Fire-Sale FDI? The Impact of Financial Crises on Foreign Direct Investment
Olga Bogach* & Ilan Noy
Department of Economics University of Hawai’i at Manoa
In this paper, we analyze the evolution of foreign direct investment (FDI) inflows to developing and emerging countries around financial crises. We empirically and thoroughly examine the Fire-Sale FDI hypothesis and describe the pattern of FDI inflows surrounding financial crises. We also add a more granular detail about the types of financial crises and their potentially differential effects on FDI. We distinguish between Mergers and Acquisitions (M&A) and Greenfield investment, as well as between different motivations for FDI—horizontal (tariff jumping) and vertical (integrating production stages). We find that financial crises have a strong negative effect on inward FDI in our sample. Crises are also shown to reduce the value of horizontal and vertical FDI. We do not find empirical evidence of Fire-Sale FDI. On the contrary, financial crises are shown to affect FDI flows and M&A activity adversely.
JEL Classification: F21, F23, F29, G01, G34 Keywords: International investment, Foreign direct investment (FDI), Financial crises, Mergers and Acquisitions, Multinational firms *(corresponding author) Department of Economics, University of Hawai‘i at Mānoa, Saunders Hall 540, Honolulu, HI 96822, Email: [email protected].
Paul Krugman, in a much cited paper on the Asian 1997-8 crisis, starts by arguing
that: “hard statistical evidence of a surge in FDI into Asia was not yet available” but that
anecdotal evidence strongly suggests an inflow of FDI in the post-crisis period (Krugman,
2000, p. 44). Yet, the idea that financial crises are sometime also accompanied by Fire-
Sale FDI (the title of Krugman’s paper) caught on. Krugman concludes his paper, written
sometime in 1998, noting that: “What we need—surprise—is more research.” We
believe this is still the case today. There is very little research that attempts to
systematically document the evolution of foreign direct investment around financial
crises.1 This is what we do in this paper.
The importance of foreign direct investment (FDI) to the global economy in the last few
decades is quite obvious, with increasing volumes of FDI flowing between, into and
more recently from the developing countries and emerging markets (see Table 1). In
2010, for the first time, developing and transition economies together attracted more
than half of global FDI flows (UNCTAD World Investment Report 2010). Even though the
theoretical literature in economics has identified several channels through which FDI
inflows are predicted to benefit the receiving economy, the empirical literature has
lagged behind and has had more trouble identifying these advantages in practice.
Notwithstanding these uncertain empirical observations, most countries continue to
rigorously pursue policies aimed at encouraging more FDI inflows.
1 Notable exceptions are Aguiar and Gopinath (2005) measurement of the increase in foreign firms’ M&A activity during the Asian crisis, and Acharya et al. (2011) who provide a theoretical background to the empricial insights provided by the former paper about the effect of the Asian currency crises. UNCTAD (2000) describes some of the underlying data.
2
While much of the literature on FDI focuses on the impact of FDI on
technological transfer, increasing productivity and production, one frequently identified
advantage of FDI flows is its perceived stability relative to other types of capital flows.
Empirical research shows that FDI flows tend to be much less volatile than equity flows
or bank lending, for example (Osei et al., 2002). A related and intriguing hypothesis is
that, unlike other types of capital flows, FDI tends to ‘lean against the wind’ and inflows
may increase during a financial crisis, when all other types of capital are fleeing the
scene.
In this paper, we analyze the pattern of FDI inflows to emerging and developing
countries focusing on the impact of financial crises on these flows. We contribute in
several ways. Our paper is the first to empirically and thoroughly examine the Fire-Sale
FDI hypothesis and describe the pattern of FDI inflows surrounding financial crises. We
further contribute by adding more granular detail about the types of financial crises and
their potentially differential effects on FDI—this was after all the subject of Krugman’s
(2000) paper, in which he analyzed the predictions of various theoretical crisis models
on the viability of FDI. We also expect differing types of FDI to react differently to
financial turmoil, and we therefore distinguish between different types of FDI—i.e.,
Mergers and Acquisitions (M&A) and Greenfield investments—and between different
motivations for FDI—horizontal (tariff jumping) and vertical (integrating production
stages).
Below we describe the hypotheses we investigate in some detail, and within the
context of the few papers that had looked at these questions. Section 3 then presents
3
our data on the various types of FDI and the typology of financial crises we use, the
empirical model and the estimation methodology. Section 4 analyzes our results and
discusses these results within the context of the ongoing global crisis that started in
September 2008.
2. Different Crises, Different FDI, and Different Impacts
2.1 A Typology of Financial Crises and their Impacts
Since the re-emergence of financial turmoil during the 1970s, the economic
literature on the topic has developed rapidly. The literature initially focused on currency
crises, the mainstay of the 1970s turmoil, but later on also investigated banking crises,
periods of high or hyper-inflation, and the debt crises of the 1980s, and finally in the
1990s, crises of capital flow reversals (the so-called Sudden Stops). However, since FDI
emerged on the international scene in significant amount only in the 1980s, we use data
for 1987-2009, and examine all these types of financial crises.
The two early generations of the theoretical currency crisis literature
emphasized different fundamental reasons for a crisis. The first-generation models
emphasized fiscal sustainability and the inevitability of crisis given fiscal policy choices
(Krugman, 1979, Flood and Garber, 1984 and Burnside et al., 2001). In these models, the
exchange rate peg is dropped during the crisis and the exchange rate continues to
depreciate so long as the government continues to monetize its deficit. There is no real
exchange rate change and therefore incentives for embarking on FDI projects do not
change. The second generation of this literature, however, emphasizes multiple
4
equilibria, and implies that crisis equilibrium may entail new opportunities for foreign
direct investment since the real exchange rate depreciation is not necessarily related to
a cyclical deterioration of the economy but potentially to shifts in expectations (e.g.,
Obstfeld, 1994, Drazen and Masson, 1994, Chamley, 2003).
The decade following the Asian crisis of 1997-8 yielded a new crop of crisis
modeling, with many models emphasizing the importance of moral hazard created by
government guarantees (Corsetti et al., 1999 and Dooley, 2000). These models largely
imply a collapse of an over-investment bubble, and therefore very weak incentives for
FDI in the crisis aftermath. A separate group of crisis models emphasize Diamond-Dybvig
type banking runs and the breakdown in financial intermediation (e.g., Chang and
Velasco, 2001, Uhlig, 2010); these, like the second generation currency crisis literature,
may present opportunities for FDI.
A different crop of theory papers emphasize the reversals of capital flows
(‘Sudden Stops’ as coined by Calvo, 1998) and their impact on the domestic economy.
Sudden stops have been found to lead to dramatic if temporary output contractions
especially if they involve a Fisherian debt deflation cycle (e.g., Hutchison and Noy, 2006,
Mendoza, 2010). In these cases, the deep recession will likely weaken the incentives of
foreign investors to enter the domestic market, and therefore these crises are predicted
to reduce horizontal FDI. The possible impact of debt crises and the accompanying debt
defaults are more difficult to characterize, since the impact of debt defaults is not well
established (e.g., Rose, 2005). Even less well known are the differences in the
macroeconomic consequences of domestic versus foreign debt defaults/crises.
5
We follow Krugman in arguing that in order to formulate a clear hypothesis on
the impact of financial crises on FDI, one needs to understand the fundamental
mechanisms that cause and shape the evolution of financial crises in the first place. In
empirical terms, this means we need to control for the type of crisis a country
experiences when evaluating the crisis impact on FDI. We are the first paper to have
attempted to do that.
2.2 Types of FDI and their Vulnerability to Financial Crises
As we have already observed, financial crises that are caused by different
phenomena are predicted to have different consequences for the domestic economy. In
particular, some will lead to domestic contractions (maybe even deep recessions), while
others may lead to an expansionary depreciation. Equally, a financial/monetary crisis
may not have much impact on the real economy and therefore fail to affect the
incentives faced by international investors. These different outcomes will potentially
also impact distinctively the differing forms of direct investment; with the relative
attractiveness of investing in existing infrastructure, through M&A, relative to
constructing new production facilities (greenfield investment) may be shifting as well.
These distinctions also relate to the different time horizons that M&A and
greenfield investment entail. M&A can typically be implemented much more quickly,
since it does not entail a time-consuming permitting stage that typically accompanies
new projects (especially in emerging markets). If a crisis is predicted to be short-lived,
6
and especially if a real depreciation is perceived to be temporary, an M&A boom, as
compared to an increase in greenfield investment, is likely to be observed.
Following the FDI literature, we also distinguish between horizontal and vertical
FDI (Aizenman and Marion, 2004). We examine the hypothesis that the differences
between the motivations for FDI also matter for their vulnerability to financial crises.
Horizontal FDI targets the domestic market (or maybe neighboring markets), so that a
financial crisis that entails a real contraction will adversely affect horizontal FDI. Vertical
FDI, on the other hand, is mostly concerned with production costs (and production
quality); in this case a real depreciation may be very beneficial for integrating
production networks vertically by reducing the costs associated with this process,
whatever the state of the domestic/host economy is and will likely remain. Vertical FDI
is also more closely associated with increased trade, and therefore can also be affected
by the impacts of financial crises on trade relations (Aizenman and Noy, 2006 and 2009).
Empirically, we employ a country-panel regression approach using Arellano-Bond
(AB) GMM estimation. AB GMM is by now the standard in the international macro
literature that uses country time series panels and we therefore do not include a
detailed discussion of the estimation algorithm and its justification. It is worth noting
that the algorithm enables us to disregard the time-invariant institutional, legal and
cultural environment in which FDI projects are implemented and which may have an
important impact on FDI inflows, and also deal with some types of endogeneity (though
at least reverse causality is not a major concern in this case as few commentators view
FDI as potentially destabilizing for the financial system).
7
2.3 Relevant Previous Empirical Work on FDI
Beyond the papers that focus on the Fire-Sale FDI of the Asian Crisis of 1997-
1998 (Aguiar and Gopinath (2005) and Acharya et al. (2011)), the only other paper that
looks at a similar question is Soliman (2005) who analyzes the impact of currency crises
on outgoing U.S. FDI and finds some evidence of a Fire-Sale (or at least an increase in
FDI following the crisis). Several other papers that directly relate to our research
program are worth mentioning.
Alfaro et al. (2004) focus on the ways in which the growth effects of FDI depend
on the strength of the domestic financial markets of the host country. The implication of
their findings appears to be that a country with post-crisis weakened financial sector will
likely gain less from FDI (FDI will be less productive) and therefore will experience
reduced inflows. Dell’Ariccia et al. (2008) present related evidence on the heighted
vulnerability to financial dis-intermediation of sectors that rely on foreign investment.
Several papers have also investigated the response of foreign multinationals to a sharp
depreciation of the currency in the host economy, without directly examining FDI. Using
U.S. multinational data, for example, Desai et al. (2008) find that foreign firms increase
their own investment, following a large depreciation, relative to domestic firms.
3. Data Sources, Descriptive Statistics and Estimation
Blonigen and Wang (2005) and Noy and Vu (2007) argue that mixing wealthy and
poor countries is inappropriate in empirical FDI studies. They note that the factors that
8
affect FDI inflows are different across income groups. We therefore focus only on
developing/emerging markets. We leave a similar investigation for developed countries
for future work. We also exclude OPEC member countries as their FDI is heavily
concentrated in natural resources. Our sample therefore contains 40
emerging/developing countries (a detailed list is included in the appendix Table A). Our
data cover yearly observations for the period of 1987-2009. Appendix Table C contains a
full list of data sources used in our analysis.
3.1. M&A, greenfield, horizontal and vertical FDI
Only a few papers have distinguished between different types of FDI and treated
them as separate types of capital flows. A recent example, Wang and Wong (2009)
investigate the growth impact of M&A and Greenfield foreign direct investment
separately, as does an earlier paper by Calderón et al. (2004). More directly relevant to
our work, Alquist et al. (2009) investigate whether M&A projects that were
implemented in a post-crisis environment (i.e., Fire-Sale M&A) fail more often that non-
crisis-induced M&A.
Given a lack of common source for FDI data, we collected data on four different
FDI measures that have been typically used in previous studies: FDI flows, FDI stocks,
Mergers and Acquisitions (M&A), and foreign affiliate sales.
Our source of cross-country FDI flows, stocks, and cross-border mergers and
acquisitions (M&A) is UNCTAD’s FDI database, compiled by Thomson Financial. UNCTAD
classifies foreign direct investment as an “investment involving a long-term relationship
9
and reflecting a lasting interest and control by a resident entity in one economy of an
enterprise resident in a different economy” (UNCTAD, 2009). M&A are defined as the
mergers with, or acquisitions of, domestic firms by a single foreign investor with more
than ten percent equity capital. Data on cross border M&A have been used in such
studies as Rossi and Volpin (2004) and Head and Reis (2008). One limitation of this
dataset is a substantial amount of missing values, and possibility of significant
underreporting, since many of the transactions are between private firms.
Following Calderon et al. (2004) and Wang and Wong (2009), we construct a
measure of greenfield FDI by subtracting cross-border M&As from FDI inflows. While
this proxy is not ideal, UNCTAD documents that FDI can be considered approximately as
the sum of greenfield investment and M&As (UNCTAD, 2000, p.114-119)2.
To distinguish between horizontal and vertical FDI, we use the destination
market for the sales of U.S. multinationals since 1987 (data from the U.S. Bureau of
Economic Analysis ). Following Hanson et al. (2002) and Aizenman and Marion (2004),
we measure vertical investment as affiliate sales either back to the U.S. or to other
foreign countries. Horizontal investment is defined by affiliate sales in the local market
where the affiliate resides. The assumption is that the latter are sales of final goods,
while the former represent intermediate goods requiring further processing in the
parent country or a third county. This is the best available metric to distinguish between
horizontal and vertical FDI. Moreover, several studies (e.g., Carr, et al., 2001, and
2 Given the lack of existing greenfield investment data, this measure is the most natural alternative proxy. However, since FDI data are reported on a balance-of-payment basis, where inward FDI in a host country is measured as the aggregation of greenfield investment, M&A sales, re-investments, and disinvestments undertaken by MNCs, this proxy does not perfectly reflect the actual value of greenfield investment.
10
Bergstrand and Effer, 2007) have stressed the use of affiliate sales as the most
appropriate measure of actual multinational firm activity in a host country.
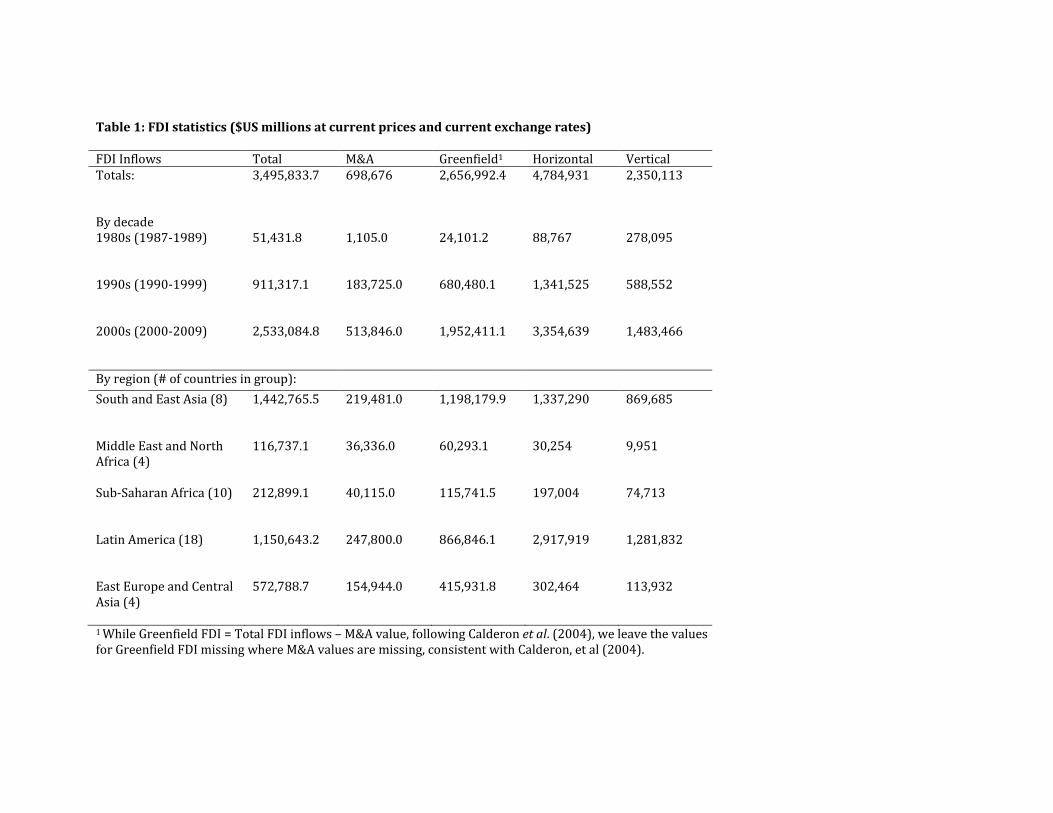
Table 1 reports FDI statistics for our sample of 44 developing countries by region,
decade and type of FDI. We note that well known dramatic increase in FDI volumes over
the last 30 years that is observable for all regions and all types of FDI. We also observe
that comparatively, FDI in Asia is more vertical, and less M&A compared to Latin
America, the other region that receives a lot of FDI.
[Insert Table 1 Here]
3.2. Typology of crises and data sources
The literature on financial crises is quite large, but only in the last few years a
typology of crises has become used more often, especially since the publication of the
comprehensive examination of the historical record provided by Reinhart and Rogoff
(2009). We follow Reinhart and Rogoff (henceforth R&R) in identifying banking,
currency, debt (external and domestic), stock market, and inflation crises. We also
distinguish severe crises: systemic banking crises (as identified by bank runs that lead to
the closure, merging, or takeover by the public sector of one or more financial
institutions), and hyperinflation crises (identified as an annual inflation rate of 500% or
higher).
R&R’s comprehensive data set on financial crises provides data on the dating of
various types of crises in seventy countries over the period 1970-2010. It builds heavily
on the work of earlier scholars, but also employs a considerable amount of new material
11
from diverse primary and secondary sources. We focus on the period of 1987-2009
when FDI became prevalent in developing countries.
To identify systemic banking crises, we use a database developed by Leaven and
Valencia (2010). The database builds on the Caprio, et al. (2005) banking crisis database
and covers worldwide systemic banking crises for the period of 1970-2007. We provide
detailed definitions of the typology of crises in the Appendix Table B.
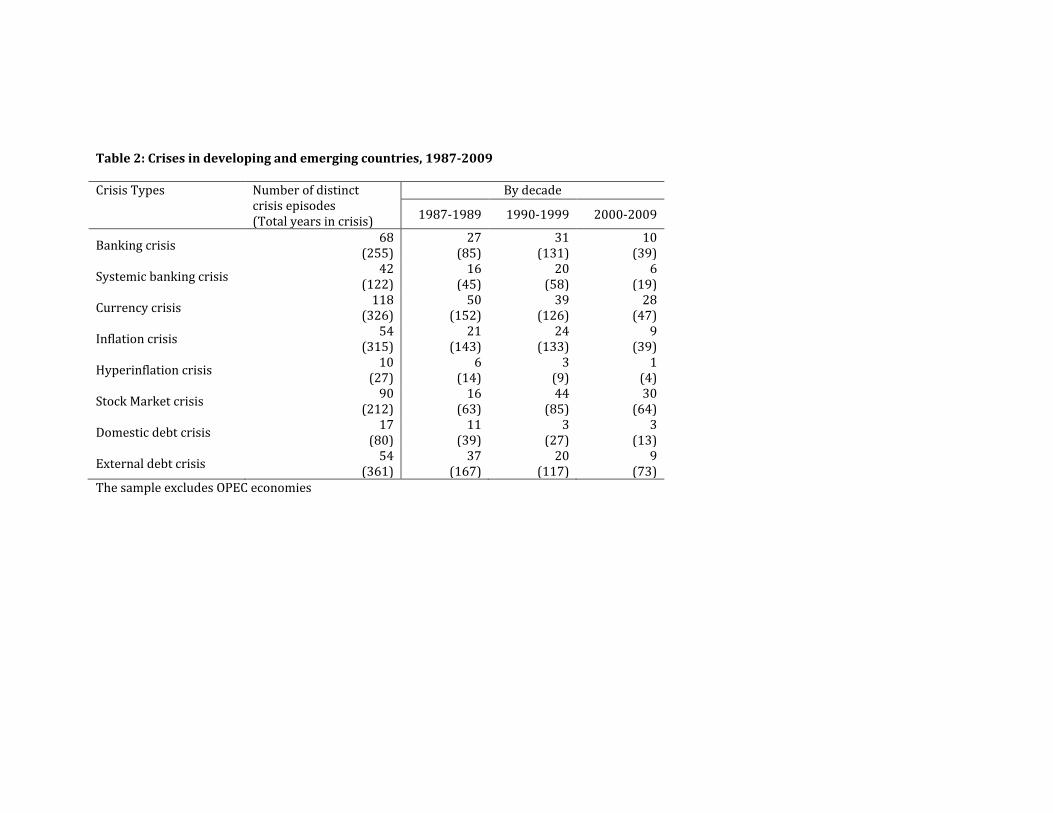
Table 2 presents a summary of our data on crisis types in our sample. It reports
the number of distinct crises episodes as well as the total number of years in crises by
crisis type and by decade.
[Insert Table 2 Here]
As can be seen from Table 2, developing countries have been prone to financial
crises in the last two decades. In the period of 1987-2009, developing countries
experienced 68 distinct banking crises episodes, 42 of which constituted systemic
banking crises. Currency crises occurred in developing countries 118 times, adding up to
a total of 326 years of currency crises, or an average of 8 years per country. Inflation
crises were less prevalent – 54 distinct episodes with 10 hyperinflation episodes. Stock
markets crashed a total of 90 times, and there were 54 (17) episodes of external
(domestic) debt crises. There is no apparent increasing time trend in the frequency of
crises among developing/emerging countries, in spite of the recent global turmoil.
3.3. Control variables
Our main concern in the choice of additional variables to include in our
estimation is to prevent any omitted variables bias from affecting the estimates we
12
obtain for our RHS variables of interest (the financial crisis indicators). Given this
concern, we choose to err on the side of caution and include an extensive list of
controls. Blonigen and Piger (2011) conclude, using Bayesian averaging technique, that a
fairly extensive list of controls should be included in FDI regressions, though they also
point to a few that are probably not robustly associated with FDI.
Adhering to their findings, we control for broad macroeconomic conditions,
political, socio-economic, and business environment in the host country by using a set of
indicators on corruption, government stability, and investment climate from the
Freedom House and International Country Risk Guide – Political Risk Service (ICRG-PRS)
databases. We also include measures from the World Bank’s World Development
Indicators (WDI) on relative factor endowments, communications infrastructure, and
trade costs. Finally, we control for geographic spatial issues and possible agglomeration
effects by using the data from Penn World Tables and CEPII Gravity data set (Head et al.,
2010). Additional data sources for our control variables are Barro and Lee (education
data set) and Li et al. (2011) dataset on per capita real capital.
The list of all controls used in our analyses and the corresponding data sources is
included in the appendix Table C. For readability, we do not include coefficients for
these controls in the reported regressions in tables 3-8; complete results are available
upon request.
3.4. Estimation Methodology
We estimate the following equation:
13
1 2 3T Pit it it itFDI CRIS Xβ β β ε= + + + (1)
Where TitFDI is the measure of FDI inflows for country i in year t, and of type T (M&A,
greenfield, horizontal, vertical), PitCRIS is the binary crisis indicator for crisis type P, and
itX is a vector of control variables as described the previous section. We use panel
Arellano-Bond GMM estimation (with STATA) instead of relying on the cross-sectional
datasets that are sometimes used in the FDI literature. Using panel estimation highlights
several advantages over a conventional cross-section. Panel estimation methods offer
us a way to control for unobservable time-invariant effects and hence give more reliable
estimates, while the AB-GMM estimation algorithm allows us to control for potential
endogeneity of some of the control variables within the context of a dynamic panel.
We treat the crisis variable as predetermined, assuming that the current period
error term is uncorrelated with current and lagged crises, but may be correlated with
the future crises. It is a weaker restriction than strict exogeneity, which requires the
variable to be uncorrelated with past, present, and future shocks. We also follow the
standard practice of reporting the one-step estimates as Arellano and Bond (1991) show
that the two-step procedure has poor finite sample properties.
A final issue that we should address is that of using too many instruments. When
using estimators of this type, the number of instruments will increase at a rate that is
quadratic in T. As discussed by Roodman (2009), the fundamental issue here is that
when there are too many instruments relative to the sample size, the R2 on the first
stage will approach unity and so the second stage estimator will be almost equivalent to
14
OLS. To address this problem, we follow the literature and limit the maximum number
of lags that can be used as instruments at one.
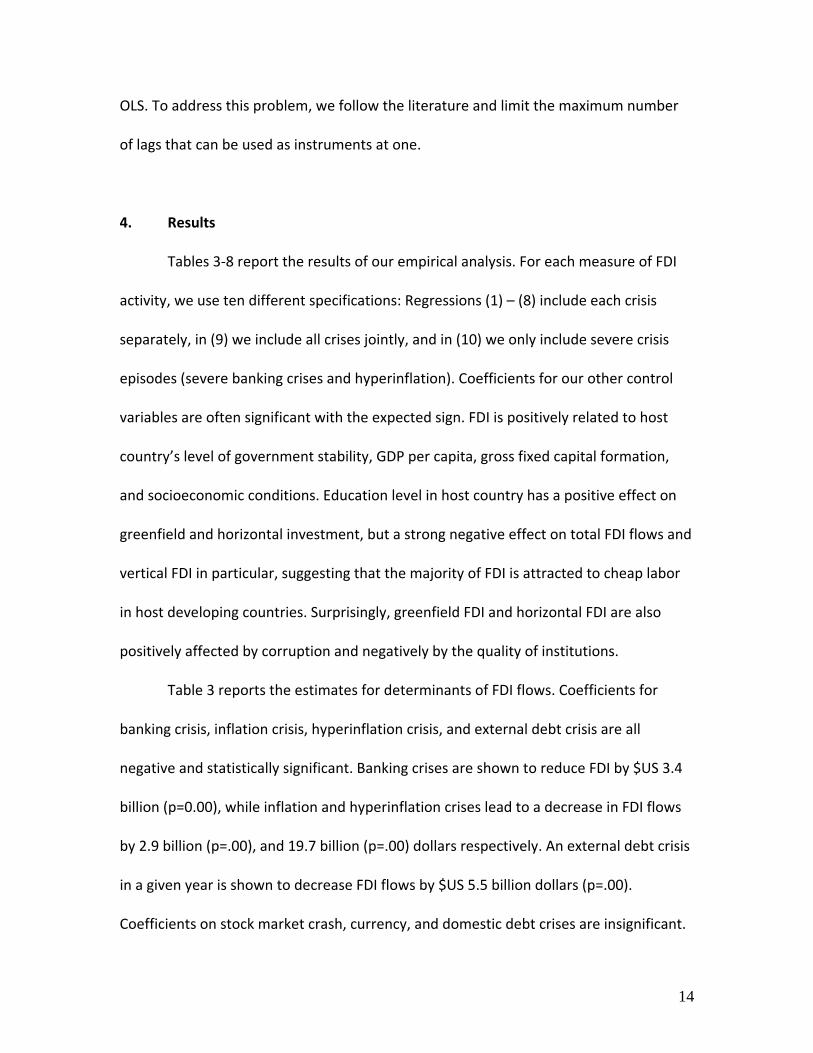
4. Results
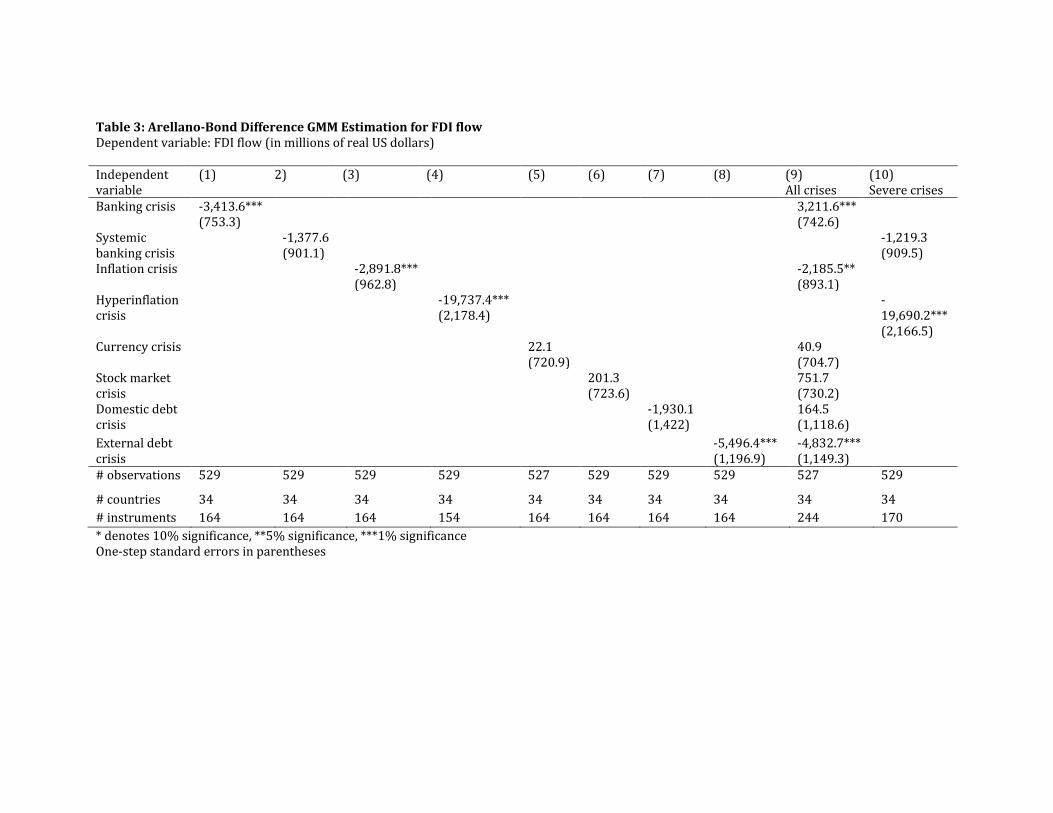
Tables 3-8 report the results of our empirical analysis. For each measure of FDI
activity, we use ten different specifications: Regressions (1) – (8) include each crisis
separately, in (9) we include all crises jointly, and in (10) we only include severe crisis
episodes (severe banking crises and hyperinflation). Coefficients for our other control
variables are often significant with the expected sign. FDI is positively related to host
country’s level of government stability, GDP per capita, gross fixed capital formation,
and socioeconomic conditions. Education level in host country has a positive effect on
greenfield and horizontal investment, but a strong negative effect on total FDI flows and
vertical FDI in particular, suggesting that the majority of FDI is attracted to cheap labor
in host developing countries. Surprisingly, greenfield FDI and horizontal FDI are also
positively affected by corruption and negatively by the quality of institutions.
Table 3 reports the estimates for determinants of FDI flows. Coefficients for
banking crisis, inflation crisis, hyperinflation crisis, and external debt crisis are all
negative and statistically significant. Banking crises are shown to reduce FDI by $US 3.4
billion (p=0.00), while inflation and hyperinflation crises lead to a decrease in FDI flows
by 2.9 billion (p=.00), and 19.7 billion (p=.00) dollars respectively. An external debt crisis
in a given year is shown to decrease FDI flows by $US 5.5 billion dollars (p=.00).
Coefficients on stock market crash, currency, and domestic debt crises are insignificant.
15
[Insert Table 3 here]
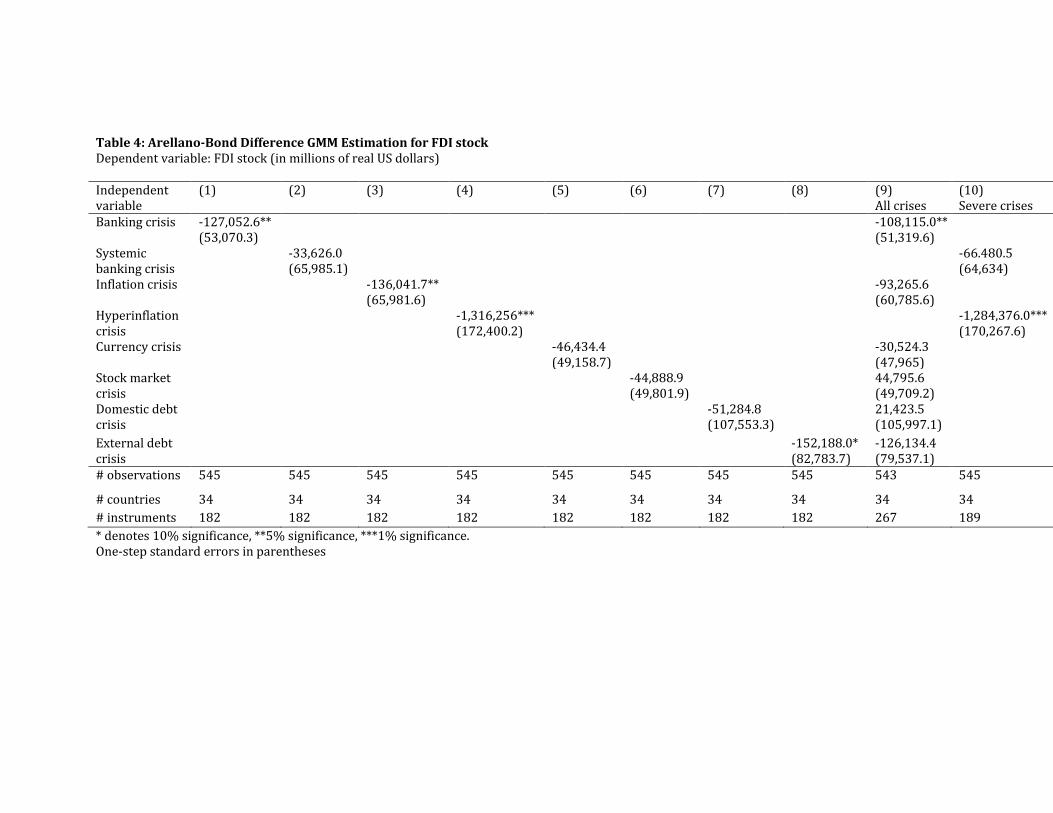
Table 4 reports the estimates for determinants of FDI stocks. Coefficients for
banking crisis, inflation crisis, and external debt crisis are all negative and statistically
significant, shown to reduce FDI by $US 127.1 billion, 136.0 billion (p=.04), and 152.2
billion (p=.07) dollars respectively. When only the severe crises are included, a
hyperinflation crisis in a given year is shown to decrease FDI stocks by $US 1,284.4
billion dollars (p=.00). Coefficients on stock market crash, currency, and domestic debt
crises are insignificant.
[Insert Table 4 here]
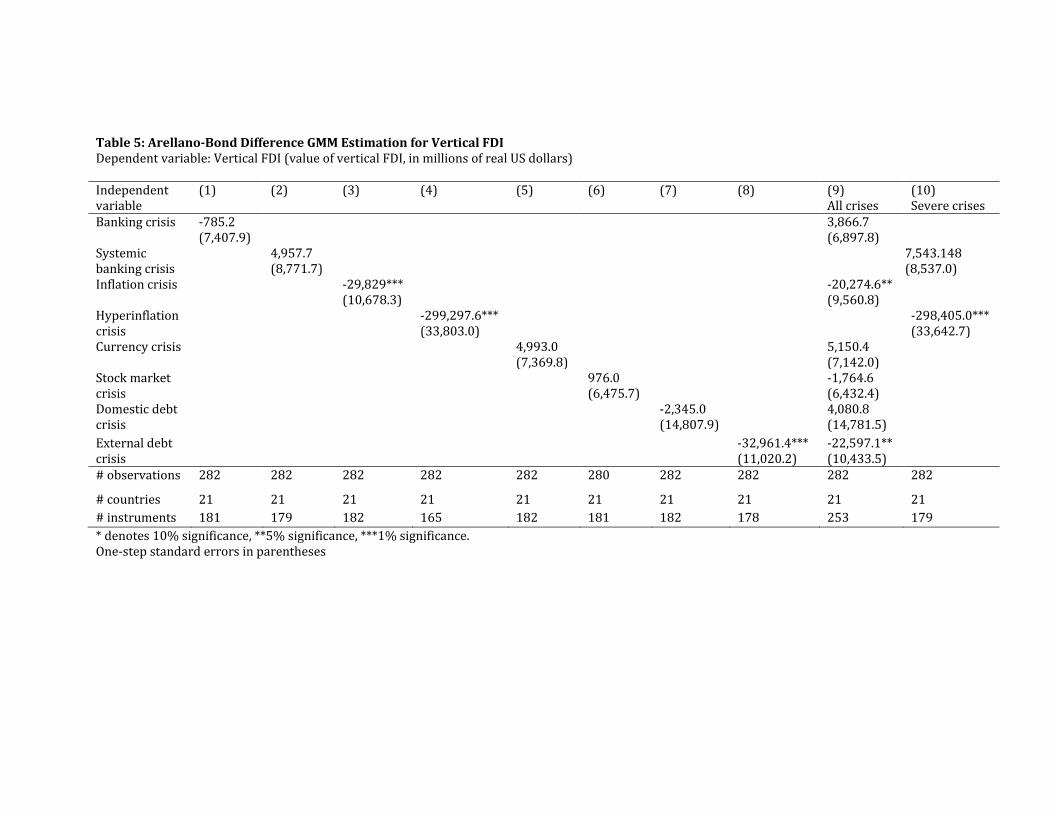
We then distinguish between the different motivations for FDI and examine the
effects of the crises on vertical and horizontal FDI separately. We observe in Table 5 that
an inflation crisis (and particularly a hyperinflation crisis) has a strong negative and
significant effect on vertical FDI in our sample. An inflation crisis in a given year is shown
to decrease vertical FDI by $US 29.8 billion (p=.01) Hyperinflation exaggerates this effect
tenfold to $US 299.3 billion (p=.00). External debt crises are also shown to reduce the
value of vertical FDI by $US 32.9 billion (p=.00). The effects of the other types of crises
on vertical FDI are shown to be insignificant.
[Insert Table 5 here]
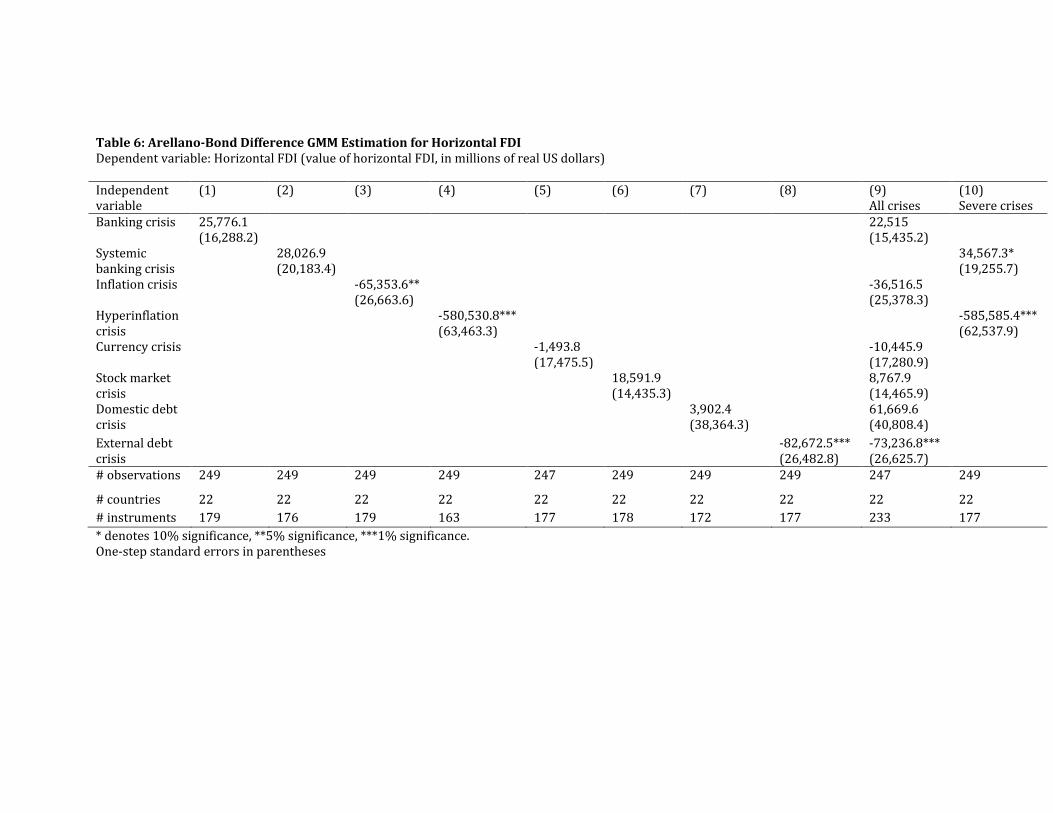
Horizontal FDI targets the domestic market, so we expect that a financial crisis
that entails a real contraction will adversely affect horizontal FDI. Indeed, we observe
(Table 5) the same types of crises that affect vertical FDI, have a strong negative effect
on horizontal investment. We find that an inflation crisis and hyperinflation crisis reduce
16
the value of horizontal FDI by $US 65.3 (p=.02) and $US 580.5 (p=.00) billion respectively
in a given year. External debt crisis also negatively impacts horizontal FDI, reducing its
value by $US 86.7 billion dollars (p=.00). We also find that a systemic banking crises
increases the value of horizontal FDI by $US 34.6 billion (p=.07).
[Insert Table 6 here]
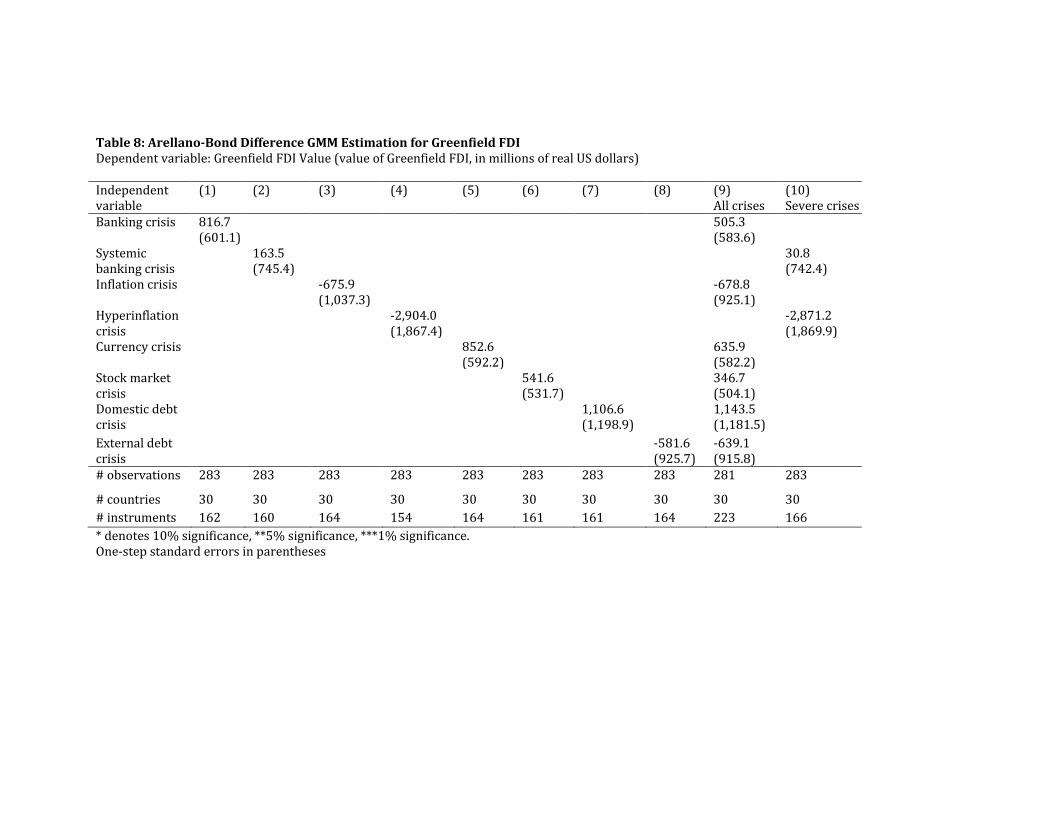
Table 7 reports our results on M&A investment. We find that, contrary to the
fire-sale FDI hypothesis, financial crises have a significant adverse effect on the value of
M&A. In particular, banking crises are shown to reduce M&A investment by $US 1.4
billion (p=.02). Both domestic and external debt crises also affect M&A investment
adversely, reducing its value by $US 2.4 (p=.04) and $US 1.6 (p=.05) billion dollars
respectively. This leads us to reject the fire-sale FDI hypothesis, and we discuss the
possible explanation behind this in the concluding section of the paper. Lastly, we
examine the effects of FDI on greenfield investment and find no significant effect.
[Insert Table 7 here]
To ensure the robustness of our results, we replicate our analysis using nominal
and logged values of FDI as dependent variable, and including additional lags of financial
crises. The signs and significance of our coefficients of interest remain largely
unchanged
5. Conclusions
We find that financial crises have an adverse effect on FDI in our sample of
developing and emerging countries. In particular, banking crises, inflation crises,
17
hyperinflation crises, and external debt crises lead to a significant decline in FDI inflows.
Crises are also shown to reduce the value of vertical FDI, horizontal investment, and
M&A. In general, we do not find empirical evidence of Fire-Sale FDI in our sample of
developing countries.
While these results may seem expected, they directly contradict Krugman’s Fire-
sale FDI hypothesis. Two possible explanations are rendered below. First, Krugman was
not wrong, but rather Asia was unique and the reasons for the Asian crisis different.
While Krugman focused on the Asian financial crises, our sample is broader both in the
coverage of countries and years. We find no evidence of fire-sale FDI following an
average financial crisis in developing countries. Secondly, as is the case with any
macroeconomic data, there are questions about the quality of FDI data (particularly,
M&A data) and it may be that the data are simply not good enough to identify the
pattern.
The topic of financial crises and FDI is an important and timely one today given
the rapidly spreading global financial turmoil and particularly the debt crises in Europe.
The findings of the paper are relevant not only because they evaluate the effects of
crises on FDI, but because they inform us about the types of crises that these countries
are experiencing. Just as Krugman concluded, observing or not observing fire-sale FDI
lends support to either the fundamental explanation or the panic view behind the cause
of the crisis. With regards to FDI, the findings are relevant as FDI is becoming
increasingly important as a form of capital flows, and changes in the valuation of FDI
projects also leads to significant international transfers of wealth.
18
Our results find support in the FDI turnaround that is apparent in the immediate
aftermath of the 2008-2010 economic downturn, by far the most global financial crisis
since the great depression (Bordo and Landon-Lane, 2010). While the long-run effects of
this global crisis still remain to be seen, the current global downturn has been
accompanied by a precipitous decline in FDI flows worldwide of 40% between the peak
in 2007 and the trough in 2009 (UNCTAD, 2011).
The recent crisis, of course, was global, so credit contracted everywhere; that is
not the usual turn of events surrounding a financial crisis that is limited to a specific
country and/or region. Yet, even in these cases, we observe large declines in FDI inflows
of all types. These findings do not contradict the consensus that FDI is preferable to ‘hot
money’ during times of financial turmoil. The FDI reversals that we record are still
probably much smaller than the reversals associated with other types of financial flows
(especially short-term lending and equity).
19
5. References
Acharya, Viral, Hyun-Song Shin and Tanju Yorulmazer. (2011) “Fire-sale FDI,” Mimeo. Aguiar, Mark, and Gita Gopinath. (2005) “Fire-Sale FDI and Liquidity Crises,” Review of Economics and Statistics, 87(3). Aizenman, Joshua, and Nancy Marion (2004). “The Merits of Horizontal Versus Vertical FDI in the Presence of Uncertainty, “ Journal of International Economics 62, 125– 148. Aizenman, Joshua and Ilan Noy. (2006) “FDI and Trade: Two Way Linkages?” Quarterly Review of Economics and Finance, 46(3), 317-337. Aizenman, Joshua and Ilan Noy. (2009) “Endogenous Financial and Trade Openness,” Review of Development Economics, 13(2), 175-189. Alfaro, L., Chanda, A., Kalemli-Ozcan, S. Sayek, S. (2004) “FDI and Economic Growth: The Role of Local Financial Markets,” Journal of International Economics 64, 89-112. Arellano, M. and S. Bond (1991) “Some Tests of Specification for Panel Data: Monte Carlo Evidence and an Application to Employment Equations,” Review of Economic Studies, 58(2), 277-297 Barro, R. and J. Lee. (2010) “A New Data Set of Educational Attainment in the World, 1950-2010,” NBER Working Paper No. 15902. Bergstrand, J and Egger, P. (2007) “A Knowledge-and-Physical-Capital Model of International Trade Flows, Foreign Direct Investment, and Multinational Enterprises,” Journal of International Economics, 73(2): 278-308. Blonigen, Bruce A., and Jeremy Piger. (2011) “Determinants of Foreign Direct Investment,” NBER working paper 16704. Blonigen, B., Wang, M. (2005). “Inappropriate Pooling of Wealthy and Poor Countries in Empirical FDI Studies,” In: Moran, T.H., Graham, E.M., Blomström, M. (Eds.), Does Foreign Direct Investment Promote Development? Institute of International Economics Press: Washington DC. Bordo, Michael D. and John S. Landon-Lane. (2010) “The Global Financial Crisis of 2007-08: Is it Unprecedented?” NBER Working Paper No. 16589. Burnside, Craig, Martin Eichenbaum and Sergio Rebelo. (2001) “Prospective Deficits and the Asian Currency Crisis,” Journal of Political Economy 109(6).
20
Calderón, César, Norman Loayza, and Luis Servén. (2004) “Greenfield Foreign Direct Investment and Mergers and Acquisitions: Feedback and Macroeconomic Effects,” World Bank Policy Research Working Paper 3192. Calderón, César and Tatiana Didier. (2009) “Will FDI be Resilient in this Crisis?” World Bank Office of the Chief Regional Economist – LAC. Caprio, G., Klingebiel, D., and Laeven, L., and G. Noguerra. (2005) “Appendix: Banking Crises Database, “ in Patric Honohan and Luc Laeven (eds.), Systemic Financial Crises: Containment and Resolution. Cambridge, U.K: Cambridge University Press. Carkovic, M., Levine, R. (2005) “Does Foreign Direct Investment Accelerate Economic Growth?” In: Moran, T.H., Graham, E.M., Blomström, M. (Eds.), Does Foreign Direct Investment Promote Development? Institute of International Economics Press: Washington DC. Carr, D., Markusen, J., Maskus, K. (2001) “Estimating the Knowledge-Capital Model of the Multinational Enterprise,” American Economic Review, Vol. 91(3):693-708. Chamley, Christophe. (2003) Dynamic Speculative Attacks. American Economic Review. Chang, Roberto and Andres Velasco. (2001) "A Model of Financial Crises in Emerging Markets." Quarterly Journal of Economics, 489-518. Corsetti, Giancarlo, Paolo Pesenti, and Nouriel Roubini. (1999) “Paper Tigers? A Model of the Asian Crisis,” European Economic Review, 43, 1211-1236. Dell’Ariccia, Giovanni, Enrica Detragiache, and Raghuram Rajan. (2008) “The Real Effect of Banking Crises,” Journal of Financial Intermediation 17, 89–112. Dooley, Michael. (2000) “A Model of Crises in Emerging Markets,” Economic Journal 110, 256-272. Diamond, Douglas and Phillip Dybvig. (1983) “Bank Runs, Deposit Insurance, and Liquidity,” Journal of Political Economy, 91(3), 401-419. Desai, Mihir, C. Fritz Foley, and Kristin Forbes. (2008) “Financial Constraints and Growth: Multinational and Local Firm Responses to Currency Crises,” Review of Financial Studies 21(6), 2857-2888. Drazen, Allen and Paul Masson. (1994) “Credibility of Policies Versus Credibility of Policymakers,” Quarterly Journal of Economics 109(3), 735-754.
21
Flood, Robert P., and Peter M. Garber. (1991) “The Linkage between Speculative Attacks and Target Zone Models of Exchange Rates,” Quarterly Journal of Economics, 106, 1367–72. Head, K. , Mayer, T., and J. Reis. (2010) “The Erosion of Colonial Trade Linkages after Independence,” Journal of International Economics, 81(1): 1-14. Head, K. and K. Reis. (2008) “FDI as an Outcome of the Market for Corporate Control: Theory and Evidence,” Journal of International Economics, 74:2-20. Hutchison, Michael and Ilan Noy. (2006) “Sudden Stops and the Mexican Wave: Currency Crises, Capital Flow Reversals and Output Loss in Emerging Markets,” Journal of Development Economics, 79(1), 225-248. Leaven, L. and F. Valencia. (2010) “Resolution of Banking Crises: The Good, the Bad, and the Ugly,” IMF Working Paper 10/146. Li, J., S. Kunrong, and R. Zhang. (2011) “Measuring Knowledge Spillovers: A Non-appropriable Returns Perspective,” Working Paper, National Institute of Fiscal Studies, Tsinghua University. Mendoza, E. (2010) Sudden Stops, Financial Crises, and Leverage. American Economic Review. Noy, Ilan and Tam B. Vu. (2008) “Capital Account Liberalization and Foreign Direct Investment,” North American Journal of Economics and Finance, 18(2), 175-194. Obstfeld, M. (1994). “The Logic of Currency Crises,” Cahiers Economiques et Monetaires 43: 189-213. Osei, Robert, Oliver Morrissey and Robert Lensink. (2002) “The Volatility of Capital Inflows: Measures and Trends for Developing Countries,” CREDIT Research Paper, University of Nottingham. Roodman, D. (2009) “A Note on the Theme of Too Many Instruments,” Oxford Bulletin of Economics and Statistics, 71(1), 135-158. Rose, Andrew. (2005) “One Reason Countries Pay Their Debts: Renegotiation and International Trade,” Journal of Development Economics. Rossi, S. and P. Volpin. (2004) “Cross-Country Determinants of Mergers and Acquisitions,” Journal of the International Economics, Vol. 74(2): 277-304.
22
Uhlig, Harald. (2010) “A Model of a Systemic Bank Run,” Journal of Monetary Economics, 57(1), pp. 78-96. Soliman, Mohamed, M. (2005) “The Effects of Currency Crises on Foreign Direct Investment Activity in Emerging Markets,” Review of Applied Economics 1(2), 255-272. UNCTAD. (2000) World Investment Report: 2000. United Nations Press. UNCTAD (2011) World Investment Report: 2011. United Nations Press. Wang, Miao and M. C. Sunny Wong. (2009) “What Drives Economic Growth? The Case of Cross-Border M&A and Greenfield FDI Activities,” Kyklos, 62(2), 316–330.
23
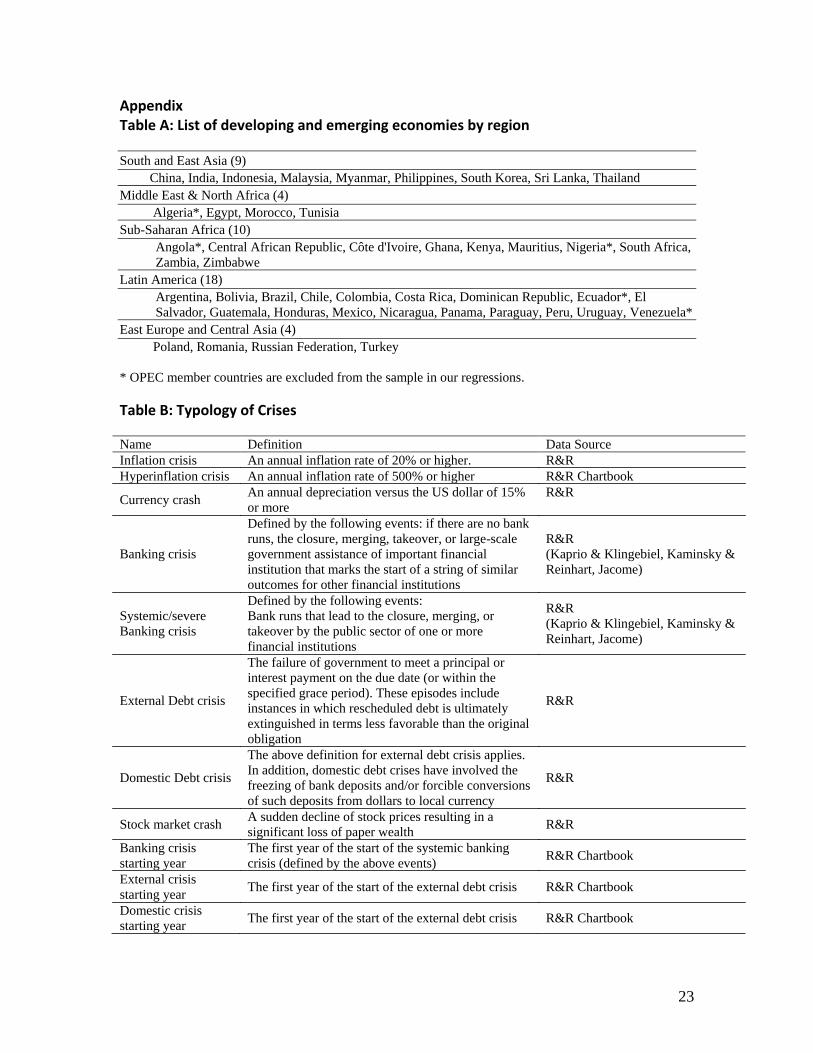
Appendix Table A: List of developing and emerging economies by region South and East Asia (9) China, India, Indonesia, Malaysia, Myanmar, Philippines, South Korea, Sri Lanka, Thailand Middle East & North Africa (4) Algeria*, Egypt, Morocco, Tunisia Sub-Saharan Africa (10)
Angola*, Central African Republic, Côte d'Ivoire, Ghana, Kenya, Mauritius, Nigeria*, South Africa, Zambia, Zimbabwe
Latin America (18) Argentina, Bolivia, Brazil, Chile, Colombia, Costa Rica, Dominican Republic, Ecuador*, El Salvador, Guatemala, Honduras, Mexico, Nicaragua, Panama, Paraguay, Peru, Uruguay, Venezuela*
East Europe and Central Asia (4) Poland, Romania, Russian Federation, Turkey * OPEC member countries are excluded from the sample in our regressions. Table B: Typology of Crises Name Definition Data Source Inflation crisis An annual inflation rate of 20% or higher. R&R Hyperinflation crisis An annual inflation rate of 500% or higher R&R Chartbook
Currency crash An annual depreciation versus the US dollar of 15% or more
R&R
Banking crisis
Defined by the following events: if there are no bank runs, the closure, merging, takeover, or large-scale government assistance of important financial institution that marks the start of a string of similar outcomes for other financial institutions
The failure of government to meet a principal or interest payment on the due date (or within the specified grace period). These episodes include instances in which rescheduled debt is ultimately extinguished in terms less favorable than the original obligation
R&R
Domestic Debt crisis
The above definition for external debt crisis applies. In addition, domestic debt crises have involved the freezing of bank deposits and/or forcible conversions of such deposits from dollars to local currency
R&R
Stock market crash A sudden decline of stock prices resulting in a significant loss of paper wealth R&R
Banking crisis starting year
The first year of the start of the systemic banking crisis (defined by the above events) R&R Chartbook
External crisis starting year The first year of the start of the external debt crisis R&R Chartbook
Domestic crisis starting year The first year of the start of the external debt crisis R&R Chartbook
24
Table C: Data sources Variable Definition Source Dependent variables
FDI flows Net FDI inflow (current $US) UNCTAD FDI stocks FDI Sock (current $US) UNCTAD M&A M&A value (current $US) UNCTAD Greenfield FDI Constructed value of greenfield investment = Total
Vertical FDI Constructed value of vertical FDI = MNC sales in the U.S. + MNC sales to other countries (current $US)
BEA
Horizontal FDI Constructed value of horizontal FDI = MNC local sales (current $US)
BEA
Control variables GDP per capita GDP per capita (current $US) WDI GDP growth GDP growth (annual %) WDI Inflation Inflation, consumer prices (annual %) WDI Exports Exports of goods and services (current $US) WDI Gross fixed capital formation
Gross fixed capital formation (current $US) WDI
Urban population Urban population (% total) WDI Telephone lines Telephone lines (per 100 people) WDI Mobile cellular subscriptions
Mobile cellular subscriptions (per 100 people) WDI
Trade tax Taxes on international trade (% of revenue) WDI Duties Customs and other import duties (% of tax revenue) WDI Real GDP per capita Real GDP per capita (constant price: Chain series) Penn World Tables
Real GDP Real GDP (population x real GDP per capita, Chain series)
Penn World Tables
Trade openness Country openness (constant prices, in %) Penn World Tables Population Population (in thousands) Penn World Tables Education Average education years Barro and Lee Squared education difference
Squared difference in average education years between the host country and USA
Authors calculations, Barro and Lee
Real per capita capital Real capital per capita (with varying depreciation rate = 0,5, 10, 15%)
Jian Li, et al. (2011)
Political and business environment Political rights Political rights index Freedom House Civil liberties Civil liberties index Freedom House Political risk Political risk rating ICRG-PRS Quality of institutions Quality of institution index ICRG-PRS Government stability Government stability index ICRG-PRS Socioeconomic conditions
Socio-economic conditions index ICRG-PRS
Investment climate Investment climate index ICRG-PRS Corruption Corruption index ICRG-PRS
25
Distance and other geographical, economic, and cultural variables
Land area Land area (sq. km) WDI Contiguous Dummy variable indicating HOST country and USA
are geographically contiguous CEPII Gravity data set
Weighted distance Population-weighted distance between the HOST and USA
CEPII Gravity data set
Common official language
Dummy variable indicating Host country and USA share a common official language
CEPII Gravity data set
Common ethnic language
Dummy variable indicating that Host country and USA share a language which at least 9% of population speak in each country
CEPII Gravity data set
Regional trade agreement (RTA)
Dummy variable indicating RTA between Host country and USA
WTO
WTO member Dummy variable indicating that Host country is a member of WTO
CEPII Gravity data set
Table 1: FDI statistics ($US millions at current prices and current exchange rates)
FDI Inflows Total M&A Greenfield1 Horizontal Vertical Totals: 3,495,833.7
698,676
2,656,992.4
4,784,931
2,350,113
By decade 1980s (1987-1989) 51,431.8 1,105.0 24,101.2
By region (# of countries in group): South and East Asia (8) 1,442,765.5
219,481.0
1,198,179.9
1,337,290
869,685
Middle East and North Africa (4)
116,737.1
36,336.0
60,293.1
30,254
9,951
Sub-Saharan Africa (10) 212,899.1
40,115.0
115,741.5
197,004
74,713
Latin America (18) 1,150,643.2 247,800.0
866,846.1
2,917,919
1,281,832
East Europe and Central Asia (4)
572,788.7
154,944.0
415,931.8
302,464
113,932
1 While Greenfield FDI = Total FDI inflows – M&A value, following Calderon et al. (2004), we leave the values for Greenfield FDI missing where M&A values are missing, consistent with Calderon, et al (2004).
Table 2: Crises in developing and emerging countries, 1987-2009 Crisis Types Number of distinct
crisis episodes (Total years in crisis)
By decade
1987-1989 1990-1999 2000-2009
Banking crisis 68 (255)
27 (85)
31 (131)
10 (39)
Systemic banking crisis 42 (122)
16 (45)
20 (58)
6 (19)
Currency crisis 118 (326)
50 (152)
39 (126)
28 (47)
Inflation crisis 54 (315)
21 (143)
24 (133)
9 (39)
Hyperinflation crisis 10 (27)
6 (14)
3 (9)
1 (4)
Stock Market crisis 90 (212)
16 (63)
44 (85)
30 (64)
Domestic debt crisis 17 (80)
11 (39)
3 (27)
3 (13)
External debt crisis 54 (361)
37 (167)
20 (117)
9 (73)
The sample excludes OPEC economies
Table 3: Arellano-Bond Difference GMM Estimation for FDI flow Dependent variable: FDI flow (in millions of real US dollars) Independent variable
Table 5: Arellano-Bond Difference GMM Estimation for Vertical FDI Dependent variable: Vertical FDI (value of vertical FDI, in millions of real US dollars) Independent variable
Table 6: Arellano-Bond Difference GMM Estimation for Horizontal FDI Dependent variable: Horizontal FDI (value of horizontal FDI, in millions of real US dollars) Independent variable
Table 7: Arellano-Bond Difference GMM Estimation for Mergers and Acquisitions (M&A) Dependent variable: M&A Value (value of M&A, in millions of real US dollars) Independent variable
Table 8: Arellano-Bond Difference GMM Estimation for Greenfield FDI Dependent variable: Greenfield FDI Value (value of Greenfield FDI, in millions of real US dollars) Independent variable