Page 1
University of Huddersfield Repository
Cai, Huifen
European Union Foreign Direct Investment in China: Evidence from a Panel Study of EU Manufacturing Firms, 19982007
Original Citation
Cai, Huifen (2010) European Union Foreign Direct Investment in China: Evidence from a Panel Study of EU Manufacturing Firms, 19982007. In: 15th Cambridge International Manufacturing Symposium, 23rd24th September 2010, Cambridge, UK.
This version is available at http://eprints.hud.ac.uk/id/eprint/17214/
The University Repository is a digital collection of the research output of theUniversity, available on Open Access. Copyright and Moral Rights for the itemson this site are retained by the individual author and/or other copyright owners.Users may access full items free of charge; copies of full text items generallycan be reproduced, displayed or performed and given to third parties in anyformat or medium for personal research or study, educational or notforprofitpurposes without prior permission or charge, provided:
• The authors, title and full bibliographic details is credited in any copy;• A hyperlink and/or URL is included for the original metadata page; and• The content is not changed in any way.
For more information, including our policy and submission procedure, pleasecontact the Repository Team at: [email protected] .
http://eprints.hud.ac.uk/
Page 2
DRAFT – Please do not cite or circulate without permission of the author
European Union Foreign Direct Investment in China: Evidence from a Panel Study of EU
Manufacturing Firms, 1998-2007
Huifen Cai, Yilmaz Guney
Business School, the University of Hull, Cottingham Road, Hull, HU6 7RX. U.K.
Corresponding author: Huifen Cai, E-mail: [email protected] ,
Abstract
The paper examines determinants of the EU‘s FDI into the China by using a newly available
Manufacturing firm-level data set for the period 1998-2007 from the State Statistical Bureau of
China. The theoretical framework of the paper builds on Dunning's ownership–location–
internalization (OLI) paradigm, incorporating the institutional determinants to test international
production by EU firms in emerging market. The paper analyses recent trends and patterns of EU
FDI and its firms‘ characteristics in China. This study applies both static and dynamic panel data
approaches (fixed effects and GMM system estimators) to test the presence of agglomeration
effect of past FDI. It finds that EU FDI in China is positively associated with export intensity and
labour cost. However, technology and profitability of the firm show unexpected results, not lining
with theory in the study. The results further suggest that locational factors with regard to
macroeconomic and legal environment are also considered by EU firms when deciding on FDI in
China. The findings have important implications for practitioners and policymaking.
Keywords: Keywords: EU firms; China; Foreign direct investment; Eclectic paradigm; Dynamic
panel data analysis
Page 3
DRAFT – Please do not cite or circulate without permission of the author
1980 1985 1990 1995 2000 2005 2010
0
50000
100000
150000
200000
250000 contractual value
realised value
1. INTRODUCTION
Foreign direct investment (FDI) as in international trade is one channel for the liberalisation of the
world economy (Rugman and Verbeke 2008). Multinational enterprises look for host countries/
new markets because these enterprises seek to acquire localization advantages, and to benefit from
specific advantages. The reasons are explained by the OLI paradigm (ownership-location –
internalization) of Dunning (1992, 2003), Dunning and Lundan (2008, 2009, 2010), and Dunning
and Fortanier (2007).
The People‘s Republic of China1( (China or PRC) has become the most comparative advantage a
manufacturing location(Chen et al., 2002; Rowen, 2003; European Commission, 2007:4 ) and the
top Foreign Direct Investment (FDI) destination among all developing countries and remained
host to the world‘s largest share of FDI receipts since its accession to the WTO in 2001. FDI
developments were character by trends with these aspects regarding the policy: entry modes2,
ideological breakthroughs, governing laws, and Special Economic Zones (SEZs)3 with ‗special
policies‘ and ‗flexible measures‘4.During the period 1983-2008
5, both the contractual value and
the realised value of FDI in China increased by more than 112 times and 117 times respectively
from US$1,732 million to US$ 193,727 million and from US$ 636 million to US$ 74, 767.89
million (MOFTEC, 2009). More details see Figure 1.
Figure1: FDI in China 1983-2008 (Unit: US$10, 000)
Source: Compiled by the author according to FDI Statistics from Ministry of
Commerce of the PRC (MOFTEC)
1 Unless otherwise stated, ‗China‘ refers to Mainland China, which does not cover Hong Kong, Macau and Taiwan,
where different economic and legal systems are in operation, despite the fact that they are legally recognized as
indispensable parts of the State of China. 2 China promulgated the Chinese-Foreign Equity joint Venture Law (EJVL) in 1979, WFOEs in 1986 and CJVs in
1988. 3 The first four SEZs were Zhenzhen, Zhuhai, and Shantou in Guangdong Province and Xiamen in Fujian Province. In
the 1990s, Hainan Province as a whole and Pudong New District in Shanghai were granted the same status, as were
21 cities along the Yangtze River and in the Northeast. 4 The ‗special policies‘ and ‗flexible measures‘ can be interpreted as special privileges and treatment for foreigners
investing in these zones, where they could carry out investment and trading activities that were not allowed in th e
rest of the country , or were allowed but with less favourable conditions. 5 Though China began to receive FDI from 1979, official data on inward FDI by country of origin are available only
from 1983 onwards.
Page 4
DRAFT – Please do not cite or circulate without permission of the author
China‘s quest for sustainable growth continues to stimulate much discussion and vigorous debate
among academics (Wei, 1995; Borensztein, de Gregorio, & Lee, 1998; Wu, 1999; Wei & Liu,
2001; Graham & Wada, 2001; Whalley & Xin, 2006; Tuan & Ng, 2004, 2007; Tuan& Ng, 2006;
Yao & Wei, 2007). The fascinating developments in China‘s globalization also provide us with a
tempting opportunity to study the determinants of inward FDI in China.
The European Union6 (the EU)
7 and China have everything to gain by strengthening their trade
and investment ties. Since 1978, EU-China trade has increased more than 60-fold and reached
around €254 billion in 2006 (Eurostat) 8
. EU investment in China has increased more than 25-fold
since 1986 and in 2000 the EU became the largest foreign investor in China (Figure 2: EU
Investment in China 1986-2008). During the period 1986-2008, EU realised FDI in China
increased from US$ 178.53 million to US$ 4994.51 million (MOFTEC. 2009). The number of EU
DI projects rose from 1002 to 1844 (MOFTEC, 2009). For details see Figure 2.
Figure2: EU Realized FDI & Number of Projects in China 1986-2008 (Source: MOFTEC)
Source: Compiled by the author according to FDI Statistics from Ministry of
Commerce of the PRC (MOFTEC)
6 In this study, we look EU as an individual country because of the data source available.
7 On 29 Jan 2009, the European Union realised its sixth enlargement and become a union of 27 member states,
including 2 new member states. 8 Quoted in European Commission External Trade Website:
http://ec.europa.eu/trade/issues/bilateral/countries/china/index_en.htm [Accessed 7 January 2009].
0
500
1000
1500
2000
2500
3000
0
100000
200000
300000
400000
500000
600000
19
86
19
87
19
88
19
89
19
90
19
91
19
92
19
93
19
94
19
95
19
96
19
97
19
98
19
99
20
00
20
01
20
02
20
03
20
04
20
05
20
06
20
07
20
08
Nu
mb
er
of
Pro
ject
EU Relised FDI and Number of Projects in China, 1986-2008
Number of Projects EU Realized FDI Value In China($10,000)
Page 5
DRAFT – Please do not cite or circulate without permission of the author
European companies9 invested €4.5 billion in China in 2008 (down from €7, 1 billion in 2007).
Chinese companies invested €0, 1 billion in Europe in 2008 (down from €0, 6 billion in 2007),
bringing stocks of EU FDI to over USD 35 billion10
. Almost half of EU foreign direct investment
to China goes to manufacturing. Overall, after three decades of evolution. EU-China foreign direct
investment relations reached a new milestone: China is now the EU's second largest trading
partner behind the USA and the biggest source of imports. The EU is China's biggest trading
partner. The strong growth of FDI has led to extensive research on its determinants, looking at
developed countries, developing countries or country groups using cross-section, time-series or
panel data. Despite the considerable amount of research that has been undertaken, the EU and
China, as two of the largest, mutually complementary markets in the world, which represent a
major FDI recipient and a region with a substantial share of foreign ownership, have been largely
overlooked in terms of a comprehensive economic analysis11
. The available empirical evidence on
the major determinants of EU FDI inflows into China, especially at the firm level12
, is rather scant
in the literature and, at best, only under preliminary discussion. As an exception, Wei (2006) and
Wei and O‘ Callaghan (2008) provide an econometric analysis of factors influencing EU foreign
capital inflows into China at province level using ordinary least squares regression with a focus on
locational determinants . Time-series data for the period 1996-2002 are analysed. Their study
suffers from problems of inconsistencies in some numerical results, a short time span and a lack of
degrees of freedom. Bulcke (2003) examines provide European Union direct investment in China
during the period 1979-1996 using statistical analysis of location-specific factors with a focus on
characteristics, challenges and perspectives. The research question is to evaluate which factors
determine the EU foreign direct investment in China.
The purpose of this paper is to identify the major determinants of FDI inflows into China from the
EU firm during the last 10 years. The paper aims to fill in the gap currently existing in the
literature of FDI from EU in China. The objective of the study is to investigate 697 EU firms
investing in China manufacturing industries for the period 1998-2007, employing the eclectic
paradigm of Dunning together with incorporation institutional factors in EU FDI OLI framework.
We develop an integrated framework that combines elements of the theories. In doing so, this
study adopts both static and dynamic models to investigate FDI determinants, and to test the
presence of the agglomeration effect of past FDI. It also takes a step forward adding dynamic
analysis in EU firms FDI in China to enhance the robustness of the paradigm. This contributes is
to literature on EU FDI in China with updated data.
Some key results emerge from the analysis: age does not have a significant positive impact on EU
FDI in China. R & D and capital have positive, significant and U –shaped effect on EU FDI
expansion in China, but technology has negative and significant effects as EU FDI flows in China
show few very high-technology investments and patents in the last ten years. Product innovation
is negative and highly significant after GMM test, showing low-level technology products
upgraded. Profitability has a negative and significant correlation with FDI, which means EU FDI
is market- seeking rather than effect-seeking and its products are capital –intensive and R & D-
based industries. Personal capital share is highly negative and significant, showing the EU‘s FDI
entry mode is from Joint venture (JV) to WFOES according to China‘s FDI policy. Rule of law is
highly negative and significant because of IPR infringement and government intervention.
9 Detailed discussion of FDI by EU firms in China is in section 3.
10 European Commission External Trade Website, 2009
11 also figures A1, A2 and A3 in our appendix
1212 Regarding the FDI statistics at country level, a database of foreign registered enterprise was established on the
basis of information from MOFTEC‘s list of foreign subsidiaries (MOFTEC‘s). However, MOFTEC stopped the publication of this type of information in its statistical yearbook as of 1998.
Page 6
DRAFT – Please do not cite or circulate without permission of the author
The rest of the paper is organised as follows. Section 2 presents the literature review and
hypothesis formation. Section 3 discusses the methods and data. Section 4 presents the results.
The last section concludes the paper.
2. THEORY DEVELOPMENT AND HYPOTHESES
2.1 Literature Review: The Eclectic Paradigm (OLI)
Dunning's eclectic paradigm (Dunning,. 1976, 1977, 1981a, 1988, 1993a, 2000, 2001; Dunning &
Lundan, 2009), known as the ―Ownership, Location, Internalization‖ (OLI) model, has been the
most influential framework for empirical investigation of determinants of FDI for three decades.
(Narula, 2006; Cleeve, 2007; Stoian and Filippaios, 2008; Buckley and Hashai, 2008; Stefanović,
2008; Piteil and Teece, 2010). The paradigm draws upon, and synthesizes of industrial
organization theories (Hymer, 1960; Kindelberge, 1969; Caves 1974), Internalization Theory
(Buckley & Casson, 1976; Hennart, 1991; Dunning & Rugman, 1985; Teece, 1981, Buckley,
1989), and industrial location (Dunning, 1988). It is, however, arguable that limitations in
dynamic components have discouraged the leveraging of recent scholarly developments in
organization theory and strategic management. Indeed, OLI has been extended to accommodate
several criticisms (Cantwell & Narula, 2001; Dunning, 2001; Estrella Tolentino, 2001;Dunning,
Pak, & Beldona, 2007;Piteil and Teece, 2010). The present study is based on Dunning (extended)
OLI eclectic paradigm( 1977, 1988a, 1988b, 2000, 2001, 2004a, 2004b, 2008a.), and expands it
by incorporating institutional theory in the choice of the location advantage variables; such
institutional determinants can be both firm as well as country-specific (Dunning 2000, 2006,
Dunning Lundan, 2008b, 2009, 2010 ). We develop an integrated framework that combines
elements of the FDI and MNE theory. In doing so, the study not only employs the static analysis,
but also takes a step forward by adding dynamic analysis in EU firms FDI in China to enhance the
robustness of the paradigm.
The paradigm offers a holistic framework in take into consideration all the important factors that
influence the decisions of MNCs about going international in production and other operations,
which will drive their growth (Dunning 2008; Stefanović, 2008). The basic proposition of the
eclectic paradigm of international production (EPIP) (Dunning 2000, 1995, 1993a, 1988, 1977,
1976) is that the pattern of international production is determined by three groups of advantages:
the ownership-specific (O) advantages (in accordance with industrial organization theory) refer to
unique competitive advantages, indicating who is going to produce abroad ‗and for that matter,
other forms of international activity‘ (Dunning, 1993a, 1993b). Locational (L) advantages
(according to conventional trade theory), refer to ―pull factors‖ and ―push factors‖, influencing
where to produce‘ (Dunning, 1993a 1993b). Internalisation (I) advantage (in accordance with the
Internalization theory), refers to the perceived advantage of hierarchical control of value-added
activities to overcome market imperfections. The market imperfection could be structured or
transactional, addressing the question of why firms engage in FDI rather than license foreign firms
to use their proprietary assets (Dunning 1993a, 1993b). A decade ago Dunning (1993a) added a
fourth possible condition to OLI variables. This related to the long-term strategy of the MNE and
its decision to produce abroad with a given OLI configuration. Additionally, with the advent of
‗alliance capitalism‘, the EPIP is bound to change in several directions (Dunning, 1995) such as
the role of innovation, strategic alliance and collaborative agreements. Using the above
propositions, one can explain the scope and geography of international value-added activities. We
briefly review those factors and several criticisms of the OLI below.
Page 7
DRAFT – Please do not cite or circulate without permission of the author
The essential condition for a firm to invest abroad is to possess ownership advantages
(competitive or monopolistic advantage). Hymer first conceived the general theory of FDI in 1960
in his market imperfection theory. Cave (1974) developed the oligopolistic power theory of
Hymer by adding the concept of transaction costs. Hymer saw FDI as a means of transferring
knowledge and other firm assets, both tangible and tacit, in order to organize production abroad.
In a similar way, Vernon‘s product life cycle (1966) was developed from Hymer‘s thesis to add a
dynamic dimension. These two seminal pieces spawned numerous contributions to explain FDI
and MNE activities from different theoretical bases (Sethi, 2003). However, Ownership advantage
has not been without its critics. Whether the changing character and boundaries of the O specific
advantages of firms can be satisfactorily incorporated into the eclectic paradigm, the last two
decades have been the increasing significance of FDI based on the possession of, or need to
acquire, dynamic and alliance related O advantages (Dunning, 1995, 2000, 2006). Early attempts
to look at MNE and FDI through a dynamic lens were the Upsaala model (Johnson and Vahlne,
1977, 2009) which posits that MNEs engage in FDI incrementally, the resource-based approach
(Conner, 1991; Wernerfelt, 1984), the evolutionary perspective (Nelson and Winter, 1982;
Cantwell 1989, 1994; Teece et al., 1997) and the organizational (management related) approach
(Prahalad and Doz 1987; Bartlett and Ghoshal, 1989; Sethi and Guisinger, 2002). These theories
explain how MNEs transfer them through FDI with dynamic evolution of ownership advantages
to sustain these advantages by leveraging them through worldwide investments.
The internalisation factor (I) of the OLI paradigm has been defined by Dunning (1993a) and
Dunning (1993b) as a choice between investing abroad or licensing a firm to exploit O
advantages possessed by the licensor. The concept of ―internalisation‖ stems from transaction cost
theory, originally suggested by Coase (1937) and taken further by Williamson (1975; 1985).
Based on the logic of the theory, Buckley and Casson (1976) first attempted to elucidate why
MNEs emerge and embark upon FDI, thereby extending transaction cost economics to the realm
of internationalisation of the firm (Madhok, 1998; Rugman, 1986).
Internalization theory has long provided one of the main theoretical rationales for the existence of
the multinational enterprise (Buckley and Roger, 2010). Yet it has not gone unchallenged. The
major criticisms are that it is an incomplete theory, which less comfortably with the conception of
a firm as a ‗repository of knowledge and capabilities‘ (Kogut & Zander, 1994; Madhok, 1996).
The second criticism of orthodox internalization theory is that it is a static theory, although a
dynamic element can be introduced by incorporating an analysis of the innovation process
(Buckley and Casson, 1976, pp. 34–86). Asmittedly, by shifting international business literature
from a limited focus on country-specific factors into an emphasis on industry-level and firm-level
factors of international investment flows (Henisz, 2003), the internalisation theory has made an
important contribution to international business literature. However, despite its sound explanatory
power of MNE behaviour relating to cost considerations, the theory still does not give a clear
answer to the question of why MNEs engage in FDI and international production and why they
choose a particular foreign location in which to invest.
Locational advantage explains which activities of firm are best undertaken in particular countries
based on the comparative costs and benefits in different locations (Dunning, 1993a), Building on
existing literature on the combination of location and international trade theory (e.g., Buckley and
Casson, 1976), Dunning (1977, 1988) expands this idea, placing it in the eclectic paradigm. The
location-specific advantages are relevant initially to showing that geographical location matters to
economic outcomes. In more detail, a firm must possess ownership-specific advantages over rival
firms in foreign markets. When market structure is perceived as imperfect, the firm attempts to
internalise its proprietary advantages via FDI, thereby becoming a MNE. An MNE may derive
Page 8
DRAFT – Please do not cite or circulate without permission of the author
specific benefits from a unique set of advantages possessed by each host country. They are
classified into four categories (Dunning, 1993): natural resource advantages (e.g., raw material
and energy); economic environment advantages (e.g., market size and R&D facilities); cultural
and social advantages (e.g., culture and language) and political power and legal environment (e.g.,
political stability and legal environment). These international locations are becoming a key
consideration for their additional strategic importance. For example, they can be taken into
account as a target of exploitation for the supply and demand in foreign markets (Dunning and
Lundan, 2008; Pak and Park, 2005). Most of these studies are more relevant to initial market entry,
and do not analyse FDI trends dynamically. Research on the investment development path,
however, does have a longitudinal element (Dunning, 1981, 1986; Ozawa, 1992; Narula, 1996;
Tolentino, 1992; Dunning and Narula, 1996). This perspective shows how the type of FDI
changes with the stage of economic development of the host country (Sethi, 2003)
Regarding the location advantages put forward by Dunning (2001, 2006), due to its emphasis on
static market failure, the eclectic paradigm has been criticized as lacking dynamism. One of the
major modifications of OLI by Guisinger (2001, p265) is the adaptation of the firm‘s operations to
the international business environment building on institutional theory. Following from North
( 1990, 2005), the environment can consist of institutional rules, regulations, cultures and
exchange rates and other elements which are geographically bound and usually, but not always,
follow national boundaries. Many previous studies on transition economies have identified
institutional environment variables as significant determinants of FDI (Dimelis & Louri, 2002;
Fan et, al, 2009), the incorporation of institutional variables into firms‘ decision to internationalise
firstly and then internalise comes from the property rights theory, showing that the different
ownership structures adopted by MNEs, when enaging FDI, demonstrate a way of protecting their
property rights, their reputation or other intangible assets. The institutional environment,
especially through exchange rate, corruption, and practically the rule of law, can force firms to
adopt particular ownership or other non-equity structures. This present study focuses on what
factors determine EU firms‘ investment in China. Despite China's rapid development and
increasing openness, the absence of transparency and institutional trust is widespread (Redding &
Witt, 2007). The Chinese market differs from most other markets because of the active role that
the Chinese government plays in business processes (Witt, 2008). Multinational firms have, one
after another, set up special units to deal with government relationships (Faure and Fang, 2008;
Tung et al.2008).They force the investing firms to think strategically about how to avoid the
limitation imposed by domestic laws as well as how to reap the benefits that the law and particular
circumstances are capable of providing‘ (Spar, 2001, European Union, 2007:4).
Based on the existing literature, we develop an integrated research framework that combines
elements of updated Dunning‗s OLI with a dynamic interpretation13
. Figure 3 presents the
research framework. We now introduce the hypotheses and the choice of antecedent variables.
13
Institutions and development (e.g. North, 1994) led to cross-fertilisation between international business scholarship and development
and institutional economics (Dunning, 2006; Cantwell et al., 2009; Dunning and Lundan, 2010).
Page 9
DRAFT – Please do not cite or circulate without permission of the author
Figure 3.Determinants of EU FDI in the OLI framework
2.2 Determinants of EU FDI in China: hypotheses
We now review determinants of FDI derived from theory and hypothesise on their ability to
influence the factors of EU FDI in China.
2.2.1 Ownership advantages
Seven variables were used to measure ownership advantages:
Capital intensity
This would possibly give companies superior product quality and cost advantages in
export markets (Lin, 2010; Siddharthan and Nollen, 2004). Previous studies found that companies
with higher capital intensity have a higher propensity to engage in FDI (e.g., Roberts and Tybout,
1997). Capital intensity of firms is relevant in deciding FDI levels because the size of the resource
commitments needed to engage in FDI can vary considerably between less capital intensive and
more capital-intensive firms (Lin, 2010). Thus, we expect a direct link between capital intensity
and FDI. Capital intensity is measured in this study by the natural logarithm of the ratio of fixed
assets to the number of employees. We posit that:
Hypothesis 1. There is a positive relationship between capital intensity of EU firms and their FDI
engagement in China.
Ownership
advantages
Location
advantage---
location institutional
variables
Location
advantages—
location economic
variable
econom
Internalization
advantages
Static analysis
Fixed effects estimates
Event analysis (WTO)
Dynamic analysis
General analysis
Specially analysis
Determinants of
EU firms FDI in
China
Page 10
DRAFT – Please do not cite or circulate without permission of the author
Firm size
Firm size has proved to be an important predictor of FDI activities (e.g., Blomstrom and
Lipsey, 1989). Developing countries' MNEs need asset advantages to engage in foreign operation
and to compete successfully with indigenous firms. The size of a firm reflects its capability to
engage in these types of activities (Buckley and Casson, 1976). Further, the larger the firm grows
relative to the domestic market, the less profitable it would be to increase its domestic share
relative to expanding abroad. According to Dunning (1993), size is a transaction cost minimiser.
Much empirical evidence accentuates the impact of firm size on FDI as very positive (e.g., Culem,
1988; Grubaugh, 1987; Kimura, 1989). Blomstrom and Lipsey (1991), however, found no link
between FDI and size. Their study in the U.S. found that this was not only true for the
manufacturing as a whole, but for seven sub-industries as well. They concluded that, once a firm
jumps the initial barrier to foreign production, firm size is important only as a threshold effect and
has no effect in the magnitude of the firm‘s resources devoted to overseas production. Pradhan
(2004) argues that FDI and size may be linked non-monotonically due to monopolistic advantage
such that FDI first increases with size but then decreases after the threshold point. In this study,
we empirically examine the presence of such non-linearities.
. Due to their large capacities, large firms should be more able to combine resources
outside their national markets and may therefore pursue more than one objectives at the same time.
In this study, we use the natural logarithm of total assets as the measure of firm size. We
hypothesise that: Hypothesis 2. The larger an EU firm's size, the more it will engage in FDI in
China.
Export intensity
Concerning trade and FDI, the empirical evidence suggests that the two are complements
(Drake and Caves, 1992). FDI is the combination of an investor‘s firm-specific advantages with a
host country‘s site-specific advantage. Dunning (1998) suggests that the relationship between
trade and FDI is conditional on the type of trade and FDI, and the conditions under which each
takes place. Gray (1998) indicates that market-seeking production affiliates can displace
international trade and efficiency-seeking production affiliates will increase the volume of trade.
An evolutionary model of trade and investment emphasizes that a firm first gains a
foothold in the host country‘s market by exporting its product. Only when the firm accumulates
sufficient information through its export experience, that profitable opportunities exist for
investment, does there in fact exist a statistically significant relationship between previous export
and the initial FDI decisions from the EU firm or export from the EU to the host country. Export
intensity is measured by export sales over total sales .Lin (2010) and Trevino and Daniels (1994)
argue that FDI and export orientation are directly linked. Thus, we hypothesise that:
Hypothesis 3. The higher an EU firm's export intensity, the more it will engage in FDI in China.
Age
This factor has been considered in past studies (e.g., Lall, 1980). Also, Lin et al. (2005)
report a positive correlation between age and FDI. However, firm age (AGE) may have a non-
monotonic relation with FDI (Pradhan, 2004). That is, the link can be positive for younger firms
but then the association turns negative for older firms. Luo et al. (2009), for instance, report an
inverse link between age and FDI. To account for this possibility, we also test for any non-linear
effect of Age by including its quadratic term Age2 in our regression model. Age is measured by
the natural logarithm of the number of years an EU firm has been in China. Luo et al. (2008)
argue that the earlier an MNE entered China the more investment it is likely to make. Hence, we
hypothesise that: Hypothesis 4. The more years an EU firm has experienced, the more likely it is
to engage in FDI in China.
Page 11
DRAFT – Please do not cite or circulate without permission of the author
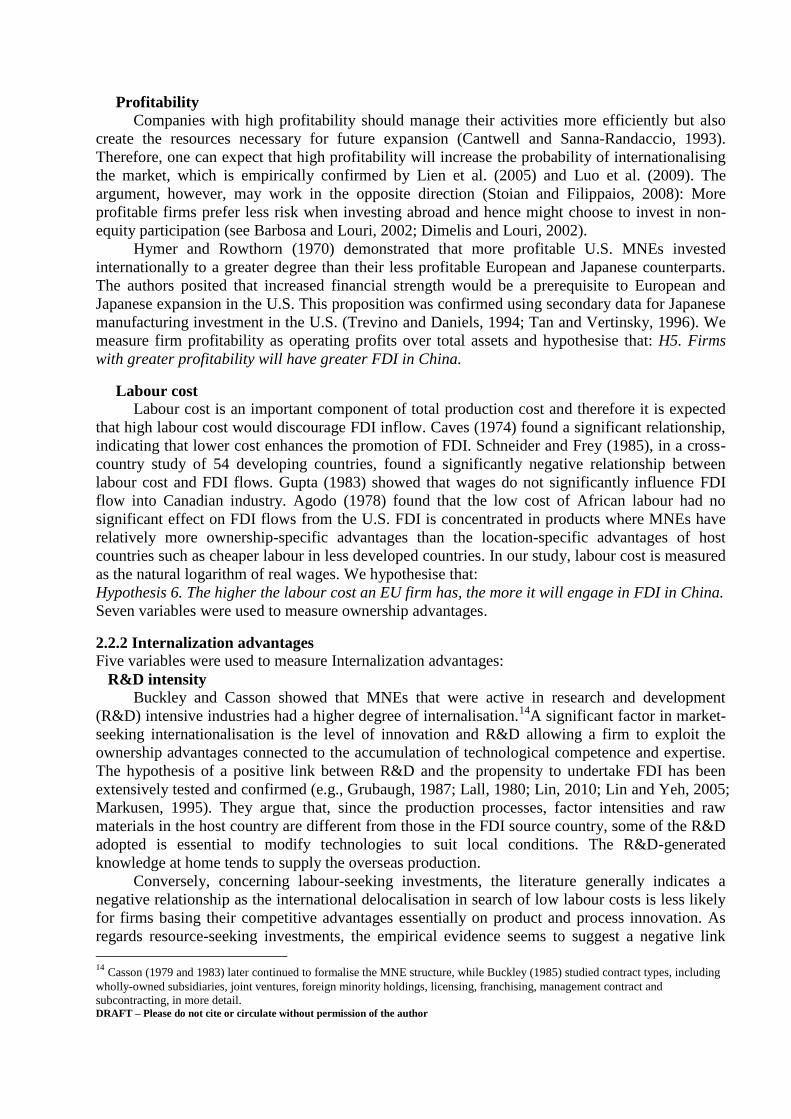
Profitability
Companies with high profitability should manage their activities more efficiently but also
create the resources necessary for future expansion (Cantwell and Sanna-Randaccio, 1993).
Therefore, one can expect that high profitability will increase the probability of internationalising
the market, which is empirically confirmed by Lien et al. (2005) and Luo et al. (2009). The
argument, however, may work in the opposite direction (Stoian and Filippaios, 2008): More
profitable firms prefer less risk when investing abroad and hence might choose to invest in non-
equity participation (see Barbosa and Louri, 2002; Dimelis and Louri, 2002).
Hymer and Rowthorn (1970) demonstrated that more profitable U.S. MNEs invested
internationally to a greater degree than their less profitable European and Japanese counterparts.
The authors posited that increased financial strength would be a prerequisite to European and
Japanese expansion in the U.S. This proposition was confirmed using secondary data for Japanese
manufacturing investment in the U.S. (Trevino and Daniels, 1994; Tan and Vertinsky, 1996). We
measure firm profitability as operating profits over total assets and hypothesise that: H5. Firms
with greater profitability will have greater FDI in China.
Labour cost
Labour cost is an important component of total production cost and therefore it is expected
that high labour cost would discourage FDI inflow. Caves (1974) found a significant relationship,
indicating that lower cost enhances the promotion of FDI. Schneider and Frey (1985), in a cross-
country study of 54 developing countries, found a significantly negative relationship between
labour cost and FDI flows. Gupta (1983) showed that wages do not significantly influence FDI
flow into Canadian industry. Agodo (1978) found that the low cost of African labour had no
significant effect on FDI flows from the U.S. FDI is concentrated in products where MNEs have
relatively more ownership-specific advantages than the location-specific advantages of host
countries such as cheaper labour in less developed countries. In our study, labour cost is measured
as the natural logarithm of real wages. We hypothesise that:
Hypothesis 6. The higher the labour cost an EU firm has, the more it will engage in FDI in China.
Seven variables were used to measure ownership advantages.
2.2.2 Internalization advantages
Five variables were used to measure Internalization advantages:
R&D intensity
Buckley and Casson showed that MNEs that were active in research and development
(R&D) intensive industries had a higher degree of internalisation.14
A significant factor in market-
seeking internationalisation is the level of innovation and R&D allowing a firm to exploit the
ownership advantages connected to the accumulation of technological competence and expertise.
The hypothesis of a positive link between R&D and the propensity to undertake FDI has been
extensively tested and confirmed (e.g., Grubaugh, 1987; Lall, 1980; Lin, 2010; Lin and Yeh, 2005;
Markusen, 1995). They argue that, since the production processes, factor intensities and raw
materials in the host country are different from those in the FDI source country, some of the R&D
adopted is essential to modify technologies to suit local conditions. The R&D-generated
knowledge at home tends to supply the overseas production.
Conversely, concerning labour-seeking investments, the literature generally indicates a
negative relationship as the international delocalisation in search of low labour costs is less likely
for firms basing their competitive advantages essentially on product and process innovation. As
regards resource-seeking investments, the empirical evidence seems to suggest a negative link
14
Casson (1979 and 1983) later continued to formalise the MNE structure, while Buckley (1985) studied contract types, including
wholly-owned subsidiaries, joint ventures, foreign minority holdings, licensing, franchising, management contract and
subcontracting, in more detail.
Page 12
DRAFT – Please do not cite or circulate without permission of the author
(Dunning, 1993). This paper considers these conflicting arguments and hence empirically
examines the presence of a non-linear link between FDI and R&D. In this study, R&D is
measured as the ratio of intangible assets to total assets. We hypothesise that:
Hypothesis7. The higher the R&D expenditure, the more the EU firm will engage in FDI in China.
Technology
Recent theoretical work has given renewed impetus to something long recognised in the
literature that a possible motive for FDI is not to exploit proprietary technology, but to access it.
Thus, technology sourcing may be the motive for FDI. The literature on the internationalization of
R&D suggests that this concern may be well placed (Cantwell and Janne, 1999; Patel and Vega,
1999). The evidence suggests that corporations are increasingly moving their R&D facilities
abroad as part of a strategic move away from merely adapting ‗core‘ technology to a foreign
market towards a much more central role in product innovation and development.
Technology sourcing is not a new phenomenon, and the recent upsurge in international
R&D may be an indicator of production-oriented FDI flows which have already taken place. The
literature on the internationalization of R&D is concerned principally with the establishment of
new facilities in foreign countries, while that on technology sourcing as a motivation for FDI is
concerned with real international resource flows. The evidence from developed countries reveals a
strong association between R&D and overseas investment at both industry and firm levels (Lall,
1980; Trevino and Daniels, 1994). We use the natural logarithm of intangible assets as a proxy for
technology and hypothesise that: Hypothesis 8. The more technology an EU firm owns, the more it
will engage in FDI in China
Personal share ownership
An MNE has two options when determining the foreign affiliate‘s ownership structure: full
ownership (wholly owned subsidiaries) or shared ownership (equity joint venture, EJV). The
equity modes involve higher resource commitment and higher levels of control (Hill et al., 2006).
Developing country MNEs with low-technology undifferentiated products have a high propensity
to form joint ventures because they need a local partner to provide knowledge of local marketing
skills, raw material sources, and the business environment (Lecraw, 1977). European firms used
EJV more frequently as a form of entry for their operations in China than others (Bulcke et al.,
2003). EU foreign participation in China manufacturing is large and well dispersed across the
industry. China‘s labour costs are far lower than those in the developed world and thus firms have
both the incentive and time to adapt their techniques so that if multinationals adapt to conditions
in less developed countries we should be able to observe such adaptation in China. We define a
firm‘s ownership structure according to its official registration status. There are six ownership
structures in this study‘s dataset: state capital; collective capital; corporate capital; personal capital;
Hong Kong, Macao and Taiwan capital; and foreign capital. EU firms have a relatively small
amount of personal share inflows into China. Issues such as the role of joint ventures imply that
ownership at corporate or institutional level would be more effective to promote FDI. Thus, we
hypothesise that: Hypothesis 9. The higher the personal participation, the less FDI will be
exploited in China.
Advertising intensity
The propensity of firms to affect market seeking investments may be higher in sectors where
sales are supported by intense advertising campaigns. Firms from developed countries tend to
spend more on advertising to enhance goodwill and reputation in term of product image and brand
identities. Developing countries‘ MNEs usually do not have ownership advantages based on
product differentiation and do not seem to require a substantial investment in advertising to
Page 13
DRAFT – Please do not cite or circulate without permission of the author
differentiate their products from those of their competitors since the goods marketed are low-to-
medium quality, labour-intensive, and price sensitive. A significantly positive relation with the
propensity to internationalisation of production has been found in many cases (e.g., Caves, 1974;
Grubaugh, 1987; Lall, 1980). This factor serves as a proxy for a firm's ability to differentiate its
products from those of its competitors, which is measured in this study by the advertising
expenditures to sales. Thus, we hypothesise that: Hypothesis 10. The more an EU firm advertises,
the more that firm will engage in FDI in China.
Product innovation The dominant model of FDI in 1960s was based on the ‗product cycle‘ paradigm (Vernon,
1971). This suggests that product innovation would take place in the home country, with foreign
markets initially entered by means of exports. Eventually, production would move to lower-cost
locations as firm-specific knowledge came to be acquired by competitors. For a single product
firm, foreign investment was thus viewed as a substitute for trade expertise and process
innovations. A foreign capital inflow through an acquisition, joint venture, or some other form of
capital transfer may lead to the installation of the foreign technology in the state-owned
enterprises. Both of these processes could manifest themselves in increasing innovative activity.
However, as multinationals generally undertake their innovative activity in the headquarters, large
inflows of foreign capital may actually be expected to reduce innovative activity, as these
functions may be redirected to the parent company‘s home country. In this study, product
innovation is measured as the natural logarithm of output involving new product innovation.
Following Trevino and Grosse (2002), we hypothesise that:
Hypothesis 11. The better an EU firm's production innovation, the greater the rate of conducting
FDI in China.
Financing structure
It is not clear how firms‘ debt ratios affect their FDI decisions. One can expect a positive
link between leverage and FDI due to the diversification strategies as more levered firms would be
more motivated to diversify their risk (Lien et al., 2005; Trevino and Grosse, 2002). Tan and
Vertinsky (1996) also considered this liquidity issue but reported the insignificance of this factor
on FDI decisions. On the other hand, it may be that less levered firms are financially more robust
and hence more confident in taking on more growth projects in the international markets. This
inverse relation is empirically reported by Luo et al. (2009) for US and Japanese firms, and Stoian
and Filippaios (2008) for Greek firms. In a more related study, Forssbaeck and Oxelheim (2008)
investigated in detail the effects of finance-specific variables on FDI, and argue the financing mix
of MNEs is particularly important if they operate in emerging countries. We measure leverage as
the ratio of total liabilities to total assets and hypothesise that:
Hypothesis 12. The EU firms with higher debt ratios will invest less in China.
2.2.3 Location-economic advantages
Three variables were used to measure Location-economic advantages:
Openness
Since we consider that Chinese FDI is market driven, market openness has to be considered
alongside market size. It is a standard hypothesis that openness promotes FDI. This proxy is also
important for foreign direct investors who are motivated by the export market. For instance
investments in manufacturing and technologically intensive industries enhance technological
spillovers and foster employment. In the literature, the ratio of trade to GDP is often used as a
measure of openness of a country and is also often interpreted as a measure of trade restrictions.
Page 14
DRAFT – Please do not cite or circulate without permission of the author
Empirical evidences (Jun and Singh, 1996) exist to back up the hypothesis that higher levels of
exports lead to higher FDI inflows. We therefore include Trade/GDP in the regression to examine
the impact of openness on FDI. Market openness has been found to be important for FDI flows in
numerous studies, such as Kravis and Lipsey (1982), Pistoresi (2000), Aizenman and Spiegel
(2006) and Buch et al. (2005). As a result, we suggest,
H1 3: the higher quality Rule law and lower Corruption in China, the more EU FDI flows into
China).
GDP. GDPPC
We measure market size by a few different indicators. The first (LNGDP) is the natural logarithm
of GDP in billion US$. We also use the natural logarithm of GDP per capita (GDPPC) in 1000
US$, and GDP growth (GDPGW) as alternatives to indicate market size. GDP is a significant
positive estimator of both China‘s FDI (Duanmu and Guney, 2009), GDP is proxy as Natural
logarithm of gross domestic product of China, and GDPPC is definite as GDP per capita in China
The FDI decisions of EU firms could also be related to external factors such as the legal and
macroeconomic environment of the FDI destination (Bevan et al., 2004; Rugman and Verbeke,
2001), especially in China (Dees, 1998). Dunning (2006) and Dunning‘s (1993) OLI framework
state that market size and openness of the host country are important FDI motivations. We
measure absolute and relative incom of the Chinese economy by GDP and GDP per capita,
respectively, during the 1998-2007 period. Openness is measured by the ratio of exports plus
imports to GDP in China.
Hypothesis 14, 15. The higher GDP, GDPPC growth in China, the more EU FDI flows in China
1.2.4 Location-institutional advantage
Three variables were used to measure Location-institutional advantages:
Exchange rate
The exchange rate has a most important link with economic policy and international
competitiveness, yet the effect of the exchange rate on FDI is one of the most controversial among
the less conventional factors of FDI. De Mello (1997) and Pain and Welsum (2003) argued that
host currency appreciation may well stimulate inward investment that wishes to sell within host
markets. Cushman (1984) suggested that host currency depreciation can make purchasing
intermediate goods from a home country more expensive and subsequently reduce import-needed
FDI.
Froot and Stein‘s (1991) imperfect capital market argument suggests that real exchange rate and
FDI inflows are positively correlated. Trevino and Grosse (2002) posit the same expectation.
However, the capital gain hypothesis suggests an inverse link (see e.g., De Santis et al., 2004). In
our case, a real depreciation of Euro increases the prices of foreign products for EU firms and
boosts the confidence of Chinese competitors, which can lead to an increase in FDI in China
H16a/b: The positive association of depreciating host currency (appreciating home currency) is
stronger on EU FDI to China
Corruption, Rule Law
Furthermore, we introduce two different institutional factors, i.e., ‗corruption‘ and ‗rule of law.‘
These variables can be proxies for the quality of legal environment in China and we expect that
lower corruption levels and higher rule of law values should attract more FDI from EU (see e.g.,
Forssbaeck and Oxelheim, 2008; Stoian and Filippaios, 2008). Corruption index data ranging
Page 15
DRAFT – Please do not cite or circulate without permission of the author
from zero to six is from PRS group, a consultant company specializing in producing macro
economic and political related data. A higher score represents lower corruption. Data for ‗rule of
law‘ is from World Governance Indicators by World Bank Institute. It captures perceptions of the
extent to which agents have confidence in and abide by the rules of society, and in particular the
quality of contract enforcement, property rights, the police, and the courts, as well as the
likelihood of crime and violence. The scores range between -2 and 2, with higher values
indicating a better law system.
H17, 18: The higher quality Rule law and lower Corruption in China, the more EU FDI flows into
China).
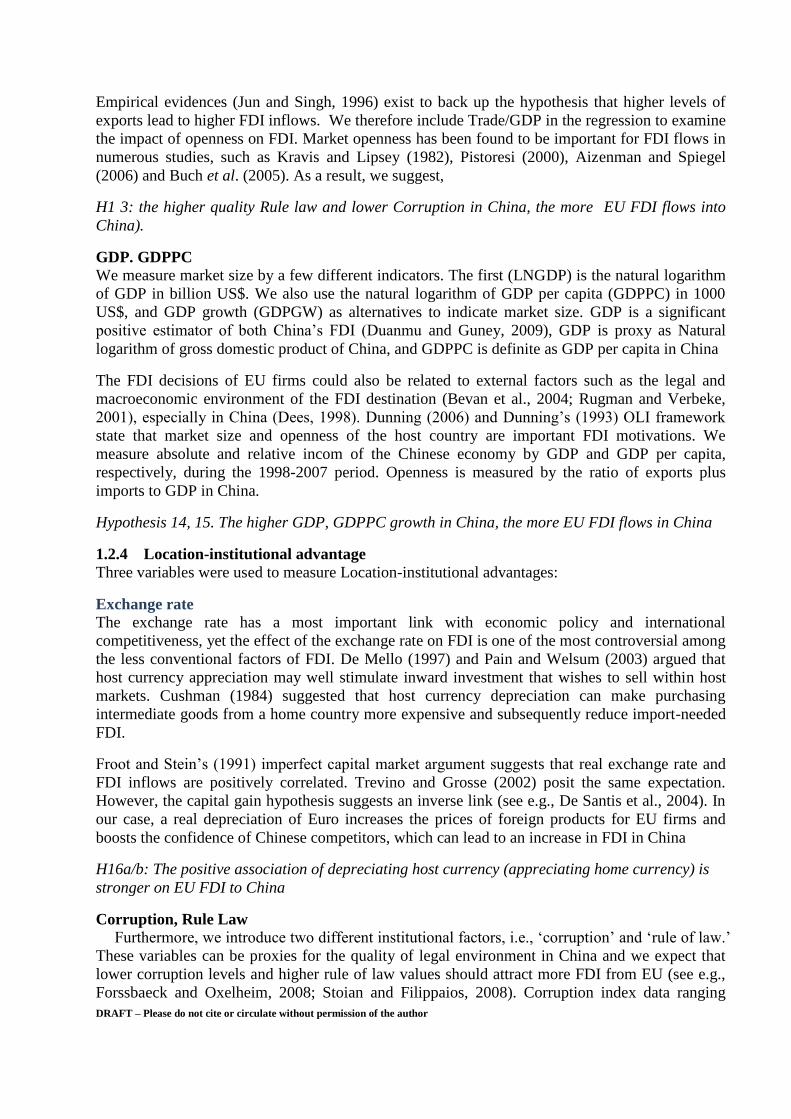
Finally, Our hypotheses, their theoretical justification, the proxies/definition we use and the
expected signs are detailed in Table 1; based on the literature review, we classified ownership
advantage and internalization advantage factors in panel A: Company–specific factors, and
location-economic and location- institutional factors in Panel B: Country-specific factors. We
expect the distinctive nature of the factors influencing EU FDI in China to be captured by the
collective significance in the variables that we identify in the table 1.
Table 1
Descriptive statistics and variable definitions.
Variable name
Definition
Mean
Media
n
Std
dev. Min. Max.
Theoretic
al
Justificati
on (expected sign)
Panel A. Company- specific factors:ownership advantage and internalization advantage factors
FDI 1 (Dep.
Var)
Natural logarithm of foreign
capital
10.22
5
10.81
7 3.027 0 15.71
FDI 2 (Dep.
Var)
Foreign capital over total
capital
0.759 0.891 0.289 0 1
Capital
intensity (+)
fixed assets to number of
employees
Ownershi
p
10.59
7
10.75
7 2.02 0 17.2
Firm size (+)
Natural logarithm of total
assets
Ownershi
p
12.07
2
12.06
1 1.618 0
17.42
5
R&D (+)
Intangible assets to total
assets
Internaliz
ation 0.031 0.004 0.055
-
0.013 0.604
Firm age (+)
Natural logarithm of years
since establishment in China
Ownershi
p 2.571 2.639 0.439 0.693 4.511
Export
intensity2 (+) Export sales over total sales
Ownershi
p 0.167 0.001 0.275 0 1
Profitability
(+)
Operating profits over total
assets
Ownershi
p 0.064 0.049 0.179
-
1.613 1.479
Wage (+)
Natural logarithm of real
wages
Ownershi
p 8.809 8.817 1.555 0
14.39
3
Personal share
(-)
Personal capital over total
capital
Internaliz
ation 0.006 0 0.055 0 1
Advertising (+)
advertising expenditures to
sales
Internaliz
ation 1.228 0 2.656 0 14.13
Technology (+)
Natural logarithm of
intangible assets
Internaliz
ation 4.877 6.485 4.498 0 14.53
Page 16
DRAFT – Please do not cite or circulate without permission of the author
Innovation (+)
Natural logarithm of output
involving new product
innovation
Internaliz
ation 1.855 0 4.379 0
18.38
4
Leverage (-)
Total liabilities over total
assets
Internaliz
ation 0.512 0.503 0.261 0 1
Panel B. Country- specific factors: location-economic and location- institutional factors
GDP (+)
Natural logarithm of gross
domestic product of China
Location-
econimic
factor
28.25
1
28.28
9 0.369
27.65
1
28.84
9
Openness (+)
Exports plus imports over
GDP in China
Location-
econimic
factor 0.585 0.654 0.127 0.364 0.72
GDPPC (+) GDP per capita in China
Location-
econimic
factor 7.271 7.304 0.353 6.706 7.848
Exchange rate
(-/+)
Exchange rate between Euro
and Chinese Yuan
location-
institution
al factor 9.624 9.722 1.216 7.37 11.25
Corruption (-) Corruption index for China
location-
institution
al factor 1.655 2 0.441 1 2
Rule of law (+) Rule of law in China
location-
institution
al factor -0.409 -0.411 0.046
-
0.484
-
0.358
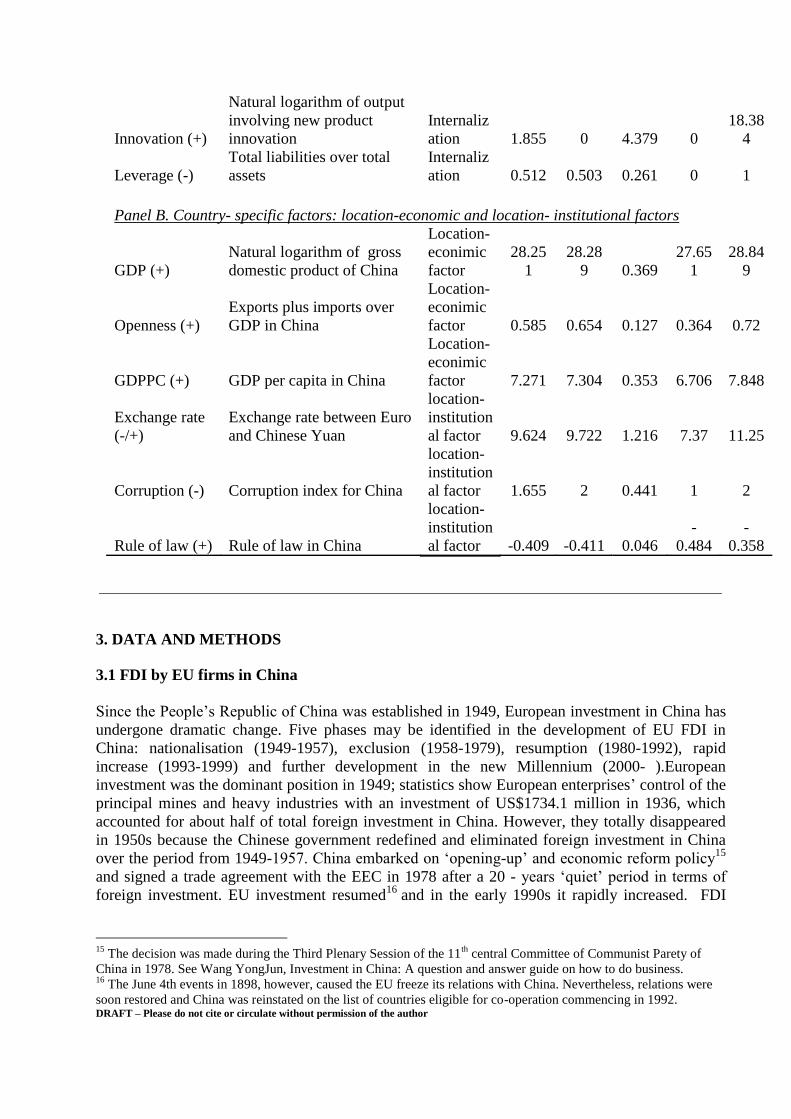
3. DATA AND METHODS
3.1 FDI by EU firms in China
Since the People‘s Republic of China was established in 1949, European investment in China has
undergone dramatic change. Five phases may be identified in the development of EU FDI in
China: nationalisation (1949-1957), exclusion (1958-1979), resumption (1980-1992), rapid
increase (1993-1999) and further development in the new Millennium (2000- ).European
investment was the dominant position in 1949; statistics show European enterprises‘ control of the
principal mines and heavy industries with an investment of US$1734.1 million in 1936, which
accounted for about half of total foreign investment in China. However, they totally disappeared
in 1950s because the Chinese government redefined and eliminated foreign investment in China
over the period from 1949-1957. China embarked on ‗opening-up‘ and economic reform policy15
and signed a trade agreement with the EEC in 1978 after a 20 - years ‗quiet‘ period in terms of
foreign investment. EU investment resumed16
and in the early 1990s it rapidly increased. FDI
15
The decision was made during the Third Plenary Session of the 11th
central Committee of Communist Parety of
China in 1978. See Wang YongJun, Investment in China: A question and answer guide on how to do business. 16
The June 4th events in 1898, however, caused the EU freeze its relations with China. Nevertheless, relations were
soon restored and China was reinstated on the list of countries eligible for co-operation commencing in 1992.
Page 17
DRAFT – Please do not cite or circulate without permission of the author
trends were character by trends with these aspects regarding the policy: entry modes17
, ideological
breakthroughs, governing laws, and Special Economic Zones (SEZs)18
with ‗special policies‘ and
‗flexible measures‘19
. Further development has taken place in the new Millennium against the
background of two of the biggest, mutual markets, bilateral political relations and China‘s
accession to the WTO (Qiu, 1999; Bulcke, 2003; Shan, 2005; European Commission, 2007). The
rapid evolution of European Union‘ foreign direct investment relationship with China has taken
the world by surprise, Detail discussed in Section 1
As regards the characteristic of EU firm in Chinese manufacturing sector in our research period
1998-2007, the firms are Middle - Large Sizes. Especially after WTO, a growing number of
leading EU MNCs have engaged in large-scale FDI in projects in China, considering the
investment climate as stable and with no risk. The equity share held by the EU firms in China
reached on average 60.9 per cent, a reflection of the dominant position in the ownership of their
operations in China. SOEs accounted for 14.91 per cent of capital share in 1978, but only 9.2 per
cent in 2007. Interestingly, private share accounted for only 0.67 per cent in 1985, but increased to
2.16 per cent in 1998. The contribution of domestic private enterprises to EU FDI inflow has
increased significantly because of the reform and privatization of SOEs in China on one hand, and
the EU firms‘ operations and strategies on the other hand (Peng et al. 2004, Bulcke, 2003).
Regarding the mode of EU firm in China, the duration of equity Joint Venture JVs (EJV),
contractual Joint Venture (CJV) and Wholly Foreign Enterprises (WFOE) of European-invested
enterprises rose significantly since the beginning of the 1990s. Majority and wholly owned firms
were chosen more frequently. The number of EU WFOE rose from 28 in1998 up to 183 in 2007
as a result of the introduction of the liberal Chinese ownership policy and the consequent changes
in the strategic options of EU firm‘s Chinese operations.
The sector distribution of EU firms in China has changed somewhat over the period 1998-2007.
Post –WTO (2002-2007) R&D based industries was more important compared to pre-2001(1998-
2001). As already mentioned, this probably reflected the positive perception of the political
situation of foreign investors in high-tech and long-term oriented projects at that time. The larger
EU presence is in combination of high-technology and labour intensive sectors such as raw
chemical materials & chemical products, Transport equipment, Electronic & telecommunications
and other electronic equipment.
3.2 Data
We use a new and comprehensive firm-level data set on the foreign activities of EU
manufacturing firms draw on two data sources: EU Firm FDI name list from Thomson one bank
and details of each principal variable from the Annual Reports of Industrial Enterprises Statistics
compiled by the National Bureau of Statistics of China (NBS). The Annual report covers the
population of firms (both foreign and local) with annual turnover of over five million Renminbi
(just above$600,000) inside China. It is estimated that the firms contained in the dataset account
for about 85–90% of total output in most industries. The dataset includes information on firm
ownership structure, industry affiliation, geographic location, establishment year, employment,
gross output, sales, R&D, value added, net fixed assets, exports, R&D, and employee training
17
China promulgated the Chinese-Foreign Equity joint Venture Law (EJVL) in 1979, WFOEs in 1986 and CJVs in
1988. 18
The first four SEZs were Zhenzhen, Zhuhai, and Shantou in Guangdong Province and Xiamen in Fujian Province.
In the 1990s, Hainan Province as a whole and Pudong New District in Shanghai were granted the same status, as were
21 cities along the Yangtze River and in the Northeast. 19
The ‗special policies‘ and ‗flexible measures‘ can be interpreted as special privileges and treatment for foreigners
investing in these zones, where they could carry out investment and trading activities that were not allowed in th e
rest of the country , or were allowed but with less favourable conditions.
Page 18
DRAFT – Please do not cite or circulate without permission of the author
expenditures. For the NBS the original dataset covers an unbalanced panel spanning the period
1998-2007. However, in view of the objective of this paper and we restrict our attention to the EU
firms. In China, all the firms, local foreign, are required by law to complete the census survey
conducted by NBS. It includes data for 33 two-digit manufacturing industries and over 400 four-
digit industries.
The data set is suitable for studying the EU Firms FDI in China for the following reasons. First,
Pan, Li, & Tse (1999) have reported that census data are reliable and internally consistent for
empirical studies. Studies using the data have been published in leading journals (Tan & Peng,
2003; Wei & Liu, 2006; Girma and Gong, 2008). Second, the NBS pays special attention to
ensuring the quality of the data. Several logic tests are performed to ensure the accuracy of the
information in the report, identify and eliminate illogical data points and ensuring the consistency
of the reported figures. A notable feature of this data is that information disclosure by firms is
compulsory, leading to a 100% response rate. While inaccurate data disclosure has been a feature
of many transition economies, Chinese networks and the two–way interdependence of firms and
the State make major inaccuracies less likely. Third, this dataset has at least two advantages: it
covers a very recent period, and it allows us to control for observable and unobservable firm-level
characteristics in order to mitigate aggregation bias. The multi-year census data enable us to
employ a panel data structure to test our models. Thus we can investigate firms‘ foreign
investment activities over time, and test the dynamic causal relationship, which is the main
advantage over static cross-sectional data (Fitzmaurice, Laird, & Ware, 2004; Dunning 2009;
Gao et al., 2010).
Another feature of the database is that EU firms are classified under five ownership (status)
categories: state-owned, collective-owned, corporate-owned, and personal-owned and HKMT-
owned, while a continuous measure of other ownership composition is constructed from the data
base by looking at the fraction of paid in capital by other investors. This is the key variable as far
as this paper is concerned since it identifies the level of treatment received by EU firm in China.
This feature remains a unique enterprise identifier irrespective of dynamics of ownership change.
In our study, we focus on private-owned share variables; one is based on no previous empirical
study, the other is the variable is largest (dynamic) change among ownership structure under the
more liberal Chinese FDI policy with respect to ownership. Accordingly, we identified less than
0.9% personal share capital at the start of the sample (i.e., 1998), and by the end of the sample
period (2007), more than 18% of these were still under majority EU ownership capital. The
dataset has the necessary time series information for dynamic panel data GMM estimations to
determine EU firm FDI model.
As a result, our final dataset consist of an unbalanced panel of 2,932 observations from about 680
EU firms over the period 1998-2007 in China after standard data filtering. We follow criteria
from the first Economic Census in classifying the EU firms 30 sectors in large & middle
mafumafacturing industry and 9 industries according to SIC classes.
3.3 Descriptive statistics
Table 1 provides descriptive statistics for the firm-specific (ownership and Internalization
factors) and country-specific (Location-economic and Location-institution) factors. It further
shows variables‘ definitions and their expected relation with FDI. With respect to the mean values
of some of the explanatory variables, firm profitability is about 6.5%, which is not particularly
high and it may imply that EU firms‘ low profitability could be a driving motive to invest in
China. The leverage ratio is around 51% and can be considered as relatively high. Furthermore,
ownership of less than 1% at personal level seems to be low. The average age of EU firms is
about 14 years, which may imply that relatively younger firms would seek opportunities in China
to grow. Regarding the export intensity, about 17% of EU firms‘ sales are in the form of exports.
The R&D intensity, on the other hand, is just over 3%.
Page 19
DRAFT – Please do not cite or circulate without permission of the author
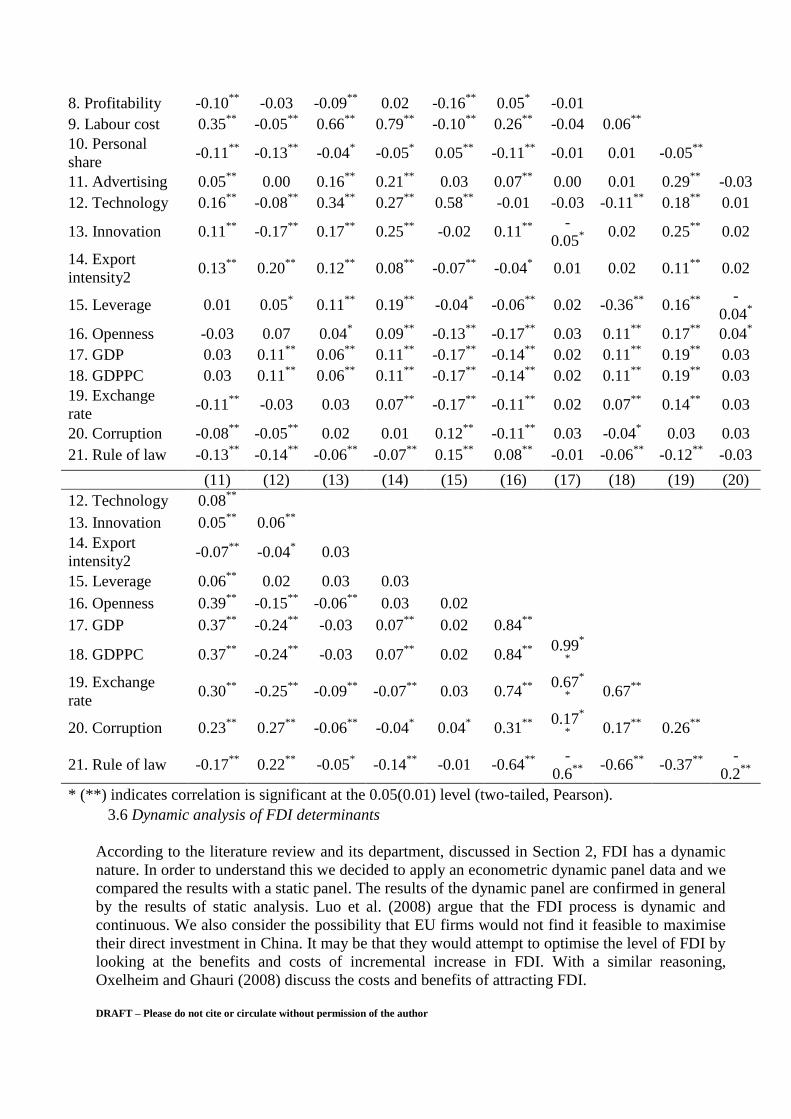
3.4 Correlation matrix
Table 2 presents the correlation matrix between the variables. Our dependent variable is the FDI
in China made by EU MNEs, which is continuous. We measure EU FDI in China in two ways; i)
the natural logarithm of foreign capital, ii) the ratio of foreign capital to total capital. All the non-
ratio variables in this study are inflation-adjusted. In what follows, we discuss the potential FDI
determinants at firm and country level.
The signs of the coefficients based on the link between FDI 1 and firm-specific factors are
generally consistent with predictions, except on Profitability. Regarding the country-specific
factors, Exchange rate, Rule of law and Corruption produce signs that contrast with the
expectations. When examining the coefficient signs based on FDI 2, there are more factors with
unexpected signs. Although these preliminary findings based on a univariate analysis give us
some insights, one needs to be cautious of the limitations of such an analysis.
Table 2
Correlation matrix.
(1) (2) (3) (4) (5) (6) (7) (8) (9) (10)
1. FDI 1 1.00
2. FDI 2 0.59**
3. Capital
intensity 0.46
** -0.02
4. Firm size 0.44**
-0.06**
0.84**
5. R&D 0.05**
-0.02 0.04* -0.04
*
6. Firm age 0.07
** -0.09
** 0.09
** 0.17
** -0.10
**
7. Export
intensity1 -0.04 0.03 -0.03 -0.04
* -0.02 -0.04
*
8. Profitability -0.10**
-0.03 -0.09**
0.02 -0.16**
0.05* -0.01
9. Labour cost 0.35
** -0.05
** 0.66
** 0.79
** -0.10
** 0.26
** -0.04 0.06
**
10. Personal
share -0.11
** -0.13
** -0.04
* -0.05
* 0.05
** -0.11
** -0.01 0.01 -0.05
**
11.
Advertising 0.05
** 0.00 0.16
** 0.21
** 0.03 0.07
** 0.00 0.01 0.29
** -0.03
12.
Technology 0.16
** -0.08
** 0.34
** 0.27
** 0.58
** -0.01 -0.03 -0.11
** 0.18
** 0.01
13. Innovation 0.11**
-0.17**
0.17**
0.25**
-0.02 0.11**
-
0.05*
0.02 0.25**
0.02
14. Export
intensity2 0.13
** 0.20
** 0.12
** 0.08
** -0.07
** -0.04
* 0.01 0.02 0.11
** 0.02
15. Leverage 0.01 0.05* 0.11
** 0.19
** -0.04
* -0.06
** 0.02 -0.36
** 0.16
**
-
0.04*
16. Openness -0.03 0.07 0.04* 0.09
** -0.13
** -0.17
** 0.03 0.11
** 0.17
** 0.04
*
17. GDP 0.03 0.11**
0.06**
0.11**
-0.17**
-0.14**
0.02 0.11**
0.19**
0.03
18. GDPPC 0.03 0.11**
0.06**
0.11**
-0.17**
-0.14**
0.02 0.11**
0.19**
0.03
19. Exchange
rate -0.11
** -0.03 0.03 0.07
** -0.17
** -0.11
** 0.02 0.07
** 0.14
** 0.03
20. Corruption -0.08**
-0.05**
0.02 0.01 0.12**
-0.11**
0.03 -0.04* 0.03 0.03
Page 20
DRAFT – Please do not cite or circulate without permission of the author
21. Rule of
law -0.13
** -0.14
** -0.06
** -0.07
** 0.15
** 0.08
** -0.01 -0.06
** -0.12
** -0.03
(11) (12) (13) (14) (15) (16) (17) (18) (19) (20)
12.
Technology 0.08
**
13. Innovation 0.05**
0.06**
14. Export
intensity2 -0.07
** -0.04
* 0.03
15. Leverage 0.06**
0.02 0.03 0.03
16. Openness 0.39**
-0.15**
-0.06**
0.03 0.02
17. GDP 0.37**
-0.24**
-0.03 0.07**
0.02 0.84**
18. GDPPC 0.37**
-0.24**
-0.03 0.07**
0.02 0.84**
0.99
*
*
19. Exchange
rate 0.30
** -0.25
** -0.09
** -0.07
** 0.03 0.74
**
0.67*
*
0.67**
20. Corruption 0.23**
0.27**
-0.06**
-0.04* 0.04
* 0.31
**
0.17*
*
0.17**
0.26**
21. Rule of
law -0.17
** 0.22
** -0.05
* -0.14
** -0.01 -0.64
**
-
0.6**
-0.66
** -0.37
**
-
0.2**
* (**) indicates correlation is significant at the 0.05(0.01) level (two-tailed, Pearson).
3.5 Static analysis of FDI determinants
Our discussion suggests the following log-linear model (1); the data are transformed into natural
logarithms as we expect non-linearities in the relationships on the basis of theory and previous
empirical work. The determinants of EU FDI in China are examined using the model below, and
the following multiple regression equation is employed as the base specification for the empirical
test to identify the major determinants of China‘s FDI inflows from EU firms
(1)
where FSF and CSF are firm-specific and country-specific factors, respectively, as shown in
Table 3; α (the intercept term), β and γ are estimable coefficients; ε is the error term; i and t stand
for firm and time, respectively. FDI is either FDI 1 or FDI 2.
Equation (1) is used as a regression model for the pooled OLS, random effects (RE) and fixed
effects (FE) estimation methods. We report both RE and FE outputs for comparative purposes
even if the Hausman test favours the latter.
Table 2
Correlation matrix.
(1) (2) (3) (4) (5) (6) (7) (8) (9) (10)
1. FDI 1 1.00
2. FDI 2 0.59**
3. Capital
intensity 0.46
** -0.02
4. Firm size 0.44**
-0.06**
0.84**
5. R&D 0.05**
-0.02 0.04* -0.04
*
6. Firm age 0.07
** -0.09
** 0.09
** 0.17
** -0.10
**
7. Export
intensity1 -0.04 0.03 -0.03 -0.04
* -0.02 -0.04
*
Page 21
DRAFT – Please do not cite or circulate without permission of the author
8. Profitability -0.10**
-0.03 -0.09**
0.02 -0.16**
0.05* -0.01
9. Labour cost 0.35
** -0.05
** 0.66
** 0.79
** -0.10
** 0.26
** -0.04 0.06
**
10. Personal
share -0.11
** -0.13
** -0.04
* -0.05
* 0.05
** -0.11
** -0.01 0.01 -0.05
**
11. Advertising 0.05**
0.00 0.16**
0.21**
0.03 0.07**
0.00 0.01 0.29**
-0.03
12. Technology 0.16**
-0.08**
0.34**
0.27**
0.58**
-0.01 -0.03 -0.11**
0.18**
0.01
13. Innovation 0.11**
-0.17**
0.17**
0.25**
-0.02 0.11**
-
0.05*
0.02 0.25**
0.02
14. Export
intensity2 0.13
** 0.20
** 0.12
** 0.08
** -0.07
** -0.04
* 0.01 0.02 0.11
** 0.02
15. Leverage 0.01 0.05* 0.11
** 0.19
** -0.04
* -0.06
** 0.02 -0.36
** 0.16
**
-
0.04*
16. Openness -0.03 0.07 0.04* 0.09
** -0.13
** -0.17
** 0.03 0.11
** 0.17
** 0.04
*
17. GDP 0.03 0.11**
0.06**
0.11**
-0.17**
-0.14**
0.02 0.11**
0.19**
0.03
18. GDPPC 0.03 0.11**
0.06**
0.11**
-0.17**
-0.14**
0.02 0.11**
0.19**
0.03
19. Exchange
rate -0.11
** -0.03 0.03 0.07
** -0.17
** -0.11
** 0.02 0.07
** 0.14
** 0.03
20. Corruption -0.08**
-0.05**
0.02 0.01 0.12**
-0.11**
0.03 -0.04* 0.03 0.03
21. Rule of law -0.13**
-0.14**
-0.06**
-0.07**
0.15**
0.08**
-0.01 -0.06**
-0.12**
-0.03
(11) (12) (13) (14) (15) (16) (17) (18) (19) (20)
12. Technology 0.08**
13. Innovation 0.05**
0.06**
14. Export
intensity2 -0.07
** -0.04
* 0.03
15. Leverage 0.06**
0.02 0.03 0.03
16. Openness 0.39**
-0.15**
-0.06**
0.03 0.02
17. GDP 0.37**
-0.24**
-0.03 0.07**
0.02 0.84**
18. GDPPC 0.37**
-0.24**
-0.03 0.07**
0.02 0.84**
0.99
*
*
19. Exchange
rate 0.30
** -0.25
** -0.09
** -0.07
** 0.03 0.74
**
0.67*
*
0.67**
20. Corruption 0.23**
0.27**
-0.06**
-0.04* 0.04
* 0.31
**
0.17*
*
0.17**
0.26**
21. Rule of law -0.17**
0.22**
-0.05* -0.14
** -0.01 -0.64
**
-
0.6**
-0.66
** -0.37
**
-
0.2**
* (**) indicates correlation is significant at the 0.05(0.01) level (two-tailed, Pearson).
3.6 Dynamic analysis of FDI determinants
According to the literature review and its department, discussed in Section 2, FDI has a dynamic
nature. In order to understand this we decided to apply an econometric dynamic panel data and we
compared the results with a static panel. The results of the dynamic panel are confirmed in general
by the results of static analysis. Luo et al. (2008) argue that the FDI process is dynamic and
continuous. We also consider the possibility that EU firms would not find it feasible to maximise
their direct investment in China. It may be that they would attempt to optimise the level of FDI by
looking at the benefits and costs of incremental increase in FDI. With a similar reasoning,
Oxelheim and Ghauri (2008) discuss the costs and benefits of attracting FDI.
Page 22
DRAFT – Please do not cite or circulate without permission of the author
Assume that a firm (i) has a target FDI level at time (t), denoted as FDI*it, which is
determined by a set of firm- and country-specific variables (Xs):
(2)
where x is a vector of k explanatory variables; νit is a serially correlated disturbance term with
mean zero and possibly heteroscedastic; and μ‘s are unknown estimable parameters.
The model assumes that EU firms adjust their current FDI level (FDIit) according to the degree of
adjustment coefficient ‗ρ‘, to achieve their target FDI intensity:
ρ (3)
The actual change in FDI will be equal to the target change when ρ is one. If, however, ρ
is zero, EU firms would adopt no changes in their FDI policy, suggesting that either the lagged
level is the target FDI level, or the adjustment cost is higher than the cost of remaining off- target.
We can obtain equation (4) by substituting (2) into (3):
ρ ρ ρ ν
(4)
The equation (4) assumes that ρ takes values within the [0, 1] range. If the cost of being off-target
is higher (lower) than the cost of changing FDI policies, then ρ converges to one (zero).20
The
random disturbance term νit includes both time-invariant and firm-invariant effects.
Dees (1998), De Santis et al. (2004) and Hsiao and Hsiao (2004) also consider the error
correction mechanism and use the lagged dependent variable (FDIt-1) as an explanatory variable.
The inclusion of FDIt-1 in (4) as a regression model would produce biased results when OLS, RE
or FE estimations are used. In order to avoid any potential bias, the FDI literature (e.g., Cheng and
Kwan, 2000) propose the use of GMM technique for a dynamic model such as (4).21
Being
consistent with the agglomeration effect, the inclusion of FDIt-1 can represent a positive feedback
effect, suggesting that higher existing FDI can attract further future FDI (Buch et al., 2005; Head
and Ries, 1996; Luo et al., 2008).
4 FINDING AND DISCUSSION
This section reports both static and dynamic analysis regression results. We considered the
possibility of the non-monotonous association of FDI with the factors age, R&D and size (see e.g.,
Pradhan, 2004): The results do not confirm any obvious non-linear link for age but for R&D and
size. Therefore, we report the results below assuming a non-linear association of FDI with R&D
and size. Furthermore, our initial findings reveal that time and industry dummies are not
statistically significant. This may be expected because all the firms in our sample are from the
manufacturing sector, and some country-specific factors already account for time effects. Hence,
20
This section is based on the partial adjustment mechanism (Blinder, 1986), and error correction mechanism
discussing long-term relationship between two factors and short-term deviation from equilibrium (Engle and Granger,
1987; Johansen, 1988). As discussed in Blundell and Bond (1998), and Dees (1998), the long-term relation between
the dependent variable and its determinants may differ from the short-term effects.
21
Under the two-step system-GMM, the model is estimated in both levels and first differences; i.e., in stacked
regressions level equations are simultaneously estimated using differenced lagged regressors as instruments. The
GMM technique controls for the endogeneity problem that arises because of random shocks affecting simultaneously
both FDI level and its determinants. Trevino and Daniels (1994) raise this endogeneity issue with the example of
whether firms have FDI because they are profitable or vice-versa. Similarly, Dunning and Narula (1995) state that
international R&D investment may lag rather than lead investment in international production facilities, with the latter
being a determinant of the former. GMM also addresses the issue of unobservable firm heterogeneity. See Blundell
and Bond (1998), and Zwinkels and Beugelsdijk (2010), among others, for further details about the comparison of
various estimation methods.
Page 23
DRAFT – Please do not cite or circulate without permission of the author
we do not include in our models these dummy variables, noting that inclusion of these dummies
does not change the quality of results.
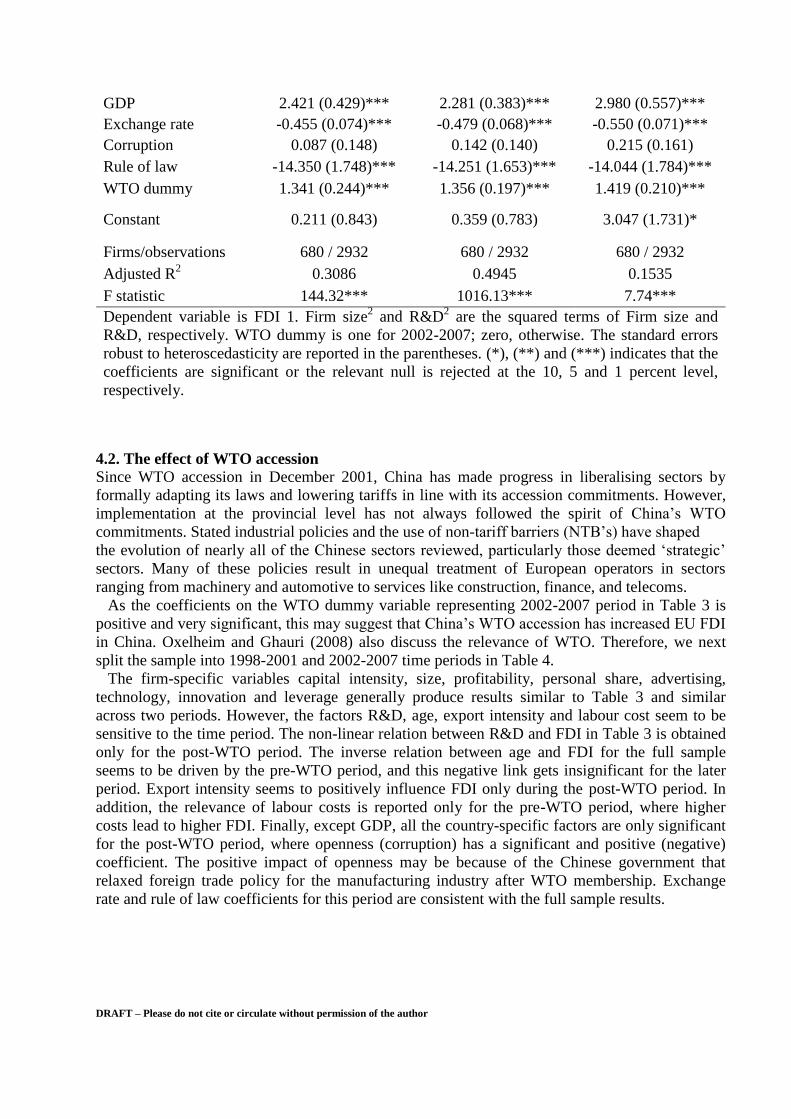
4.1 Static analysis
Table 3 reports the regression results for the static model using OLS, FE and RE methods.22
It
seems the EU firms with higher capital intensity tend to invest more in China as the respective
coefficient is positive across all methods and significant for OLS and RE methods. This finding
confirms hypothesis 1 and is in line with the observation that the investment experience of EU
firms is characterized as capital intensive industries (e.g., machinery and transport equipment)
rather than high labour input such as textiles and furniture. This finding is consistent with
Dunning (2000), and Roberts and Tybout (1997), among others.
Blomstrom and Lipsey (1989), and Buckley and Casson (1976) argue that a firm‘s size reflects
its capability to engage in these types of activities. The results in Table 3 reveal a reverse-U shape
between FDI and size, suggesting that size and FDI are positively linked for smaller firms but the
relation becomes inverse for larger companies. This finding is comparable to Pradhan (2004) for
Indian manufacturing firms. We report the same type of a non-linear correlation between FDI and
R&D, which implies that higher R&D intensity improves FDI in China but after some point R&D
and FDI move in opposite directions. These findings do not confirm hypotheses 2 and 3 in the
sense that they assume linearity.
Our findings also suggest that EU firms with higher export intensity tend to engage more in
Chinese FDI, confirming hypothesis 3. Rather surprisingly, we find that firm profitability and FDI
are significantly and inversely related. MNEs are usually in a better financial position to raise
capital. High profitability will increase the probability of expanding abroad, as confirmed by
Trevino and Daniels (1994) for U.S. FDI. There can be a few reasons why EU FDI in China may
not behave in the conventional manner. First, the theories about the determinants of FDI are
derived from Dunning‘s OLI paradigm. This approach offers a valuable framework to determine,
on one hand, what a firm‘s ownership advantages are, and on the other, how these advantages can
be enhanced by using specific location sites. It may also be that because the EU MNEs invested in
China with a market–seeking motive, they were especially concerned with access to the domestic
market (distribution network and market information and the relationship with host government),
rather than profit-seeking. Moreover, the significantly positive coefficient on labour cost is
consistent with hypothesis 6, implying that higher employee costs lead to more FDI in China.
Confirming Luo et al. (2009), we find that age and FDI are linearly but inversely linked. Hence,
this is inconsistent with hypothesis 4. The coefficient estimate on ownership structure is strongly
negative. This means that the less the share ownership at personal level, the greater EU FDI in
China, which supports hypothesis 9. Regarding the technology factor, the significantly negative
coefficient contradicts hypothesis 8 as it suggests that higher technological intensity actually
lowers FDI. Trevino and Daniels (1994) also fail to detect a positive and significant association. It
maybe that high-technology EU firms have firm-specific advantages that cannot easily be
emulated, hence they would prefer to export rather than internalise production via FDI because of
their quasi-monopolistic power (Giddy, 1978).
The significantly negative coefficient on leverage reveals that higher debt usage in EU
firms‘ capital structure reduces their FDI activity in China, which is consistent with hypothesis 12,
and Luo et al. (2009). Finally, the estimated coefficients related to advertising intensity and
product innovation imply that these factors do not affect significantly EU firms‘ decisions to
invest in China.
22
The censored Tobit regressions were conducted as our dependent variable is limited not to take negative values.
The Tobit results (not reported) are very similar to the OLS estimates.
Page 24
DRAFT – Please do not cite or circulate without permission of the author
We next discuss the implications of the macroeconomic or institutional factors. The
significantly negative coefficient on exchange rate implies that the depreciation of Chinese Yuan
against Euro reduces EU FDI into China, which supports the capital gain hypothesis.23
As
expected, the positive coefficient on GDP implies that higher market size is directly linked to FDI,
which confirms Forssbaeck and Oxelheim (2008), among others. It seems the level of corruption
does not affect EU firms‘ FDI decisions. Surprisingly, improvements in rule of law and trade
openness seem to deter FDI made by EU firms. The negativity of rule of law may stem from the
notion that EU MNEs in Chinese manufacturing industry are principally based on a market–
seeking motive despite relatively low profitability and despite the substantial market access
barriers for trade and investment in China.24
23
The results are robust to the multicollinearity problem as the variance inflation factors (VIFs) are between the range
of 1.02 and 8.87. Furthermore, replacing GDP by GDPPC or using alternative export intensity measures produces
qualitatively the same results. As being another robustness check, we dropped openness and kept GDP in the model
(and vice-versa) because of high correlation coefficient between them. Again, the results remain largely the same with
when both variables are included in the same model.
24
Since WTO accession in December 2001, China has made progress in liberalising sectors by formally adapting its
laws and lowering tariffs in line with its accession commitments. However, implementation at the provincial level has
not always followed the spirit of China‘s WTO commitments (European Commission, 2007:4, ‗Study on the future
opportunities and challenges in EU-China trade and investment relations 2006-2010‘).
Table 3
Firm-specific and country-specific factors influencing foreign direct investment decisions
(1998-2007).
Pooled OLS Random effects Fixed effects
Company-specific factors:( ownership
advantage and internalization advantage
factors)
Capital intensity 0.259 (0.062)*** 0.225 (0.083)*** 0.082 (0.136)
Firm size 0.783 (0.093)*** 0.724 (0.106)*** 1.154 (0.308)***
Firm size 2
-0.012 (0.004)*** -0.009 (0.004)** -0.045 (0.019)**
R&D 6.290 (2.512)*** 6.044 (2.774)** 4.378 (2.186)**
R&D2
-13.629 (6.803)** -12.317 (5.688)** -7.125 (2.933)**
Firm age -0.175 (0.102)* -0.199 (0.108)* -2.230 (1.127)**
Export intensity2 0.466 (0.129)*** 0.501 (0.173)*** 0.482 (0.240)**
Profitability -2.117 (0.316)*** -1.938 (0.350)*** -1.117 (0.428)***
Labour cost 0.092 (0.055)* 0.114 (0.067)* 0.128 (0.075)*
Personal share -5.443 (1.581)*** -5.707 (1.775)*** -7.473 (2.251)***
Advertising 0.009 (0.024) 0.016 (0.028) 0.029 (0.038)
Technology -0.002 (0.020) -0.013 (0.021) -0.038 (0.018)**
Innovation -0.012 (0.011) -0.003 (0.016) 0.033 (0.024)
Leverage -1.340 (0.218)*** -1.348 (0.266)*** -0.905 (0.440)**
Country-specific factors:( location-economic
and location- institutional factors)
Openness -11.717 (1.759)*** -11.499 (1.626)*** -10.379 (1.793)***
Page 25
DRAFT – Please do not cite or circulate without permission of the author
4.2. The effect of WTO accession
Since WTO accession in December 2001, China has made progress in liberalising sectors by
formally adapting its laws and lowering tariffs in line with its accession commitments. However,
implementation at the provincial level has not always followed the spirit of China‘s WTO
commitments. Stated industrial policies and the use of non-tariff barriers (NTB‘s) have shaped
the evolution of nearly all of the Chinese sectors reviewed, particularly those deemed ‗strategic‘
sectors. Many of these policies result in unequal treatment of European operators in sectors
ranging from machinery and automotive to services like construction, finance, and telecoms.
As the coefficients on the WTO dummy variable representing 2002-2007 period in Table 3 is
positive and very significant, this may suggest that China‘s WTO accession has increased EU FDI
in China. Oxelheim and Ghauri (2008) also discuss the relevance of WTO. Therefore, we next
split the sample into 1998-2001 and 2002-2007 time periods in Table 4.
The firm-specific variables capital intensity, size, profitability, personal share, advertising,
technology, innovation and leverage generally produce results similar to Table 3 and similar
across two periods. However, the factors R&D, age, export intensity and labour cost seem to be
sensitive to the time period. The non-linear relation between R&D and FDI in Table 3 is obtained
only for the post-WTO period. The inverse relation between age and FDI for the full sample
seems to be driven by the pre-WTO period, and this negative link gets insignificant for the later
period. Export intensity seems to positively influence FDI only during the post-WTO period. In
addition, the relevance of labour costs is reported only for the pre-WTO period, where higher
costs lead to higher FDI. Finally, except GDP, all the country-specific factors are only significant
for the post-WTO period, where openness (corruption) has a significant and positive (negative)
coefficient. The positive impact of openness may be because of the Chinese government that
relaxed foreign trade policy for the manufacturing industry after WTO membership. Exchange
rate and rule of law coefficients for this period are consistent with the full sample results.
GDP 2.421 (0.429)*** 2.281 (0.383)*** 2.980 (0.557)***
Exchange rate -0.455 (0.074)*** -0.479 (0.068)*** -0.550 (0.071)***
Corruption 0.087 (0.148) 0.142 (0.140) 0.215 (0.161)
Rule of law -14.350 (1.748)*** -14.251 (1.653)*** -14.044 (1.784)***
WTO dummy 1.341 (0.244)*** 1.356 (0.197)*** 1.419 (0.210)***
Constant 0.211 (0.843) 0.359 (0.783) 3.047 (1.731)*
Firms/observations 680 / 2932 680 / 2932 680 / 2932
Adjusted R2 0.3086 0.4945 0.1535
F statistic 144.32*** 1016.13*** 7.74***
Dependent variable is FDI 1. Firm size2 and R&D
2 are the squared terms of Firm size and
R&D, respectively. WTO dummy is one for 2002-2007; zero, otherwise. The standard errors
robust to heteroscedasticity are reported in the parentheses. (*), (**) and (***) indicates that the
coefficients are significant or the relevant null is rejected at the 10, 5 and 1 percent level,
respectively.
Page 26
DRAFT – Please do not cite or circulate without permission of the author
Table 4
Firm-specific and country-specific factors influencing foreign direct investment
decisions.
1998-2001 (pre-WTO) 2002-2007 (post-WTO)
OLS RE FE OLS RE FE
Company-specific factors:
Capital intensity
0.440
(0.118)*
**
0.437
(0.135)*
**
-0.006
(0.413)
0.187
(0.070)*
**
0.154
(0.075)*
*
-0.024
(0.150)
Firm size
0.810
(0.205)*
**
0.808
(0.231)*
**
1.875
(0.941)*
*
0.869
(0.107)*
**
0.823
(0.108)*
**
1.283
(0.299)*
**
Firm size 2
-0.030
(0.009)*
**
-0.029
(0.009)*
**
-0.097
(0.048)*
*
-0.008
(0.004)*
*
-0.008
(0.004)*
*
-0.046
(0.018)*
**
R&D 2.966
(2.852)
2.979
(3.465)
1.044
(4.840)
7.660
(3.416)*
*
7.330
(3.292)*
*
3.387
(1.690)*
*
R&D2 -4.154
(8.585)
-4.101
(10.536)
0.927
(10.569)
-16.308
(7.924)*
*
-15.146
(7.540)*
*
-8.178
(4.014)*
*
Firm age
-0.553
(0.276)*
*
-0.551
(0.233)*
*
-2.459
(1.054)*
*
-0.107
(0.129)
-0.112
(0.144) -1.961
(1.380)
Export intensity -0.037
(0.288)
-0.035
(0.348)
-0.024
(0.473)
0.407
(0.136)*
**
0.336
(0.159)*
*
-0.037
(0.567)
Profitability
-2.125
(0.459)*
**
-2.090
(0.496)*
**
-0.758
(0.443)*
-2.093
(0.379)*
**
-1.947
(0.418)*
**
-0.720
(0.421)*
Labour cost
0.279
(0.121)*
*
0.277
(0.120)*
*
0.163
(0.095)*
-0.030
(0.070)
-0.005
(0.075) 0.055
(0.115)
Personal share
-14.185
(2.682)*
**
-14.198
(2.922)*
**
-17.331
(3.014)*
**
-3.827
(1.701)*
*
-3.934
(1.873)*
*
-5.584
(2.705)*
*
Advertising 0.001
(0.001)
0.001
(0.001)
0.001
(0.001)
0.013
(0.024)
0.010
(0.027)
0.011
(0.039)
Technology 0.002
(0.027)
0.002
(0.03)
-0.054
(0.060)
0.020
(0.028)
0.017
(0.027)
0.005
(0.028)
Innovation 0.005
(0.017)
0.006
(0.018)
0.006
(0.037)
-0.025
(0.012)*
*
-0.016
(0.019) 0.044
(0.032)
Leverage
-1.263
(0.257)*
**
-1.251
(0.295)*
**
0.143
(1.102)
-1.363
(0.271)*
**
-1.323
(0.291)*
**
-0.629
(0.372)*
Country-specific factors:
Page 27
DRAFT – Please do not cite or circulate without permission of the author
4.3 Dynamic analysis
As FDI isn‘t static and an add-on dynamic component to the eclectic paradigm, ( Dunning, 2000)
and an extension of its constituent parts to embrace both asset augmenting and alliance related
cross-border ventures can do much to uphold its position as the dominant analytical framework
for examining the determinants of international production We believe that recent economic
events (China access WTO), and the emergence of new explanations of MNE activity have added
to, rather than subtracted from, the robustness of the paradigm. While accepting that, in spite of its
eclecticism (sic), there may be some kinds of foreign owned value added activities which do not
fit comfortably into its construction, we do believe that it continues to meet most of the criteria of
a good paradigm; and that it is not yet approaching its own ‗creative destruction‘ (Foss, 1996).34
Table 5 provides the results for the dynamic model (4) using GMM. In the ‗general‘ model, we
include all factors in the regression model. In the ‗specific‘ model, we follow the general-to-
specific approach and drop the insignificant explanatory variables from the ‗general‘ model and
re-run the regressions (see e.g., Forssbaeck and Oxelheim (2008). The general and specific results
appear consistent with each other.
First, we examine whether EU firms optimise their FDI level in China due to various costs and
benefits by looking at the effect of lagged FDI on current FDI. The coefficient estimate on lagged
FDI 1 is positive and insignificant but still positive and less than one. On the other hand, when we
use FDI 2 as an alternative definition, the coefficient turns out to be significant, positive and
Openness 0.001
(0.001)
0.001
(0.001)
0.001
(0.001)
15.051
(4.457)*
**
15.065
(3.806)*
**
13.553
(3.896)*
**
GDP -0.152
(2.827)
-0.004
(0.079)
1.399
(3.406)
-0.652
(0.543)
-0.702
(0.450)
0.311
(0.646)
Exchange rate 0.040
(0.226)
0.046
(0.121)
-0.095
(0.213)
-0.957
(0.123)*
**
-0.966
(0.113)*
**
-0.995
(0.121)*
**
Corruption -0.078
(0.324)
-0.053
(0.29)
0.139
(0.335)
-2.715
(0.568)*
**
-2.679
(0.496)*
**
-2.323
(0.526)*
**
Rule of law 0.001
(0.001)
0.183
(3.327)
0.001
(0.001)
-7.348
(2.005)*
**
-7.357
(1.762)*
**
-8.084
(1.924)*
**
Constant 1.643
(1.010)*
1.640
(1.010)*
2.229
(2.591)
6.740
(1.248)*
**
6.601
(1.096)*
**
9.440
(2.504)*
**
Firms/observati
ons 309/ 786 309/ 786 309/ 786
606/
2146
606/
2146 606/2146
Adjusted R2 0.3707 0.5520 0.1757 0.3191 0.4856 0.1917
F (Wald)
statistic 45.80*** 404.1*** 5.70***
122.16**
*
1056.3**
* 7.50***
Dependent variable is FDI 1. The standard errors robust to heteroscedasticity are
reported in the parentheses. (*), (**) and (***) indicates that the coefficients are
significant or the relevant null is rejected at the 10, 5 and 1 percent level, respectively.
Page 28
DRAFT – Please do not cite or circulate without permission of the author
between the [0, 1] range.25
Therefore, these findings imply that there is some evidence that EU
firms tend to adjust their FDI level in China in an attempt to be on the desired level. The
sensitivity of coefficient estimates on lagged FDI to the FDI definition regarding significant level
means that firms seem to adjust the relative level of FDI, compared to total capital, rather than the
absolute FDI. Our finding that past FDI feeds forward subsequent FDI is consistent with Luo et al.
(2008). As for the country-specific factors, Table 3 and Table 3 produce similar results.
Regarding the other results, after controlling for endogeneity and heterogeneity issues, the
firm-specific factors capital intensity and advertising seem to have no significant effect on FDI 1
or FDI 2. The GMM results based on the other firm-specific factors size, R&D, age, export
intensity, profitability, labour cost, personal share, innovation and leverage are generally
consistent with the results in Table 3. This means, among others, the relation between FDI, and
R&D and size is non-monotonous.
The results based on the factors personal share, innovation and leverage seem to be sensitive to
the FDI definition. For instance, higher product innovativeness is leading to lower FDI in China
when the FDI measure is FDI 2. Also, personal share and leverage are insignificantly linked to
FDI 2 whereas this relation is significant and negative in case of FDI 1.
25
For GMM results to be reliable and consistent, two diagnostics should be fulfilled. First, as expected, the test results
in Table 5 show the presence of first-order autocorrelation and absence of second-order autocorrelation. Second,
Sargan p-values confirm the validity of the instrument set. Table 5 reports ‗short-run‘ findings since the
corresponding models include lagged FDI as an explanatory factor. The short-run association of FDI with its
determinants can be different from their long-run relationship. The ‗long-run‘ estimations consider this possibility and
estimates dynamically equation (4). The long-run coefficients on the explanatory variables are obtained by the ratio of
[μk/ρ]. Moreover, the adjustment time in years can be measured by [1/(μk/ρ)]. See, for instance, Blundell and Bond
(1998), and Cheng and Kwan (2000) for further details. As lagged FDI‘s coefficients are not large in magnitude, the
short- and long-run results are qualitatively similar. Hence, we do not report the latter but they are available upon
request.
Table5
Dynamic analysis of FDI determinants using the system-GMM method (1998-2007).
FDI 1
General
FDI 1
Specific
FDI 2
General
FDI 2
Specific
Company-specific factors:
Lagged FDI 0.003 (0.032) 0.012 (0.025) 0.096 (0.042)** 0.098 (0.035)***
Capital intensity 0.226 (0.287) - -0.003 (0.015) -
Firm size 0.590 (0.340)* 0.601
(0.210)*** 0.145 (0.729)** 0.182 (0.092)**
Firm size 2
-0.016 (0.032) - -0.007 (0.003)** -0.009 (0.005)*
R&D 11.939
(4.389)***
13.085
(4.611)*** 0.527 (0.263)** 0.190 (0.094)**
R&D2 -28.148
(12.280)**
-28.984
(11.81)** -1.092 (0.543)** -0.330 (0.193)*
Firm age -0.537 (0.522) - -0.094 (0.047)** -0.098 (0.047)**
Export intensity 0.097 (0.411) - 0.136
(0.046)*** 0.162 (0.043)***
Profitability -3.743
(1.096)***
-3.628
(0.916)*** -0.030 (0.017)* -0.219 (0.095)**
Labour cost 0.317 (0.152)** 0.305 (0.179)* 0.003 (0.019) -
Personal share -5.364 (3.158)* -3.588 (2.131)* -0.409 (0.488) -
Page 29
DRAFT – Please do not cite or circulate without permission of the author
5. Conclusions
We use a sample of 680 firms with 2,932 observations in nine industries during the 1998-
2007 periods to examine the EU firms‘ FDI determinants in China. This study finds that EU FDI
Advertising -0.111 (0.090) - -0.008 (0.009) -
Technology -0.067
(0.027)**
-0.087
(0.030)*** -0.004 (0.002)** -0.004 (0.002)**
Innovation 0.040 (0.038) - -0.007 (0.003)** -0.006 (0.003)**
Leverage -0.872 (0.512)* -0.949 (0.558)* 0.144 (0.096) -
Country-specific factors:
Openness -2.440
(1.211)** -3.685 (1.713)** 0.201 (0.160) -
GDP 1.122
(0.398)*** 0.763 (0.389)** 0.095 (0.039)** 0.113 (0.031)***
Exchange rate -0.475
(0.101)***
-0.642
(0.131)***
-0.039
(0.010)*** -0.038 (0.010)***
Corruption -0.077 (0.184) - -0.034 (0.015)** -0.034 (0.015)**
Rule of law -6.867
(1.985)***
-9.083
(1.900)*** -0.409 (0.176)** -0.503 (0.131)***
WTO dummy 1.048
(0.304)***
1.484
(0.272)***
0.061
(0.022)*** 0.071 (0.020)***
Constant 0.448
(0.118)***
0.432
(0.114)***
0.089
(0.013)*** 0.083 (0.011)***
No of
firms/observations 490 / 2062 490 / 2062 490 / 2062 490 / 2062
Adjusted R2 0.2319 0.2375 0.2116 0.2124
Wald Test 124.7*** 255.1*** 149.7*** 165.9***
AR (1) (p) -6.72
(0.000)***
-7.092
(0.000)*** -6.10 (0.000)*** -6.43 (0.000)***
AR (2) (p) 0.552 (0.581) 1.093 (0.275) 1.125 (0.261) 1.461 (0.144)
Sargan test (p) 194.6 (0.202) 195.1 (0.217) 196.5 (0.261) 197.8 (0.274)
Dependent variable is FDI 1 or FDI 2. The standard errors robust to heteroscedasticity are reported
in the parentheses. Wald statistic tests the joint significance of estimated coefficients;
asymptotically distributed as χ2(df) under the null of no relationship. AR(1) and AR(2) are the first
and second order autocorrelation of residuals, respectively; which are asymptotically distributed as
N(0,1) under the null of no serial correlation. Sargan Test is the test of over identifying
restrictions, asymptotically distributed as χ2(df) under the null of instruments' validity. We tested
for the endogeneity of firm-specific factors using the ‗Difference-in- Sargan-Hansen" statistic, for
which the null hypothesis states that the variable is exogenous. The results show that, except Firm
age, Advertising and Personal share, all other firm-specific factors should be treated as
endogenous. We lose one year because of taking differences and two years as the instruments are
at date t-2. Hence, for a company to be included in the GMM regressions they should have at least
3 consecutive years‘ data. This leaves us a sample with 490 firms and 2,062 observations. (*), (**)
and (***) indicates that the coefficients are significant or the relevant null is rejected at the 10, 5
and 1 percent level, respectively.
Page 30
DRAFT – Please do not cite or circulate without permission of the author
in China is positively associated with export intensity and labour cost. On the other hand, we find
that there are various firm-specific factors that reduce FDI in China. For instance, firm
profitability, firm age, technology and product innovativeness affect inversely FDI levels. In
addition, the ownership structure of investment (i.e., personal capital) reveals that higher capital
share at non-personal level is associated with more FDI. The factors capital intensity and
advertising activities, however, do not seem to be influencing significantly FDI decisions of EU
firms. This study finds that FDI is linked significantly to R&D activities and firm size but in a
non-linear way (reverse-U shape). That is, FDI and R&D, and FDI and size are positively
correlated in case of ‗when R&D activities are not very intense, and when firms are smaller‘,
respectively. However, further increases in R&D or in firm size make these relations negative.
The country-specific factors shows that lower corruption levels (more relevant for the
post-WTO period), increase in market size, and lower quality in ‗rule of law‘ promote more FDI
into China. As for the exchange rate movements, the depreciation of renminbi is leading to lower
FDI.
Pooled OLS, fixed effects, random effects and GMM estimation methods have been used
to check the robustness of the findings. The results suggest that the issues related to endogeneity,
partial adjustment and heterogeneity can affect the regression results and hence should be
controlled for. In particular, using the partial adjustment mechanism, the GMM results suggest
that EU firms tend to adjust the relative level of their FDI into China.
In summary, our study reveals that EU investment in China is not only determined by
standard firm-specific variables but also influenced by location-specific factors. The results could
serve as a prescription for policy makers at the firm level in the formulation of employment and
investment strategies, such as the creation of clusters and industrial parks, and could also provide
guidance for investors wanting to invest in the China.
References
Agodo, O. (1978). The determinants of US private manufacturing investment in Africa. Journal of
International Business Studies, 9(3), 95-107.
Barbosa, N., & Louri, H. (2002). On the determinants of multinationals‘ ownership preferences:
evidence from Greece and Portugal. International Journal of Industrial Organization, 20(4),
493–515.
Arellano, M. and Bond, S. (1991), Some Test of Specification for Panel Data: Monte Carlo
Evidence and An Application to Employment Equations, Review of Economic Studies 58, (2),
277-297.
Arellano, M. and Bover, O. (1995), Another Look at Instrumental Variable Estimation of Error-
Components Models, Journal of Econometrics, 68, (1), 29-51.
Bevan, A., Estrin, S., & Meyer, K. (2004). Foreign investment location and institutional
development in transition economies. International Business Review, 13(1), 43-64.
Blinder, A.S. (1986). More on the speed of adjustment in inventory models. Journal of Money,
Credit and Banking, 18(3), 355-365.
Blomstrom, M., & Lipsey, R.E. (1989). The export performance of Swedish and U.S.
multinationals. Review of Income and Wealth, 35(3), 245-264.
Page 31
DRAFT – Please do not cite or circulate without permission of the author
Blomstrom, M., & Lipsey, R.E. (1991). Firm size and foreign operations of multinationals.
Scandinavian Journal of Economics, 93(1), 101-107.
Blundell, R.W., & Bond, S.R. (1998). Initial conditions and moment restrictions in dynamic panel
data models. Journal of Econometrics, 87(1), 115–143.
Buch, C.M., Kleinert, J., Lipponer, A., &Toubal, F. (2005). Determinants and effects of foreign
direct investment: evidence from German firm-level data. Economic Policy, January, 51-110.
Buckley, P.J., & Casson, M. (1976). The future of the multinational enterprise. London:
Macmillan Press.
Bulcke, D.V.D., Zhang, H., & Esteves, M. (2003). European Union Direct Investment in China:
Characteristics, Challenges and Perspectives. London: Routledge.
Borensztein E., J Gregorio. And J. Lee, (1995), ―How does foreign direct investment affect
economic growth?‖ National Bureau of Economic Research. Working Paper series#5057,
Cambridge
Buckley, P. J. And Strange, R. 2010. The Governance of the Multinational Enterprise: Insights
from Internalization Theory. Journal of Management Studies, 10. 1467-6486
Bartlett, C.A. and Ghoshal, S. (1989) Managing Across Borders: The Transnational Solution,
Harvard Business School Press: Boston
Buckley, P.J., & Casson, M. (1976). The future of the multinational enterprise. London:
Macmillan Press.
Buckley, P.J. 1989. Foreign Direct Investment by Small and Medium-Sized Enterprise,
Home&Meier: London
Bulcke, D.V.D., Zhang, H., & Esteves, M. (2003). European Union Direct Investment in China:
Characteristics, Challenges and Perspectives. London: Routledge.
Blundell, R and Bond, S. (1998), Initial Conditions and Moment Restrictions in Dynamic Panel
Data Models, Journal of Econometrics Review, 87, (1), 115-143.
Blundell, R and Bond, S. (2000), GMM Estimation with Persistent Panel Data: An Application to
Production Functions, Econometrics Review, 19 (3), 321-340.
Buckley, P. J., and Hashai N. 2008. Formalizing Internationalisation in the Eclectic Paradigm,
Journal of International Business Studies, 40(1), 1-13.
Cantwell, J., & Sanna-Randaccio, S. (1993). Multinationality and firm growth.
Weltwirtschaftliches Archiv, 129(2), 275–299.
Cantwell, J.A., Janne, O.E.M., (1999). Technological globalisation and innovative centres: the
role of corporate technological leadership and locational hierarchy. Research Policy, 28(1–2),
119–144.
Page 32
DRAFT – Please do not cite or circulate without permission of the author
Caves, R.E. (1974). Multinational firms, competition, and productivity in host-country markets.
Economica, 41(162), 176-193.
Caves, R.E., Mehra, S.K. (1986). Entry of foreign multinationals into US manufacturing
industries, in Competition in Global Industries, Porter, M.E. (Eds), Boston, MA: Harvard
Business School Press.
Cheng, L.K., & Kwan, Y.K. (2000). What are the determinants of the location of foreign direct
investment? The Chinese experience. Journal of International Economics, 51(2), 379-400.
Culem, C.G. (1988). The locational determinants of direct investment among industrialized
countries. European Economic Review, 32(4), 885-904.
Cushman, David (1984), ―Real exchange rate risk, expectations, and the level of direct
investment,‖ The Review of Economics and Statistics, 297-308.
Coase, R.H. (1937) The nature of the firm, Economics, 4(16), pp. 386-405.
Chen, X., Yung, R.L. and Zhang, B. (2002) China Manufacturing, BNP Paribas Peregrine
Economics/Sector Update April 2002.
Cantwell, J. A. (1989). Technological innovation and multinational corporations. Oxford: Basil
Blackwell.
Cantwell, J. A. (1994). Transnational corporations and innovatory activities, United Nations
library on
transnational corporations, Vol. 17. London: Routledge.
Caves, R.E. (1971) 'Industrial corporations: the industrial economics of foreign investment',
Economica 38: 1-27.
Caves, Richard E. (1974), ―International Corporations: The Industrial Economics of Foreign In
Caves, Richard E. ―Causes of Direct Investment: Foreign Firms‘ Shares in Canadian and United
Kingdom Manufacturing Industries,‖ The Review of Economics and Statistics 56, 279-293.
Cleeve, E., 2007. Japanese Foreign Direct Investment in the UK Electronic Industry: The Eclectic
Approach. Asia Pacific Business Review, Vol. 13, No. 2, 183–200
Conner, K.R. (1991) 'A historical comparison of resource-based theory and five schools of
thought within industrial organiza-tion economics: do we have a new theory of the firm? Journal
of Management 17(1): 121-154.
De Santis, R.A., Anderton, R., & Hijzen, A. (2004). On the determinants of Euro area FDI to the
United States: the knowledge- capital-Tobin‘s Q framework. Working Paper #320, European
Central Bank.
Dees, S. (1998). Foreign direct investment in China: determinants and effects. Economics of
Planning, 31(2-3), 175-194.
Dimelis, S., & Louri, H. (2002). Foreign ownership and productivity efficiency: A quantile
regression analysis. Oxford Economic Papers, 54(3), 449–469.
Drake, T.A., & Caves, R.E. (1992). Changing determinants of Japanese foreign investment in the
United States. Journal of the Japanese and International Economies, 6(3), 228-246.
Page 33
DRAFT – Please do not cite or circulate without permission of the author
Dunning, J.H. (1980). Towards an eclectic theory of international production. Some empirical
tests. Journal of International Business Studies, 11(1), 9-31.
Dunning, J.H. (1988). The eclectic paradigm of international production- a restatement and some
possible extensions. Journal of International Business Studies, 19(1), 1-31.
Dunning, J.H. (1993). Multinational enterprises and the global economy. Wokingham: Addison-
Wesley.
Dunning, J.H. (1998). Location and the multinational enterprise: a neglected factor? Journal of
International Business Studies, 29(1), 45–60.
Dunning, J.H. (2000). The eclectic paradigm as an envelope for economic and business theories of
MNE activity. International Business Review, 9(2), 163–190.
Dunning, J.H. (2006). Towards a new paradigm of development: implications for the determinants
of international business. Transnational Corporations, 15, 173-227.
Dunning, J.H., & Narula, R. (1995). The R&D activities of foreign firms in the United States.
International Studies of Management and Organization, 25(1-2), 39-73.
De Mello, Luiz, Jr (1997), ―Foreign Direct Investment in Developing Countries and Growth: A
Selective Survey,‖ Journal of Development Studies, 34(1), 1-34.
Dunning, J.H. and Narula, R. (1996) 'The Investment Develop-ment Path Revisited: Some
Emerging Issues', in J.H. Dunning and R. Narula (eds.) Foreign Direct Investments and Govern-
ments: Catalysts for Economic Restructuring, Routledge: London
Dunning J H.Laudan S M. The MNE as a creator, fashioner and respondent to institutional
change. In: Collinson S, Morgan G, editors. The Multinational Firm. Oxford: Blackwell
Publishers; 2009. p. 93-115.
Dimelis, S., & Louri, H. (2002). Foreign ownership and production efficiency: A quantile
regression analysis. Oxford Economic Papers, 54(3), 449–469
Yiu, D. and S. Makino (2002). "The Choice between Joint Venture and Wholly Owned Subsidiary:
An Institutional Perspective." Organization Science 13(6): 667-683
Dunning, J.H. (1977) Trade, location of economic activities, and the MNE: a search for an
eclectic approach, In Ohlin, B., Hesselborn, P.O., and Wiskman, P.M. (eds.), The International
Allocation of Economic Activity, Macmillan, London, pp. 395-418.
Dunning, J.H. (1980) Towards an electric theory of international production: some empirical tests,
Journal of International Business Studies, 11(1), pp. 9-32.
Dunning, J.H. (1981). International Production and the Multinational Enterprise, London: Allen
and Unwin
Dunning, J.H. (1986) 'The investment cycle revisited', Welt-wirtschaftliches Archiv1 22: 667-677.
Dunning, J. (1981a), Explaining the International Direct Investment Position of
Countries: Towards a Dynamic Development Approach, Weltwritschaftliches Archiv, 119, 30-64
Page 34
DRAFT – Please do not cite or circulate without permission of the author
Dunning, J.H. (1988a) The eclectic paradigm of international production: a restatement and some
possible extensions, Journal of International Business Studies, 19(1), pp. 1-31.
Dunning, J.H. (1993a) Multinational Enterprises and the Global Economy, Addison-Wesley, New
York.
Dunning, J.H. (1993b) The globalisation of business. London and New York: Rutledge
Dunning, J.H. (2001) The eclectic (OLI) paradigm of international production: past, present and
future, International Journal of the Economics of Business, 8(2), pp. 173-190.
Dunning, J. (2003). Some antecedents of internalization theory, Journal of International Business
Studies, 34, 1, 108-115.
Dunning, J. H. (2006), ‗Towards a new paradigm of development: implications for the
determinants of international business activity,‘ Transnational Corporations, 15(1), 173–228.
Dunning, J. H. and S. M. Lundan (2009), ‗The MNE as a creator, fashioner and respondent to
institutional change,‘ in S. Collinson and G. Morgan (eds), The Multinational Firm. Blackwell
Publishers: Oxford, pp. 93–115.
Dunning, J. H. and S. M. Lundan (2010), ‗The institutional origins of dynamic capabilities in
multinational enterprises,‘ Industrial and Corporate Change, 19(4), 1225–1246.
Dunning, J. and Fortanier, F. (2007), Multinational Enterprise and the New Development
Paradigm: Consequences for Host Country Development, Multinational Business Review, 15,1:
25-45.
Dunning, J. H. (2000). The eclectic paradigm as an envelope for economic and business theories
of MNE activity. International Business Review, 9(2), 163–190.
Dunning, J. H., & Lundan, S. M. 2008a. Multinational enterprises and the global economy. 2nd
edn. Cheltenham: Edward Elgar
Dunning, J. H. 2009. Location and the multinational enterprise: A neglected factor? Journal of
International Business Studies (2009) 40, 5–19
Dunning, J. and Lundan, M. (2008b), Institutions and the OLI paradigm of the multinational
enterprise, Asia Pacific Journal of Management , 25, 573-593.
Dunning,J H., 2001 The eclectic (OLI) paradigm of international production: past, present and
future, Journal of International Business Studies 8 (2001), pp. 173–190.
Daphne Yiu and Shige Makino. 2002. The Choice between Joint Venture and Wholly Owned
Subsidiary: An Institutional Perspective. Organization Science, Vol. 13, No. 6 (Nov. - Dec., 2002),
pp. 667-683
Duanmu, J.l. and Gunry, J.2009. A Panel Data Analysis of Locational Determinants of Chinese
and Indian Outward Foreign Direct Investment. Journal of Asia Business Studies, 3 (2), 1-15
Page 35
DRAFT – Please do not cite or circulate without permission of the author
Engle, R.F., & Granger, C.W.J. (1987). Co-integration and error correction: representation,
estimation, and testing. Econometrica, 55(2), 251-276.
Erdener, C. and Shapiro, D.M. (2005). The internationalization of Chinese family enterprises and
Dunning's eclectic MNE paradigm, Management and Organization Review, 1(3), pp. 411-436
European Commission ‗Study on the Future Opportunities and Challenges in EU-China Trade and
Investment Relations 2006-2010‘ pub. March 2007
http://ec.europa.eu/trade/issues/bilateral/countries/china/legis/index_en.htm
Forssbaeck, J., &Oxelheim, L. (2008). Finance-specific factors as drivers of cross-border
investment- an empirical investigation. International Business Review, 17(6), 630-641.
Froot, K.A., & Stein, J. (1991). Exchange rates and foreign direct investment: an imperfect capital
market approach. Quarterly Journal of Economics, 106(4), 1191-1217.
Fan, J,P.H.; Morck, R., Xu, L.C., Yeung, B. 2009, Institutional and Foreign Direct investment :
China versus the Rest of the World. World Development , 37 (4), pp. 852-865
Fitzmaurice, G. M., Laird, N. M., & Ware, J. H. 2004. Applied longitudinal analysis. New York:
John Wiley & Sons
Faure, G.O. and Fang, T. 2008. Changing Chinese values: Keeping up with paradoxes.
International Business Review. 17 (2), pp. 194-207
Graham, E. M., & Wada, E. (2001), ―Foreign direct investment in China: Effects on growth and
economic performance in achieving high growth: Experience of transitional Greece and Portugal,‖
International Journal of Industrial Organisation, 20(4), 493–515.
Giddy, I.H. (1978). The demise of the product cycle model in international business theory.
Columbia Journal of World Business, 13(Spring), 90-97.
Gray, H.P. (1998). Free international economic policy in a world of Schumpeter goods.
International Trade Journal, 12, 323–344.
Grubaugh, S.G. (1987). Determinants of direct foreign investment, Review of Economics and
Statistics, 69(1), 149-52.
Gupta, V.K. (1983). A simultaneous determination of structure, conduct and performance in
Canadian manufacturing. Oxford Economic Papers, 35, 281-301.
Head, K., & Ries, J. (1996). Inter-city competition for foreign investment: static and dynamic
effects of China‘s incentive areas. Journal of Urban Economics, 40(1), 38-60.
Hill, C.W.L., Hwang, P., & Kim, W.C. (2006). An eclectic theory of the choice of international
entry mode. Strategic Management Journal, 11(2), 117–128.
Hsiao, F.S.T., & Hsiao, M.C.W. (2004). The chaotic attractor of foreign direct investment-why
China? A panel data analysis. Journal of Asian Economics, 15(4), 641-670.
Hymer, S.H., & Rowthorn, R. (1970). Multinational corporations and international oligopoly: the
non- American challenge. In the International Corporation. C.P. Kindleberger (Ed.),
Cambridge, MA: Massachusetts Institute of Technology Press.
Page 36
DRAFT – Please do not cite or circulate without permission of the author
Henisz, W.J. (2003) The power of the Buckley and Casson thesis: the ability to manage
institutional idiosyncrasies, Journal of International Business Studies, 34(2), pp. 173-184
Hymer, S.H. 1960 The International Operations of National Firms: A Study of Direct Investment.
PhD Thesis, MIT: MIT Press
Hennart, Jean-François. 1991. ―The Transaction Costs Theory of Joint Ventures: An Empirical
Study of Japanese Subsidiaries in the United States.‖ Management Science 37(4): 483–97.
Johanson, J. and J. E. Vahlne (1977), ‗The internalization process of the firm-a model of
knowledge development and increasing foreign market commitments,‘ Journal of International
Business Studies, 8(1), 23–32.
Johanson, J. and J. E. Vahlne. (2009), ‗The uppsala internationalization model revisited: from
liability of foreignness to liability of outsidership,‘ Journal of International Business Studies, 40,
1411–1433.
Jeon, B.N., & Rhee, S.S. (2008). The determinants of Korea‘s foreign direct investment from the
United States, 1980-2001: an empirical investigation of firm-level data. Contemporary
Economic Policy, 26(1), 118-131.
Johansen, S. (1988). Statistical analysis of cointegration vectors. Journal of Economic Dynamics
and Control, 12(2-3), 231-254.
Kimura, Y. (1989). Firm-specific strategic advantages and foreign direct investment behaviour of
firm: The case of Japanese semiconductor firm. Journal of International Business Studies,
20(2), 296-314.
Kogut, B., & Zander, U. (1994). Knowledge of the firm and the evolutionary theory of the
multinational
corporation. Journal of International Business Studies, 24 (4), 625–646.
Kindelberge,C.1969. American Business Abroad, New Haven, CT: Yale University Press
Lall, S. (1980). Monopolistic advantages and foreign involvement by U.S. manufacturing industry.
Oxford Economic Papers, 32(1), 102-122.
Lecraw, D.J. (1977). Direct investment by firms from less developed countries. Oxford Economic
Papers, 29(3), 442-457.
Lien, Y.C, Piesse, J., Strange, R., & Filatotchev, I. (2005). The role of corporate governance in
FDI decisions: evidence from Taiwan. International Business Review, 14(6), 739-763.
Lin H., & Yeh, R.S. (2005). The interdependence between FDI and R&D: an application of an
endogenous switching model to Taiwan's electronics industry. Applied Economics, 37(15),
1789–1799.
Lin, F.J. (2010). The determinants of foreign direct investment in China: the case of Taiwanese
firms in the IT industry. Journal of Business Research, 63(5), 479-485.
Luo, L., Luo, Y., & Liu, C. (2008). Multilevel determinants of subsequent FDI in China.
Thunderbird International Business Review, 50(2), 105-120.
Page 37
DRAFT – Please do not cite or circulate without permission of the author
Luo, X., Chung, C.N., & Sobczak, M. (2009). How do corporate governance model differences
affect foreign direct investment in emerging economies? Journal of International Business
Studies, 40(3), 444-467.
Markusen, J.R., (1995). The boundaries of multinational firms and the theory of international
trade. Journal of Economic Perspectives, 9(2), 169–189.
Mudambi, R., & Navarra, P. (2002). Institutions and international business: a theoretical overview.
International Business Review, 11(6), 635-646.
Madhok, A. (1998), The nature of multinational firm boundaries: transaction costs, firm
capabilities and foreign market entry mode, International Business Review, 7(3), pp. 259-290.
Narula, R. (1996) Multinational Investment and Economic Structure, Routledge: London.
Nelson, R. and Winter, S. (1982) An Evolutionary Theory of Economic Change, Harvard:
Cambridge, MA.
Narula, R., 2006. Globalization, New Ecologies, New Zoologies, and the Purported
Death of the Eclectic Paradigm, Asia Pacific Journal of Management, 23 143-151.
North, D. C. (1990). Institutions, institutional change and economic performance. Cambridge:
Cambridge University Press.
North, D. C. (2005). Understanding the process of economic change. Princeton: Princeton
University Press.
Ozawa, T. (1992) 'Foreign direct investment and economic development', TransnationalC
orporations1 : 27-54. Prahalad,C .K.a nd Doz, Y. (1987) TheM ultinational Mission,F ree Press:
New York
Oxelheim, L. & Ghauri, P. (2008). EU-China and the non-transparent race for inward FDI.
Journal of Asian Economics, 19(4), 358-370.
Patel, P., & Vega, M. (1999). Patterns of internationalisation of corporate technology: location vs.
home country advantages, Research Policy, 28(2-3), 145–55.
Pradhan, J.P. (2004). The determinants of outward foreign direct investment: a firm-level analysis
of Indian manufacturing. Oxford Development Studies, 32(4), 619-639.
Pak, Y.S. and Park, Y-R. (2005) Characteristics of Japanese FDI in the east and west:
understanding the strategic motives of Japanese investment, Journal of World Business, 40(3), pp.
254-266
Prahalad,C .K.a nd Doz, Y. (1987) TheM ultinational Mission,F ree Press: New York
Pitelis, C.N. and Teece, D.J.2010. Cross-border market co-creation, dynamic capabilities and the
entrepreneurial theory of the multinational enterprise. Industrial and Corporate Change, 19(4),
1247-1270
Pan, Y., Li, S., & Tse, D. K. 1999. The impact of order and mode of market entry on profitability
and market share. Journal of International Business Studies, 30(1): 81–104
Page 38
DRAFT – Please do not cite or circulate without permission of the author
Qiu, Yuanlun. 1999. The EU‘s China Policy and Sino-EU Trade and Economic Relations, World
Economy, No 8, 1999
Roberts, M.J., & Tybout, J R. (1997). The decision to export in Colombia: an empirical model of
entry with sunk costs. American Economic Review, 87(4), 545–564.
Rugman, A.M., & Verbeke, A. (2001). Subsidiary-specific advantages in multinational enterprises.
Strategic Management Journal, 22(3), 237-250.
Rugman, A.M. and Verbeke, A. (2008) A new perspective on the regional and global
strategies of multinational service firms. Management International Review, 48, 4, 397-411.
Rugman, A.M. (1986) New theories of the multinational enterprise: an assessment of
internalization theory, Bulletin of Economic Research, 38(2), pp. 101-118.
Rowen, H.S. (2003) ‗Will China take over world manufacturing?‘, The International Economy
17(1): 72.
Redding, G., & Witt, M. A. 2007. The future of Chinese capitalism: Choices and chances. Oxford:
Oxford University Press
Redding, G. (1990). The spirit of Chinese capitalism. Berlin: Walter de Gruyter.
Schneider, F. & Frey, B.S. (1985). Economic and political determinants of foreign direct
investment. World Development, 13(2), 161–175.
Siddharthan, N.S., & Nollen, S. (2004). MNE affiliation, firm size and exports revisited: a study
of information technology firms in India. Journal of Development Studies, 40(6), 148-170.
Stoian, C., & Filippaios, F. (2008). Dunning‘s eclectic paradigm: a holistic, yet context specific
framework for analysing the determinants of outward FDI: evidence from international Greek
investments. International Business Review, 17(3), 349-367.
Sethi, D. and Guisinger, S. (2002) 'Liability of foreignness to competitive advantage: how
multinational enterprises cope with the international business environment', Journal of
InternationalM anagement 8(3): 223-240.
Sethi, D., Guisinger, SE.,Phelan, SE. and. Berg, DM.2003. Tread in foreign direct investment
flows: a theoretical and empirical analysis. Journal of International Business Studies, 34, 315–326
Stefanović, S. 2008. Analytical Framework of FDI Determinants: Implementation of the Model.
Facta University Series: Economics and Organization Vol. 5, No 3, pp. 239 - 249
Stoian, C. & Fragkiskos F. 2008. Dunning Eclectic Paradigm: A Holistic, Yet Context Specific
Framework for Analyzing The Determinants Of Outward FDI Evidence From International Greek
Investments, International Business Review 17, 349 – 367.
Spar, D. L. (2001). National policies and domestic politics. In T. Brewer, & A. Rugman (Eds.),
Oxford handbook of international business. Oxford: Oxford University Press
Shan, Wenhua. 2005. The legal Framework of EU-China Investment Relations: A Critical
Appraisal. HART Publishing: Oxford
Page 39
DRAFT – Please do not cite or circulate without permission of the author
Tan, B., & Vertinsky, H. (1996). Foreign direct investment by Japanese electronics firms in the
United States and Canada: modeling the timing of entry. Journal of International Business
Studies, 27(4), 655–681.
Trevino, L.J., & Daniels, J.D. (1994). An empirical assessment of the preconditions of Japanese
manufacturing foreign direct investment in the United States. Weltwirtschaftliches Archiv,
13(3), 576-599.
Trevino, L.J., & Grosse, R. (2002). An analysis of firm-specific resources and foreign direct
investment in the United States. International Business Review, 11(4), 431-452.
Vernon, R. (1966). International investment and internationals trade in the product cycle.
Quarterly Journal of Economics, 80(2), 190-207.
Vernon, R. (1971). Sovereignty at Bay: The Multinational Spread of U.S. Enterprises. New York.
Wei, X., & O‘Callaghan, B.A. (2008). Modelling EU FDI deflection between the new EU
member states and Chinese provinces. Intereconomics, (May/June), 163-175. Whalley, J., & Xin,
X. (2006), ―China’s FDI and non-FDI economies and the sustainability of future high Chinese
growth,‖ NBER working paper series, #12249, National Bureau of Economic Research.
Wei, Y., & Liu, X. (2001), Foreign direct investment in China: Determinants and impact.
Cheltenham. UK/Northampton, MA, USA: Edward Elgar Publishing Limited
Wu, Y. R. (1999). Foreign direct investment and economic growth in China. Cheltenham,
UK/Northampton, MA, USA: Edward Elgar Publishing Limited.
Wei, S. (1995), ―Foreign direct investment in China: Sources and Consequences,” In, Financial
deregulation and integration in East Asia, Ito, T., & Krueger, A. O. (Eds.). NBER-East Asia
seminar on economics (5). USA: University of Chicago Press.
Williamson, O.E. (1975) Market and Hierarchies: Analysis and Antitrust Implications, Free Press,
New York.
Williamson, O.E. (1985) The Economic Institutions of Capitalism: Firms, Markets, Relational
Contracting, Free Press, New York.
Wernerfelt, B. (1984) 'Resource-based view of firm', Strategic Management Journal 5: 171-180.
Wei, Y. and Liu, X. 2006. Productivity spillovers from R and D, exports and FDI in China's
manufacturing sector. Journal of International Business Studies, 37(4), pp. 544-557
Wang, Yongjun. 1997. Investment in China: A Question and Answer Guide on How to do
Business. CITIC Publication House
Witt.M.A. 2008. Crossvergence 10 years on: Impact and future potential. Journal of international
Business Studies 39 (1), pp. 47-52
Zwinkels, R.C.J., & Beugelsdijk, S. (2010). Gravity equations: workhorse or Trojan horse in
explaining trade and FDI patterns across time and space? International Business Review, 19(1),
102-115.
Page 40
DRAFT – Please do not cite or circulate without permission of the author
1998 1999 2000 2001 2002 2003 2004 2005 2006 2007 2008
0
2
4
6
8
10
12
14
16
18
20
EU FDI as % of total China FDI
1998 2000 2002 2004 2006 2008
3
4
5
6
7
8
9
10
11
12
13
14
15
Japan realized FDI
EU realised FDI
US realised FDI
APPENDIX
Figure A1: EU Realized FDI & Number of Projects in China 1986-2008 (Source: MOFTEC)
Figure A2: Percentage of EU FDI in Total FDI in China 1998-2008 (Source: MOFTEC)
Figure A3: EU, Japan and U.S. Realized FDI in China 1998-2008 (Source: MOFTEC)
0
100000
200000
300000
400000
500000
600000
19
86
19
87
19
88
19
89
19
90
19
91
19
92
19
93
19
94
19
95
19
96
19
97
19
98
19
99
20
00
20
01
20
02
20
03
20
04
20
05
20
06
20
07
20
08
$1
0,0
00
Page 41
DRAFT – Please do not cite or circulate without permission of the author
Appendix A: ‘study on the opportunities and challenges in EU-China Trade and Investment
Relations 2006-2010’ pub. March 2007
EU Trade Commissioner, Peter Mandelson said the strategic review would focus on "key
challenges such as intellectual property, market access issues and investment opportunities‖,
―European companies face substantial market access barriers to trade and investment in China.
These barriers cost EU firms more than € 21.4billion a year in massed business opportunities
(European Commission, 2007:4). (See figure 1) Figure. Market Access obstacles for European
Companies Source: European Commission, 2007:4 European
Commission ‗study on the Future opportunities and challenges in EU-China Trade and Investment
Relations 2006-2010‘ pub. March 2007.
http://trade.ec.europa.eu/doclib/docs/2007/february/tradoc_133299.pdf