Page 1
UNIVERSITY OF KWAZULU-NATAL
IMPLEMENTATION OF HUMAN RESOURCE INFORMATION SYSTEMS- A
CASE STUDY OF CENTRAL BANK OF LESOTHO
By
Lerato M. Makaaka
202514609
Dissertation Submitted in partial fulfillment of the requirements for the degree
of
Masters of Commerce
College of Law and Management Studies
School of Management, Information Technology and Governance
Supervisor: DR. L N GOVENDER
2017
Page 2
i
DECLARATION
I, Lerato Margret Makaaka declare that
i) The research reported in this dissertation, except where otherwise indicated, is my original
research.
ii) This dissertation has not been submitted for any degree or examination at the any other
university.
iii) This dissertation does not contain other person data, picture graphs or other information,
unless specifically acknowledged as being sourced from other persons.
iv) This dissertation does not contain other persons writing unless specifically acknowledged
as being sourced from other researchers.
a) Their words have been re-written but the general information attributed to them has
been referenced;
b) Where their extra words have been used, their writing has been placed inside quotation
marks, and referenced.
v) This dissertation does not contain text, graphics or tables copied and pasted from the
internet unless specifically acknowledged, and the source being detailed in the dissertation
and referenced.
Signed…………………………………….
Page 3
ii
ACKNOWLEDGEMENTS
I thank the Lord for walking beside me throughout my studies. The Lord is my strength and courage
and I could not complete this research project without him by my side.
I acknowledge Mr. Tsikoane and the Abundant Life Church members for their prayers and their spiritual
support throughout this research journey. I can do all things through Christ who gives me strength.
I express my sincere gratitude to my supervisor Dr. L.N. Govender for his guidance and support until
the end. It was not easy but you were always motivating me to do more to complete the study. I am
highly appreciative and thankful.
My parents, you were the pillars of my strength and I am thankful for your support during this
challenging phase. My sisters Lineo and Mpho, thank you for taking care of my son while I was away.
My brother, Semethe I am very grateful because you were always available and ever willing to support
my family even when you had your own challenges. May our almighty God bless you all and grant you
all your wishes.
I wish to record my appreciation to the Management of the Central Bank of Lesotho for giving me this
opportunity to further my studies. I take this opportunity to thank employees of the Bank who
participated on the study. Your input has contributed immensely to the study’s aims and objectives. Dr.
Motšoene and Mr. Hlompho Khatha, it was fantastic to work with you throughout my research. I am
greatly indebted to Dr. Gill Hendry for the statistical support as well as assistance with the structure of
the questionnaire and analysis of the data.
Thank you all for your unfailing support and assistance.
Page 4
iii
DEDICATION
I dedicate this dissertation to the following persons
Firstly, to my son Bokang Makaaka. You are a gift from God that deserves the best. I therefore will
strive to give you the best always.
Secondly, I dedicate this dissertation to my lovely parents.
You have made this accomplishment very special!
Page 5
iv
ABSTRACT
Human Resources Information System (HRIS) is a system that organisations use to reduce
administrative costs, enhance service delivery, and increase productivity. The study focuses on the
implementation of HRIS at the Central Bank of Lesotho (CBL). The Unified Theory of Acceptance and
Use of Technology (UTAUT) model was adopted to determine factors that influence individual
behaviour intentions to use HRIS at the CBL.
The study has used the case study approach to gather in depth knowledge about the factors that influence
individual behaviour on the use of HRIS following the implementation of the system at CBL. The study
adopted a quantitative approach to investigate the potential benefits of the UTAUT model at CBL to
provide a useful data to measure user behaviour from a statistical point of view. The data was analysed
to identify the factors that influence individual behavioural patterns on the usage of HRIS at the CBL.
The study applied the probability sampling with the assumption that the population have equal chance
of being selected to participate in the study. The motive for using probability sampling was to be able
to generalise the results obtained to a larger group.
The population for CBL comprises of three hundred (300) employees. One hundred and sixty-nine
(169) employees were selected randomly from all occupational levels at the Bank ranging from top
managers to lower level of employees. The response rate was 76%. Statistical Package for Social
Sciences (SPSS) software was used to interpret statistical data to give meaning to the data collected and
to enable recommendations emanating from the study. The findings concluded that individual behaviour
intention to use HRIS is highly influenced by all the constructs and the constructs were found to be best
predictors of behaviour intention to use HRIS. The findings reflected that gender, age and experience
had no significant effect on the relationship between the constructs as indicated by the original model.
Management feels that it is important to understand employees’ behavioural changes to foster user
acceptance of the system.
Keywords:
Behaviour Intention, Human Resources Information System, Influence, Usage,
Page 6
v
TABLE OF CONTENTS
DECLARATION ..................................................................................................................................... i
ACKNOWLEDGEMENTS .................................................................................................................... ii
DEDICATION ....................................................................................................................................... iii
ABSTRACT ........................................................................................................................................... iv
TABLE OF CONTENTS ........................................................................................................................ v
LIST OF FIGURES ............................................................................................................................. viii
LIST OF TABLES ................................................................................................................................. ix
1. CHAPTER ONE: INTRODUCTION ............................................................................................. 1
1.1 Introduction ............................................................................................................................. 1
1.2 Context of the Study ............................................................................................................... 2
1.3 Research Problem ................................................................................................................... 4
1.4 Purpose of the Study ............................................................................................................... 5
1.5 Significance of the Study ........................................................................................................ 6
1.6 Research Methodology ........................................................................................................... 6
1.7 Research Objectives ................................................................................................................ 6
1.8 Research Questions ................................................................................................................. 7
1.9 Hypotheses .............................................................................................................................. 7
1.10 Definition of Terms ................................................................................................................. 7
1.11 Structure of the Dissertation ................................................................................................... 8
1.12 Conclusion .............................................................................................................................. 9
2. CHAPTER TWO: LITERATURE REVIEW ............................................................................... 10
2.1 Introduction ................................................................................................................................. 10
2.2 Role of HRIS............................................................................................................................... 11
2.3 Implementation of HRIS in Organisations .................................................................................. 12
2.4 HRIS at Human Resources Departments .................................................................................... 13
2.5 Design of HRIS ........................................................................................................................... 14
2.6 HRIS CONFIGURATION .......................................................................................................... 15
2.7 Types of HRIS ............................................................................................................................ 16
2.7.1 Electronic Data Processing (EDP) ....................................................................................... 16
2.7.2 Management Information System (MIS) ............................................................................. 16
2.7.3 Decision Support System (DSS) .......................................................................................... 16
2.7.4 Employee Self-Service (ESS) .............................................................................................. 16
2.8 Successes and Failures of HRIS.................................................................................................. 17
Page 7
vi
2.8.1 Failures of HRIS .................................................................................................................. 18
2.8.2 Key Success Factors of Implementing HRIS ....................................................................... 21
2.9 Theoretical Framework ............................................................................................................... 24
2.9.1 Application of UTAUT ........................................................................................................ 28
2.10 Summary of the Chapter ........................................................................................................... 31
3. CHAPTER THREE- RESEARCH METHODOLOGY ............................................................... 33
3.1 Introduction ................................................................................................................................. 33
3.2 Theoretical Paradigm .................................................................................................................. 33
3.3 Research Approach ..................................................................................................................... 34
3.4 Research Design .......................................................................................................................... 35
3.5 Sampling Procedure .................................................................................................................... 36
3.6 Data Collection Tools and Techniques ....................................................................................... 37
3.6.1 Questionnaire ....................................................................................................................... 37
3.7 Validity and Reliability ............................................................................................................... 38
3.8 Data Analysis Procedure ............................................................................................................. 38
3.8.1 Software Package ................................................................................................................. 38
3.8.2 Descriptive Statistics ............................................................................................................ 39
3.8.3 Inferential Statistics.............................................................................................................. 39
3.8.4 Chi-Square-Goodness-of-Fit-Test ........................................................................................ 40
3.8.5 Regression Analysis ............................................................................................................. 40
3.8.6 ANOVA ............................................................................................................................... 41
3.8.7 Construct Analysis ............................................................................................................... 41
3.9 Ethical Consideration .................................................................................................................. 41
3.10 Limitations ................................................................................................................................ 42
3.11 Summary of the Chapter ........................................................................................................... 42
4. CHAPTER FOUR-PRESENTATION OF RESULTS ................................................................. 44
4.1 Introduction ................................................................................................................................. 44
4.2 Overview of the Research Questionnaire .................................................................................... 44
4.3 Data Management ....................................................................................................................... 45
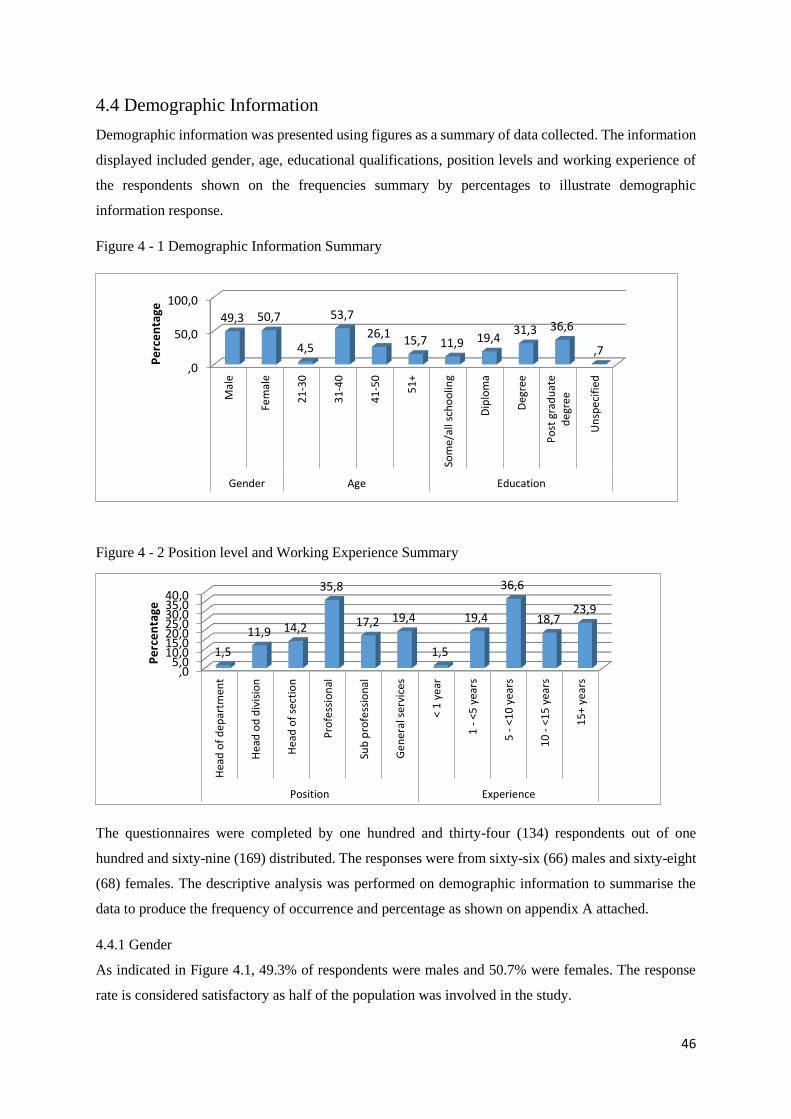
4.4 Demographic Information ........................................................................................................... 46
4.4.1 Gender .................................................................................................................................. 46
4.4.2 Age ....................................................................................................................................... 47
4.4.3 Education ............................................................................................................................. 47
4.4.4 Position ................................................................................................................................ 47
4.4.5 Experience ............................................................................................................................ 47
4.5 Analysis of UTAUT .................................................................................................................... 47
Page 8
vii
4.5.1 Performance Expectancy (PE) ............................................................................................. 48
4.5.2 Effort Expectancy (EE) ........................................................................................................ 50
4.5.3 Facilitating Conditions ......................................................................................................... 51
4.5.4 Social Influence.................................................................................................................... 53
4.6 Dependent Variables to the Model .............................................................................................. 54
4.6.1 Behaviour Intention.............................................................................................................. 54
4.6.2 Intention to Use .................................................................................................................... 55
4.6.3 Training ................................................................................................................................ 56
4.6.4 Use Behaviour ...................................................................................................................... 57
4.7 Construct Analysis ...................................................................................................................... 58
4.7.1 Performance Expectancy (PE) ............................................................................................. 59
4.7.2 Effort Expectancy (EE) ........................................................................................................ 59
4.7.3 Facilitating Conditions (FC) ................................................................................................ 59
4.7.4 Social Influence (SF) ........................................................................................................... 59
4.7.5 Behaviour Intention (BI) ...................................................................................................... 59
4.7.6 Usage Behaviour (UB) ......................................................................................................... 60
4.7.7 Construct Relatedness .......................................................................................................... 60
4.8 Objectives Analysis .................................................................................................................... 60
4.8.1 The Effect of Independent Variable on the Dependent Variable ......................................... 61
4.8.2 Moderating effect of Gender, Age, Experience, and Training ............................................. 67
4.9 Summary of the Chapter ............................................................................................................. 67
5. CHAPTER FIVE-DISCUSSION OF THE RESULTS ................................................................. 69
5.1 Introduction ................................................................................................................................. 69
5.2 Discussion of the Finding Based on Research Questions ........................................................... 69
5.3 Research Contribution ................................................................................................................ 73
5.4 Recommendations for Future Research ...................................................................................... 73
5.5 Summary of the Chapter ............................................................................................................. 74
6 CHAPTER SIX- CONCLUSION AND RECOMMENDATION ................................................ 75
6.1 Introduction ................................................................................................................................. 75
6.2 Conclusion .................................................................................................................................. 75
6.3 Recommendations ....................................................................................................................... 76
7. REFERENCES ................................................................................................................................. 79
Appendix A ........................................................................................................................................... 85
Appendix B ........................................................................................................................................... 87
Page 9
viii
LIST OF FIGURES
Figure 2- 1 Original Unified Theory of Acceptance and Use of Technology ....................................... 25
Figure 2- 2 Proposed UTAUT Model ................................................................................................... 27
Figure 4 - 1 Demographic Information Summary ................................................................................ 46
Figure 4 - 2 Position level and Working Experience Summary ............................................................ 46
Figure 4 - 3: Performance Expectancy Mean Distribution ................................................................... 49
Figure 4 - 4 Effort Expectancy Mean Distribution ............................................................................... 50
Figure 4 - 5: Facilitating Condition Mean Distribution. ....................................................................... 52
Figure 4 - 6: Social Influence Mean Distribution. ................................................................................ 53
Figure 4 - 7: Behaviour Intention - Mean Distribution ......................................................................... 54
Figure 4 - 8: Intentions to Use Mean Distribution ................................................................................ 55
Figure 4 - 9: Present Usage Behaviour Mean Distribution. .................................................................. 56
Figure 4 - 10 Training – Mean Distribution .......................................................................................... 57
Figure 4 - 11 Percentage of Usage of HRIS on Weekly Basis. ............................................................. 57
Figure 4 - 12 : Percentage of Usage in Years........................................................................................ 58
Figure 4 - 13 Mean of the Variables ..................................................................................................... 60
Page 10
ix
LIST OF TABLES
Table 4-1: Total number of employees at CBL. ................................................................................... 45
Table 4-2: One-Sample Test- Response on Performance Expectancy Construct. ................................ 49
Table 4-3: One-Sample Test Response on Effort Expectancy Construct. ............................................ 50
Table 4-4: One Sample Test- The response on the availability of support to use HRIS ...................... 51
Table 4-5: One-Sample Test Response on Social Influence Construct ................................................ 53
Table 4-6: One Sample Test- Indicating the respondents’ intention to use HRIS. ............................... 54
Table 4-7: One Sample Test Present Usage Behaviour. ....................................................................... 55
Table 4-8: One-Sample Test Response on the Training of HRIS. ........................................................ 56
Table 4-9: Reliability Statistics of the Constructs. ............................................................................... 59
Table 4-10: Model Summary. ............................................................................................................... 62
Table 4-11: ANOVA. ............................................................................................................................ 62
Table 4-12: Coefficients ....................................................................................................................... 62
Table 4-13: Model Summary. ............................................................................................................... 63
Table 4-14: ANOVA. ............................................................................................................................ 63
Table 4-15: Coefficients ....................................................................................................................... 63
Table 4-16: Model Summary ................................................................................................................ 64
Table 4-17: ANOVA ............................................................................................................................. 64
Table 4-18: Coefficients. ...................................................................................................................... 64
Table 4-19: Model Summary. ............................................................................................................... 65
Table 4-20: ANOVA ............................................................................................................................. 65
Table 4-21: Coefficients. ...................................................................................................................... 65
Table 4-22: Model Summary. ............................................................................................................... 66
Table 4-23: ANOVA. ............................................................................................................................ 66
Table 4-24: Coefficients. ...................................................................................................................... 66
Page 11
1
1. CHAPTER ONE: INTRODUCTION
1.1 Introduction
The world is operating in the era where information needs to be readily available always and in required
standards for smooth decision making. To make sound decisions, organisations rely on reliable,
accurate, and timely information both from internal and external stakeholders. The quality of decisions
is determined by the quality of information available, on the other hand the quality of information
depends on the accuracy of data collected, captured, analysed and presented (Awan & Sarwar, 2015).
When information is not managed and kept safe organisations run the risk of information overload.
Therefore, information technology (IT) is a tool to be used to manage information properly and to
reduce the risk of information overload and misuse of that information (Kavanagh & Thite, 2009). IT
has provided possible solutions that offer excellent service delivery and generated opportunities to
organisations to get meaningful information that can be used for decision making (Heisler, 2010). IT is
used in organisations to provide better administrative functions by improving the efficiency of services,
improving back office productivity and in offering better delivery. Information sharing has been
transformed by technology to enable information to be shared across departments for customers to
receive faster and more transparent service (Wachira, 2010).
In the 21st Century, organisations have shifted from the manual way of doing work to the use of
information technology solutions that improve efficiency and quality of services (Storey, 2007). Human
Resources Information System (HRIS) evolved along with the development of technology in improving
service delivery in a form of providing accurate and well-timed information for strategic decisions. IT
has contributed a lot to convert manual human resources functions to computerised processes for easy
retrieval and dissemination of information related to human resources. HRIS has not only increased
organisations’ efficiency but it has contributed a lot in refining management strategic functions
concerning human resources planning (Ahmer, 2013).
Human Resources Information Systems is a tool that helps managers at strategic level to access accurate
and timely employee information to fulfil organisational objectives. Kavanagh and Thite (2009)
indicated that HRIS is another system organisations use to automate human resource (HR) business
processes to gain potential benefits of delivering effective and efficient human resources services.
The impact of HRIS globally has been significant in terms of adding value to improve an organisation’s
proficiency in the management of employee information (Troshani, Jerram & Gerrard, 2010). Bal,
Bozkurt and Ertemsir (2012) indicated that HRIS is one of the fastest growing tools used by human
resources departments in achieving organisational objectives. To indicate the fast pace of technology in
the HR; in the 1950s organisations were managing employee information manually with paper work
Page 12
2
and filing. In the 1970, organisations started investing in information technology by introducing
computers to manage information (Bal et al., 2012). In the 1980 human resources functions started to
deploy electronic human resources management (e-HRM) to automate their work to provide tools that
support decision making in managing employees (Ahmer, 2013). In the mid-1990s there was a shift to
Human resources information systems (HRIS) to focus more on providing a system that can enable
organisations to have structural connectivity across all departments to increase the speed of information
dissemination. It is important to note that HRIS is an information resources tool that is useful to align
human resources functions with the organisational strategic plan. Human resource department transition
from old ways of storing and filing information to fully automated system has led the human resource
department to be part of strategic partner in organisations.
HRIS is defined as an integrated system used to gather, store, analyse and manage information
concerning employees to support decision making (Jonsson, 2013). HRIS purpose is to fast track
information storing and retrieval throughout the organisation depending on the level of responsibilities
in decision making. An example is Decision Support System (DSS) which provides interactive
information to managers to make decisions such as supply and demand forecasting (Kavanagh & Thite,
2009). It facilitates smooth achievement of organisational strategic goals by providing accurate
information used for strategic, tactical and operational decision making (Smit, Cronje, Brevis & Vrba,
2011).
The use of HRIS to manage employees’ information relies on the proper implementation of the system
for efficient operation. Understanding of user’s behaviour and system process are key factors in
ensuring that HRIS implementation meets the organisational needs. The study is going to explain the
importance of understanding factors that influence individual behaviour intentions to use and accept
HRIS. The issue of user behaviour change is the key phenomenon on the study to be used to assess and
evaluate the success of implementing HRIS at the Central Bank of Lesotho. At the same time, user
behaviour will also help organisations to identify areas that need to be corrected to ensure the successful
implementation of HRIS. Feedback from the users will assist in getting the full picture of the actual
usage of the system and acceptance.
1.2 Context of the Study
This study focuses on the implementation of HRIS at the Central Bank of Lesotho by investigating
factors that influence individual behaviour intentions to use HRIS. The purpose of the study is to rectify
the existing resistance to change and prevailing difficulties in the acceptance and usage of the system.
The tenacity of implementing the HRIS at Central Bank of Lesotho (CBL) was to support the decision-
making needs at the operational, technical, and strategic management levels to ensure that information
is available and accessed always. The key focus of the study is to reveal the individual behaviour
Page 13
3
intention to use the system by identifying issues that need to be addressed that have an impact on
acceptance of the system. The study should determine the contribution and success of HRIS
implementation at the Bank. At the end, the study will provide appropriate measures in ensuring smooth
transition to use the automated system.
Unified Theory of Acceptance and Use of Technology (UTAUT) was adopted in the study because it
is one of the user’s acceptance models used to test the success of the new technology implemented.
Literature has indicated that the UTAUT can be used as a starting point to find some explanations on
the user behaviour to accept technologies introduced. The growing research on behaviour intention and
usage of technology innovation has inspired the development of the study. The study will concentrate
on both the organizational and individual use of the system at CBL. At the organisational level, the
study will investigate how the Bank is supporting the implementation process to ensure that there is
smooth transition from old manual operations to the new automated system. On the employee level, the
main focus will be on the behavioural changes and usage of the system. The UTAUT model will be
used to determine factors influencing individual behaviour intentions to use HRIS. The model is more
relevant to the study because it has been cited in studies where new technology has been introduced
(Venkatesh, Morris, Davis & Davis, 2003).
The model will guide the study in identifying factors that influencing individual behaviour intention
and acceptance of HRIS. UTAUT will be used to measure the employees’ behaviour changes and
perceptions on how the system has changed their performance since its implementation. The study is
expected to find out how employees’ behaviour has been influenced by the implementation of HRIS.
Lastly the study will look at the significance of age, gender, experience, and training on the behaviour
intentions and usage of the system. The study is important because it is going to provide
recommendations to help the Bank in designing, developing, and implementing new IT systems in the
future. The study will provide an explanation on why introduction of new technology can be a problem
in an organisation such as Central Bank of Lesotho
Human resource (HR) functions at CBL were performed manually since the establishment of the Bank
in 1980. In 1990 the first computer installed was a unique payroll system responsible for payroll
administration function. Two departments performed the payroll administration duties namely HR and
Finance. The HR was responsible for all paper work for payment of salaries and staff benefits. Finance
department was capturing all payments and deduction transactions on the system. It was difficult for
the two departments to manually process payroll monthly. An increase in the number of employees
resulted in an increase of paper work for HR to do payroll manually daily. Staff personal information
was kept in files and little information like staff terminal benefits spread sheets were kept on the
computers. The finance department was overloaded with work every month to prepare spread sheets for
Page 14
4
deductions and doing manual calculations for overtime payments and tax. People were working
tirelessly day and night to ensure that employees are paid on time.
HR functions such as application of employee leaves, recruitment and selection, training and
performances management system were performed manually at CBL. Managers were faced with
difficulties of managing employee records because information was misfiled in the human resources
division. Management was reluctant to automate human resources functions because of high costs of
installation and system maintenance. HR office was under pressure to automate their processes due to
high demand of information for reporting to management pertaining to human resources. In 2010, HR
functions were automated to improve service delivery. After the automation, the Bank was faced with
the problems of acceptance and reluctance in the use of the new HRIS. There was perceived resistance
from employees who were using the system because of the movement from the old manual system to
automated human resources functions, and that hindered development and positive progression in the
organisation.
The HRIS was installed in 2013 with automation of payroll, leave management and self-services where
staff views pay-slips online and change their personal details. CBL was faced with a challenge of
resistance from employees which resulted in the slow progress in noticing the opportunities brought by
the system to improve service delivery. HRIS is used by individuals to run the operations of the Bank
and it is important to examine individual perceptions to use the system and how they are adapting to
the system daily. In order to have successful usage of the any information technology, research revealed
that resistance should be dealt with by raising users’ awareness to the advantages of the system
implemented (Ghalandari, 2012). The study on the implementation of HRIS at the Central Bank of
Lesotho is important because it is going to predict the employee response towards the use of the system
introduced and explain their behaviour intentions in order that the system can be used effectively and
efficiently. Resistance to change was a challenge which needed to be addressed by the study to help
prepare appropriate remedies for full utilisation of the system (Kavanagh & Thite, 2009).
1.3 Research Problem
The perceived resistance to change by individual employees who are users of HRIS makes it difficult
for the system to be fully utilised. Individual decisions to use the system may be influenced by
colleagues’ views which might cause negative or positive attitude towards the use of the system. The
transition to the use of technology has changed employees’ relationships because of the human
computer interaction (Taiwo & Downe, 2013). Readiness and preparedness of the Bank to enable the
smooth switch from the old system to new HRIS technology is another challenge faced by CBL.
Page 15
5
The study provides an opportunity to develop a broader range of strategies to improve implementation
of HRIS. It will offer recommendations to help prepare the appropriate environment for employees to
accept and use the HRIS. The UTAUT model will be used to determine the user’s behaviour intention
and usage of the new technology. The model will provide a scientific way of explaining individual’s
intentions to use the new technology to improve service delivery. This study will use four constructs of
UTAUT model to explore the factors influencing the CBL employees to accept and use the technology.
The study will focus on the CBL employees and management in predicting their reaction towards new
HRIS introduced. Management support is vital in the implementation of any system to create supportive
environment and providing required resources (Ahmer, 2013). There a serious need to address the issues
of acceptance and usage of the HRIS at CBL. The Government of Lesotho is in the process of
implementing the same project for all ministries in the country. The study is going to provide learning
opportunities to the government in support of the human resources national goals. The problem of
acceptance and usage of technology still exists when looking at government employees. The employees’
experience in using computers is very minimal and the government has to be ready to deal with the
challenges of acceptance and usage of HRIS. Al-Dmour and Love (2015) indicted that existing internal
factors such as employees are very critical in the implementation of HRIS as users. Employee
behavioural change is the key focus of the study in finding out factors that influence their behaviour to
use HRIS using the UTAUT model. Management should have a better understanding of user behaviour
toward acceptance of the technology implemented (Bal et al., 2012).
1.4 Purpose of the Study
Technology change is strengthening employee performance by making it possible for them to do their
work faster and more accurately. Technology is truly transformative because it leads to individual
behaviour change in how people think about the world. Their roles change in the ways they do their
work and they face some challenges which hinder their performance and usage of the system. This study
aims at identifying factors that influence individual behaviour intentions to use HRIS at the Central
Bank of Lesotho. The intention of the study is to identify those factors to be able to notice behavioural
change in the use of the HRIS and rectify existing problems cause by non-usage of the HRIS.
The use of HRIS in the HR department was to offer faster services which are accurate and timely to
different stakeholder as required. The study will identify factors that might impact the implementation
and acceptance of the HRIS at the Bank. The reluctance in acceptance of HRIS by staff has created a
gap in understanding user’s acceptance of the new system which needs to be investigated further to be
able to explain how their perceptions can be changed towards using the system. The study will offer
recommendations that provide the right platform for proper implementation and usage of the new
technology. The study will explain factors that hinder the implementation process at CBL to have clear
Page 16
6
understanding of why HRIS implementation can fail. The study will provide strategic value of
implementing the HRIS at CBL as change management process. This is an attempt to extend the
knowledge on the successful implementation and maintenance of technology in organisations in
Lesotho especially in the Banking sector. The present study will provide a clear explanation why
implementation of HRIS can be a problem in organisations.
1.5 Significance of the Study
The issue of implementation and acceptance of HRIS at the CBL has to be addressed to ensure
successful usage of the new information system. The CBL has invested in the technology to improve
service delivery in providing better services to internal and external clients; therefore the study has to
provide solutions on the problem of usage of the system design. The CBL will experience a great loss
on its investment if the new technology cannot be utilised fully. The study has to find ways through
which the Bank can overcome the current challenges faced following the implementation of the system.
1.6 Research Methodology
The study is going to use quantitative method approach to provide a better understanding of the problem.
Quantitative method is appropriate as the study will be looking at the general features of a population
to find factors that influence individual behaviour to use HRIS. The study will be conducted at the
Central Bank of Lesotho (CBL) in Maseru, Lesotho. The CBL has the total of three hundred (300)
employees who are users of the system at different levels. The study has adopted Krejcie and Morgan
(1970) table in determining the sample size for this study for the population of 300 employees which is
169. The study will use questionnaires based on the UTAUT model as a method of gathering data from
employees.
Data will be handled in such a way that it is consistent over time and represent the total population
under study. Validity will be demonstrated by use of constructs to ensure that measurements are
accurate and are measuring what they are intended to measure. Data collected will be analysed by SPSS
software to provide analysis on the employees behaviour changes following the implementation of
HRIS.
1.7 Research Objectives
Objectives have been formulated based on the constructs of the UTAUT model.
Research study seeks to address the following objectives:
Page 17
7
a) To determine whether implementation of HRIS has improved employees’ performance in the
bank.
b) To ascertain how individual employee effort has influenced the behaviour intentions to use
HRIS.
c) To establish the impact of social influence on employee’s behaviour in using the HRIS.
d) To find out whether the bank has created facilitating conditions for the HRIS implementation.
1.8 Research Questions
a) To what extent has employees’ performance improved by implementing and using HRIS?
b) To what extent has effort expectancy influenced the users’ behaviour intentions in using HRIS?
c) To what extent has social factors influenced the users’ behaviour intentions in using HRIS?
d) To what extent has the Bank’s facilitating conditions influenced the users’ behaviour intentions
and use of HRIS?
1.9 Hypotheses
Hypothesis 1: Performance expectancy has significant influence on the users’ behaviour intentions to
use HRIS.
Hypothesis 2: Effort expectancy has significant influence on the users’ behaviour intentions to use
HRIS.
Hypothesis 3: Social influence has significant influence on users’ behaviour intentions and use of HRIS.
Hypothesis 4: Facilitating conditions have significant influence on the users’ behaviour intentions and
use of HRIS.
1.10 Definition of Terms
User Acceptance – demonstrates willingness within a user group to employ information technology for
the tasks it is designed to support (Venkatesh, Thong, & Xu, 2012).
Usage – continuous use of the system (Kavanagh & Thite, 2009).
HRIS – is a software system used at the human resources department to help automate and manage
their HR, payroll, management and accounting activities (Tiwari, 2013)
Central Bank of Lesotho – is an institution that manages a state's currency, money supply, and interest
rates. Central banks also usually oversee the commercial banking system of their respective countries.
In contrast to a commercial bank, a central bank possesses a monopoly on increasing the monetary
base in the state, and usually also prints the national currency which usually serves as the state's legal
tender. (https://www.centralbank.org.ls/index.php/legislation/121-principal/538-central-bank-act).
Page 18
8
Concentrated HRIS – is a system that is controlled and placed at one centralised location to allow
strict control and monitoring (Grobler, Warnich, Carrell, Elbert & Hatfield, 2005).
Distributed HRIS – a system that is found on both central and multiple sites and are connected to each
other (Nambiar, Poess, Masland, Taheri, Emmerton, Carman & Majdalany, 2012).
Independent HRIS – has got more flexibility features that accommodate duplication of systems to be
connected (Dillon, Wu & Change, 2010).
Hybrid HRIS – a mix of system that allow centralisation and decentralisation of other systems to be
connected to one another (Dillon et al., 2010).
Electronic Data Processing (EDP) – an automated system used for processing of routine information
(Kavanagh & Thite, 2009).
Management Information System (MIS) – a system that provides data to support daily decision making
at operational and management levels (Bal et al., 2012).
Decision Support System (DSS) – designed to interact and reiterate managerial decision making and
support business operations (Nambiar et al., 2012).
Employee self-service (ESS) – provides employees with opportunity to perform some of the human
resources functions on their desktop (Kavanagh & Thite, 2009).
1.11 Structure of the Dissertation
This study is organised in six chapters. In this chapter, the introduction was detailed indicating the
importance of implementation of human resources information system (HRIS) in organisations. The
impact of HRIS was discussed looking at behaviour intentions in the use of HRIS. The remaining
chapters of the study will be structures as follows;
Chapter 2 focuses on the research methodology devoted to the literature review relating to the use of
HRIS at different scenarios. Several relevant studies were visited looking at how the implementation of
information technology has affected user behaviour to use the system. Literature on successes and
failures were read to gain more knowledge on the subject matter. The theoretical framework adopted
on the study was discussed.
Chapter 3 introduces the methodology framework used in the study. The research methodology was
discussed looking at theoretical paradigm and approaches used in the study. The chapter describes data
collection methods, analysis tools as well as reliability and validity test used.
Page 19
9
Chapter 4 discusses the analysis and the findings of the data collected. The discussion includes the
overview of the questionnaires and the results of the respondents. The chapter presents the analysis of
the respondent’s demographic information looking at age, gender, qualifications and working
experience. The constructs were tested to understand the users level of agreement and disagreement
with the statements presented.
Chapter 5 is about discussion and conclusion on the findings of the study. On this chapter research
questions were answered and hypothesis confirmed in relation to the respondents’ response on their
usage of the system.
1.12 Conclusion
This chapter discussed background of the study, research problems and purpose of the study. The
chapter reiterated on the importance of taking the study and research methodology applied. The research
objectives, questions and hypotheses were presented. The definition of terms and structure of the
research study were also outlined in the same chapter.
Page 20
10
2. CHAPTER TWO: LITERATURE REVIEW
2.1 Introduction
HRIS implementation is an important process in the transition from manual HR functions to the use of
automated systems. A common mistake that is normally underestimated is the amount of time that is
taken to implement the new system and getting the employees to use it in their daily work. HRIS has
drastically changed the organisation’s work environment by providing sophisticated analytical tools
that supports effective decision making in organisations. HRIS is explained as a system used to acquire,
store, manipulate, analyse, retrieve and distribute employee information for effective and efficient
decision making by management in an organisation (Kavanagh & Thite, 2009). Research has revealed
that HRIS has a strong effect on the way organisations manage their human capital (Atsanga, 2013).
Managers are no longer counting individual heads of employees but as a result of technology they are
truly understanding what employees are doing and the value they are adding to the success of the
organisation ( Razali & Vrontis, 2010).
HRIS covers a wide scope of information from start, when an employee joins the organisation, to finish,
when an employee retires (Bal et al., 2012). It provides important data for effective decision making
and can be used as communication platform to help human resources department link the organisation’s
human capital with their activities to improve job performance (Razali & Vrontis, 2010). Information
technology through HRIS has transformed the human resources department in providing accurate
information for improved and better decision making in organisations (Heisler, 2010). It goes an extra
mile to produce reports, forecasting HR needs, strategic planning and evaluating human resources
policies and practices (Troshani et al., 2010). This chapter presents a discussion of the relevant literature
regarding implementation of HRIS in organisations and its impact on users’ behaviour to use the system.
Previous research studies regarded user acceptance as an important factor that can be used to measure
the success of implementation of HRIS (Opiyo, 2015).
Researchers have come up with theories that investigate factors that influence human beings to use
information technology which will also be discussed here. The current study investigates the
implementation of HRIS with the focus on user behaviour of HRIS at the Central Bank of Lesotho
(CBL). Unified Theory of Acceptance and Use of Technology (UTAUT) will be adopted to provide
knowledge about the phenomenon looking at behaviour intentions in the usage of the system. This will
enable the study to establish the success or failure of implementing the HRIS at the CBL. The original
UTAUT focuses on user’s acceptance of new technologies introduced and identifying factors that
influence individual users behaviour on the use of the technology to be able to establish how their
perception changes with increased experience of using the technology and the effort they exert
(Venkatesh et al., 2003).
Page 21
11
The purpose of the chapter is to review previous literature on success factors and challenges faced by
different organisations which implemented HRIS. It is important to identify factors that influence
individual intention to use the system (Sharifian, Askarian, Nematolahi & Farhadi, 2014). The
knowledge acquired will help managers of CBL to develop strategies aimed at enhancing users’
acceptance. The chapter will discuss the role of HRIS in an organisation, success and failure factors of
HRIS and UTAUT, and lastly summarise the chapter.
2.2 Role of HRIS
HRIS is considered as a weapon that an organisation can use to reduce administrative costs, enhance
service delivery and increase productivity (Razali & Vrontis, 2010). Organisational effectiveness is now
a worldwide phenomenon in Europe, America and Africa with all countries implementing HRIS
programs to guide their operations in managing human capital (Mbugua, 2015). Companies have
realised the need to automate HR functions to improve the overall organisational performance (Grobler
et al., 2005). The Central Bank of Lesotho also has noticed a little improvement in the quality of work
produced by automating other operations and felt the need to expand the services to HR on payroll and
self-service. The study is going to provide insights on the extent to which the implementation of HRIS
has affected the operations of the Bank. Human resources management (HRM) is a dynamic function
supporting the organisation to achieve its business goals through effective management of employees
(Bohlander & Snell, 2006). Researchers have realised that management of human capital cannot be
smooth if the HRIS is not properly implemented (Razali & Vrontis, 2010).
As a way of enhancing organisational effectiveness, organisations require an effective management
information system (MIS) that will coordinate and control business operations at all levels within the
organisation (Bal et al. 2012). HRIS is considered as one of the MIS sub function within HR office
intending to support decision making within the organisation (Kavanagh & Thite, 2009). Bal et al.,
(2012) indicates that organisations invest in IT to be able to cope and manage the demands of their
business environment both internal and external. Human resources function such as recruitment, talent
management, payroll, and reward management, leave management, and workforce planning form the
scope of HRIS. According to Ahmer (2013) HRIS helps organisations to optimise the use of scarce
resources through smart IT that supports decision making. HRIS is regarded as an innovation that
transformed the human resources (HR) functions to be felt in every circle of organisational strategic
management platforms (Sanchita, 2013).
HRIS was implemented successfully by Epicurea Company in America. Epicurea was a family owned
company founded in the 19th Century (Tansley & Watson, 2000). The company is operating in sixty-
six (66) countries around the world and its headquarters is based in American Mid-West. The HRIS
project was successful because it was completed before the scheduled time and it could meet the
Page 22
12
specified targets and specifications. HRIS allows multinational companies to operate smoothly
irrespective of different areas where the companies are based (Kavanagh & Thite, 2009). Majority of
studies undertaken on implementation of HRIS were done in developed countries and few cases from
developing and less developing countries. HRIS implementation in Lesotho is a new phenomenon
adopted by organisations. As a result, no literature is available as reference.
HRM is a key player in the business arena because it assists organisations to systematically administer
and manage employees effectively. Therefore, HRIS is a tool that takes part in transforming HRM to
increase productivity as a result of efficient management of the workforce (Noor & Razali, 2011). Al-
Shibly (2011) mentioned that HRIS has provided a strategic platform that HRM had missed in the past.
HRIS has changed the way business has been conducted by making information real time, accessible
and accurate for managers to gain intelligent knowledge required for effective decision making (Dunne,
2016).
2.3 Implementation of HRIS in Organisations
Organisations implement HRIS to strive for effective organisational learning, improved productivity
and effective strategic decisions (Oruh, 2013). In India, HRIS was implemented in phases, firstly to
keep employee records and administer payroll and later to do sophisticated applications such as
performance management, rewards management and used as a communication platform (Al-Shawaken,
2014). In Kenya, the use of IT has been found useful in the banking sector including Kenya Commercial
Bank. The study by Mbugua (2015) showed that majority of Banks in Kenya were using traditional
managerial practices to manage employee information. There was lack of adoption of the HRIS
processes because work was performed manually. After the implementation of HRIS, Banks noticed
that the use of computers has resulted in improved organisational effectiveness in decision making.
There was a positive development in employee satisfaction together with improvement in
communication channels.
Malaysian Airlines (MAS) implemented HRIS in 2006 for purpose of improving quality of work in the
human resources department. HRIS has shown an impact in helping the airline to achieve its business
goals because of improved human resources processes (Razali and Vrontis, 2010). The company
recruitment process was faster resulting in hiring best employees. Improved services delivery led to
happy customers and enjoyable flights. Another study was undertaken in Kenya to assess the effect of
HRIS on performance of commercial banks (Opiyo, 2015). The study revealed that HRIS enhances
organisational performance by saving recruitment and payroll costs. E- Succession planning was found
to have high significance with performance as it embraced leadership development initiatives as a
corporate strategy to improve performance.
Page 23
13
The articles have spelled out the importance of HRIS in improving HR functions to be proactive in
providing information faster to top management. The question remaining unanswered is whether HRIS
has fulfilled the same positive platform at CBL. HRIS was implemented in Jordan for purpose of
ensuring that employee information is readily available to managers for improved decision making. The
study was investigating the degree to which the organisation’s internal and external environmental
factors have influenced the usage of HRIS in Jordan The study revealed that the most successful HRIS
applications implemented and used in Jordan were employee records and payroll at the same time there
was an increased usage of HRIS in decision making (Al-Dmour & Love, 2015).
Ministry of Public Service in Kenya has extended the used the HRIS by automating leave management,
payroll, staff deployment, compensation and benefits, statutory deductions and training and
development (Kumar, 2012). Wiblen, Grant, &Dery (2010) indicated that majority of studies
undertaken emanate from developed countries with few cases from developing and under developed
countries as they adopted the information systems in a lukewarm manner. In Lesotho, HRIS is
considered as a new phenomenon and there is no published literature available currently. The current
study embraces IT and its delivery of speedy service.
2.4 HRIS at Human Resources Departments
Organisations are currently giving electronic systems more attention due to lack of accurate and reliable
information contributing to the dysfunctional operation resulting in low staff morale, low productivity
and lack of competiveness (Heisler, 2010). As part of developments brought by technology,
organisations have noticed that good HR decisions originate from accurate and up-to-date HR
information from HRIS (Kavanagh & Thite, 2009). The use of HRIS is encouraged by most companies
as an opportunity for HR officers to be part of strategic partners with top management (Opiyo, 2015).
The systems allow employees to manage most of their HR administrative work and routine transactions
at any time because automated systems do not keep office hours (Muriithi, Gachunga & Mburugu,
2014). Various authors mentioned that organisations can reap the benefits given by HRIS by designing
systems that support decision-making and managing human capital effectively (Wiblen et al., 2010).
The system should answer the organisation problems and provide appropriate solution that benefits the
organisation and managers especially in the decision-making processes.
Researchers indicated that different organisations that implemented HRIS successfully guarantee that
HRIS has contributed towards improved employee commitment, innovation, creativity, increased
productivity, and improved service delivery (Mbugua, 2015). The effectiveness of the use of HRIS to
manage employees relies on proper implementation and maintenance of an appropriate HRIS
application (Kavanagh & Thite, 2009). According to the Deloitte Global Human Capital Trend Report
(2016), implementation of HRIS was a symbol of growing in the digital system within the HR
Page 24
14
profession. The use of HRIS is noticed as an opportunity for human resource professionals to be
strategic partners in decision making (Kavanagh & Thite, 2009). The study on integrated role of HRIS
and Strategic Human Resources Management in the banking sector of Pakistan indicated that HRIS is
a technology that brings substantial benefits to the banking environment by giving it a new look and
better ways of doing work (Awan & Sarwar, 2015). HRIS is the vehicle through which technology was
implemented in organisations such Central Bank of Lesotho. There are different forms and types of
HRIS with different functionality and performance (Global Human Capital Trend, 2016). In
implementing any HRIS project successfully, understanding the design requirements is crucial in
customising the system according to the user requirements.
2.5 Design of HRIS
Purchasing a new software solution can be thrilling for the organisation and employees (Kariuki, 2015).
In most cases, organisations make the mistake of focusing on the potential benefits of the system and
fail to properly address the challenges that come with HRIS implementation (Kavanagh & Thite, 2009).
Organisations have to understand top priority challenges concerning employee acceptance of the system
before the implementation starts. Manager should be able to identify factors that hinder the
implementation process and how to address them can be an assurance of successful implementation of
the project. It is important for organisations to have a clear understanding of the impact of implementing
any technology.
According to Kavanagh and Thite (2009), system development life cycle (SDLC) is a structural
development process used to analyse and design any information system. According to literature, SDLC
is undertaken from the time an organisation considers computerising its HR functions. System
development starts first with analysis of the current environment to determine the problems to be able
to come up with the system that will provide appropriate solutions.
The second thing is the system design stage which helps to figure out how the system will solve the
existing problems and help the organisation to take advantage of opportunities available (Smit et al.,
2011). The aim of the design stage is to find the system that fits into the organisation’s operations, not
the organisation fitting into the system. HRIS is one of the vehicle through which HR technology is
implemented in an organisation (Dunne, 2016).
The third stage is the design which provides detailed specifications of the final system to be
implemented (Kavanagh et al., 1990). The fourth stage is implementation, where the system is built,
tested and getting ready to be used. Lastly, the maintenance stage which can be referred to as evaluation
of the system to confirm whether the system has met the users’ needs as determined before the
implementation.
Page 25
15
The success in the design and implementation stage of the system will improve organisation’s business
processes at the same time change the human resource (HR) functions to be part of strategic partners in
decision making (Heisler, 2010). The quality of the design stage depends on the documentation
collected on every stage of the system implementation process (Kavanagh et al., 1990). Organisations
implement HRIS technology because of developmental changes and pressure from competitors for
better service delivery. This is an indication that design stage is very important in the successful
implementation of a system (Al-Dmour & Love, 2015).
2.6 HRIS CONFIGURATION
HRIS has a variety of features available where an organisation can make a beneficial choice rather than
sticking to the basic system. Selecting the basic system may be helpful for getting used to the system at
first, but will not help the organisation to maximise the potential offered by other applications of the
system. Central Bank of Lesotho bought the full package of HRIS with payroll, self-service, leave
management, recruitment, web reporting and business alerts and performance management system. The
Bank is only using payroll, self-service and partly leave management. After the initial stages of
implementation, it may be helpful to bring in an expert to configure the system to send alerts and
automatically print reports that can help with labour management, compliance, recruitment and staffing,
and reports that can help with labour management, compliance, recruitment and staffing, and
productivity (Heisler, 2010).
The ability of the organisations to manage their talent can be realised from the effective design and use
of HRIS (Kavanagh & Thite, 2009). Literature has pointed out that there are different categories where
HRIS can be implemented depending on the individual and organisational needs. Some organisations
opted for the HRIS that resides on the server at the physical location. Another option is the server that
resides entirely at the vender’s location or the HRIS that exists partly at the business location and at a
vender location (AO’Brien, Marakas, Hill & Lalit, 2006). There are also different types of HRIS
configurations with variation in functionality and performance. According to (Grobler et al., 2005),
HRIS can be configured in four ways, which are concentrated, distributed, independent and hybrid.
Concentrated HRIS is a system that is controlled and placed at one centralised location to allow strict
control and monitoring.
Distributed HRIS is a system that is found on both central and multiple sites and are connected to each
other.
Independent HRIS has more flexibility features that accommodate duplication of systems to be
connected.
Page 26
16
Hybrid HRIS is a mix of system that allow centralisation and decentralisation of other systems to be
connected to one another.
2.7 Types of HRIS
HRIS has four types which are relevant to this study, namely, Electronic Data Processing (EDP),
Management Information System (MIS), Decision Support System (DSS) and Employee Self-Service
(ESS). Organisations can choose any type depending on the needs and job requirements. These types
can be used at different levels ranging from storage of files to providing information for active decisions
to ensure consistent performance (Kavanagh & Thite, 2009).
2.7.1 Electronic Data Processing (EDP)
This is an automated system used for processing of routine information. The application is used for data
storage, processing, and easy flow of information at the operational level of the business. Information
that is found on the EDP system is the payroll, time and attendance entries and applications.
2.7.2 Management Information System (MIS)
This is a system that provides data to support daily decision making at operational and management
levels (Bal et al., 2012). It is very important to coordinate and control information that is circulating
within the organisation to ensure that all departments are working together (Kavanagh et al., 1990). In
organisational hierarchies, there are senior managers who make long term decisions for the
organisation, middle management who carry out plans and programs and lastly operational managers
who are responsible for monitoring daily activities. All these levels are provided with information
through the MIS, presented in a way suitable for decision making and for planning and monitoring of
activities (Bal et al., 2012). MIS was firstly implemented by industrialised countries in the 1980s to
support the business information needs (AO'Brien et al., 2006).
2.7.3 Decision Support System (DSS)
This is designed to interact and reiterate managerial decision making and support business operations
(Kavanagh & Thite, 2009). This system assist in decisions made by top management level and one
example of DSS can be providing human resources planning market (Nambiar et al., 2012). One of the
example of DSS is providing human resources planning data systems capable of providing future
scenarios regarding how organisations can attract and recruit best qualified employees in the labour
market (Storey, 2007).
2.7.4 Employee Self-Service (ESS)
This provides employees with opportunity to perform some of the human resources functions on their
desktop. ESS allows employees to view their personal information and payroll information online. It
permits employees see their personal information and pay information online at the same time enter and
change personal information ( Kavanagh & Thite, 2009).
Page 27
17
2.8 Successes and Failures of HRIS
Research studies have revealed that the key factor in implementing HRIS is to provide opportunities to
HR to transform its functions to help organisations in achieving competitive advantage (Wiblen et al.,
2010). There is growing research worldwide emphasising the impact of failure of implementation of
HRIS on individual and organisational performance (Bal et al., 2012). Just to mention a few studies that
support the above mentioned statement, the study by Razali and Vrontis (2010) looked at the reaction
of employees toward the implementation of HRIS in the Malaysian Airline System. The study indicated
that top management involvement is very crucial in the planned change program to avoid failure of
implementation process. It advised top Management to be actively involved in all stages to manage
failures that may surface during implementation. Literature has also shown that there are mixed findings
on the factors that influence the success or failure of the project implementation process (Yu, 2012).
This section is going to discuss reasons behind failure and success factors that influence the
implementation of HRIS. The scope will focus on issues that are related to factors that influence usage
behaviour. Knowing about the determining factors that influence behavioural changes could help the
Central Bank of Lesotho to alleviate some of the problems that are hindering the success of the
implementation of HRIS. The purpose of the study is to assist the Bank to attract more users to use the
system and it is very important to identify factors that are hindering the implementation process.
The study by Al-Dmour and Love (2015) indicated that internal factors play the most important role in
influencing user behaviour to use the new technology introduced. The study explored the extent to
which the organisation’s internal and external environmental factors influenced the HRIS
implementation. The study results indicated that the internal factors produced clear explanation of the
causes of failure of HRIS applications than the external factors. Last, but not least, is a study by (Opiyo,
2015) discussing the effects of human resources information system on the performance of banks in
Kenya. All the studies examined the factors that contributed towards the success and failure of
implementation of HRIS at different organisations. Almost all organisations from large to small use
automated systems to build employee value and customer value proposition which reveal the
importance of addressing failures in the implementation process (Noor & Razali, 2011).
In Pakistan, the major obstacles that were noticed were insufficient skills and knowledge, funds, and
lack of top management support, in addition to shortage of IT support to drive the implementation
process and poor time management. Al-Dmour and Zu'bi (2014) indicated that lack of collaboration
with other stakeholders internally and externally also hindered the implementation process. Therefore,
it is important to understand that the success or failure of any IT implementation has nothing to do with
the technology itself but the people involved in the implementation. Majority of times implementations
fail or succeed because more focus was placed on human factors looking into the skill, abilities and
Page 28
18
willingness (Al-Dmour & Love, 2015). The challenge in every success is being able to navigate through
problems encountered during the implementation process to keep the project on track and within budget
(Altaany, 2011).
2.8.1 Failures of HRIS
Al-Dmour and Love (2015) mentioned earlier that internal factors play the most significant role in
influencing user behaviour to use the new technology. Some of the internal factors such as training and
development, overspending, top management support and resistance to change will be discussed to
show their importance in the implementation of HRIS.
2.8.1.1 Training and Development
The worth of training employees to use a new system should not be underestimated during
implementation process (Sanchita, 2013). Any system can impose fear and anxiety to employees when
they are not familiar with the system (Kavanagh & Thite, 2009). Management and employees should
participate in the implementation process of the system and ensure that time is set aside for learning on
how to use the new system (Al-Dmour & Love, 2015). The study by Razali and Vrontis (2010) showed
that there are various factors that need to be considered before implementing any system, such as the
organisation network structures and culture readiness, technology competency, skills development and
budget available to avoid implementation failure. Global Human Capital Trends Report (2016)
indicated that user training is crucial to enable the organisation to identify areas that need to be
addressed with the intention to avoid unnecessary failures. Findings by Muriithi et al. (2014) indicated
that training which is incorporated in the human resource information systems has a greater impact on
the implementation to ensure that employees can attain skills to use the system and gain self-confidence
at any time.
In the field of HRM, technology has not only contributed towards the paradigm shift, but has brought
along with it various challenges and opportunities (Panayotopoulou, Galanaki & Palalexandris, 2010).
Water, Zuber, Willy, Waudo, Oluoch, Kimani & Riley (2013) observed that even though some countries
have successfully implemented HRIS, others have not, leading to negative and dysfunctional working
environments. One of the major cause of failure of the implementation of HRIS is insufficient
knowledge of HR processes which makes it difficult to find proper solutions to the existing problems
in Pakistan. It was found that lack of awareness, limited knowledge and resistance were issues of
concern in the implementation of HRIS (Ahmer, 2013).
Limited knowledge of technology is an obstacle to successful implementation of HRIS (Kavanagh &
Thite, 2009). Lack of IT skills among HR officers make it more difficult to implement the HR
technology (Opiyo, 2015). Research studies revealed that training has a positive correlation with
performance of the organisation (Muriithi et al., 2014; Sharifian et al., 2014). Loss of project control is
quoted as another key issue that resulted in poor implementation of HRIS in organisations. Automating
Page 29
19
HR functions requires training and development to manage the system as a result of human touch lost
by automation of HR functions (Mbugua, 2015). Development of a proper managerial climate is crucial
for innovative application and knowledge of HRIS (Kariuki, 2015).
2.8.1.2 Overspending
Kavanagh and Thite (2009) indicated that the biggest challenge facing organisations in the
implementation of HRIS is overspending caused by delays and excessive overrun costs. Overspending
can occur as a result of poor planning, shortage of IT support and poor time management (Ahmer,
2013). Noor and Razali (2011) mentioned that HRIS has brought challenges that are equally important
to be noted such as high implementation and maintenance costs which can result into overspending in
the project. Research has discovered that implementation and maintenance costs of HRIS are worth
noting for effective functioning of the HRIS system (Sanchita, 2013). Huge cost in the maintenance of
HRIS is another obstacle that hampers with the implementation process (Ahmer, 2013). Kavanagh and
Thite (2009) indicated that expenses incurred for purchase of software and other costs related to system
infrastructure for installation and implementation of HRIS are high because of movement from manual
to automated system.
2.8.1.3 Top Management Support
Absence of management support hinders the implementation process (Al-Dmour & Love, 2015). Razali
and Vrontis (2010) findings showed that top management support and organisational commitment
appeared as largest factors affecting the implementation of HRIS and acceptance of the system.
Literature showed that management should always support and commit by participating in the
implementation process till the end (Bal et al., 2012). Lack of top management support contributes to
management not being able to notice the investment in the HRIS as it is mostly given low priority
(Kavanagh et al., 1990). Loss of project control by management is quoted as another key issue that
resulted in poor implementation of HRIS in organisations (Sanchita, 2013). Absence of management
support hinders the implementation process and the widely usage of the technology within the
organisation (Lawrence, 2011). Top management support helps employees to gain confidence to use
the system and also provides a smooth transition to use the new system (Ahmer, 2013).
Top management involvement is an indication that the organisation is ready to give required support
during the implementation of the new technology. It showed a serious commitment of management to
support and provide adequate resource during the implementation process. Suggested by Kavanagh
and Thite (2009) was that top management can identify future business opportunities to be actively
involved and support the initiative to foster right direction to ensure successful implementation of the
system. Management support plays an important role in overcoming user resistance and resolving
feasible struggles. Successful implementation of any system required hundred percentage of
management support (Ahmer, 2013).
Page 30
20
2.8.1.4 Resistance to Change
Research pointed out that on the implementation stage it is important to note that resistance from
employees can surface at any time due to fear of the unknown (Akbar, 2013). The research by Razali
and Vrontis (2010) emphasised that individual differences are capable of producing resistance to
organisational changes because behaviour cannot be changed overnight. Resistance from employees
can display a sign of uncertainty, computer anxiety and worry of losing control over the work (Kim &
Crowston, 2011). Employee resistance in most cases is attributed to the fact that employees are
comfortable with the status quo and the organisational investment on the current status (Kavanagh &
Thite, 2009). Employee’s response towards implementation of HRIS attributes to continuous resistance
which can prolong for months, resulting in low morale, disengagement, quarrelling and turnover
(Lawrence, 2011). Most individuals who resist change are those that feet they lack meaningful
opportunities to participate in decision making and feel unfamiliar with what is happening around them
(Awan & Sarwar, 2015). To counter resistance, organisations should promote the value of change both
inside and outside the organisation to be able to understand the processes that individuals go through
during the implementation process (Oruh, 2013). It is useful to be able to identify factors that influence
user behaviour to acceptance of the new technology which will ultimately lead to successful
implementation of HRIS (Razali & Vrontis, 2010).
It is important to take note that individual have different concerns that can lead to individuals acting in
a way that undermine the implementation of HRIS. Implementation of new technology is a symbol of
change in the roles and responsibilities because new work patterns are introduced. Managing resistance
to change is key to the study because it affects user behaviour to use the system. Information technology
researchers regarded user satisfaction as a vital representation of successful implementation of a new
system (Bal et al., 2012). In any system, implementation process and user behaviour are considered as
core in enlightening behaviour intentions to use HRIS.
The study aimed at identifying factors that influence individual behaviour intentions to use the HRIS,
looking among others different demographic qualification such as age, gender, education and training
(Atsanga, 2013). Ahmer (2013) indicated that due to limited knowledge and resistance by employees,
the implementation of the system in Pakistan hindered the usage of HRIS. Employees were reluctant to
learn about the system because of resistance caused by the fact that new innovations in Pakistan were
considered as difficult and complex unless incentives were given. Publications were made on the
behavioural consequences brought by resistance to change and this is considered as a key concern in
the study in question.
The Bank will be able to deal with resistance to change as the study will provide clear explanation of
employee behavioural intentions to use the system. Some employees may not be interest to use and
learn the system and opt to continue with what they are familiar with (Bal et al., 2012).
Page 31
21
2.8.2 Key Success Factors of Implementing HRIS
Studies in the field of information technology (IT) disclosed that organisations which successfully
implemented HR technology have the advantage of improving the organisation efficiency than those
that did not succeed in the implementation process (Atsanga, 2013). Successful implementation resulted
not only with transformation of HR Practices but also increased efficiency and accuracy of the HR
functions across the organisations (Awan & Sarwar, 2015). On the same note, research findings have
revealed that internal environmental factors provided better explanation on the successes in the
implementation of HRIS than external factors (Al-Dmour & Love, 2015). The study further indicated
that internal factors be taken into consideration during the implementation process. Internal factors that
will be discussed are communication, organisation readiness, network structures, employee technology
familiarity, skills and development, size of the organisation and budget availability. The discussion will
elaborate by using examples of organisations which successfully implemented the information systems,
which include Safaricom in Kenya that revolutionised mobile telephone, Azalai Hotel chain based in
Mali, the Dangote Conglomerate based in Nigeria, and South African Airways (Muriithi et al., 2014).
Some of these success factors as reported in the media such as magazines and published books and
journals are discussed below.
2.8.2.1 Communication
Recent studies conducted by the Project Management Institute (PMI) revealed that ineffective
communication has a negative impact on successful project implementation. To ensure the smooth
implementation of the system, organisations must address all issues that hinder effective
communication within the organisation (Sanchita, 2013). Kavanagh and Thite (2009) stated that
communications should be considered as part of regular project management tools used to disseminate
information. Many companies are losing millions of money out of the windows with every project they
attempt to execute because of poor communication (Heisler, 2010). Kavanagh et al. (1990) revealed
that effective communication makes a huge difference between success and failure of any HRIS
implementation project. As a remedy, comprehensive communications plan has to be developed to
ensure that all stakeholders involved in the project adhere to it for the entire project implementation
(Mbugua, 2015). Management that fails to communicate the change initiative is consistently running
the risk of getting negative response from employees. Most of the time employees becomes rebellious
and resist the change introduced. Communication platform unfreeze the current behaviour to allow
change to take place. One way of helping employees to regain confidence in the use of the system is to
engage them in a two way communication to get their views regarding the implementation of the project
(Kavanagh & Thite, 2009).
Employees should understand what is happening around them to be able to accept the change.
Communication plays a vital role in the success of any HRIS implementation process. It becomes easy
to engage every employee when communication is frequent as all stakeholders should be involved from
Page 32
22
the beginning to the end of the implementation process. Management commitment on communication
is important for proper support on the HRIS implementation to ensure that resources are made available
to sustain employees’ efforts at the same time giving technical support and to all users (Al-Dmour &
Love, 2015).
2.8.2.2 Organisational Readiness
According to Global IT report by Bilbao-Osorio, Dutta & Lanvin (2013) indicated that organisational
readiness is the key issue to enable positive technology implementation and to show areas that need to
be developed. Employees’ readiness to technology acceptance is critical in the implementation process
(Kavanagh & Thite, 2009). Employees have to be convinced by the fact that the use of technology at
work will help them in generating better results than not using the technology (Sanchita, 2013). This is
explained clearly by UTAUT under performance expectancy construct which indicated that individual
believes that using a certain system would improve their work performance better than not using the
technology (Akbar, 2013). It may be challenging for users to find the system that is user friendly,
therefore, organisations must priorities and take decisions to implement a systems on the basis of vital,
essential and desirable operations as part of organisational readiness (Wachira, 2010).
Organisational readiness is reflected on in the study by Awan and Sarwar (2015) which showed that
HRIS is a technology that brings substantial benefits to the banking environment by giving it a new
look and better ways of doing work. The Pakistan bank was prepared to implement the HRIS to embrace
information technology and speed service delivery. The use of HRIS have impacted positively on the
performance by bringing a new look to the operation of the bank. Organisational readiness can be
reflected on the clear understanding on the employee’s perceptions on the implementation of the HRIS
and the organisation is able to identify factors influencing individuals to use the system (Kavanagh &
Thite, 2009). On the same note Kim and Crowston (2011) indicated that understanding users
perceptions of technology is important in the designing and implementing of the new information
system as it brings the light in ensuring that their needs are met.
2.8.2.3 Skills Development
The process of training users is bulky and time consuming in the implementation of HRIS. Research
indicated that employee at all levels showed evidence of fear of technology caused by worry of losing
control over the work because of the new system (Kavanagh & Thite, 2009). To minimise this fear, it
wise to familiarises users to the system through skills development (Sharifian et al., 2014). The
organisation should make provision for training budget to enable easy access and usage when needed
because if it is not budgeted for it will make additional costs to the project implementation (Al-
Shawakeh, 2014).
Implementation of HRIS can only be considered successful if the transfer of learning has occurred and
there are signs of employee behaviour change (Kavanagh & Thite, 2009). Organisations are not able
Page 33
23
to realise the benefits of implementing HRIS because of failure to train employees on how to use the
system (Bal et al., 2012). Opiyo (2015) revealed that training has positive effect on performance of the
commercial bank of Kenya. The study indicated that HRIS training has brought light to certain success
factors such as flexibility in the management learning and active participation from employees. When
training is delivered it is very important to engage participants and motivate them to embrace the change
to encourage improvements and behavioural change. Kumar and Parumasur (2013) demonstrated the
importance of training the trainers’ that was adopted by the Municipality of South Africa in Kwazulu
Natal to identify super users in each department to assist their colleagues to use the system. In-house
were method used to influence employee to use the system.
2.8.2.4 System Maintenance
System maintenance begins when the new system is put into operation and it is considered important
because it determines the start of evaluation process of the system. Maintenance is concerned with
fixing broken parts which are not operating properly, it involves modifying certain components made
on the system to meet the users’ needs and lastly, it is preventative (Kavanagh & Thite, 2009).
Literature has indicated that a detailed implementation plan of action, checklist to monitor
implementation process and periodical audit are critical for successful implementation and maintenance
of HRIS (Sharifian et al., 2014). Documentation relating to the technical aspects of the system should
be provided for the purpose of system administration, configurations, and all attributes available and
needs to be known to all users (Opiyo, 2015). As part of evaluation the system has to be audited
periodically to be able to verify and make follow up on the direction and scope of the project being
implemented (Al-Dmour & Zu'bi, 2014). Progress reports should be prepared for management and
project team to assess the progress in relation to the budget, risks and communication (Waters et al.,
2013).
In conclusion HRIS project implementation needs to be monitored extensively because of the high
failure rates (Kavanagh & Thite, 2009). Failure to deliver successful implementation of the system
hinders not only the operations of the organisation but also performance of individual using the system
(Alshehri, Drew, Alhussain, Alghmadi, 2012). Celebration of success factors is vital to help employees
feel more committed to make the new system function properly (Troshani et al., 2010). Extensive
research has been conducted on the successful HRIS implementation detailing factors that support the
success of using the system. Razali and Vrontis (2010) indicated that top management involvement is
considered as a factor that influence acceptance of employees towards successful implementation of
HRIS. If success means completing the project on time within the budget as well as satisfying the ability
of users to use the system, then, studying human behaviour is vital to the success of any project
implementation.
Page 34
24
2.9 Theoretical Framework
There is a continuing research undertaken to address issues relating to user acceptance of technology
which is an ongoing management challenge. User acceptance is regarded as one of the measures of
success of HRIS because of its applicability and ease of use (Bal et al., 2012). Employee perception on
the system is a key factor to be well-thought-out when talking about the success of implementing any
technology (Razali & Vrontis, 2010). User acceptance of HRIS is described as a most researchable
phenomenon in the field of information technology (Kim & Crowston, 2011). According to Sharifian
et al. (2014) user acceptance of technology is the key factor in the implementation of any information
system. Adding to that, increased investment in information technology by organisations has made user
acceptance an important issue in technology implementation and management (Kavanagh & Thite,
2009).
The current study has adopted UTAUT to identify factors that influence employees to accept
implementation of HRIS. UTAUT is a useful tool that provides better evaluation for the success of
implementing new technology. The theory has been used to identify factors that are likely to influence
employee behaviour to use the system (Kim & Crowston, 2011). The UTAUT explains the individual
intentions to use the technology following the implementation of the new system (Venkatesh et al.,
2003). As shown in Figure 2-1, UTAUT theory holds four constructs that are determining factors of
behaviour intention and usage behaviour (Akbar, 2013). The first three constructs namely performance
expectancy, effort expectancy and social influence are determinants of intentions to use. The last
construct which is facilitating condition influence behaviours to use the technology implemented. The
theory continued to explain that the relationship of the constructs can be influenced by gender, age,
experience and voluntariness (Venkatesh, Thong & Xu, 2012).
Page 35
25
Figure 2- 1 Original Unified Theory of Acceptance and Use of Technology
Source (Venkatesh, Morris, Davis & Davis, 2003) The definitions below are derived from the original
UTAUT
Performance Expectancy “is the degree to which individuals believe that using the system will help him
or her to attain gains in job performance” (Venkatesh, Morris, Davis & Davis, 2003:7). It has a strong
effect on behaviour intention.
Effort expectancy “is the degree of ease associated with use of the system” (Venkatesh et al., 2003:8).
It offers a clear understanding on the easiness and friendliness to use of HRIS. Effort expectancy is
significant during the early stage of the implementation process but as time goes on the usage became
non-significant.
Social Influence is the degree to which an individual perceived the importance of other colleagues
believe that he or she can use the system (Sundaravej, 2010). Jonsson (2013) mentioned that the
construct is used to find out the degree to which individuals perceive the importance of others views in
using the system. The construct considers the views of colleagues to be helpful and supportive to the
usage of the system. Social Influence is also important in the beginning of the system use (Venkatesh
et al., 2003).
Facilitating Conditions is the explained as a degree to which an individual believes that the
organisational and technical infrastructure exists to support the use of the system (Venkatesh et al.,
2012). It helps to determine the degree to which employees believe that their organisation has provided
all support required to use the HRIS. Facilitating conditions do not influence the user behavioural
intentions but the use behaviour, where the moderating factors plays a major role to explain the degree
of support needed. Kumar and Parumasur (2013) indicated that the Municipality of South Africa in the
Page 36
26
Kwazulu Natal Province provided help desk and online assistance to ensure that users are timely assisted
and facilitated easy communication between employees and human resources office.
The study has adopted gender, age and experience to establish the moderating effect on the four
constructs in influencing behavioural intention and use behaviour. Voluntariness of use was removed
because it not relevant and it was replaced with training.
The original UTAUT was adopted by Akbar (2013) to test user acceptance of technology introduced to
get their first impression about the system. The study investigates how user’s behaviour changes with
the increased experience of using the technology. UTAUT has been confirmed to be more accurate than
other technology adoption theories in predicting the success of the new technology introduced and help
to understand the drivers behind the user acceptance. This study is relevant to the current study as it
clarifies the implication of implementing HRIS at the same time understanding employee’s behavioural
change after the implementation (Sharifian et al., 2014).
Study undertaken by Jonsson (2013) showed that, if the user benefits from using the system it has a
positive effect on the use as well as good quality of information. This study has found that the opinions
of colleagues and managers play a role in influencing individual behaviour to use the system. The study
supported the original by explaining that the relationship between the constructs is moderated by gender,
age, experience and voluntariness of use. This was very important on the study in explaining individual
perceptions towards the use of the implemented system (Bakar, Razak &Abdullah, 2013).
UTAUT give guidance to managers to assess the possibility of successful implementation system and
also assist in understanding factors that drives the acceptance to be able to proactively design
appropriate interventions (Kavanagh & Thite, 2009).
Different theories are used to describe individual intentions and behaviours to acceptance and usage of
the new technology but UTAUT provides systematic ways of analysing people’s perceptions and
reasons for their willingness to accept and use the technology introduced (Akbar, 2013). Research
studies have examined the four constructs at organisational setting, and have found that the UTAUT
can be able to assess individual’s behaviour changes to be able to identify vital factors influencing the
user’s acceptance behaviour (Williams, Rana & Dwivedi, 2015). The successful combination of all
constructs can be used to explain differences in the behaviour change and usage behaviour (Sharifian
et al., 2014).
UTAUT has been applied in many information systems studies in organisational and non-organisational
settings. Some studies modify the theory by using some constructs and dropping moderators to suit their
studies (Venkatesh et al., 2012). The article by Williams et al. (2015) indicated that gender and
experience has significant impact on behaviour intention, training and age impact on performance
Page 37
27
expectancy, resistance to change influence effort expectancy, IT skills and knowledge has an influence
on facilitating condition.
The theory will be modified to suit the suggested study. The study will apply the four constructs to
explain whether the four constructs have any influence on behaviour intention and usage behaviour of
HRIS. On the variables, the study is going to adopt gender, age and experience from the original model
then replace voluntariness to use with training as the system is mandatory to use as shown in Figure 2-
2.
Figure 2- 2 Proposed UTAUT Model
(Source: Venkatesh, Morris, Davis & Davis, 2003)
Definitions of the theory based on the proposed study.
Performance Expectancy is going to establish the degree to which individuals believes that the
HRIS is going to enhance their effectiveness on the job and improve their job performance.
Effort expectancy is going to make us understand the simplicity of the system connected with
ease of use of HRIS.
Social Influence is going to find out the degree to which employees perceive the importance of
other factors in using the system.
Facilitating Conditions is going to determine the degree to which employees believes that the
Central Bank of Lesotho has provided all support required to use the HRIS.
Behavioural
Intention
Facilitating
Conditions
Social
Influence
Effort
Expectancy
Performance
Expectancy
Use
Behaviour
Training Experience Age Gender
Page 38
28
Moderating Factors UTAUT Model
The study is going to use the moderating factors namely; gender, age and experience and training to
establish their effect on the constructs in relation to individual behavioural changes. The moderating
factors will be tested to see whether they have any implication on the four constructs. The current study
is going to find out whether age has any moderating effect on relationship between the four constructs
and behavioural intentions and usage behaviour. Gender is going to be examined whether it has any
effect on the constructs and behavioural intention to use HRIS. Experience will also be tested to identify
its effect on social influence and facilitating conditions. Training will be test to establish the impact of
social influence on behaviour intention and use of HRIS. Lastly, voluntariness of use was not relevant
to the study and it was replaced by training. The training was found to have a strong impact on behaviour
intention as shown on figure 2.2.
2.9.1 Application of UTAUT
In the past, studies have been undertaken to investigate why information technology implementation
has not been successful. The focus was on hardware and software which was more technical to find
enough solutions. Today, there is paramount shift to find deeper solutions looking at the organisational
and behavioural issues. Understanding the users’ perceptions of technology is important in the
designing and implementation of new information system as looking at the technical aspects (Kim &
Crowston, 2011). Most published works that address the behavioural aspects in relation to use of
technology lacks a clear explanation of why those issues are important to determine the success or
failure of system implementation. Systems may fail because of behavioural reasons than technical
features (Lawrence, 2010).
Researchers have tested UTAUT’s suitability in explaining acceptance of technology at different levels
which makes it applicable on the current study. The purpose of applying theories in conducting research
is to direct the research design, interpretation of results and guide the research to provide further
recommendations for further research (Hameed, Counsell & Swift, 2012). The theory has been used in
many studies to investigate factors that influence acceptance and use of technology in the Kingdom of
Saudi Arabia. The study mentioned above adopted the UTAUT to critically assess factors that influence
e-government service acceptance, discussing the perceptions about the obstacles facing the government
in introducing the new system (Heisler, 2010). Several studies have also provided knowledge on the
implementation of different technologies in various aspects of social, technical and organisational
perspective (Alshehri et al., 2012).
Literature has assessed UTAUT in the context of the use of technology to identify the effect of age,
gender, and experience as moderating variables in influencing individual behaviour to adoption and use
technology (Sharifian et al., 2014). Studies revealed that acceptance and use of technology introduced
is an significant factor in determining the success of technology implementation (Akbar, 2013).
Page 39
29
Information technology is considered as one of technological innovation where theories are applied on
research studies to give guidance on clear understanding on factors influencing behaviour intention (Bal
et al., 2012). UTAUT provides systematic ways of analysing people’s perceptions and reasons for their
willingness to accept and use the technology introduced to improve job performance (Akbar, 2013).
The model embraces different elements across user acceptance explain different measures of behaviour
intentions and usage behaviour (Venkatesh et al., 2003). UTAUT was adopted to identify factors that
influence the students to accept and use the technology introduced (Akbar, 2013). Based on existing
studies, UTAUT was found to be suitable in studies that were testing the usage of the system to
determine how individuals adapt to the change introduced (Al-Dmour and Love, 2015). In most studies
the UTAUT was used to determine the behavioural change over a certain period of time Kim and
Crowston (2011) which is not relevant to the current study. Interaction of human and information
technology is affected by a number of factors which resulted in researchers coming with theories to
investigate factors that influence user acceptance behaviours to use technology applications (Taiwo &
Downe, 2013). The current study attempts to find factors that affect behavioural intention toward the
implementation of HRIS based on the findings from the UTAUT.
2.9.1.1 Performance Expectancy
According to original definition by Venkatesh et al. (2003) performance expectancy talks about the
ability of getting significant rewards after using the system. Studies have emphasised that performance
expectancy has strong effect on behaviour intentions (Ahmer, 2013). The study noted that employee
behaviour change occur when the system is consistently which resulted in a significant improvement of
individual performance and quality of work. Akbar (2013) on the study on adoption of human resources
information system in Pakistan organisation indicated that employee behaviour change to use HRIS has
improved the quality of work and their perceptions of the implemented system. On the same token,
employees perceived the system to have contributed to easy completion of tasks. Previous studies
indicated that gender and age had significant influence on performance expectancy. Williams et al.
(2015) indicated that young males found the system to be more useful to their work than females. The
study discovered that older users had difficulties and were uncomfortable to use information systems.
As a result, they found the new information systems less useful when performing their work.
Taiwo and Downe (2013) indicated that HRIS at strategic level has been found to have positive effect
on work performance of individuals. Technology acceptance was observed to be more outstanding with
male users because they seemed to be more comfortable with new information systems than females
and have a habit of spending more time using new information systems to obtain additional benefit from
the systems (Venkatesh et al., 2003).
Page 40
30
2.9.1.2 Effort expectancy
Studies suggested that effort expectancy is good in influencing individual behaviour intention in the use
HRIS (Al-Dmour and Zu'bi, 2014). In an organisational setting, the effort expectancy is viewed by
employees in a form of assessing time and effort spend to get familiar to use the system (Akbar, 2013).
It explains the user effort in relation with learning to use technology (Sharifian et al., 2014). It means
that the system should allow the user to be able to operate and use it at all times. Its functionality should
be clear and easy to understand. Literature indicated that expectation of individual may different
because of gender and age as a result of effort involved in learning how to use the system (Sanchita,
2013). Females and old people are usually more interested to learn when they first use the system but
these influences get reduced as they again more experience in using the technology (Venkatesh et al.,
2003).
2.9.1.3 Social influence
Social influence has very significant influence on old employees than young ones. When it comes to
gender issues for instance, women workers were easily influenced by the attitudes of senior managers
and colleagues (Venkatesh et al., 2012). These influences were noticed at the beginning of use of the
system. Individual behaviour is influenced by people around them to use the system (Yu 2012). Women
become more sensitive to other people’s opinions about their use of the system (Zudierwijk, Janssen &
Dwivedi, 2015). Social influence was found to dominate more in influencing behaviour to use new
systems (Venkatesh et al., 2003).
2.9.1.4 Facilitating condition
Facilitating condition is explained to have a positive influence over users’ behavioural intention
(Sharifian et al., 2014). Training and support provided affect the use of technology implemented
(Ghalandari, 2012). This is based on the idea that organisational environment is supportive enough to
allow users to be willing to use the technology. Facilitating condition have been assumed to influence
technology use when the organisational climate is conducive enough to change of behaviour (Venkatesh
et al., 2012). Users that access favourable facilitating condition are more likely to have high intentions
to use HRIS (Wachira, 2010). In explaining it further, users that have lower levels of facilitating
condition will have low motivation to use the system (Venkatesh et al., 2012).
2.9.1.5 Moderating Factors
Literature revealed that the influence towards behaviour intention can be affected by age, gender,
experience and other factors based on the technology implemented (Ghalandari, 2012). Study by
Lawrence (2011) pointed out that influence towards behaviour intention may be affected by gender as
males are found to be more influenced by use of technology than females. When age comes in then
young males are significantly influenced than older males and females. Performance Expectancy has
Page 41
31
positive influence towards behavioural Intention when referring to females because they care about
their performance.
When looking at effort expectancy, research studies indicated that age plays a major role in influencing
females to use the system. Young females who lack experience of using computers are found to have
less interest of learning and using technology when doing their work (Al-Shawakeh, 2014). Males are
willing to put extra effort to learn the system to overcome different constraints to their goal of using the
system. On the other hand, females tend to focus more on the level of effort needed and the time
involved to achieve the same goal (Venkatesh et al., 2012). More experience is considered to influence
behaviour to use the technology to make user to be comfortable to use the system (Foon & Fah, 2011).
Social Influence has more influence towards behaviour intentions especially on older employees. It was
discovered that the power of influence decrease with the gathering of experience of using the
technology (Ghalandari, 2012). The reason behind is that females care about other people’s opinions
when it comes to the usage of the system.
Facilitating conditions have significant impact on behavioural intentions when influenced by age,
gender and experience (Venkatesh et al., 2012). Literature indicated that older consumers tend to face
more challenges in processing new information which results in slow learning to use the technology
(Venkatesh et al., 2012). The difficulty is caused by decline in memory and concentration level
associated with growing older. Okiro and Ndungu (2013) mentioned that older consumers put more
emphasis on availability of support at all times. Men rely less on facilitating conditions when they use
the new technology as they like to explore new things (Opiyo, 2015). Females tend to place more
emphasis on the support provided. The reason behind this is that females want to be taught to acquire
skill to use the system. Males become less dependent on the support provided while female users with
less experience depended more on facilitating conditions to be able to use the system (Foon & Fah,
2011).
2.10 Summary of the Chapter
There is growing demand of technology and organisations are motivated to increase their budget on
investing on information system. Studies found that there is low rate of acceptance and usage which
require more research to enrich current knowledge about the factors that influence individuals to use
technology. Organisations that are embracing digital technology to reinvent their working environment
focusing on a range of business strategies and realising that without strong learning culture they will
not succeed (Global Human Capital Trend, 2016). The study focuses on the challenges faced by CBL
in implementing the HRIS across the human resources department. Understanding the challenges will
Page 42
32
help managers to divert their efforts towards the correct direction to be able to deal with problems that
are hindering the successful implementation of HRIS.
In the process of understanding the implementation of HRIS, literature was visited to provide
explanations on understanding the user behaviour in relation to acceptance and use the system to assess
the success or failure of implementing a new system. The purpose of this chapter was to visit relevant
literature to support or reject the research questions. At the same time, literature was used to strengthen
the arguments presented on why introduction of new technology could be a problem area concerning
behavioural intentions to use HRIS. The chapter discussed the role of HRIS in organisations, types of
HRIS and how organisations implemented the HRIS.
Several studies were visited to learn more on factors that affect the success and failure of implementing
the system in organisations. In this chapter it was noticed that many employees resist new technology
implementation because benefits are not clearly stated and systems are complex to understand.
The chapter provided a clear understanding of the role of user behaviour intentions to use the new
technology implemented with the idea of dealing with user acceptance. Discussions were made on the
importance of identifying factors influencing individuals’ behaviour to use the system. Understanding
the user’s behavioural intentions is important in the design and implementation of the new information
system. The literature on UTAUT was discussed and investigated to identify factors that influence
individual behaviour to accept the new HRIS to increase level of usage. UTAUT is relevant to the
implementation of new technology to predict and explain the user’s behaviour of accepting the system.
Different studies continuously showed that UTAUT is a new model that needs further validation and
more research is still required to test it further. The chapter mentioned that it is very important to identify
factors influencing individuals to use the system. As mentioned by Awan and Sarwar (2015)
understanding the users behaviour changes is very important in the designing and implementation of
the new information system. Managers can use the results from study to weigh the successful
implementation of the new technology and explain the user’s behaviour on the usage of the system.
Page 43
33
3. CHAPTER THREE- RESEARCH METHODOLOGY
3.1 Introduction
This chapter discusses the research design and methods that were followed to generate data for this
empirical study. Research is a systematic method used to describe what is not known and establish the
outcomes under a given set of conditions. It involves identifying gaps in knowledge, verification of
what is already known and identification of past errors and limitations (McMillan, 1996). Research
methodology is a tool used when conducting research to collect and analyse data which is aligned with
the research questions and objectives of the research. It explains how the research is going to be
conducted, the methods which are going to be used to collect data, the theory to be used and the data
analysis technique. The methodology chapter has to have a clear linking with the research problem to
ensure that appropriate recommendations and solutions are given (Kothari, 2004). In other words, the
purpose of methodology chapter is to facilitate the methods used to address the problem at hand. One
of the common mistakes found in research papers is that the proposed methodology do not achieve the
stated objective of the study undertaken which resulted in wrong choice of methodology (Kumar, 2005).
The research methods must be suitable to fulfilling the overall aims of the study. The study will ensure
that the methodology selected is large a sample size to be able to generalise and make recommendations
based upon the findings. The methodology should discuss the problems that were anticipated and the
steps undertaken to prevent them from occurring. For any problems that do arise, the researcher should
be able to describe the ways in which the problems will be minimised or why these problems do not
impact in any meaningful way the interpretation of the findings (Kumar, 2005).
The research methods selected on the study describes the rationale behind the application of a specific
techniques used to identify, select, and analyse information. The purpose is to understand the research
problem, to allow the reader to critically evaluate a study’s overall validity and reliability. Methodology
chapter answers the main questions of choosing the appropriate sampling method, data collection and
how such data was analysed. The chapter is divided into these sections: First it discusses the theoretical
approach along which the study articulates. Second it discusses the research approach used in
undertaking the study. Third point is the research design followed in undertaking the study. Fourth it
discussed the sampling procedure followed in selecting participants for this research. Fifth it discussed
the data collection used and procedure followed and lastly data analysis procedures.
3.2 Theoretical Paradigm
This research study uses UTAUT as the framework that guides the entire study. The theory assimilates
different elements across other user acceptance models and formulates a unique measure with core
Page 44
34
determinants of user behavioural intention and usage (Venkatesh et al., 2003). UTAUT is used to
identify factors that influence employees to accept the new technology implementation in organisations.
UTAUT is a useful tool that provides better evaluation for the success of implementing new technology.
The theory has been used to identify factors that are likely to influence employee behaviour to use the
system (Kim & Crowston, 2011).
UTAUT has been confirmed to be more accurate than other technology adoption theories in predicting
the success of the new technology introduced and help to understand the drivers behind the user
acceptance (Venkatesh et al., 2003). The theory explains the user’s intentions to use the technology and
their behaviours following the implementation of the new system. The study looked at the four
constructs in explaining the HRIS individual behaviour intentions and usage following the execution of
HRIS. On the variables, the study is going to adopt gender, age, experience from the original model
then replace voluntariness to use with training as the system is mandatory to use. The theory is going
to be tested at Central Bank of Lesotho to describe individual behaviour intentions and usage of the
system.
3.3 Research Approach
The study has adopted quantitative approach to provide a better explanation of the problem. Quantitative
approach provides a deeper understanding of the research problem at the same time assist in giving
solutions to the problems. Quantitative study concentrate on getting together statistical data and
generalise it across the population to explain a particular phenomenon (Kumar, 2005). It is about getting
people opinions in a structured way so that the researcher can produce hard facts and statistics as
guidance to finding solutions. The HRIS is an innovation at the Central Bank of Lesotho (CBL) to
replace the manual system. Quantitative method is appropriate for the study because it is going to
provide a measure of user behaviour from a statistical and numerical point of view. It will look at the
general features of a population to find factors that influence their behaviour following the
implementation of HRIS. It encourages further research to uncover more study and may also be able to
find an underlying cause of problems. Quantitative method is appropriate as the study will look at the
general features and characteristics of a population to find factors that influence their behaviour to use
the system. The study is aimed at establishing a clear understanding of employee’s behaviour intentions
following the implementation of HRIS.
The current study is going to employ positivist method to test UTAUT on CBL. Positivist method is
relevant to this study because it uses quantitative data to generate full insight information about the
phenomenon. Through positivist, the study will be able to generalise the results based on user decisions
about the system. Positivist is a term used to describe an approach to the study that relies on scientific
evidence to reveal the true picture of how people operate (Bhattacherjee, 2012). Positivist method aims
Page 45
35
at testing existing theory with the aim of finding out the truth about employees’ behavioural change
following the implementation of HRIS.
3.4 Research Design
Research design is a comprehensive plan of undertaking research project that is aimed at answering
research question or test the hypotheses. It creates the blueprint for data collection, measurement, and
analysis. The study has used a case study scenario to test the theory on the environment where the HRIS
was implemented and used. The study singled out Central Bank of Lesotho from other organisations
because they are using the system. Case studies gathers in depth information about a specific person,
group, community or event (Bhattacherjee, 2012). Case study is considered as a starting point for future
research because it guides the study to achieve something that may appear to affect only a select
population. Case study is used when there is new phenomenon introduced which is not known to the
population under study (Kothari, 2004). Human resources information system is a new concept at CBL
introduced in 2010. Case study is relevant to this study because it is going to provide descriptive
information to enable the Bank to find solutions to the problems of failure in the implementation
process. Case study is also useful for testing theories to establish whether they can work in the real
world (Bhattacherjee, 2012). By using quantitative data, case study will help explain both the process
and outcome of a phenomenon through complete observation and analysis of the cases under
investigation.
In addition, a descriptive research method was adopted in the study to describe the implementation of
HRIS in relation to change in user behavioural intention. The purpose was to expand our understanding
on the phenomenon. The study is useful to provide more information to elaborate on the theory to
predict the future perceptions and behaviour of Central Bank of Lesotho (CBL) employees on the
implementation of HRIS. Descriptive research is defined as an attempt to explore, explain and provide
additional information about a topic (Bhattacherjee, 2012). This is where research is trying to describe
what is happening in more detail, filling in the missing parts and expanding an understanding on the
topic. The study will provide guidance in identifying factors that influence user behaviour to establish
the success and failure of implementing the HRIS. There is limited usage of information systems at the
Central Bank of Lesotho especially in human resource division hence the need for this study to unfold
the issues of implementation and acceptance of HRIS. The descriptive research design will provide a
detailed description of the topic to enable the Bank to act appropriately in addressing challenges faced
during the implementation of the system.
Descriptive research is a statistical tool used to describe data and characteristics about the population
being studied (Bhattacherjee, 2012). In other words, descriptive research was used to describe the effect
of age, gender, and experience on the use of the system. The idea was to inform policy changes by
Page 46
36
demonstrating the existing problems and describing the challenges of acceptance to be able to explain
how things are and can provoke action to be taken. Descriptive research that is quantitative involves
collection of quantitative information that can be arranged in mathematical form to create basis for easy
interpretation. The statistical data describe categories of information in the analysis on the employee’s
interaction with the technology (Kumar, 2005). It was used to categories of demographic information
with different interaction of using technology in an organisational setting (Kothari, 2004).
3.5 Sampling Procedure
Sampling procedure is a process of selecting a number of individuals for a study in such a way that
those individuals represent the entire population under study (Kumar, 2005). The sampling procedures
should closely resemble the target population on all relevant characteristics. There are two major
sampling procedures in research namely; probability and non-probability sampling. The current study
has applied the probability sampling with the assumption that all the population have equal chance of
being selected to participate on the study. Probability sampling is appropriate for this study because it
is going to enable the researcher to estimate the extent to which findings based on the selected sample
reflect the true picture of the entire population. It will be easy to generalise the results obtained to a
larger group. Probability sampling is intent not to describe particular individuals’ behaviour who, by
chance, are part of the sample, but rather to obtain a generalised behaviour of the population of interest
(McMillan, 1996).
Probability sampling is useful for studying units of both similar and different samples within a group.
On the probability sampling selection is not done haphazardly by people who may wish to participate.
The selection is done systematically by giving each person in the population an equal opportunity to
participate. Probability sampling has different methods of selecting participants. The study has used
simple random sampling methods to select participants to the study. Simple random sampling is a
method where every individual in the population has equal opportunity of being chosen (Kumar, 2005).
The random selection limits the possibility of bias in selecting the sample. The sampled population was
divided in two groups of males and females. Simple random sampling can be used on studies that focus
on individuals with similar characteristics or traits. The similarity on the characteristics is the fact that
all employees in the Central Bank of Lesotho are users of HRIS and they interact with the system at
different levels. Human resources officers are database administrators and users at the same time. They
are responsible for ensuring that all users have access and information to use the system. They perform
this task by understanding what is needed from an HR process point of view and translating it into a
simple language understood by every user. Human resources officers manage the payroll, leave
management and employee service systems. Information system technicians are responsible for
providing technical services to ensure that the system is usable and updated for all users. All employees
Page 47
37
are users of self service system. They use it to obtain their personal information, payslips and apply for
leave.
The study has adopted Krejcie and Morgan (1970) table in determining the sample size for this study
which is stipulated as hundred and sixty-nine (169) for the population of three hundred (300).
Employees were selected from all hierarchy levels available at the Bank categories from managers and
employees. Managers’ levels comprise of heads of departments, head of divisions, and heads of
sections. The total of thirty seven (37) questionnaires was distributed to managers out of seventy three
managers (73). There are nine (9) heads of departments and five (5) questionnaires were distributed.
The Bank has got a total of twenty four (24) heads of divisions and forty (40) heads of sections. The
questionnaire was given to twelve (12) heads of divisions and twenty (20) heads of sections. The
respondents were randomly selected by using stickers with numbers from 1 to 73 and the respondents
with the odd numbers were selected to make the total of thirty seven (37). Employees were randomly
selected from the levels of professionals, sub professionals and general services as described under the
structure of the Bank. One hundred and sixty-nine (169) questionnaires were circulated to employees
of CBL. Simple random sampling was used to selected participants to the study. Employees were given
numbers from one up to three hundred (300) and the selection was made from each department. The
organisational structure of the Bank has heads of departments consisting of Governor, Deputy
Governors and Directors. The next level is Heads of division then heads of sections and finally
professional level and lower level called general services employees. The first seventy three (73)
numbers were given to managers and the remaining two hundred and twenty seven (227) were
distributed to other members of staff to make the total number of 300. Out of one hundred and sixty-
nine (169) questionnaires distributed only one hundred and thirty-four (134) responded.
3.6 Data Collection Tools and Techniques
The study will use the primary data which will be collected through questionnaires administered to 169
employees. The questionnaires will be adopted from the original UTAUT consisting of closed
questions.
3.6.1 Questionnaire
The study used questionnaire as the main tool for generating data for this study. In this case study,
scenario questionnaires were used to gather information. The study questionnaire consisted of two
sections. The first section related to demographic data consisting of question on gender, education, age,
level of position and working experience. The first section is the extended component of the model
being tested that the researcher decided to include in testing the behavioural intention and usage of the
system within the bank.
Page 48
38
The second part consists of UTAUT questions on the constructs. UTAUT is used to carry out expert
questionnaire investigation to investigate in depth the issue of behaviour changes on the acceptance of
HRIS. The questionnaire of this study was modified from the question items of Venkatesh et al. (2003).
The questionnaire was developed to suit the study and pilot test was done to thirty-five (35) employees
to iron out minor issues before it can be circulated to a larger group.
3.7 Validity and Reliability
Reliability is explained as the degree to which the data collection tools used yields consistent findings
like the conclusions made by other studies using similar methods. On other hand validity is defined as
the degree to which the research tools are accurate in measuring what it is intended to measure (Kothari,
2004). The validity of the questionnaire was done by involving statistician to check the how well the
theory constructs is represented in the questions. The expert was expected to look at the items of the
questionnaire and advise if the questionnaire is valid measure of the proposed model. To measure the
reliability the pilot test was undertaken on the same employees that were sampled.
3.8 Data Analysis Procedure
The nature of this research which is purely quantitative needed a scientific approach in understanding
behavioural change of individuals using the HRIS. As such, certain scientific analysis packages were
used including SPSS to analyse the data collected. In addition, other analytical tools were applied in the
study in understanding the behavioural pattern of employees using the HRIS. Further, specific
interpretation was made based on this behavioural pattern.
3.8.1 Software Package
In organising data all questionnaires distributed were checked for completeness and accuracy. SPSS
software did interpretation of data to give the meaning to the data collected. SPSS software analysed
data to produce tables and graphs to interpret and give meaningful information to be used to make
recommendations on the study. Frequency distribution tables were used to describe percentage of
employees looking at age, experience, level of position and training acquired during the implementation
of the system. The SPSS has different statistical tools to analyse data. On the study, the following tools
were used, descriptive statistics, Chi-square goodness of fit test, regression analysis, and one sample t-
test.
Data collected was analysed by SPSS software to provide statistical analysis regarding the
implementation and acceptance of HRIS. SPSS is widely used software that produces statistical
analysis of quantitative data. Quantitative data analysis was performed to make sense of the umbers to
document meaningful interpretation of information collected. Statistical analysis is meant to establish
Page 49
39
any significance on the results pertaining to acceptance or rejection of a system. Descriptive analysis
was used to describe and interpret the collected information. The aim was to summarise the sampled
data to be able to learn about the entire population. SPSS is a system that used to perform data entry
and analysis to create tables and graphs. SPSS is capable of handling large amounts of data and can
perform all the analyses covered in the text and much more. On the study SPSS was chosen because it
is the software which is simple to use and it is familiar to most researchers. SPSS was used because it
can generate reports, charts, descriptive statistics, and complex statistical analysis which are useful to
analyse the data and interpret it to suit the current study.
3.8.2 Descriptive Statistics
Descriptive statistics was adopted to offer summarised information of the data on the study. It was used
to display the simple summaries on the sampled data and produce graphic analysis (Bhattacherjee,
2012). Descriptive statistics is important because it provided the summary of the number of employees
who are males and females, age of employees, education, position level and experience. Descriptive
statistics was broken down into measures of central tendency which include the mean. The aim of using
the measures of central tendency was to understand the data set by getting a representative of the sample.
The mean minimises error in predicting the value in data set and it is the value that produces the lowest
error on the data presented (Kumar, 2005). On the study descriptive statistics included were the means
and standard deviations, where applicable together with frequencies represented in tables or graphs.
Descriptive statistics often use visual aids such as graphs and charts to help the reader in understanding
the data distribution (Bhattacherjee, 2012). The descriptive statistics is useful on the study because it
was easy to extract the import raw data to be translated into to manageable information to be analysed.
The data was analysed using frequency tables as a simple way of displaying the number of occurrences
in every question. The entries on each table contain the frequency of occurrences of values within a
certain group and in that way the tables summarised distribution in the sample. The data from the SPSS
was displayed in a bar chart so that the information can be interpreted more easily. Bar charts were used
to display and compare the number, frequency, and other measures such as a mean for different
categories of data collected.
3.8.3 Inferential Statistics
Inferential statistics will be used to analyse data to allow the researcher to make judgments of the results
presented. The use of inferential statistics was used to make proper interpretation from the data to be
generalised to the entire population. The test to be used includes the one sample t-test, Chi-Square-
Goodness-of-Fit-Test, Regression Analysis, and analysis of Variance (ANOVA).
3.8.3.1 One-Sample t-test
The questionnaire was developed using Likert agreement scale therefore one-sample t-test was applied
to test for significant agreement/disagreement on the data collected. One-sample t-test is used if your
Page 50
40
data passes four assumptions for it to give valid results. The test is relevant to the study because we are
testing four constructs under the UTAUT. The one-sample t-test was used to determine whether a
sample comes from a population with a specific mean. In most cases the population mean is not always
known but hypothesised. You need to do this because it is only appropriate to use a one-sample t-test if
your data "passes" four assumptions that are required for a one-sample t-test to give you a valid result.
In practice, checking for these four assumptions just adds a little bit more time to your analysis,
requiring you to click a few more buttons in SPSS Statistics when performing your analysis, as well as
think a little bit more about your data, but it is not a difficult task
3.8.4 Chi-Square-Goodness-of-Fit-Test
Chi-square goodness-of-fit-test was adopted to analyse data on a variable to test whether any of the
response options were selected significantly more or less than others (Bhattacherjee, 2012). The study
applied the chi-square goodness of fit test to determine difference between the sample frequencies and
the expected frequencies specified when looking at the usage of the system.
The term goodness of fit is used to test the sample distribution whether it fits with the expected
probability distribution (Kothari, 2004). It explains whether the sample data represents the data
expected to be found in the actual population. In Chi-Square goodness of fit test, sample data is divided
into intervals. Then the numbers of points that fall into the interval are compared, with the expected
numbers of points in each interval. It was applied to determine whether the distribution of employees
in a single categorical variable such as gender follows a known or hypothesised distribution. The
distribution is known as usage of HRIS by employees. The proportion of cases expected in each group
of the categorical variable can be equal or unequal. In determining the significance level, often
researchers choose significance level equal to 0.01, 0.05, or 0.10; but any value between 0 and 1 can be
used (Kumar 2005).
3.8.5 Regression Analysis
Regression analysis involves one or more independent variables that best predict the value of the
dependent variable (Kothari, 2004). It is a process of approximating the interactions between variables.
It is used to investigate the influence of age, gender, experience, and training on the four constructs of
UTAUT as dependent variables.
In addressing the objectives in the study, analysis was done to verify the relationship between the
constructs on the intention to use and usage behaviour. Straight analysis was performed to investigate
whether gender, age, experience or training has a moderating effect on the effect of the independent
variables (IV). To test the effect of the IV on the DV, regression analysis was used. All checks were
carried out to ensure that conditions for this test are met.
Page 51
41
3.8.6 ANOVA
ANOVA is a basis for tests of significance. In this study, it was used to determine whether there are
any significant differences among the dependent variables and independent variables of the UTAUT.
3.8.7 Construct Analysis
In analysis of the constructs the study looked at getting single measures which can be used to test all
the constructs. Cronbach’s alpha was used to test whether combining the items from each question can
yield a reliable measure for that constructs. Cronbach’s alpha was used on the likert questionnaires that
form a scale to determine reliability. The table used in the analysis was the reliability statistics table
that provides the actual value for Cronbach’s alpha. An alpha value of >.7 indicate reliability of
measure. In this study, it is used to assess the reliability and internal consistency of the constructs. In
other words, the reliability of any given measurement refers to the extent to which it is a consistent
measure of a theory, and Cronbach’s alpha is one way of measuring the strength of that consistency.
Internal consistency describes the extent to which items in a test measure what is expected, hence
connected to the inter-relatedness of the items within the test (Bhattacherjee, 2012). Internal consistency
should be determined before a test can be done to ensure validity of the measurement. In addition,
reliability estimates show the amount of measurement error in a test (Tavakol and Dennick, 2011).
3.9 Ethical Consideration
To ensure confidentiality the study recognised the need to exercise care in that the rights of individuals
and institutions were safeguarded. Approvals were sort from all relevant institutions and participants
that were participating on the study. Trueness was important throughout the study in ensuring that the
information was handled with care and confidentiality. The data and the conclusions reflected the reality
of the current situation at Central Bank of Lesotho. This study was dealing with people and their
opinions, which calls for respect and integrity (McMillan, 1996). None of the employees were
mentioned by name and all respondents voluntarily agreed to be used in the study. The study’s aim is
to solve a problem and benefit both users and management at the Bank, and add knowledge to research
area of IT acceptance and usage. The risks involved in this study were low, as the respondents were
anonymous and the topic was not imposing any risk to them.
All respondents were given informed consent forms to fill whereby they were given the alternative to
withdraw at any time. Anonymity was guaranteed and that the results of the study would be presented
to the management of the Bank for transparency. Analysing and interpreting the data also encompassed
ethical issues, whereby permission was asked to contact the respondents again if anything was unclear
or the possibility of making a debriefing session. The questionnaires were kept and stored with the
supervisor for safe keeping. To ensure confidentiality the study recognised the need to exercise care in
Page 52
42
identifying that the rights of individuals and institutions are safeguarded. Approval was sort from
Central Bank of Lesotho and participants were given consent letter to participate in the research.
3.10 Limitations
The study is not a longitudinal study, meaning it is not going to run for longer time. The focus was to
understand employee’s behaviour to be able to establish factors that influence continuation or
discontinuation of the use of the system after the implementation of the HRIS. The study was not
investigating other phases of the system development life cycle (SDLC) rather than implementation and
maintenance phases. Due to some constraints of time and resources the study was narrowed down to
only two phases mentioned.
The availability of time hinders the researcher to investigate the research problem in detail over time
due to the deadline of the research. There was too much work involved on the data collection which
required extra time to revisit employee usage over longer period. Only examined the organisation for
few months, one should take into consideration that conducting the same study six months later might
give another result as the users gain more experience and new users will be added. Future study can be
done to focus on usage of HRIS for longer period to able to investigate behaviour change over a longer
period.
The study was undertaken in an environment where there is limited usage of information technology
(IT). This situation resulted in the limited access to information from respondents during the study. This
resulted in restricted sample size and a limited response rate because HRIS is a relatively new
phenomenon in Lesotho and subsequently, a limited number of organisations have implemented the
system including CBL. The target population thus constituted only CBL staff.
Case studies is restricted to only the target population, therefore the results and conclusions found
cannot be applied to the other population that was not under investigation. The study was concentrating
only on employees of the Central Bank of Lesotho as a target population, therefore, the results will only
be narrowed down to the Bank not any other places that may be using the same system. Nonetheless,
the population under study has similar characteristics which can allow generalisation of the results to
represent the entire population in the Bank.
3.11 Summary of the Chapter
Research methodology is the process used to collect information and data for making relevant business
decisions supported by investigations. The methodology chapter entails, research statistical tools and
way of analysing data to make informed recommendations and conclusion about the study. A well
Page 53
43
conducted probability sampling enables the researcher to gather information from a relatively small
number of a large population and accurately generalise the results to the entire population. Research
methodology is systematic way of finding solutions to the research problem. The strength of this study
depends on the reliability of collected data and analysis.
The study adopted the case study approach to enable the study to go beyond the quantitative statistical
results to understanding of the behavioural conditions through the research. The quantitative method
was used to test the UTAUT. The quantitative data is useful in measuring and explaining data in a
simplified scientific manner. The measurement of the quantitative approach is reliable, valid, and
generalisable to be used to make appropriate recommendations. Because the data was presented in a
numeric form, statistical tests were used to make analytical statements about the data collected. These
include descriptive statistics like the mean, standard deviation and inferential statistics like t-tests and
ANOVAs.
As a mechanism for obtaining information questionnaires were used to collect data. Questionnaires are
effective mechanisms for efficient collection of quantitative information. There is uniformity in the use
of questionnaires because all respondents receive the identical questions with closed format questions
together with responses that are standardised to enable easy interpretation of large numbers of
respondents.
Descriptive statistics yield reports on the measures of central tendency, variation, and correlation. The
combination of these tools summarised data to enable the study to answer the research questions.
Probability sampling method was adopted as a procedure for selecting sample members from a
population to give equal opportunities to all employees of being chosen.
The internal consistency was applied on the Construct to ensure that they reflect the true theoretical
meaning of the concepts on the UTAUT model. Data was handled in such a way that it is consistent
over time and represent the total population under study. Validity was demonstrated by use of constructs
to ensure that measurements are accurate and are measuring what they are intended to measure.
Page 54
44
4. CHAPTER FOUR-PRESENTATION OF RESULTS
4.1 Introduction
This chapter is going to discuss and analyse and findings of the data collected from the questionnaires.
Descriptive analysis was chosen to analyse the data collected. Frequency and percentages were
calculated for each variable. The chapter will present an overview of the data collected in relation to
four objectives developed which are as follows:
a) To determine whether implementation of HRIS has improved employees’ performance in the
bank.
b) To ascertain how individual employee’s effort has influenced their behavioural intentions to
use HRIS.
c) To establish how social influence have influenced the employee’s behaviour in using the
HRIS.
d) To find out whether the bank has created facilitating conditions for the HRIS implementation.
4.2 Overview of the Research Questionnaire
The questionnaire was developed and distributed to Central Bank of Lesotho employees. The
questionnaire was distributed my email and some hand delivered. It was submitted with the letter
explaining the aim of the study, the ethical consideration of the research and contact information of the
supervisor. The questionnaire consisted of two parts comprising of demographic information and
UTAUT multiple choice questions. The questionnaire collected information about the human resources
information system usage and behaviour intention following the implementation of the system by
Central of Bank of Lesotho. Four UTAUT constructs were measured using five likert scales. There
additional questions that were included to gain better understanding about the subject matter. The
questions were individual usage, training and behaviour intentions. The response was ordered from 1=
strongly disagree, 2= disagree, 3= neutral, 4= agree, 5= strongly agree.
Population was divided into different groups with the same characteristics based on the gender,
education, positions and working experience. The population was randomly selected within each
category. The Bank has three hundred (300) employees as shown in Table 4-1. To ensure that the
questionnaires were distributed in an equal proposition between male and female, it was shared between
one hundred and sixty-five (165) are males and one hundred and thirty-five (135) females. Out of one
hundred and sixty-nine (169) questionnaires, seventy (89) were given to male employees while eighty
(80) were distributed to females.
Page 55
45
Positions Level Number of employees Number randomly
selected
Heads of Department 9 5
Heads of Division 24 12
Heads of Sections 40 20
Professional 108 70
Sub Professional 85 48
General Services 34 14
Total 300 169
Table 4-1: Total number of employees at CBL.
4.3 Data Management
The pre-analysis data screening was undertaken on the raw data before the full analysis was performed.
The screening was conducted to alleviate the incorrect findings and results (Bhattacherjee, 2012). It is
important that before the data is analysed the screening is performed to investigate the accuracy of the
data collected, to identify the extreme cases to be able to fix them and lastly, to manage and identify
missing information It is important that before the data is analysed the screening is performed to
investigate the accuracy of the data collected, to identify the extreme cases to be able to fix them and
lastly, to manage and identify missing information (Kothari, 2004). The purpose of pre-analysis
screening was to ensure that any missing data or any abnormalities identified are discussed in detail and
rectified on time.
The questionnaire was circulated for two weeks starting from the 14th February 2017 to 28th February
2017. The total of one hundred and thirty-four (134) out of one hundred and sixty-nine (169)
questionnaires were returned. The response rate was 78% which is considered good (McMillan, 1996).
A possible explanation for the questionnaires that were not returned might be that people were tired of
answering questions with no incentive attached to them. Another possible explanation for this is that
those who do not like the system did not want take time to answer questions about it.
The other issue that was identified was that some questions were not answered. Missing data is a barrier
in data analysis because they can have a significant effect on the conclusions that can be drawn from
the data. Missing data occurred because there was no response given to certain questions. The important
step undertaken was that all incomplete answers were identified and recorded to form part of the
analysis as shown in Appendix B.
Page 56
46
4.4 Demographic Information
Demographic information was presented using figures as a summary of data collected. The information
displayed included gender, age, educational qualifications, position levels and working experience of
the respondents shown on the frequencies summary by percentages to illustrate demographic
information response.
Figure 4 - 1 Demographic Information Summary
Figure 4 - 2 Position level and Working Experience Summary
The questionnaires were completed by one hundred and thirty-four (134) respondents out of one
hundred and sixty-nine (169) distributed. The responses were from sixty-six (66) males and sixty-eight
(68) females. The descriptive analysis was performed on demographic information to summarise the
data to produce the frequency of occurrence and percentage as shown on appendix A attached.
4.4.1 Gender
As indicated in Figure 4.1, 49.3% of respondents were males and 50.7% were females. The response
rate is considered satisfactory as half of the population was involved in the study.
,0
50,0
100,0
Mal
e
Fem
ale
21
-30
31
-40
41
-50
51
+
Som
e/al
l sch
oo
ling
Dip
lom
a
Deg
ree
Po
st g
rad
uat
ed
egr
ee
Un
spe
cifi
ed
Gender Age Education
49,3 50,7
4,5
53,7
26,115,7 11,9 19,4
31,3 36,6
,7
Pe
rce
nta
ge
,05,0
10,015,020,025,030,035,040,0
Hea
d o
f d
epar
tmen
t
Hea
d o
d d
ivis
ion
Hea
d o
f se
ctio
n
Pro
fess
ion
al
Sub
pro
fess
ion
al
Ge
ner
al s
ervi
ces
< 1
ye
ar
1 -
<5
yea
rs
5 -
<1
0 y
ears
10
- <
15
yea
rs
15
+ ye
ars
Position Experience
1,5
11,9 14,2
35,8
17,2 19,4
1,5
19,4
36,6
18,723,9
Pe
rce
nta
ge
Page 57
47
4.4.2 Age
On the age distribution in Figure 4.1, the data indicated about half of the respondents aged 31-40 with
53.7%. The second highest group were respondents aged 41-50 with 26.1%. The percentage of older
respondents of the age of 51 and above was 15.7% while the youngest aged of 21-30 was 4.5%. Looking
at the age distribution, it is worth noting that the Central Bank of Lesotho majority of employees are
older than 30 years which can be very significant on the study when testing the UTAUT.
4.4.3 Education
As shown in Figure 4.1 majority of respondents have got postgraduate degree at 36.6% and degree at
31.3%. About 19.4% are employees with diploma qualification while 11.9% have attended other
schools below diploma. Finally, 7% of the respondents did not specify their education level.
4.4.4 Position
Figure 4.2 reveals that the highest percentage of 35.8% is respondents holding positions at professional
level. These are employees with degree qualifications together with those with diploma who were
promoted because of long service with the Bank. The next level are general services and sub
professionals with the percentage of 26% and 23% respectively. 1.5% were heads of department, 11.9%
were heads of division and lastly heads of sections with 14.2%.
4.4.5 Experience
Figure 4.2 indicated that highest percentage of respondents of 36.6% who have 5-10 years of working
experience followed by 23.9% which are employee with more than 15 years working experience and
last but not least is 19.8% for employees with working experience of one year and less than five and
18.7% are respondents with 10 year and less than fifteen years working experience. The lowest
percentage of 1.5% respondents have less than one year of service.
4.5 Analysis of UTAUT
All constructs were measured using five Likert scale following the response order of 1=strongly
disagree, 2=disagree, 3=neutral, 4=agree and 5=strongly agree. The first analysis that was made was to
test the level of agreement verses disagreement on the constructs. The t-test was applied on each
construct using relevant questions adopted from the original UTAUT model. Appendix B provided the
descriptive analysis performed on each construct. The t-test was used to test the significant level of
agreement and disagreements in each construct. The output from the t-test was summarised in a form
of a one sample statistics for each question as shown in Appendix B attached. The output from the t-
tables shows the summary statistics of each question. Each question was summarised to show the
number of respondents (N), the mean, standard deviation, and lastly standard error mean. The mean of
Page 58
48
greater than three (>3) signifies agreement with the statement and the mean of less than three (<3) show
a significant disagreement with the statements.
One sample t-test tables were used to determine the significant difference between agreement and
disagreement on the Likert agreement scale. One-sample t-test looks at whether the mean of data from
one group is different from a value specified. All significant values (these are the p-values) are <.05
and therefore significant. To see if values are significant agreement or disagreement we look at the
value of the mean for each construct as displaced on the one sample statistics tables as per attached
appendix B. From the one-sample test the t value is calculated by dividing the mean difference by
standard error of the sampling distribution of differences.
Degrees of freedom (df) are calculated by adding the sample size. SPSS uses the df value to calculate
the exact probability that a value of t is as big as the one obtained. This could occur if the null hypothesis
were true. SPSS also used the two tailed when no prediction was made about the different groups. In
terms of the data presented the SPSS has already calculated the significant value of t and df respectively.
The confidence interval tells us about the boundaries within which the true mean difference is likely to
lie. The key interest is whether the significant two tailed value is greater or less than .05.
4.5.1 Performance Expectancy (PE)
Appendix B shows the frequency tables for five statements that were measuring the influence of
performance expectancy on behaviour intentions and use behaviour. The statements are summarised by
the one sample test below that shows the respondents agreement or disagreement with the statements.
Test Value = 3
95% Confidence
Interval of the
Difference
t df
Sig. (2-
tailed)
Mean
Difference Lower Upper
6.1 The system is useful to accomplish
certain tasks for one’s job
17.966 130 .000 .962 .86 1.07
6.2 Using the system enables tasks to be
completed more quickly
18.064 130 .000 1.008 .90 1.12
6.3 Using the system increases
productivity
13.804 131 .000 .886 .76 1.01
6.4 The system makes work more
interesting
13.008 130 .000 .794 .67 .91
6.5 Tasks can be completed with greater
efficiency when using the HRIS
17.442 128 .000 1.016 .90 1.13
Page 59
49
Table 4-2: One-Sample Test- Response on Performance Expectancy Construct.
Table 4-2 show the one sample test for performance expectancy construct. The construct has got five
statements where respondents were supposed to agree or disagree. In all the statements, there is
significant agreement that the system is useful to accomplish certain tasks. This is indicated by the value
of (t (130) = 17.966, p<.0005, together with 18.064, p<.0005 which agreed that using the system enable
tasks to be completed more quickly and the value of 13.008, p<.0005 that denote that the system makes
work more interesting. All the statements show significant agreement that performance expectancy has
positive influence on behaviour intentions to use HRIS.
Figure 4 - 3: Performance Expectancy Mean Distribution
Figure 4-3 indicates that the respondents agree that using the system assist them to perform their work
faster. The value of the mean of greater than three (>3) is a symbol of strong agreement that performance
expectancy has significant influence on the users’ behaviour intentions to use HRIS. This supports the
first objective that the implementation of HRIS has improved employees’ performance in the bank
because the respondent’s feedback was positive in relation to the performance expectancy construct. As
explained by literature performance expectancy refers to the ability to get significant rewards after using
the system. The results have emphasised that performance expectancy has a strong effect on behaviour
intention.
1
2
3
4
5
6.1 The system is useful to accomplish
certain tasks for one’s job
6.2 Using thesystem enables
tasks to becompleted more
quickly
6.3 Using thesystem
increasesproductivity
6.4 The systemmakes work
more interesting
6.5 Tasks can becompleted with
greaterefficiency whenusing the HRIS
3,96 4,01 3,89 3,79 4,02
Dis
agre
em
en
t
Agr
ee
me
nt
Page 60
50
4.5.2 Effort Expectancy (EE)
Appendix B shows the frequency tables for six statements that were measuring the influence of effort
expectancy on behaviour intentions to use HRIS. The statements are summarised by the one sample test
below that shows the respondents agreement or disagreement with the statements.
Test Value = 3
95% Confidence
Interval of the
Difference
t df
Sig. (2-
tailed)
Mean
Difference Lower Upper
6.6 Interaction with the system is clear and
understandable
11.255 131 .000 .742 .61 .87
6.7 It is easy to become skilful at using the
system
7.712 132 .000 .549 .41 .69
6.8 The system is easy to use 6.809 131 .000 .515 .37 .66
6.9 Learning to operate the system is easy 7.208 131 .000 .523 .38 .67
6.10 I have the confidence to use HRIS at
work
7.894 132 .000 .579 .43 .72
6.11 I have the knowledge to use HRIS 6.473 127 .000 .492 .34 .64
Table 4-3: One-Sample Test Response on Effort Expectancy Construct.
Table 4-3 showed that there is a significant agreement that individual interaction with the system is
clear and understandable. This is reflected by (t (131) = 11.255, p<.005, the response indicates that the
respondents agree with statements that it is easy to become skilful at using the system and they have
confidence to use the system. The significant value in all the statements is <.0005 therefore significant.
In all the six questions under the effort expectancy the respondents accept that the system is user friendly
and easy to use.
Figure 4 - 4 Effort Expectancy Mean Distribution
1
2
3
4
5
6.6
Inte
ract
ion
wit
h t
he
syst
em
iscl
ear
an
du
nd
ers
tan
dab
le
6.7
It is
eas
y to
bec
om
e s
killf
ul a
tu
sin
g th
e s
yste
m
6.8
Th
e sy
stem
isea
sy t
o u
se
6.9
Le
arn
ing
too
per
ate
th
esy
stem
is e
asy
6.1
0 I
hav
e th
eco
nfi
de
nce
to
use
HR
IS a
t w
ork
6.1
1 I
hav
e th
ekn
ow
led
ge t
o u
seH
RIS
3,74 3,55 3,52 3,52 3,58 3,49
Dis
agre
em
en
t
Agr
ee
me
nt
Page 61
51
The value of the mean of >3 shown in appendix B is an indication of strong agreement that effort
expectancy has significant influence on the users’ behaviour intentions to use HRIS. Figure 4-4 shows
the value of the mean that is greater than three (>3). This significant agreement ascertains that effort
expectancy has influence over the behaviour intentions to use HRIS. Literature indicated that effort
expectancy has significant in shaping individuals behaviour intention to use the technology (Akbar,
2013).
4.5.3 Facilitating Conditions
Test Value = 3
95% Confidence
Interval of the
Difference
t df Sig. (2-
tailed)
Mean
Difference Lower Upper
6.12 The HRIS system is compatible
with other systems I use
6.892 131 .000 .477 .34 .61
6.13 A specific person is available for
assistance with system difficulties
9.792 133 .000 .769 .61 .92
6.14 I can call somebody for help if I get
stuck
11.466 133 .000 .866 .72 1.02
6.15 The organisation supports the use
of the system
6.089 131 .000 .470 .32 .62
6.16 There are sufficient resources to
support smooth implementation
3.038 127 .003 .227 .08 .37
6.17 There is sufficient technical
expertise to give support to the users of
HRIS
4.400 130 .000 .313 .17 .45
6.18 Availability and reliability of the
internet connection is adequate for the
successful use of HRIS
6.043 132 .000 .526 .35 .70
Table 4-4: One Sample Test- The response on the availability of support to use HRIS
As shown in Table 4.4 there is a significant agreement that the bank has created facilitating conditions
for the HRIS implementation. Based on the data there is significant agreement that there is somebody
available to call for help if people get stuck on the system (t (133) = 11.466, p<.005. It is worth noting
Page 62
52
that 127 respondents have the lowest p=.003 which denotes that the resources are not sufficient enough
to support the smooth implementation of the system. Statement 6.16 has a significance of 003 which
show that respondents do not agree that there are sufficient resources to support smooth implementation.
Figure 4 - 5: Facilitating Condition Mean Distribution.
The value of the mean of >3 shown in the appendix B indicate a strong agreement that the bank has
created facilitating conditions for the HRIS implementation. The response is slightly above the rating
of 3 which is a positive reflection of significant agreement with the statements presented. As shown by
Figure 4 - 5 the respondents mean is slightly above 3 for five questions which were answered above.
The last two questions have 3.23 and 3.31 respectively. The agreement with the statements is an
indication that the system respondents believe that facilitating conditions have significant influence on
the users’ behaviour intentions and use of HRIS.
1
2
3
4
5
6.1
2 T
he
HR
IS s
yste
m is
com
pat
ible
wit
h o
ther
syst
ems
I use
6.1
3 A
sp
eci
fic
pe
rso
n is
avai
lab
le f
or
assi
stan
ce w
ith
syst
em d
iffi
cult
ies
6.1
4 I
can
cal
l so
meb
od
y fo
rh
elp
if I
get
stu
ck
6.1
5 T
he
org
aniz
atio
nsu
pp
ort
s th
e u
se o
f th
esy
stem
6.1
6 T
he
re a
re s
uff
icie
nt
reso
urc
es
to s
up
po
rtsm
oo
th im
ple
me
nta
tio
n
6.1
7 T
he
re is
su
ffic
ien
tte
chn
ical
exp
erti
se t
o g
ive
sup
po
rt t
o t
he
use
rs o
f H
RIS
6.1
8 A
vaila
bili
ty a
nd
relia
bili
ty o
f th
e in
tern
etco
nn
ecti
on
is a
de
qu
ate
fo
r…
3,483,77 3,87
3,473,23 3,31
3,53
Dis
agre
em
en
t
Agr
ee
me
nt
Page 63
53
4.5.4 Social Influence
Test Value = 3
95% Confidence
Interval of the
Difference
T df Sig. (2-
tailed)
Mean
Difference Lower Upper
6.19 My colleagues think that I should use
the system
12.991 132 .000 .752 .64 .87
6.20 My supervisor thinks that I should
use the system
13.734 133 .000 .769 .66 .88
6.21 Senior management encourage me to
use the system
6.434 132 .000 .474 .33 .62
. Table 4-5: One-Sample Test Response on Social Influence Construct
As shown in Table 4.5 there is significant agreement with the statements that social influence has
significant influence on users’ behaviour intentions and use of HRIS. The value of t (132) = 13.734,
p<.0005 shows that there is a strong believe that supervisor believe that users should use the system.
Hundred and thirty-two (132) respondents indicated that their colleagues think that they should use the
system. On the last statement 132 respondents indicated that senior management encourage them to use
the system with the value of t = 6.434
Figure 4 - 6: Social Influence Mean Distribution.
The value of the mean that is greater than three (>3) shown in appendix B is an indication of strong
agreement that social influence have significant influence on employee’s behaviour to use the HRIS.
indicates that colleagues, supervisors, and senior management can influence individual to use HRIS.
There is positive response that social influence has positive influence in behaviour intentions to use
HRIS.
1
2
3
4
5
6.19 My colleaguesthink that I should
use the system
6.20 My supervisorthinks that I should
use the system
6.21 Seniormanagement
encourage me to usethe system
3,75 3,77 3,47
Dis
agre
em
en
t
Agr
ee
me
nt
Page 64
54
4.6 Dependent Variables to the Model
4.6.1 Behaviour Intention
Test Value = 3
95% Confidence
Interval of the
Difference
t df Sig. (2-
tailed)
Mean
Difference Lower Upper
6.22 It is my intention to use HRIS for work
activities wherever applicable
20.186 132 .000 1.120 1.01 1.23
6.23 I plan to increase my usage of HRIS 16.705 131 .000 1.045 .92 1.17
6.24 I intend to use HRIS as much as possible
for work activities
15.573 131 .000 1.038 .91 1.17
Table 4-6: One Sample Test- Indicating the respondents’ intention to use HRIS.
As shown in Table 4-6 there is significant agreement with the statements that the respondents have
high intentions of using the system. Hundred and thirty-two respondents indicated that they intend to
use HRIS to do their work whenever is applicable. The value of t (132) = 20.186, p<.0005 shows that
there is significant agreement that users intent to use the system when needed. The respondents plan
to increase their usage of the system as indicated by the t (131) = 16.705 and lastly users intent to use
the system as much as possible with value of t (131) = 15.573.
Figure 4 - 7: Behaviour Intention - Mean Distribution
The value of the mean of greater than three (>3) shown in figure 4.6 demonstrated a significant
agreement with behaviour intentions to use the system. This indicated that the respondents were positive
that they are going to increase their use of the system. The mean of >4 is a good indicator that the
respondents are going to increase their usage of the system.
12345
6.22 It is my intentionto use HRIS for workactivities wherever
applicable
6.23 I plan to increasemy usage of HRIS
6.24 I intend to useHRIS as much aspossible for work
activities
4,12 4,05 4,04
Dis
agre
em
en
t
Agr
ee
me
nt
Page 65
55
4.6.2 Intention to Use
Figure 4 - 8: Intentions to Use Mean Distribution
The value of the mean of greater than three (>3) shown in figure 4.7 illustrated a significant agreement
with behaviour intentions to use the system. The response in Figure 4.8 indicated that the respondents
have good intentions to use the system. The rating of the mean above 4 demonstrates an agreement that
users have intentions of using the system.
Test Value = 3
95% Confidence
Interval of the
Difference
t df Sig. (2-
tailed)
Mean
Difference Lower Upper
6.25 I use HRIS daily when I do my work -3.539 132 .001 -.331 -.52 -.15
6.26 I have been using the system regularly in
the past months
-.794 131 .428 -.076 -.26 .11
Table 4-7: One Sample Test Present Usage Behaviour.
Table 4-7 demonstrates significant disagreements when looking at present usage behaviour. Statement
6.15 shows significant disagreement that the respondents use the system daily when they do their work.
Statement 6.26 indicates neither significant agreement nor significant disagreement. This shows that
some respondents use the system while others do not use the system.
1
2
3
4
5
6.22 It is my intentionto use HRIS for workactivities wherever
applicable
6.23 I plan to increasemy usage of HRIS
6.24 I intend to useHRIS as much aspossible for work
activities
4,12 4,05 4,04
Dis
agre
em
en
t
Agr
ee
me
nt
Page 66
56
Figure 4 - 9: Present Usage Behaviour Mean Distribution.
The mean of <3 in figure 4-9 shows significant disagreement that respondents are not using the HRIS.
On the issue of present usage behaviour of the system the response is more on the disagreement side.
This shows that the respondents do not use the system frequently when doing their work.
4.6.3 Training
Test Value = 3
95% Confidence
Interval of the
Difference
t df
Sig. (2-
tailed)
Mean
Difference Lower Upper
6.27 The Bank supports training in
the use of HRIS for new employees
2.780 129 .006 .200 .06 .34
6.28 Training in the use of HRIS is
available to all employees
3.492 131 .001 .265 .11 .42
Table 4-8: One-Sample Test Response on the Training of HRIS.
As shown in Table 4-8 there is significant disagreement as the p>.0005. This shows that employees are
not convinced that the Bank supports training of HRIS for new employees. This is justified by statement
6.27 on Table 4-8. Statement 6.28 indicates a significant disagreement that training in the use of the
system is available to all employees. The reason can be that they were not trained or they cannot
remember such training because of long working experience.
1
2
3
4
5
6.25 I use HRIS daily when I domy work
6.26 I have been using thesystem regularly in the past
months
2,672,92
Dis
agre
em
en
t
Agr
ee
me
nt
Page 67
57
Figure 4 - 10 Training – Mean Distribution
As shown in figure 4.10 the results indicate a mean value of 3.20 and 3.27 respectively. This is an
indication that respondents are not sure whether the Bank supports training of the system. Looking at
the usage responses the finding can be made that training is not sufficient enough for employees to use
the system.
4.6.4 Use Behaviour
Figure 4 - 11 Percentage of Usage of HRIS on Weekly Basis.
Use behaviour was tested using a chi-square goodness of fit test. The test shows a significant number
to explain frequency of usage of the system. The value of (71 – 56.3%) indicated that they use HRIS
once a week (χ2 (4) = 108.444, p<.0005). A significant number of (90 –75.6%) under figure 4-11 shows
that 53% of the respondents use the system at least once a week and the lowest indicated that 5.5%
respondents used it three times a week. 15.7% of the respondents do not use the system at all. The
reason being that the Bank allows staff to use both manual and the system, therefore, some employees
1
2
3
4
5
6.27 The Bank supports
training in the use of HRIS
for new employees
6.28 Training in the use of
HRIS is available to all
employees
3,20 3,27
Dis
agre
em
en
t
Agr
ee
me
nt
,0
10,0
20,0
30,0
40,0
50,0
60,0
Nev
er
On
ce a
wee
k
Twic
e a
we
ek
Thre
e ti
mes
a w
eek
>3
tim
es
a w
eek
Un
spec
ifie
d
On average how many times do you use HRIS in a week?
15,7
53,0
11,9 8,2 5,2 6,0Pe
rce
nta
ge
Page 68
58
choose not to use the system. Based on the data presented most of the employees are not using the
system as required that show little behaviour change to accept and use the system.
Figure 4 - 12 : Percentage of Usage in Years.
Figure 4-12 indicates that 40.3% of the respondents have used the system less than two years, followed
by 26.9% who used the system for more than two years but less than three years. 11.2% are using the
system for more than three years while the 11.2% of the respondents did not specify at all. Looking at
the response rate there are employees that are using the system to do their work which indicates a change
in behaviour to use the system.
4.7 Construct Analysis
The internal consistency was evaluated by Cronbach’s alpha coefficient. Table 4-9 indicates the values
obtained for each of the constructs. Analysis was made on getting single measures for all the constructs.
It is most commonly used when you have multiple Likert questions in a survey/questionnaire that form
a scale and you wish to determine if the scale is reliable. Cronbach’s alpha was used to test whether
combining the items from a section will yield a reliable measure for that constructs. An alpha value of
>.7 indicates reliability of measure. To measure the internal consistency of the questions, Cronbach
Analysis was used to assess how reliably the questionnaire measures the constructs. In general, the
Cronbach’s Alpha is: <0.35 = low reliability, 0.35< and <0.7 = acceptable >0.7 = high reliability. The
constructs reliable measures were formed by averaging items in the construct section. Cronbach's alpha
is 0.805, indicates a high level of internal consistency for the scale.
,0
5,0
10,0
15,0
20,0
25,0
30,0
35,0
40,0
45,0
<1 year 1 - <2 years 2 - <3 years 3+ years Unspecified
For how long have you been using HRIS?
10,4
40,3
26,9
11,2 11,2
Pe
rce
nta
ge
Page 69
59
Constructs Cronbach's Alpha Number of Items
Performance Expectancy .906 5
Effort Expectancy .925 6
Facilitating Condition .841 7
Social Influence .838 3
Behaviour intention .945 3
Usage Behaviour .756 2
Table 4-9: Reliability Statistics of the Constructs.
4.7.1 Performance Expectancy (PE)
The value of .906 indicates the reliable measure for performance expectancy was obtained by averaging
the five (5) question responses. This shows that performance expectancy is reliable in measuring
behaviour intentions to use HRIS. The closer the value to 1 shows that the statements presented
measures the same underlying concept. The value of .906 indicates a reliable measure of performance
expectancy to influence behaviour intentions to use HRIS.
4.7.2 Effort Expectancy (EE)
The value of .925 below indicates the reliable measure for effort expectancy by averaging the six (6)
statements presented. The closer the Cronbach’s alpha coefficient is to 1.0 the grater the internal
consistency of the statements in the scale. We can get a reliable measure for effort expectancy to
determine the behaviour intentions to use HRIS.
4.7.3 Facilitating Conditions (FC)
The value of .841 below indicates the reliable measure for facilitating conditions by averaging the seven
(7) question responses. The questions response shows that they were consistent in measuring the
behavioural change in the use of HRIS. This shows that facilitating condition questions were accurate
to assist in the interpretation of data.
4.7.4 Social Influence (SF)
The value of .838 indicates the reliable measure of social influence was obtained by averaging the three
(3) question responses. The closer the coefficient to 1.0 shows the greater the internal consistency of
the questions in measuring the construct. The questions were reliable in measuring the effect of social
influence on behavioural intentions to use HRIS.
4.7.5 Behaviour Intention (BI)
The value of .945 indicates the reliable effect of behavioural intention that was obtained by averaging
the three (3) question responses. This shows that the questions were related to measure the effect of
Page 70
60
behaviour intentions to the use of HRIS. When the coefficient is closer to 1.0 it means that there was
greater internal consistency of the questions in the measure.
4.7.6 Usage Behaviour (UB)
This value of .756 indicates the reliable measure that is obtained by averaging the two (2) question
responses. This shows that the questions were reliable measure to test the same underlying construct in
determining the extent to which use behaviour affects the usage of HRIS. This indicates a high level of
internal consistency for our scale with this specific sample.
4.7.7 Construct Relatedness
Figure 4 - 13 Mean of the Variables
The t-test analysis was used on the constructs to test for significant agreement or disagreement on the
constructs. As shown in figure 4-13Error! Reference source not found. there is significant agreement
on performance expectancy, effort expectancy, social influence and behaviour intentions as indicated
by the value of the mean of greater than three (>3). When looking at usage behaviour, the results
indicates a significant disagreement is reflected by the value of the mean of less than three (<3).
4.8 Objectives Analysis
Note that while t-tests were telling us about the respondents’ significant agreement and disagreement.
The data denoted a slightly significant difference as most of the responses were positive except the issue
of usage and training. The difference is considered meaningful to the study because the
recommendations will be based on the researched data. To address the objectives analysis there is a
need to check the effect of the independent variables on intention to use and usage of the system. Model
1
2
3
4
5
PE EE FC SI BI USAGE TRAINING
3,93
3,56 3,533,66
4,07
2,79
3,23
Dis
agre
em
en
t
Agr
ee
me
nt
Page 71
61
summary was used to establish the effect of independent variable on the dependent variable (behaviour
intention). It provides information about the regression line’s ability to account for the total variation in
the dependent variable. The straight analysis was used to investigate whether gender, age, experience,
or training has a moderating effect on the independent variables (IV) as well as the dependent variables
(DV). To test the effect of the IV on the DV regression analysis was used. All checks were carried out
to ensure that conditions for the test are met.
4.8.1 The Effect of Independent Variable on the Dependent Variable
Data from the SPSS provided us with important information about significance of the independent
variables on the dependent variable. The two-summary statistical analysis was used to show whether
the model has improved the ability to predict the outcome variable. The model summary interpreted
data when only one construct was used as a predictor. The columns under R are the values of the
multiple correlation coefficients between the predictors and the outcomes. The column labelled R2 is a
measure of how much variability in the outcome is accounted for each predictor. Model summary tables
show what the dependent variable (outcome) was and the independent variable (predictor) in each table.
ANOVA was used to test whether the model is significantly better at predicting the outcome variable.
It is used to test the overall fitness of the model. ANOVA does not tell us about the individual
contribution of the variables in the model so we consider it as a good predictor. ANOVA tells us whether
the model is a significant fit of the data by looking at a value less than 0.05 labelled as significant. The
important figure on the table is F-ratio which is representing the variances of independent samples as
explained by the model. The coefficient of reliability ranges from 0 to 1 in providing this overall
assessment of a measure’s reliability. The statistical data above have shown whether the model has
improved the ability to predict the outcome.
4.8.1.1 Performance Expectancy (PE) and Behaviour Intention (BI)
Performance expectancy is an independent variable while behavioural intention is dependent variable.
Table 4-10 shows the model summary that tells us whether the model has successfully predicted effect
of the performance expectancy on behaviour intention to use the HRIS. Performance expectancy is used
as a predictor. The independent variable PE accounts for 9.5% of the dependent variable BI. This shows
that performance expectancy is a significant predictor of behaviour intention to use HRIS.
Page 72
62
Table 4-10: Model Summary.
Model R R Square Adjusted R
Square
Std. Error of the
Estimate Durbin-Watson
1 .308a .095 .088 .62734 2.047
a. Predictors: (Constant), PE
b. Dependent Variable: BI
As shown in Table 4-11 shows 129 degrees of freedom and interpret that the lower the F-ratio means
the higher the significant score. The value of 13.488 indicates that performance expectancy is
considered significant to influence behaviour intentions to use HRIS. The significant value is p<.0005
indicates that performance expectancy has power to influence behaviour intentions to use HRIS.
Table 4-11: ANOVA.
Model Sum of Squares df Mean Square F Sig.
1 Regression 5.308 1 5.308 13.488 .000a
Residual 50.768 129 .394
Total 56.076 130
a. Predictors: (Constant), PE
b. Dependent Variable: BI
Table 4-12: Coefficients
Model
Unstandardised
Coefficients
Standardised
Coefficients t Sig.
Collinearity
Statistics
B Std. Error Beta Tolerance VIF
1 Constant 2.682 .386 6.951 .000
PE .356 .097 .308 3.673 .000 1.000 1.000
a. Dependent Variable: BI
Table 4-12 indicates a positive relationship between PE and BI because the coefficient value of
p=<.0005. The value of .356 indicates that the PE is the best predictor of BI holding other variables
constant.
4.8.1.2 Effort Expectancy (EE) and Behaviour Intention (BI)
Table 4-13 shows the model summary that states whether the model has successfully predicted effect
of the effort expectancy on behaviour intention to use the HRIS. When effort expectancy is used as a
Page 73
63
constant variable its effect on the independent variable is shown by the simple correlation value of R=
0.363. The independent variable EE accounts for 13.2% of variability is explained by the model. This
means that 13.2% of behaviour intention to use HRIS is explained by effort expectancy.
Table 4-13: Model Summary.
Model R R Square Adjusted R
Square
Std. Error of the
Estimate Durbin-Watson
1 .363a .132 .125 .63254 2.114
a. Predictors: (Constant), EE
As shown in Table 4-14 (F (1,131) = 19.939, p<.0005) effort expectancy is a significant predictor of
behavioural intention to use HRIS. EE has strong explanatory power of the behaviour intentions to use
HRIS. The coefficient value on table 4.16.3 shows that there is a relationship between EE and BI.
Table 4-14: ANOVA.
Model Sum of Squares df Mean Square F Sig.
1 Regression 7.978 1 7.978 19.939 .000a
Residual 52.413 131 .400
Total 60.391 132
a. Predictors: (Constant), EE
b. Dependent Variable: BI
Table 4-15: Coefficients
Model
Unstandardised
Coefficients
Standardised
Coefficients t Sig. Collinearity Statistics
B Std. Error Beta Tolerance VIF
1 (Constant) 2.818 .285 9.882 .000
EE .349 .078 .363 4.465 .000 1.000 1.000
a. Dependent Variable: BI
4.8.1.3 Social Influence (SI) and Behaviour Intention (BI)
Social expectancy is illustrated as significant predictor of behaviour intention to use HRIS as indicated
21.8% in Table 4-16.
Page 74
64
Table 4-16: Model Summary
Model R R Square Adjusted R
Square
Std. Error of the
Estimate Durbin-Watson
1 .467a .218 .212 .60037 2.024
a. Predictors: (Constant), SI
b. Dependent Variable: BI
As shown in Table 4 17 (F (1,131) = 13.172, p<.0005). It means that social influence is a significant
predictor of behavioural intention to use HRIS (β = .499, p<.0005).
Table 4-17: ANOVA
Model Sum of Squares df Mean Square F Sig.
1 Regression 13.172 1 13.172 36.544 .000a
Residual 47.219 131 .360
Total 60.391 132
a. Predictors: (Constant), SI
b. Dependent Variable: BI
The coefficient in Table 4-18 demonstrates the relationship between SI and BI as the value presume
that SI is the strongest predictor of the three constructs.
Table 4-18: Coefficients.
Model
Unstandardised
Coefficients
Standardised
Coefficients t Sig. Collinearity Statistics
B Std. Error Beta Tolerance VIF
1 (Constant) 2.238 .307 7.291 .000
SI .499 .082 .467 6.045 .000 1.000 1.000
a. Dependent Variable: BI
4.8.1.4 Facilitating Condition (FC) and Behaviour intentions (BI)
As shown in Table 4-19 shows the value of R2 =.121 which means that facilitating condition accounts
for 12.1% of the variation in influencing behaviour intention to use the system.
Page 75
65
Table 4-19: Model Summary.
Model R R Square Adjusted R
Square
Std. Error of the
Estimate Durbin-Watson
1 .347a .121 .114 .63667 2.019
a. Predictors: (Constant), FC
b. Dependent Variable: BI
Table 4-20 shows that facilitating condition is a significant predictor of behaviour intention to use the
system. This is reflected by value of (F = 17.985, p<.0005) because the significance value of .0005
indicates that facilitating condition has significant power to influence behaviour intentions to use HRIS
Table 4-20: ANOVA
Model Sum of Squares df Mean Square F Sig.
1 Regression 7.290 1 7.290 17.985 .000a
Residual 53.101 131 .405
Total 60.391 132
a. Predictors: (Constant), FC
b. Dependent Variable: BI
The coefficient in Table 4-21 below demonstrates the positive relationship between facilitating
condition and behaviour intention as the values are positive, therefore, FC is considered significant in
predicting BI when all other variables remain constant.
Table 4-21: Coefficients.
Model
Unstandardised
Coefficients
Standardised
Coefficients t Sig.
Collinearity
Statistics
B Std. Error Beta Tolerance VIF
1 (Constant) 2.750 .316 8.713 .000
FC .373 .088 .347 4.241 .000 1.000 1.000
a. Dependent Variable: BI
Page 76
66
4.8.1.5 Facilitating Condition (FC) and Usage Behaviour (UB)
The independent variable FC accounts for 17.5% of variance in influencing usage behaviour of HRIS.
This is a simple correlation that indicates that facilitating condition is a predictor of usage behaviour of
HRIS.
Table 4-22: Model Summary.
Model R R Square Adjusted R
Square
Std. Error of the
Estimate Durbin-Watson
1 .418a .175 .168 .88635 1.652
a. Predictors: (Constant), FC
b. Dependent Variable: USAGE
Facilitating condition is a significant predictor of usage behaviour of HRIS as demonstrated by Table
4-23 below. The value of F= 27.937 has a significant of .000 shows that facilitating condition is the
better predictor of usage behaviour of HRIS.
Table 4-23: ANOVA.
Model Sum of Squares df Mean Square F Sig.
1 Regression 21.948 1 21.948 27.937 .000a
Residual 103.701 132 .786
Total 125.649 133
a. Predictors: (Constant), FC
b. Dependent Variable: USAGE
Table 4-24 shows a positive relationship between FC and UB. The coefficient value of .000 indicates
that facilitating condition is statistically significant in influencing usage before of HRIS.
Table 4-24: Coefficients.
Model Unstandardised Coefficients
Standardised
Coefficients t Sig. Collinearity Statistics
B Std. Error Beta Tolerance VIF
1 (Constant) .536 .433 1.236 .218
FC .639 .121 .418 5.286 .000 1.000 1.000
a. Dependent Variable: USAGE
Page 77
67
Looking at the data interpreted it is worth noting that all the constructs were found to be significant
predictors of intention to use HRIS. This shows the unified theory of acceptance and use of technology
is the best predictor of behaviour intention to use HRIS. There is a strong relationship between the
dependent variable and independent variables presented.
4.8.2 Moderating effect of Gender, Age, Experience, and Training
The last analysis performed was to test whether the results above are moderated by gender, age,
experience, and training as per the proposed model.
4.8.2.1 Performance expectance (PE) and Behaviour Intentions (BI)
Gender does not have any significant effect on the relationship between PE and BI. Age does not have
any effect on the relationship between PE and BI.
4.8.2.2 Effort Expectancy (EE) and Behaviour Intention (BI)
Gender, age, and experience do not have any moderating effect on the relationship between EE and
BI.
4.8.2.3 Social Influence (SI) and Behaviour Intention (BI)
None of gender, age, experience, and training has any moderating effect on the relationship between
SI and BI.
4.8.2.4 Facilitating Condition (FC) and Usage
No significant effect from experience or age on the relationship between FC and usage.
4.9 Summary of the Chapter
The chapter presented the descriptive analysis of the quantitative data to explore characteristics of the
data collected from the employees of the Central Bank of Lesotho using the HRIS. The analysis
performed gave the overview of the research study by explaining the data screening procedures and
data management processes. The chapter presented the demographic information analysis using
descriptive analysis methodology. The overall response rate was high as 79.3%. The chi-square
goodness of fit test was adopted to test whether any of the response options are selected significantly
Page 78
68
more or less often than others. Under the null hypothesis it is assumed that all responses are equally
selected.
Regression analysis was based on linear regression estimated the coefficients of the linear equation
involving one independent variable that best predicts the value of the dependent variable which was
behaviour intention and usage. One sample t-test was used to test whether a mean score is significantly
different from the scalar value.
Page 79
69
5. CHAPTER FIVE-DISCUSSION OF THE RESULTS
5.1 Introduction
This chapter presents a discussion and analysis of data presented in the previous chapter. The data will
be assessed based on the research questions stated below;
a) To what extent has employees’ performance improved by implementing and using HRIS?
b) To what extent has effort expectancy influenced the users’ behaviour intentions in using HRIS?
c) To what extent has social factors influenced the users’ behaviour intentions in using HRIS?
d) To what extent have the Bank’s facilitating conditions influenced the users’ behaviour
intentions and use of HRIS?
The chapter will provide a comprehensive summary of the research findings followed by the section
that explores the contribution of the study to the body of knowledge. The chapter will discuss further
the impact of moderating factors on the four constructs. The moderating factors according to the study
were gender, age, experience, and training. Finally, this chapter will discuss the limitations of the study
and recommendations for future research and lastly summary of the chapter.
5.2 Discussion of the Finding Based on Research Questions
The discussion of the findings will be presented in response to the research questions as per the UTAUT
model. The model was tested through quantitative data to effectively carry out the study to investigate
the implementation of human resources information system (HRIS) with the aim of finding out factors
that influence individual behaviour intention to use the new technology. The model was used to learn
more about the phenomenon looking at behaviour intention towards HRIS implementation to establish
the success or failure of the implementation of the system. This section will discuss the results and
findings with respect of the constructs of the UTAUT. It will explain the significance of age, gender,
experience, and training to the behaviour intention. The chapter will provide explanation and answers
to the research questions.
5.2.1 Research Question 1: To what extent has employees’ performance improved by implementing
and using HRIS?
Performance expectancy is explained as a degree to which the users of the HRIS have confidence that
using the HRIS will help them to do their work faster and improve quality of their service (Akbar,
2013). The results found that there is significant agreement that the system is useful to accomplish
certain tasks. Performance expectancy construct was used to determine the magnitude at which
individual believes that using HRIS will improve their performance at work. In response to the
statements given individual believes that using the system will certainly improve the quality of their
Page 80
70
work and efficiency. The results confirm the research question that HRIS will improve performance of
employees if it is used.
Performance expectancy has a strong significant outcome on behaviour intentions. Ahmer (2013) study
indicated that users behaviour change occurred when the system is used which resulted into significant
improvement of performance and quality of work. The findings suggested that performance expectancy
for the use of HRIS can be increased by increasing the usage of the system. This can be done by
continuously communicating the benefits and advantages of HRIS. As suggested by Kavanagh and
Thite (2009) communication platform unfreeze the current behaviour to allow change to take place.
Jonsson (2013) showed that, if the user experiences and advantage of the system are clear it has a
positive effect on the use as well as good quality of information. The findings of the study demonstrated
that performance expectancy has positive effect on the behaviour intentions to use the system. This is
supported by Venkatesh et al. (2003) that performance expectancy is regarded as a strongest judge of
intention to use the system. At Central Bank of Lesotho, HRIS is mandatory to every employee even
though employees are not forced to use the system.
The findings are consisted with the previous research by Ghalandari (2012) that indicated that when
users feel that using the system improves theirs performance they become motived to use it when doing
their work. The positive attitude that the respondents view the system to have contributed to easy
completion of tasks can be used to increase usage of the system. The results of the study indicated that
gender and age do not have any significant effect on the relationship between performance expectancy
and behaviour intentions. This is contradicting with the findings that showed that the influence towards
behaviour intention can be affected by age, gender, experience and other factors based on the technology
implemented (Ghalandari, 2012).
As explained under the UTAUT construct that the degree to which an individual believes that using a
particular system would improve his or her work performance, determines their intentions to use the
system (Venkatesh et al., 2012). This is supported by Sanchita (2013) that employees have to be
convinced by the fact that the use of technology at work will help them in generating better results than
not using the technology. Williams et al. (2015) indicated that gender and experience has significant
impact on behaviour intention while training and age has an impact on performance expectancy.
The research findings demonstrate that gender does not have any significant effect on the relationship
between performance expectancy (PE) and behaviour intentions (BI). Again, age was not found to have
any effect on the relationship between PE and BI. The hypothesis 1 which states that performance
expectancy has significant influence on the user’s behaviour intentions to use the system. Hypothesis 1
was confirmed as per the results.
Page 81
71
5.2.2 Research Question 2: To what extent has effort expectancy influenced the users’ behaviour
intentions in using HRIS?
Effort expectancy is defined as a degree of ease related with the use of the HRIS. It provides a clear
understanding on the degree of effort put to learn to be able use the system. In organisational setting
effort expectancy is viewed by users as a form of time and effort spend to learn to use the system. Effort
expectancy was measured looking at the ease of learning the system together with the system user
friendliness and easy to use. The results indicated that effort expectancy influence behaviour intention
to use the system.
The results answer the research question that effort expectancy influenced the users’ behaviour
intentions in using HRIS. This is supported by research findings by Ghalandari (2012) which indicated
that effort expectancy has positive effect on behaviour intentions when users feel comfortable to use
the system. The study was undertaken to users of e-banking services which showed that they were
willing to use the system because the system was comfortable and easy to use. The results confirmed
that users prefer the system that is easy to use and which demanded little effort to perform their work.
The research finding is persistent with the results of other studies that established that effort expectancy
has a strong effect on the behaviour intention to use the technology introduced (Venkatesh et al., 2003).
Individual response indicated that there is a significant agreement that their interaction with the system
was clear and understandable. The results revealed that the respondents accepted that the system as user
friendly and easy to use.
The research findings support the hypothesis 2 that states that effort expectancy has significant influence
on the user behaviour intentions to use HRIS. Effort expectancy is considered as a significant predictor
of behavioural intention to use HRIS. This proves that users prefer to adopt to the system that is easy to
learn and they use little effort to perform their duties. It is worth noting that the influence of effort
expectancy can be supported by improving the quality of communication by using easily
comprehensible documentations and necessary support at all times. On the results gender, age and
experience were found to have not significant effect on the relationship between effort expectancy and
behaviour intention.
5.2.3 Research Question 3: To what extent has social factors influenced the users’ behaviour
intentions in using HRIS?
Social Influence is defined as the way individual perceived the importance of other people views on
their decision to use HRIS. Social influence takes into account that individual behaviour can be
influenced by people around them. The construct was measured looking at how individuals perceived
the opinions of their colleagues, supervisors and senior management in influencing them to use HRIS.
The results revealed that social influence has significant influence on behaviour intention to use HRIS.
Page 82
72
According to the results there is positive response that social influence definitely plays a major role in
influencing behaviour intention to use HRIS.
The study by Jonsson (2013) mentioned that the social influence is used to find out the degree to which
individuals perceive the importance of others views in using the system. The constructs consider the
views of other colleagues looking at whether they are helpful and supportive to them to use the system.
The results confirmed the hypothesis 3 that social influence has significant influence on the employee
behaviour to use HRIS. The research findings reveal that social influenced was found to be a strongest
predictor of behaviour intentions more than the other three constructs. The research findings revealed
that none of gender, age, experience, and training have any moderating effect on the relationship
between social influence and behaviour intentions.
5.2.4 Research Question 4: To what extent have the Bank’s facilitating conditions influenced the
users’ behaviour intentions and use of HRIS?
In the study facilitating condition (FC) was defined as availability of resources to support the
implementation of HRIS (Venkatesh et al. 2003). Facilitating condition was used on the study to assess
the sufficiency of resources to support smooth implementation and availability of technical expertise to
give support to the users of HRIS. It used to measure availability and reliability of internet connection
to facilitate successful usage of HRIS. The research finding confirmed that facilitating conditions have
significant influence on behaviour intentions to use the system. The results showed that facilitating is a
significant predictor of behavioural intention to use. This supported by Sharifian et al. (2014) that
facilitating condition has a direct effect on user behaviour intention to use technology.
At the same time FC was found to be a very strong predictor of behaviour usage. In support of smooth
implementation of HRIS it is important to improve facilitating conditions in terms of technological and
human resources to increase the usage of the system. The results indicated that some individuals believe
that resources were not sufficient enough to support the smooth implementation of HRIS. Facilitating
condition have been assumed to influence technology use when the organisational climate is conducive
enough to change of behaviour (Venkatesh et al., 2012).
The results also denote that the resources were not sufficient enough to support the smooth
implementation of the system. Training as one of the tools that the Central Bank of Lesotho is using to
ensure that users acquire knowledge on the use of the system it was found rated very low. This shows
that users are not convinced that the Bank supports training of HRIS. The reason of not using the system
is that they were not trained to use the system. On the issue of present usage behaviour of the system
the response is more on the disagreement side. This shows that the respondents do not use the system
frequently when doing their work.
Page 83
73
This is an indication that there are still some issues that need to be addressed on the issue of training
and usage of the system. The results indicated that there is no significant effect from experience or age
on the relationship between facilitating conditions and use behaviour. It is worth noting that 127
respondents have the lowest p=.003 which denotes that the resources were not sufficient enough to
support the smooth implementation of the system. Statement 6.16 has a significance of 003 which shows
that respondents do not agree resources are enough to support smooth implementation.
Municipality of South Africa in Kwazulu Natal provided help desk and online assistance to ensure that
users are timely assisted and facilitated easy communication between employees and human resources
office (Kumar & Parumasur, 2013). The finding found no significant effect from experience or age on
the relationship between facilitating condition and behaviour usage. The study by Ghalandari (2012)
has a different view that IT skills and knowledge has an influence on facilitating condition. An
insignificant relationship between age and facilitating condition toward using technology was revealed.
5.3 Research Contribution
The research study contributed a lot on the body of knowledge relating to the understanding of
behavioural changes in the use of information technology. The availability of relevant literature brought
about clear understanding on the phenomenon to enable the researcher to be able to apply the UTAUT
in the context of HRIS implementation at Central Bank of Lesotho.
The study validated the significance of the proposed UTAUT and support the relationship between key
constructs within the context of the Central Bank of Lesotho. The study contributed practically to the
Central Bank of Lesotho environment by scientifically helping to identify and discover factors that
influence employee behaviour to use HRIS based on the modified UTAUT. The study could provide
recommendations to the Bank to facilitated better usage of the system. The findings of the study were
relevant to all sectors that implemented any technology for the first time. At the same time, the study
produced practical guidelines based on the findings that can help the Bank to improve on the strategy
on the issues of change management.
5.4 Recommendations for Future Research
The study was limited to look at the implementation of HRIS at the Central Bank of Lesotho to
accommodate the amount of time to complete the study. The study provided bigger picture for some
future interesting research to fill the gaps missing. The study did not capture the most important issue
of change management when new systems are implemented. The study was focusing on behaviour
change based on the UTAUT model by identifying factors that influence user behaviour to use the new
HRIS implemented. As a recommendation to future research the issue of change management can be
Page 84
74
incorporated to provide a better understanding on behaviour change when it comes to the
implementation of new technology.
There are opportunities to expand the research by adding different elements to the UTAUT. The issue
of culture could have been added to the model as it plays the most critical part when talking about
behavioural changes. Understanding culture differences is important to provide broader knowledge on
the factors that influence users of the technology. Qualitative approach is another angle of interesting
area of research when trying to understand user’s behaviour intention to use new systems. Different
studies have continuously stressed that UTAUT is a new model that still needs further validation and
more research is required to test it further.
5.5 Summary of the Chapter
The study was motivated by notable problem of lack of knowledge on issues related to factors that
influence individual behaviour to use the technology introduced in organisations. The discussed the
analysis of the research results obtained from the collected data. It was used to identify the effect of the
constructs on the user behavioural intentions and use behaviour. UTAUT is a helpful to managers to
assess the possibility of success of the new technology introduced and assist them to understand the
drivers of acceptance to be able to design appropriate remedies. The research findings showed that
performance expectancy, effort expectancy, social influence and facilitating conditions have a positive
influence on the behaviour intention to use HRIS.
The investigation of the moderating factor indicated that age, gender, experience and training did not
have any influence on all the constructs which affects the behaviour intention to use the HRIS.
Supporting data was analysed to find out that PE, EE, SI and FC have positive significant towards the
use technology and acceptance. All moderating variables were found to have no significant moderating
influence on behaviour intentions to use HRIS.
Page 85
75
6 CHAPTER SIX- CONCLUSION AND RECOMMENDATION
6.1 Introduction
Human resource management is a field that is characterised by complexity and intensive functions
because it deals with human being with different characters and behaviour. The purpose of the study
was to identify factors that influence user’s behaviour intention to use HRIS to ensure that the HRIS
delivers as expected. UTAUT was used to scientifically identify some of the factors that influence
individual behaviour to use HRIS. This chapter will provide the conclusion and recommendations of
the study based on the results discovered from the data discussed in the previous chapters. The
conclusion will give the summary of the findings indicating whether the hypothesis was rejected or
confirmed. The recommendations will include the statements on whether the objectives were achieved.
6.2 Conclusion
Human resources information system (HRIS) is one of the effective ways of managing of human capital
in organisations. Organisations have realised the importance of driving the strategy by investing in
technology the HRIS. Information technology has drastically impacted organisation especially in the
function of human resources management. The implication of HRIS at the Central Bank of Lesotho as
a new system was accompanied by positive and negative factors. Feedback from the respondents reveals
important factors that influence user’s behaviour intentions to use HRIS. The respondent’s feedback
reflected a strong positive effect that shows that employees have high intentions to use the system.
The ability of the organisation to connect the potential of the HRIS is influenced by different factors
that include top management supports and readiness of the organisation to facilitated change process.
Availability of resources such as time, finance and technical support are part of facilitating condition to
assist in the successful implementation of HRIS. Employee involvement and commitment is crucial for
successful implementation of HRIS. Ability to motivate employee to adapt change of automating
process is needed.
These issues mentioned earlier are some of the factors that influence individual to use the system. Based
on the UTAUT model the constructs were used to determine their impact in influencing individual
behaviour intention to use HRIS. The conclusion of the study will be done looking at the hypothesis
which was stated as follows;
The results support the use of UTAUT on the study in dealing with issues of acceptance of HRIS. The
UTAUT model shows that individual behaviour of using HRIS is influenced by performance
expectancy, effort expectancy, and social influence while the usage behaviour rely on facilitating
condition. In conclusion performance expectancy was found fit to influence individual behaviour to use
Page 86
76
HRIS. The results confirm that HRIS can improve individual performance and if it can be used. Users
should be willing to learn and use the system for it to be easier to operate. HRIS assist organisation’s to
be more efficient, improved accuracy of information and discover new ways of delivering human
resources services. The results are supported by Bakar et al. (2013) indicating the effort expectancy,
social influence and facilitating conditions increase the continuous intention to use the student portal
by the students of the university of Malaysia.
To achieve this expected acceptance of the HRIS by employees is crucial. In order to achieve this goal,
certain behavioural issues such as resistance to change have to be overcome by instilling all relevant
mechanisms mentioned under the study. As much as the Central Bank of Lesotho needs to embrace
HRIS to gain the potential benefits from it, training of users should be taken consideration. Training
was identified as one aspect that was missing and the Bank has address so that users will be able use
the system. The minimum skill requirements of using the system need to be taken into consideration.
Training is one of the key support given to the users. Help desks should also be provided to users.
6.3 Recommendations
The recommendations will be based on the research objectives stated below;
a) To find out how implementation of HRIS has improved employees’ performance in the bank
b) To ascertain how individual employee effort has influenced the behaviour intentions to use
HRIS
c) To establish the impact of social influence on employee’s behaviour in using the HRIS
d) To find out whether the bank has created facilitating conditions for the HRIS implementation.
In determining the conditions that enhance the success of a newly implemented information system, the
issue of behaviour change was key on the study. Behaviour change is an on-going concern for both IS
researchers as well as organisation that needs to optimise their productivity. HRIS implementation
success is a complex concept that is difficult to measure. Empirical evidence suggested that a reasonable
measure of success may lie within areas of user system usage (Venkatesh et al., 2012). Acceptance
dependent up those users who intended to use the system and they respond to change made. Most of the
studies have focused on the reasons for acceptance or non-acceptance but falling short in providing a
link between system acceptance and how organisations should go about with system implementation to
enhance acceptance of new systems.
In trying to find the link between the two issues raised above the current study was investigating factors
that influence behaviour intentions and usage behaviour to assess the success of implementing HRIS at
the Central Bank of Lesotho. Central Bank of Lesotho can use the recommendations to diagnose
problem areas to provide appropriate solutions.
Page 87
77
Objective 1- To find out the impact of performance expectancy on the users behaviour intention to use
HRIS
The study has notice a trend of little usage of the system which is hindering the successful
implementation of HRIS at the Bank. The study has discovered that usage of HRIS improved
performance of employees because they will do their duties faster. Performance expectancy talks about
individuals believing that using the system will improve their effectiveness and performance. When
employees are convinced that the system will help them to be more effective, then their behaviour would
change and they will use the system. Usage of the system will result in the successful implementation
of HRIS.
Objective 2- To ascertain how individual employee effort has influenced the behaviour intentions to
use HRIS
Effort expectancy was measured looking at how the individuals find the system easy to use. When
employees find the system is easy learn they will be motivated to use it every day when they do their
work. The recommendation provided to the Bank is that on-going refresher trainings must be planned
and budgeted to reinforce more knowledge on the new system and processes. Informal user group
meetings can be used to resuscitate way of information sharing. IT technical support in a form of help
desk is required. Suitable technical support is crucial to promote more favourable beliefs about newly
implemented systems among users, which finally result in greater system implementation success.
These are some of the ways that can be used to instil learning to employees to change their behaviour
to use the system. When users feel comfortable to use the system it is easy for them to operate it on
daily basis.
Objective 3- To establish the impact of social influence on employee’s behaviour in using the HRIS
Social influence plays a vital role in changing individual behaviour to use technology. On the study
social influence was concentrating only on the influence of colleagues, supervisors and senior
management. All these people take part to ensure that the system is working and delivering as expected.
The results revealed that colleagues, supervisors, and senior management influence individual
behaviour to use the system. Therefore, it is important that the Bank provide this people with support
to be able to be helpful to others when it comes to the usage of HRIS.
Objective 4 – To find out whether the bank has created facilitating condition for the implementation
of HRIS
When management fails to communicate the change initiative to employees, it is the first risk of getting
negative response from employees. Most of the time employees becomes rebellious and resist the
change introduced. Communication platform unfreeze the current behaviour to allow change to take
place. One way of helping employees to regain confidence in the use of the system is to engage them
Page 88
78
in a two way communication to get their views regarding the implementation of the project (Kavanagh
& Thite, 2009). Facilitating Condition was used to measure employee response on the Bank’s support
on the implementation of HRIS. Recommendation is that management should always give support
whenever is need. When management is taking a leading role, the project becomes successful.
Page 89
79
7. REFERENCES
Ahmer, Z. (2013). Adoption of human resource information systems innovation in Pakistani
organizations. Journal of Quality and Technology Management 9, 22-50.
Akbar, F. (2013). What affects students’ acceptance and use of technology?’(Honours thesis, Carnegie
Mellon University). Retrieved from http://repository.cmu.edu/hsshonors/179/.
Al-Dmour, R.H. & Love, S. (2015). Determinants of the implementation of HRIS applications in
business organisations in Jordan. International Journal of Human Resources Development and
Management, 15, 69-96.
Al-Dmour, R.H. & Zu'bi, M. (2014). Factors Motivating and Inhibiting the Practice of HRIS in Business
Organizations: An Empirical Analysis. International Business Research, 7, 139.
Al-Shawakeh, K.M. (2014), Human resources information systems and their impact on human
resources management strategies: A field study in Jordanian commercial banks’, Journal of
Management Research, 6, 99-107.
Al-Shibly, H. (2011). Human Resources Information Systems Success Assessment: An integrative
model’, Australian Journal of Basic and Applied Sciences, 5, 157-169.
Alshehri, M., Drew, S., Alhussain, T. & Alghmadi, R. (2012). The Effects of Website Quality on
Adoption of E-Government Service: An Empirical Study Applying UTAUT Model Using SEM.
Cornell University Library, 1,1211-2410.
Altaany, F.H. (2011). Facilitation of human resource information systems on performance of public
sector in Jordan. Journal of Engineering Research and Applications, 4(7), 183-190.
AO'Brien, J., Marakas, G.M., Hills, T.G. & Lalit, M.G. (2006). Management information systems.
Tata Mc-Graw Hills, United Kingdom.
Atsanga, S.C. (2013) Perception of effectiveness of human resources information system by branch
managers in Kenya commercial bank Ltd. (Master’s thesis, University of Nairobi). Retrieved from
http://erepository.uonbi.ac.ke/bitstream/handle/11295/60418/.
Awan, A.G. & Sarwar, G.H. (2015). Integrated role of HRIS & SHRM (SHRIS) in banking sector of
Pakistan. Global Journal of Human Resources, 1 (3), 45-61.
Bakar, A.A., Razak, F.Z.A., & Abdullah, W.S.W. (2013). Assessing the effects of UTAUT and self-
determination predictor on students’ continuance intention to Use student portal. World Applied
Sciences Journal, 21, 1484-1489.
Page 90
80
Bal, Y., Bozkurt, S. & Ertemsir, E. (2012). The importance of using human resources (HRIS) and a
research on determining the success of HRIS’, in M.D. Tiwari (eds), Strategic human resource
management at tertiary level, pp.197-208. River Publisher, Denmark.
Bhattacherjee, A. (2012) Social science research: principles, methods, and practices. Creative
Commons Attribution-Non Commercial, Florida.
Bilbao-Osorio, B., Dutta, S. & Lanvin, B. (2013). The global information technology report 2013.
World Economic Forum, Citeseer, 1, 383.
Bohlander, G. & Snell. S., (2006), Managing human resources. Cengage Learning, United States.
Dunne, N., (2016), HR Technology Fact Sheet, SA Board For People Practices. Retrieved from
http://sabpp.co.za/wp-content/uploads/2017/01/factsheet_augustus-2016.
Dillon, T., Wu, C. & Chang, E. (2010). Cloud computing: issues and challenges. Advanced Information
Networking and Applications (AINA), 2010 24th IEEE International Conference. 27-33. Perth, WA,
Australia.
Foon, Y.S. & Fah, B.C.Y. (2011). Internet banking adoption in Kuala Lumpur: An application of
UTAUT model. International Journal of Business and Management, 6, 161.
Ghalandari, K. (2012). The effect of performance expectancy, effort expectancy, social influence and
facilitating conditions on acceptance of e-banking services in Iran: The moderating role of age and
gender. Middle-East Journal of Scientific Research, 12, 801-807.
Global Human Capital Trend, 2016, The new organisation: Different by design. Retrieved from
https://www2.deloitte.com/content/dam/Deloitte/global/Documents/HumanCapital/gx-dup-global-
human-capital-trends-2016.pdf.
Grobler, P.A., Warnich, S., Carrell, M. Elbert, F., & Hartfield, R.D. (2005). Human Resources
Management in South Africa. Cengage Learning Business EMEA, Texas.
Hameed, M.A., Counsell, S. & Swift. (2012) A conceptual model for the process of IT innovation
adoption in organisation. Journal of Engineering and Technology, 29,358-390.
Heisler, W. (2010). Human resources information systems: basics, applications, and future directions’,
in Kavanagh and Thite (eds.) Human resources information system, basics applications and future
direction, Publisher, Sage.
Jonsson, A. (2013). Information system usage-a study in the Middle East, (Masters thesis, Department
of Informatics, Linnaeus University).
Page 91
81
Kariuki, M.M. (2015). Human resource information system and competitive advantage of companies
listed on Nairobi securities exchange in Kenya. European Journal of Business Management, 7,197-207.
Kavanagh, M., & Thite, M. (2009), Human resource information systems: Basics, applications, and
future directions, Sage, California.
Kavanagh, M.J., Gueutal, H.G. & Tannenbaum, S.I., (1990), Human resource information systems:
Development and application, PWS-Kent Publishing Company, New York.
Kim, Y., & Crowston. K., (2011), Technology adoption and use theory review for studying scientists'
continued use of cyber‐Infrastructure. Proceedings of the American Society for Information Science
and Technology, 48, 1-10.
Kothari, C.R. (2004). Research methodology: methods and techniques. India, New Age International.
Kumar, N.A., & Parumasur, S.B. (2013). Managerial perceptions of the impact of HRIS on
organizational efficiency. Journal of Economics and Behavioral Studies, 5, 861.
Kumar, R., (2005) Research methodologies: a step-by-step guide for beginners. London, SAGE
Publications.
Kumar, R. (2012). Human resource information system: An innovative strategy for human resource
management, Gian Jyoti E-Journal 1: 1-12.
Lawrence, J. (2011) The Factors that Influence Adoption and Usage Decision in SMEs: Evaluating
Interpretive Case Study Research in Information Systems. Electronic Journal of Business Research
Methods, 8, 51-62.
Mbugua, C.N. (2015). The Role of Human Resources Information Systems in Organisational
Effectiveness: A Case Study of Kenya Commercial Bank. International Journal of Human Resources
Development and Management, 99-145.
McMillan, J.H. (1996). Educational research: fundamentals for the consumer. North America, Pearson
Education.
Muriithi, J.G., Gachunga, H. & Mburugu, C.K. (2014). Effects of human resource information systems
on human resource management practices and firm performance in listed commercial banks at Nairobi
securities exchange. European Journal of Business and Management, 6,47-55.
Nambiar, R., Poess, M., Masland, A., Taheri, A., Emmerton, M., Carman, F. & Majdalany, M. (2012).
TPC benchmark roadmap 2012. Technology Conference on Performance Evaluation and
Benchmarking. Springer, pp.1-20.
Page 92
82
Noor, M.M., & Razali, R. (2011). Human resources information systems (HRIS) for military domain-a
conceptual framework. Electrical Engineering and Informatics (ICEEI), 2011 International Conference
on. IEEE, 17-19 July 2011, pp.1-5.
Okiro, K., & Ndungu, J. (2013). The impact of mobile and internet banking on performance of financial
institutions in Kenya. European Scientific Journal, 9, 147-169.
Opiyo, P.A. (2015) Effects of Human Resources Information System on Performance of Commercial
Banks in Kenya: A Case of Kenya Commercial Bank. Journal Business Management, 1. Retrieved
from https://www.researchgate.net/publication/280224429.
Oruh, E.S. (2013). Towards sustainable human resource information systems (HRIS) in the Nigerian
banking sector: The role of new media. Economic Insights-Trends and Challenges, 65,1-8.
Panayotopoulou, L., Galanaki, E., & Papalexandris, N. (2010). Adoption of electronic systems in HRM:
Is national background of the firm relevant?. New Technology, Work and Employment, 25, 253-269.
Razali, M.Z., & Vrontis, D. (2010). The reactions of employees toward the implementation of human
resources information systems (HRIS) as a planned change program: A case study in Malaysia. Journal
of Transnational Management,15, 229-245.
Sanchita, B. (2013). A Study of Issues & Challenges of Implementation of Information Technology in
HRM. Global Journal of Management and Business Studies, 3, 435-440.
Sharifian, R., Askarian, F., Nematolahi, M., & Farhadi, P. (2014). Factors influencing nurses'
acceptance of hospital information systems in Iran: Application of the unified theory of acceptance and
use of technology. Health Information Management Journal, 43, 23-28.
Smit, P.J., Cronje, G.d.J., Brevis, T., & Vrba. (2011). Management principles: a contemporary edition
for Africa. South Africa, Juta and Company Ltd.
Storey, J. (2007). Human resource management: A critical text. United Kingdom, Cengage Learning
EMEA.
Sundaravej, T. (2010). Empirical validation of unified theory of acceptance and use of technology
model. Journal of Global Information Technology Management, 13, 5-27.
Taiwo, A.A., & Downe, A.G. (2013). The theory of user acceptance and use of technology (UTAUT):
A meta-analytic review of empirical findings. Journal of Theoretical & Applied Information
Technology 49.
Tansley, C., & Watson, T. (2000). Strategic exchange in the development of human resource
information systems (HRIS). New Technology, Work and Employment, 15, 108-122.
Page 93
83
Tavakol, M., & Dennick, R. (2011). Making sense of cronbach's alpha. International journal of medical
education, 2, 53.
Tiwari, M. (2013). Strategic human resource management at tertiary level. Spain, River Publishers.
Troshani, I., Jerram, C., & Gerrard, M. (2010). Exploring the organizational adoption of human
resources information systems (HRIS) in the Australian public sector. Proceedings of the 21st
Australasian Conference on Information Systems (ACIS2010). Brisbane, Australia, 1-3 December,
2010.
Venkatesh, V. L., Thong, J.Y. & Xu., X. (2012). Consumer acceptance and use of information
technology: Extending the unified theory of acceptance and use of technology. MIS Quarterly, 36, 157-
178.
Venkatesh, V., Morris, M.G. & Davis, G.B. (2003). User acceptance of information technology:
Toward a unified view. MIS quarterly, 425-478.
Wachira, F. (2010). Improving the management of human resources in the public service through
application of information and communication technologies (ICTs). Capacity Building Workshop for
Public Sector Human Resource Managers in Africa on Strengthening Human Resource Capacities for
the Achievement of the Millennium Development Goals and Africa’s Development. Cotonou, Republic
of Benin, 12-16 April 2010.
Waters, K.P., Zuber, A., Willy, R.M., Waudo, N.A., Owoch, T., Kimani, F.M. & Riley, F.L. (2013).
Kenya's health workforce information system: A model of impact on strategic human resources policy,
planning and management. International Journal of Medical Informatics, 82, 895-902.
Wiblen, S., Grant, D., & Dery, K. (2010). Transitioning to a new HRIS: The reshaping of human
resources and information technology talent. Journal of Electronic Commerce Research, 11, 251.
Williams, M.D., Rana, N.P., & Dwivedi, Y.K. (2015). The unified theory of acceptance and use of
technology (UTAUT). Journal of Enterprise Information Management, 28, 443-488.
Yu C.S. (2012). Factors affecting individuals to adopt mobile banking: Empirical evidence from the
UTAUT model. Journal of Electronic Commerce Research, 13, 104.
Zuiderwijk, A., Janssen, M. & Dwivedi, Y.K. (2015). Acceptance and use predictors of open data
technologies: Drawing upon the unified theory of acceptance and use of technology. Government
Information Quarterly, 32, 429-440.
Central Bank of Lesotho Act NO 2 of 2000. Retrieved from https://www.centralbank.org.ls
/index.php/legislation/121-principal/538-central-bank-act.
Page 95
85
Appendix A
Demographic Frequency Tables
Gender
Frequency Percent Valid Percent Cumulative
Percent
Valid Male 66 49.3 49.3 49.3
Female 68 50.7 50.7 100.0
Total 134 100.0 100.0
Age
Frequency Percent Valid Percent Cumulative
Percent
Valid 21-30 6 4.5 4.5 4.5
31-40 72 53.7 53.7 58.2
41-50 35 26.1 26.1 84.3
51+ 21 15.7 15.7 100.0
Total 134 100.0 100.0
Education
Frequency Percent Valid Percent Cumulative
Percent
Valid Some/all schooling 16 11.9 12.0 12.0
Diploma 26 19.4 19.5 31.6
Degree 42 31.3 31.6 63.2
Post graduate degree 49 36.6 36.8 100.0
Total 133 99.3 100.0
Missing System 1 .7
Total 134 100.0
Page 96
86
Position
Frequency Percent Valid Percent Cumulative
Percent
Valid Head of department 2 1.5 1.5 1.5
Head od division 16 11.9 11.9 13.4
Head of section 19 14.2 14.2 27.6
Professional 48 35.8 35.8 63.4
Sub professional 23 17.2 17.2 80.6
General services 26 19.4 19.4 100.0
Total 134 100.0 100.0
Experience
Frequency Percent Valid Percent Cumulative
Percent
Valid < 1 year 2 1.5 1.5 1.5
1 - <5 years 26 19.4 19.4 20.9
5 - <10 years 49 36.6 36.6 57.5
10 - <15 years 25 18.7 18.7 76.1
15+ years 32 23.9 23.9 100.0
Total 134 100.0 100.0
Page 97
87
Appendix B
Frequency Tables for the UTAUT Constructs
Performance Expectancy
6.1 The system is useful to accomplish certain tasks for one’s job
Frequency Percent Valid Percent Cumulative
Percent
Valid Strongly disagree 1 .7 .8 .8
Disagree 3 2.2 2.3 3.1
Neutral 12 9.0 9.2 12.2
Agree 99 73.9 75.6 87.8
Strongly agree 16 11.9 12.2 100.0
Total 131 97.8 100.0
Missing System 3 2.2
Total 134 100.0
6.2 Using the system enables tasks to be completed more quickly
Frequency Percent Valid Percent Cumulative
Percent
Valid Disagree 5 3.7 3.8 3.8
Neutral 11 8.2 8.4 12.2
Agree 93 69.4 71.0 83.2
Strongly agree 22 16.4 16.8 100.0
Total 131 97.8 100.0
Missing System 3 2.2
Total 134 100.0
Page 98
88
6.3 Using the system increases productivity
Frequency Percent Valid Percent Cumulative
Percent
Valid Strongly disagree 1 .7 .8 .8
Disagree 5 3.7 3.8 4.5
Neutral 23 17.2 17.4 22.0
Agree 82 61.2 62.1 84.1
Strongly agree 21 15.7 15.9 100.0
Total 132 98.5 100.0
Missing System 2 1.5
Total 134 100.0
6.4 The system makes work more interesting
Frequency Percent Valid Percent Cumulative
Percent
Valid Strongly disagree 1 .7 .8 .8
Disagree 5 3.7 3.8 4.6
Neutral 27 20.1 20.6 25.2
Agree 85 63.4 64.9 90.1
Strongly agree 13 9.7 9.9 100.0
Total 131 97.8 100.0
Missing System 3 2.2
Total 134 100.0
Page 99
89
6.5. Tasks can be completed with greater efficiency when using HRIS
Frequency Percent Valid Percent Cumulative
Percent
Valid Disagree 4 3.0 3.1 3.1
Neutral 15 11.2 11.6 14.7
Agree 85 63.4 65.9 80.6
Strongly agree 25 18.7 19.4 100.0
Total 129 96.3 100.0
Missing System 5 3.7
Total 134 100.0
One Sample statistics mean tables
One-Sample Statistics
N Mean Std. Deviation Std. Error Mean
6.1 The system is useful to
accomplish certain tasks
for one’s job
131 3.96 .613 .054
6.2 Using the system
enables tasks to be
completed more quickly
131 4.01 .638 .056
6.3 Using the system
increases productivity
132 3.89 .738 .064
6.4 The system makes
work more interesting
131 3.79 .699 .061
6.5 Tasks can be
completed with greater
efficiency when using the
HRIS
129 4.02 .661 .058
Page 100
90
Frequency tables for Effort Expectancy
6.6 Interaction with the system is clear and understandable
Frequency Percent Valid Percent Cumulative
Percent
Valid Strongly disagree 1 .7 .8 .8
Disagree 10 7.5 7.6 8.3
Neutral 23 17.2 17.4 25.8
Agree 86 64.2 65.2 90.9
Strongly agree 12 9.0 9.1 100.0
Total 132 98.5 100.0
Missing System 2 1.5
Total 134 100.0
6.7 It is easy to become skillful at using the system
Frequency Percent Valid Percent Cumulative
Percent
Valid Disagree 16 11.9 12.0 12.0
Neutral 40 29.9 30.1 42.1
Agree 65 48.5 48.9 91.0
Strongly agree 12 9.0 9.0 100.0
Total 133 99.3 100.0
Missing System 1 .7
Total 134 100.0
Page 101
91
6.8 The system is easy to use
Frequency Percent Valid Percent Cumulative
Percent
Valid Strongly disagree 1 .7 .8 .8
Disagree 20 14.9 15.2 15.9
Neutral 31 23.1 23.5 39.4
Agree 70 52.2 53.0 92.4
Strongly agree 10 7.5 7.6 100.0
Total 132 98.5 100.0
Missing System 2 1.5
Total 134 100.0
6.9 Learning to operate the system is easy
Frequency Percent Valid Percent Cumulative
Percent
Valid Strongly disagree 1 .7 .8 .8
Disagree 20 14.9 15.2 15.9
Neutral 26 19.4 19.7 35.6
Agree 79 59.0 59.8 95.5
Strongly agree 6 4.5 4.5 100.0
Total 132 98.5 100.0
Missing System 2 1.5
Total 134 100.0
Page 102
92
6.10 I have the confidence to use HRIS at work
Frequency Percent Valid Percent Cumulative
Percent
Valid Strongly disagree 1 .7 .8 .8
Disagree 18 13.4 13.5 14.3
Neutral 27 20.1 20.3 34.6
Agree 77 57.5 57.9 92.5
Strongly agree 10 7.5 7.5 100.0
Total 133 99.3 100.0
Missing System 1 .7
Total 134 100.0
6.11 I have the knowledge to use HRIS
Frequency Percent Valid Percent Cumulative
Percent
Valid Strongly disagree 1 .7 .8 .8
Disagree 22 16.4 17.2 18.0
Neutral 24 17.9 18.8 36.7
Agree 75 56.0 58.6 95.3
Strongly agree 6 4.5 4.7 100.0
Total 128 95.5 100.0
Missing System 6 4.5
Total 134 100.0
Page 103
93
One sample Statistics mean table
One-Sample Statistics
N Mean Std. Deviation Std. Error Mean
6.6 Interaction with the
system is clear and
understandable
132 3.74 .758 .066
6.7 It is easy to become
skillful at using the system
133 3.55 .821 .071
6.8 The system is easy to
use
132 3.52 .869 .076
6.9 Learning to operate the
system is easy
132 3.52 .833 .073
6.10 I have the confidence
to use HRIS at work
133 3.58 .846 .073
6.11 I have the knowledge
to use HRIS
128 3.49 .860 .076
Facilitating Condition
6.12 The HRIS system is compatible with other systems I use
Frequency Percent Valid Percent Cumulative
Percent
Valid Strongly disagree 3 2.2 2.3 2.3
Disagree 6 4.5 4.5 6.8
Neutral 58 43.3 43.9 50.8
Agree 55 41.0 41.7 92.4
Strongly agree 10 7.5 7.6 100.0
Total 132 98.5 100.0
Missing System 2 1.5
Total 134 100.0
Page 104
94
6.13 A specific person is available for assistance with system difficulties
Frequency Percent Valid Percent Cumulative
Percent
Valid Strongly disagree 3 2.2 2.2 2.2
Disagree 12 9.0 9.0 11.2
Neutral 20 14.9 14.9 26.1
Agree 77 57.5 57.5 83.6
Strongly agree 22 16.4 16.4 100.0
Total 134 100.0 100.0
6.14 I can call somebody for help if I get stuck
Frequency Percent Valid Percent Cumulative
Percent
Valid Strongly disagree 2 1.5 1.5 1.5
Disagree 11 8.2 8.2 9.7
Neutral 16 11.9 11.9 21.6
Agree 79 59.0 59.0 80.6
Strongly agree 26 19.4 19.4 100.0
Total 134 100.0 100.0
6.15 The organization supports the use of the system
Frequency Percent Valid Percent Cumulative
Percent
Valid Strongly disagree 2 1.5 1.5 1.5
Disagree 15 11.2 11.4 12.9
Neutral 48 35.8 36.4 49.2
Agree 53 39.6 40.2 89.4
Strongly agree 14 10.4 10.6 100.0
Total 132 98.5 100.0
Missing System 2 1.5
Total 134 100.0
Page 105
95
6.16 There are sufficient resources to support smooth implementation
Frequency Percent Valid Percent Cumulative
Percent
Valid Strongly disagree 2 1.5 1.6 1.6
Disagree 25 18.7 19.5 21.1
Neutral 46 34.3 35.9 57.0
Agree 52 38.8 40.6 97.7
Strongly agree 3 2.2 2.3 100.0
Total 128 95.5 100.0
Missing System 6 4.5
Total 134 100.0
6.17 There is sufficient technical expertise to give support to the users of HRIS
Frequency Percent Valid Percent Cumulative
Percent
Valid Disagree 25 18.7 19.1 19.1
Neutral 44 32.8 33.6 52.7
Agree 58 43.3 44.3 96.9
Strongly agree 4 3.0 3.1 100.0
Total 131 97.8 100.0
Missing System 3 2.2
Total 134 100.0
6.18 Availability and reliability of the internet connection is adequate for the
successful use of HRIS
Frequency Percent Valid Percent Cumulative
Percent
Valid Strongly disagree 5 3.7 3.8 3.8
Disagree 19 14.2 14.3 18.0
Neutral 26 19.4 19.5 37.6
Agree 67 50.0 50.4 88.0
Strongly agree 16 11.9 12.0 100.0
Total 133 99.3 100.0
Missing System 1 .7
Total 134 100.0
Page 106
96
One-Sample Statistics
N Mean Std. Deviation Std. Error Mean
6.12 The HRIS system is
compatible with other
systems I use
132 3.48 .796 .069
6.13 A specific person is
available for assistance
with system difficulties
134 3.77 .909 .079
6.14 I can call somebody
for help if I get stuck
134 3.87 .874 .075
6.15 The organization
supports the use of the
system
132 3.47 .886 .077
6.16 There are sufficient
resources to support
smooth implementation
128 3.23 .844 .075
6.17 There is sufficient
technical expertise to give
support to the users of
HRIS
131 3.31 .814 .071
6.18 Availability and
reliability of the internet
connection is adequate for
the successful use of HRIS
133 3.53 1.004 .087
Page 107
97
Social Influence
6.19 My colleagues think that I should use the system
Frequency Percent Valid Percent Cumulative
Percent
Valid Disagree 7 5.2 5.3 5.3
Neutral 29 21.6 21.8 27.1
Agree 87 64.9 65.4 92.5
Strongly agree 10 7.5 7.5 100.0
Total 133 99.3 100.0
Missing System 1 .7
Total 134 100.0
6.20 My supervisor thinks that I should use the system
Frequency Percent Valid Percent Cumulative
Percent
Valid Disagree 7 5.2 5.2 5.2
Neutral 26 19.4 19.4 24.6
Agree 92 68.7 68.7 93.3
Strongly agree 9 6.7 6.7 100.0
Total 134 100.0 100.0
6.21 Senior management encourage me to use the system
Frequency Percent Valid Percent Cumulative
Percent
Valid Strongly disagree 2 1.5 1.5 1.5
Disagree 18 13.4 13.5 15.0
Neutral 35 26.1 26.3 41.4
Agree 71 53.0 53.4 94.7
Strongly agree 7 5.2 5.3 100.0
Total 133 99.3 100.0
Missing System 1 .7
Total 134 100.0
Page 108
98
One-Sample Statistics
N Mean Std. Deviation Std. Error Mean
6.19 My colleagues think
that I should use the
system
133 3.75 .667 .058
6.20 My supervisor thinks
that I should use the
system
134 3.77 .648 .056
6.21 Senior management
encourage me to use the
system
133 3.47 .849 .074
Behaviour Intentions
6.22 It is my intention to use HRIS for work activities wherever applicable
Frequency Percent Valid Percent Cumulative
Percent
Valid Disagree 3 2.2 2.3 2.3
Neutral 11 8.2 8.3 10.5
Agree 86 64.2 64.7 75.2
Strongly agree 33 24.6 24.8 100.0
Total 133 99.3 100.0
Missing System 1 .7
Total 134 100.0
6.23 I plan to increase my usage of HRIS
Frequency Percent Valid Percent Cumulative
Percent
Valid Disagree 5 3.7 3.8 3.8
Neutral 16 11.9 12.1 15.9
Agree 79 59.0 59.8 75.8
Strongly agree 32 23.9 24.2 100.0
Total 132 98.5 100.0
Missing System 2 1.5
Total 134 100.0
Page 109
99
6.24 I intend to use HRIS as much as possible for work activities
Frequency Percent Valid Percent Cumulative
Percent
Valid Disagree 7 5.2 5.3 5.3
Neutral 15 11.2 11.4 16.7
Agree 76 56.7 57.6 74.2
Strongly agree 34 25.4 25.8 100.0
Total 132 98.5 100.0
Missing System 2 1.5
Total 134 100.0
One-Sample Statistics
N Mean Std. Deviation Std. Error Mean
6.22 It is my intention to
use HRIS for work
activities wherever
applicable
133 4.12 .640 .055
6.23 I plan to increase my
usage of HRIS
132 4.05 .719 .063
6.24 I intend to use HRIS
as much as possible for
work activities
132 4.04 .766 .067
Page 110
100
Present usage behaviour
6.25 I use HRIS daily when I do my work
Frequency Percent Valid Percent Cumulative
Percent
Valid Strongly disagree 16 11.9 12.0 12.0
Disagree 57 42.5 42.9 54.9
Neutral 16 11.9 12.0 66.9
Agree 43 32.1 32.3 99.2
Strongly agree 1 .7 .8 100.0
Total 133 99.3 100.0
Missing System 1 .7
Total 134 100.0
6.26 I have been using the system regularly in the past months
Frequency Percent Valid Percent Cumulative
Percent
Valid Strongly disagree 15 11.2 11.4 11.4
Disagree 36 26.9 27.3 38.6
Neutral 28 20.9 21.2 59.8
Agree 50 37.3 37.9 97.7
Strongly agree 3 2.2 2.3 100.0
Total 132 98.5 100.0
Missing System 2 1.5
Total 134 100.0
One-Sample Statistics
N Mean Std. Deviation Std. Error Mean
6.25 I use HRIS daily
when I do my work
133 2.67 1.078 .093
6.26 I have been using the
system regularly in the past
months
132 2.92 1.096 .095
Page 111
101
Use behaviour
6.29 On average how many times do you use HRIS in a week?
Frequency Percent Valid Percent Cumulative
Percent
Valid Never 21 15.7 16.7 16.7
Once a week 71 53.0 56.3 73.0
Twice a week 16 11.9 12.7 85.7
Three times a week 11 8.2 8.7 94.4
>3 times a week 7 5.2 5.6 100.0
Total 126 94.0 100.0
Missing System 8 6.0
Total 134 100.0
6.30 For how long have you been using HRIS?
Frequency Percent Valid Percent Cumulative
Percent
Valid <1 year 14 10.4 11.8 11.8
1 - <2 years 54 40.3 45.4 57.1
2 - <3 years 36 26.9 30.3 87.4
3+ years 15 11.2 12.6 100.0
Total 119 88.8 100.0
Missing System 15 11.2
Total 134 100.0
One-Sample Test
Test Value = 3
95% Confidence Interval of the
Difference
t df Sig. (2-tailed) Mean
Difference Lower Upper
PE 18.703 131 .000 .92929 .8310 1.0276
EE 9.156 133 .000 .56480 .4428 .6868
FC 9.622 133 .000 .52834 .4197 .6369
SI 12.021 133 .000 .66169 .5528 .7706
BI 18.204 132 .000 1.06767 .9517 1.1837
USAGE -2.489 133 .014 -.20896 -.3750 -.0429
TRAINING 3.321 131 .001 .23106 .0934 .3687