University of Melbourne 1 Funding Australia’s Future: From where do we begin? & Implications for Mutual ADIs Kevin Davis Professor of Finance, University of Melbourne Research Director, Australian Centre for Financial Studies (and Professor, Monash University)
Transcript
University of Melbourne 1
Funding Australia’s Future:From where do we begin?
& Implications for Mutual ADIs
Kevin Davis
Professor of Finance, University of Melbourne
Research Director, Australian Centre for Financial Studies (and Professor, Monash University)
University of Melbourne 2
Background and Objectives
• Funding Australia’s Future project at ACFS– Identify possible developments in demand
for and supply of finance– Implications for financial flows and financial
sector structure– Impediments to efficient financing
• Stage 1: three background papers– Release July 10, Sydney Conference Aug 7
• Stage 2: further commissioned studies on specific topics
University of Melbourne 3
Rationale and Issues
• Financial sector in continual state of evolution– Adjusting to technology, regulation,
changing pattern of real sector demand & supply of finance
• Future development will be influenced by current situation and recent trends
• What does Australian financial sector look like (vis a vis others) and why?
• Are recent trends transitory or long-lasting?• What are some scenarios?
– & policy and strategy issues
University of Melbourne 4
Session Overview
1. Major Post GFC changes
2. Special Characteristics of the Australian Financial Sector
3. Future-gazing
4. Mutual ADI issues
University of Melbourne 5
Post GFC Changes
• Initial table discussion• Identify 4-5 of the major changes in financial
trends post the GFC, whether they are likely to be permanent or transitory, and implications
• These could include aspects of: financial flows / patterns of financing; sectoral (household, corporate, govt, international) balance sheets; financial products; financial sector prices; financial sector structure; etc
• (We’ll then discuss and compare with my list)
University of Melbourne 6
1. Financial sector growth relative to GDP has ceased
Both activity level and asset valuation effects are relevant
* Table excludes assets of SMSF
Financial Institution Assets / GDP
1997 2007 2008 2009 2010 2011 20120.00
0.50
1.00
1.50
2.00
2.50
3.00
3.50
4.00
Securitisation Vehicles
General Insurance
Managed Funds
Superannuation
Life Offices
Registered Financial Corporations
ADIs
University of Melbourne 7
1. Financial sector growth relative to GDP has ceased (cont.)
Year*
1979 4.70%
1985 5.04%
1990 6.38%
1995 6.85%
2000 8.05%
2005 9.37%
2006 10.03%
2007 10.65%
2008 10.27%
2009 10.06%
2010 10.22%
2011 10.13%
2012 10.27%
Finance & Insurance: contribution to Gross Value Added
3 year spread (Government Bond less Term Deposit: Average overQuarter)
3 month spread (Bank Bill less Term Deposit: Average over Quarter)
With the result that…
University of Melbourne 15
6. Increasing scale and leverage of household balance sheets has paused
scaleleverage
Debt/ Assets
Housing Debt/
Housing Assets
Debt/ Income*
Total Assets/ Income
Financial Assets/ Income
Interest Payments/
Income
Housing Interest
Payments/ Income
Jun-1987 8.7 11.9 43.3 430.1 169.1 7.6 5.2
Jun-1997 11.6 18.6 74.7 560.4 222.0 6.1 4.7
Jun-2007 16.1 25.8 153.5 841.1 350.6 11.3 9.2
Jun-2008 17.1 26.9 150.9 787.6 318.3 13.1 10.8
Jun-2009 18.4 29.6 146.1 714.7 288.7 9.0 7.2
Jun-2010 17.3 26.9 152.2 783.8 302.1 11.1 9.0
Jun-2011 17.7 28.3 150.1 743.7 296.2 11.5 9.4
Jun-2012 18.2 30.0 148.0 723.6 299.2 10.4 8.5
University of Melbourne 16
Household financial asset composition changed
Deposits Shares Super/LifeUnfunded Super Other
Sep-90 29% 10% 36% 13% 11%
Sep-00 19% 19% 44% 9% 9%
Sep-07 15% 27% 46% 6% 5%
Sep-12 22% 16% 46% 11% 5%
University of Melbourne 17
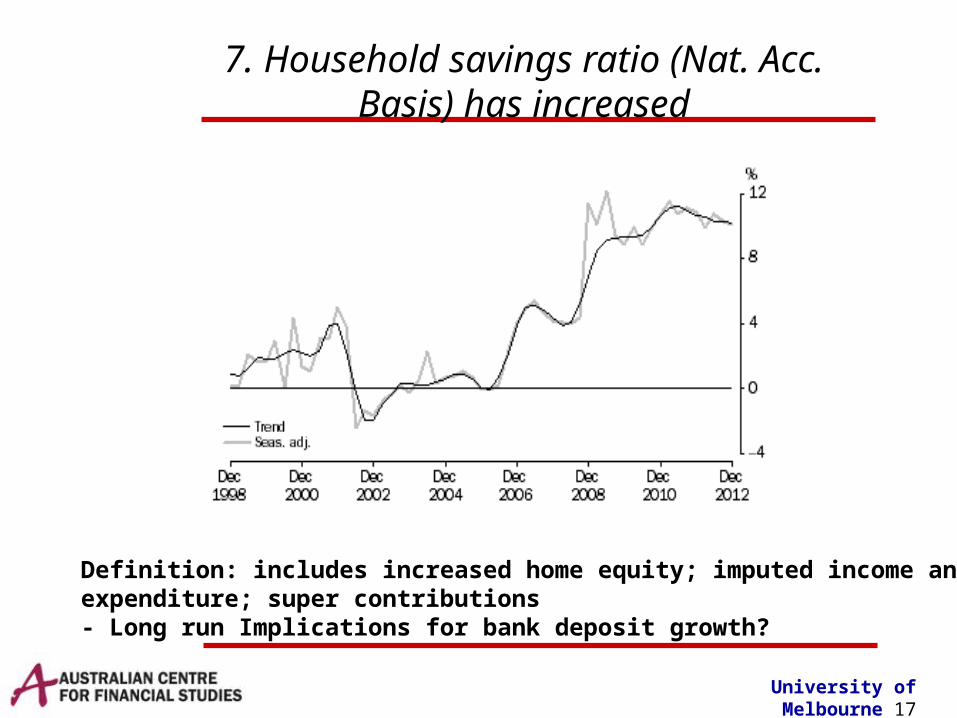
7. Household savings ratio (Nat. Acc. Basis) has increased
Definition: includes increased home equity; imputed income andexpenditure; super contributions - Long run Implications for bank deposit growth?
University of Melbourne 18
Change in household financial position
Jun-89 Jun-93 Jun-97 Jun-01 Jun-05 Jun-09-10.0%
-8.0%
-6.0%
-4.0%
-2.0%
0.0%
2.0%
4.0%
6.0%
8.0%
Value Transactions
Source: ABS cat 5230.0 Table 20
Four Quarter Moving Average
University of Melbourne 19
Household Sector: Net transactions:
Jun-90 Jun-94 Jun-98 Jun-02 Jun-06 Jun-100
5000
10000
15000
20000
25000
30000
35000
40000
Deposits Super Borrowings
eight quarter moving average
University of Melbourne 20
8. Long term downward share of NBFI lending to households ended
• Mid 1980s: Banks 2/3; NBFIs 1/3• 2007: Banks 2/3; Securitisers 1/5; NBFIs~ 10%• 2012: similar to 2007• Few NBFIs left• Share of loans for investment housing increased
from 15% in mid 1990s to 30% at GFC and constant since.
• Share of owner-occupied housing loans relatively stable at around 60%
University of Melbourne 21
9. Gradual decline in corporate leverage in the decades prior to the GFC ceased
Liabilities = Debt + Market Value of Equity
1988
1990
1992
1994
1996
1998
2000
2002
2004
2006
2008
2010
2012
0.00
0.10
0.20
0.30
0.40
0.50
0.60
0.70
Gross Leverage (Debt/Total Liabilities)
Net Leverage (Debt - Financial assets)/(Total Liabilities - Financial Assets))
University of Melbourne 22
10. Increase in net funding of the business sector by households and the ROW relative to financial sector
Inter Sectoral Net Financial Claims ($billion, at September) Net financial claims of On 2002 2007 2012 Household Non-Financial Corporations 87 219 357 Rest of World Non-Financial Corporations 223 383 613 Financial Corporations Non-Financial Corporations 354 862 677
Recent RBA research: large business gross saving by foreign owned minersRetained earnings count as income debits on BOP current a/cCorresponding (offsetting) capital inflow creditBanks have ceased to be main vehicles for funding BOP
University of Melbourne 23
14. Finance Sector Funding of BOP declined
Finance & Insurance Share of International Liabilities
0.46
0.48
0.5
0.52
0.54
0.56
0.58
0.6
2007 2008 2009 2010 2011 2012
Source: ABS 5302 Table 84
University of Melbourne 24
11. Corporate accumulation of financial assets slowed markedly after the GFC
• Corporate sector holdings of financial assets– increased 13.2% p.a. over 2002 – 2007– increased 3.1% p.a. 2007 - 2012
• Main changes– share holdings: -5.1 % p.a. v 12.1% p.a
(partly valuation effects)– accounts receivable growth slowed from
17.3% to 4.3% p.a.
University of Melbourne 25
12. Decline in Government Debt/GDP over the prior decade was reversed
Government Lending/GDP
-8.00-6.00-4.00-2.000.002.004.00
1997 2002 2007 2012
Pe
rce
nta
ge
Federal Govt Federal Authorities
State Govt State Authorities
University of Melbourne 26
13. Increased holdings of Federal Govt debt by the ROW.
• Table Discussion• In what ways does the Australian financial
system differ from those found in other advanced economies? Are there any implications for business opportunities, risks etc for ADIs
• Differences could relate to types of institutions; financial markets; financial products; demand, supply and allocation of finance; etc
University of Melbourne 28
Current Features of Australian Financing Patterns
1. banks and superannuation funds dominate the financial sector, holding approximately ¾ of financial sector assets.• relatively few financial assets held by non-prudentially
Relative to GDP, Australia’s domestic bond market is of comparable size to most other OECD countries
Private Debt Securities/GDP: 2010
0.0020.0040.0060.0080.00
100.00120.00140.00160.00180.00200.00
Austra
lia
Austri
a
Belgium
Canada
Denmar
k
Finlan
d
Franc
e
Germ
any
Hong K
ong S
AR, Chin
a
Icela
nd
Irelan
d
Japa
n
Luxe
mbo
urg
Nether
lands
Norway
Singap
ore
Sweden
Switzer
land
United K
ingdom
United S
tate
s
But few non-financial corporate issues
University of Melbourne 33
The Australian banking sector is of comparable size to that of other OECD countries
• bank assets/GDP = 131.4 in 2010 versus median bank assets/GDP = 130.9 for the OECD). – (There is significant dispersion in this
measure with the USA = 64.6 and the UK = 202.6).
• Similarly bank deposits/GDP of 98.8 (a lower figure reflecting the role of wholesale and equity funding of assets) is close to the OECD median
University of Melbourne 34
But “Bloody Big Building Societies”
Residential real estate loans to total loans
Commercial real estate loans to total loans
Australia 62.7 9.7 Canada 34.7 2.9 China 15.8 6.8 Germany 16.7 5.7 Ireland 29 15.5 Italy 18.7 8.8 Korea 21.8 20.6 Norway 41.4 2 Portugal 32.9 10.4 South Africa 32.8 9.5 Switzerland 33.6 6.8 UK 16.2 3.6 USA 35.6 15.8
University of Melbourne 35
Household sector a net borrower from banks.
• Bank deposits $660 bill; loans from banks $1,130 bill.• Household equity in super and insurance $1,491 billion• shares in financial corporations $151 billion, prepaid
insurance premiums $54 billion. • Loans from securitisers $310 billion; loans from other
depository corporations $100 billion. • Net claims on financial corporations overall (incl. super)
of around $857 billion.• Since 1990s share of financial assets in household total
assets has been relatively stable (37 to 42 per cent)– increased value of superannuation assets largely
matched by increased valuations of housing.
University of Melbourne 36
Aggregate Household balance sheet not unusual by international standards
Household Assets and Liabilities (relative to Disposable Income)
0
100
200
300
400
500
600
700
Non Financial Assets
Financial Assets
Debt
Sources: OECD Economic Outlook No. 92 (database); RBA Bulletin
University of Melbourne 37
Low Corporate Leverage
University of Melbourne 38
Limited Corporate Use of Debt Capital Markets
Corporate Liabilities
0.0
0.5
1.0
1.5
2.0
2.5
2006 2007 2008 2009 2010 2011 2012
Year (Sept)
$ T
rilli
on
bills of exchange One name paper Bonds, etc.
Loans and placements Shares and other equity
University of Melbourne 39
Low Government Debt/GDP
Country Gross Government Debt /GDP 2012AUS 27CAN 88CHN 22DNK 47FRA 90DEU 83ITA 126JPN 237KOR 33ESP 91GBR 89USA 107
University of Melbourne 40
Finance and Insurance Sectors: Share of Gross Value Added
Year Gross Value Added
Australia 2010 10.6%
Canada 2008 6.6%
France 2011 4.7%
Germany 2011 5.2%
Italy 2011 5.4%
UK 2011 8.3%
USA 2012 7.9%
Figures – treat with caution, but…Explanations?
University of Melbourne 41
Equity Bias in International Investments
Australian foreign financial asset holdings
-
100
200
300
400
500
600
700B
illi
on
Sep-2000 Sep-2004 Sep-2008 Sep-2012
Share of FDI in stock of overseas assets has fallen from over 40% atstart of 2000’s to around 30% (growth of superfund portfolio investment)
University of Melbourne 42
Significant Financing by Rest of World
External Financial Liabilities and Assets
0
500000
1000000
1500000
2000000
2500000
1995
1996
1997
1998
1999
2000
2001
2002
2003
2004
2005
2006
2007
2008
2009
2010
2011
2012
Australian financial assets held by ROW
ROW financial assets held by Australia
University of Melbourne 43
Foreign Direct Investment (Stock)
Inward Stock of FDI / Stock Market Capitalization
0% 20% 40% 60% 80% 100% 120%
JapanKorea,
USACanada
MalaysiaUK
BrazilAustralia
FranceSpain
GermanyTaiwan
Italy
University of Melbourne 44
Net Stock of FDI
Net Stock of Inward FDI (USD mill): 2011Largest net recipients G7 (& 7 of 10 largest net providers)China 1440000 Canada -75415Brazil 467084 Italy -179528Mexico 190221 Germany -504464Australia 172790 United Kingdom -532216Indonesia 152427 France -628203Poland 147494 Japan -737005Turkey 112354 United States -1772778Czech Republic 109776Russian Federation 95373India 90475Chile 89128Source: http://www.oecd.org/statistics/
Outward FDI relatively low (but lots of portfolio investment)
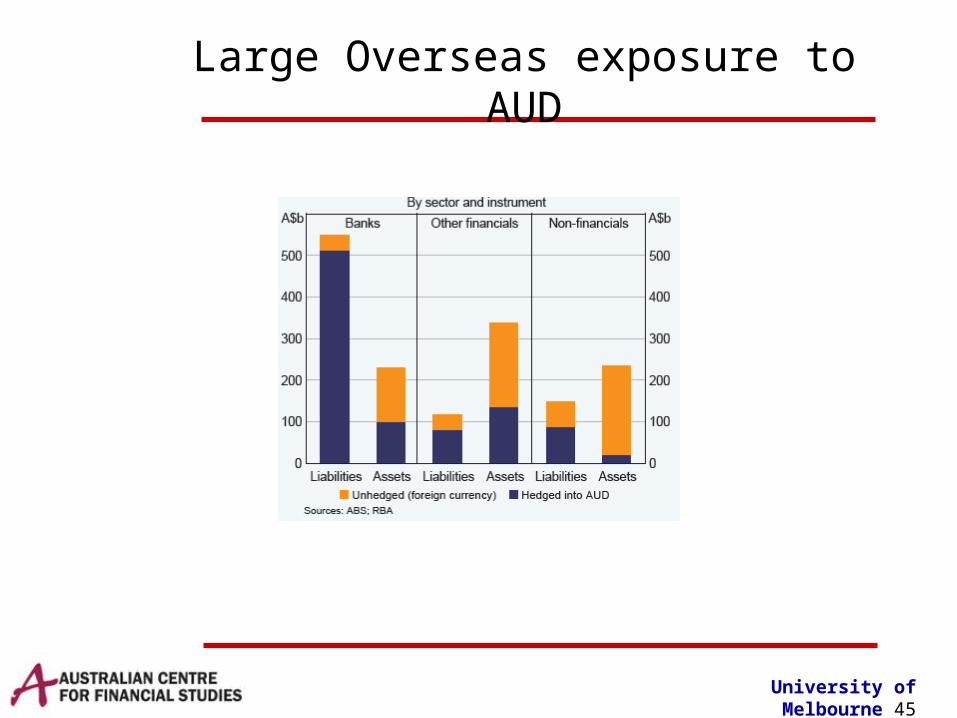
University of Melbourne 45
Large Overseas exposure to AUD
University of Melbourne 46
Sector Financial Positions: Dec 2012 ($Trillion)
Owed by to
Assets / liabilitiesInclude equity& debt
University of Melbourne 47
An Overview
• Financial sector not markedly different to others, but:– Household savings flow into super for ultimate
investment– Households major borrowers from banks– Australian companies use less debt– Large ROW financing: was a large role for bank
borrowing– Small Aust. corporate and government bond
market– Large financial sector by developed world
standards
University of Melbourne 48
Thinking about the Future
• GFC provided transitory shock to financing patterns– But unleashed regulatory reform with major
implications for future financing patterns– Took attention away from long term issues
• Financing patterns haven’t fully adapted to implications of compulsory superannuation– Flows of funds, liquidity creation
• Tax system features are a major influence– Incentives for household sector risk taking– Patterns of corporate financing
• Structural changes in financing likely
University of Melbourne 49
Financial System Structure “Lagging”
• Superannuation has “re-routed” financial flows– Household savings increasingly fund securities
investments, not lending and real sector project assessment (or the creation of securities)
– Some credit / project risk appraisal by super funds and new security creation - commercial property, infrastructure.• Should there be more (super & home
mortgages?)• What are consequences of increasing ownership of
national capital stock by super for: achievable returns, innovation & entrepreneurship, capital stock growth?
University of Melbourne 50
Financial System Structure “Lagging”
• Long-term household portfolio balance
– Short run dynamics complicated: deposits = money• Banking sector still focused on “liquidity creation” (eg LT
housing loans, ST deposits)– Even though large stock of illiquid savings exists
(super)– Basel 3 “penalizing” bank liquidity creation
• Potential Outcomes– Bank funding via superfund investments?
• Deposit and bond products (including for SMSF)– Bank securitisation of assets, loan sales (eg
syndications)• But level of credit risk assessment skills outside
banks?– Less “commercial” more “investment” banking
• Corporate bond, equity issuance underwriting• Logic of deposit guarantees for universal banks?
– Bank structure implications?– Superfund involvement in asset creation
• Joint ventures with experts in risk assessment• In house risk assessment capabilities
University of Melbourne 53
Infrastructure Investment
• Large stock of long term savings (super) available, but:– “Greenfields” project risk (and tender costs)
• PPPs not the answer: How best to share risks?– Should government bear demand (but not
construction) risk?– “Tranching” claims and risk (securitisation)?– Pooling risk of many projects?
– “Brownfields” risk and illiquidity• Liquid claims on illiquid assets can be created • Investment structures enabling diversification• But low expected returns on low risk projects?
University of Melbourne 54
A super tax conundrum
• Dividend Imputation• Tax concessions for super• Both
– Particularly zero tax rate concessions
If all Australian equities are held by zero tax rate investors, corporate tax revenue is effectively zero – a growing Federal Budget problem!
University of Melbourne 55
Corporate Bond Market Development
• Super growth suggests demand side should be there• Basel 3 incentives for debt capital markets v on-balance
sheet lending - securitisation, corporate debt finance• Government initiatives for easier issuance• But
– Imputation: no tax bias to debt v equity funding• Except for foreign owned companies
– Investor ability to assess credit risk– Investor ability to diversify credit risk– Investor “equity bias” – imputation and capital gains
tax concession – is it super equity bias excessive?– Bank bond issues are competition
• But tendency to be “non-vanilla” (to qualify as regulatory capital)
– Financial Claims Scheme - risk free alternative
University of Melbourne 56
BOP Funding & Financial Market Development
• If less bank funding of current account deficit– More portfolio and FDI investment inflow
• Including govt debt purchases• Retained earnings of foreign owned cos.
– One of the largest net FDI recipients• Is imputation a disincentive to offshore expansion?
• Unlike domestic firms, foreign owned firms have tax incentives for debt financing– Either in domestic or offshore capital markets
University of Melbourne 57
Some Policy Issues: Financing Inadequacies
• Popular concerns (but not “evidence based”)– SME and venture capital– Infrastructure– Real estate investment bias– Retirement savings products– Equity bias– Banking competition, profits, systemic risk– Corporate bond market absence– “Too much finance”
University of Melbourne 58
Some Policy Issues: regulation and risk bearing
• What perimeter for prudential regulation?• Currently relative few assets held by non-
prudentially regulated financial institutions– Overseas interest in “ring fencing”
• But: Basel 3 should increase supply of capital market assets; demand from SMSF growth; incentives for advisers, product creators
• Personal loan markets– Credit reporting, alternative lenders
• Mortgage markets– Securitisation, new lenders / originators
• Financial advice, transactions services
University of Melbourne 60
Conclusion
• Structural changes in financial sector inevitable– Patterns of financial flows have changed– Competitive advantages have changed– Regulation has changed
• Real sector adjustments also relevant– Industry sector changes – potentially different
– Demography – demand for financial products– Income distribution – implications of open economy
and low cost international competition for “low skilled” employees
University of Melbourne 61
Conclusion: Mutual ADI future
• What competitive advantages for mutual ADIs?• Financial sector functions are: overcoming information
problems, reducing transactions costs, providing diversification and risk management services, transferring financial resources between individuals (lending / borrowing) and over time (wealth management), enabling payments
• Technology has radically changed information flows, transactions costs, creation of alternative financial products and markets etc.
• Maybe few advantages in the technical “production process” of financial services and products
• But ultimately dealing with individuals and their behavioral biases – does mutuality / customer owned banking provide an advantage and if so, how?