University of Michigan Health System Program and Operations Analysis Improve the Efficiency of the Cancer Center Infusion Pharmacy Staffing Final Report Prepared For: Kelly Wright University of Michigan Health System Cancer Center Infusion Pharmacy, Manager Kim Redic, Coordinator University of Michigan Hospital System Investigational Drug Services, Coordinator Robert Beasley Management Engineer Fellow Zachary Shoup Management Engineer Fellow Mark Van Oyen Professor, IOE 481 Brock Husby Graduate Student Instructor, IOE 481 Prepared By: Lindsay Klug Industrial and Operations Engineering Undergraduate Matthew Mulvey Industrial and Operations Engineering Undergraduate Kyle Spresser Industrial and Operations Engineering Undergraduate Date Submitted: April 27, 2009
Transcript
University of Michigan Health System
Program and Operations Analysis
Improve the Efficiency of the Cancer Center Infusion Pharmacy Staffing
Final Report
Prepared For: Kelly Wright University of Michigan Health System Cancer Center Infusion Pharmacy, Manager
Kim Redic, Coordinator University of Michigan Hospital System Investigational Drug Services, Coordinator
Robert Beasley Management Engineer Fellow
Zachary Shoup Management Engineer Fellow Mark Van Oyen Professor, IOE 481 Brock Husby Graduate Student Instructor, IOE 481
Prepared By: Lindsay Klug
Industrial and Operations Engineering Undergraduate
Matthew Mulvey Industrial and Operations Engineering Undergraduate
Kyle Spresser Industrial and Operations Engineering Undergraduate
Date Submitted: April 27, 2009
i
Executive Summary Background The Cancer Center Infusion (CC INF) Pharmacy prepares and administers chemotherapy, non-chemotherapy and investigational (IDS) drug orders for cancer outpatients at the University of Michigan Hospital. The pharmacy has 6.5 FTE and 2 contingent pharmacists, as well as 10 FTE pharmacy technicians. The CC INF pharmacy was experiencing a perceived increase in staff workload and patient complaints about increasing turnaround times through verbal patient feedback and comment cards. The CC INF manager and IDS coordinator asked the IOE 481 Group 2 team to conduct an analysis to determine the best sequence of work for the pharmacists and pharmacy technicians to relieve these issues. This included creating quantifiable metrics for pharmacy performance and modifying the staffing schedule to maximize percent utilizations of the biological safety cabinets (work hoods). A perception in the pharmacy was that IDS drug orders were taking more time to prepare than non-IDS drug orders. As a result, the team also analyzed IDS product preparation times in comparison to non-IDS products. Methods The team observed the current process and developed flow chart diagrams that highlighted tasks performed in the CC INF pharmacy. The team also conducted literature research to find methods put in place in other pharmacies around the nation that increased efficiency and decreased patient wait times. Next, to analyze total pharmacy times for drug orders, the team combined the two database collection systems used in the CC INF pharmacy, Arrival Data and Worx CC Workload Data. This data was then cleaned to eliminate all non-compliant data entries and secondary drugs not needed for analysis. Interviews were conducted with pharmacists and pharmacy technicians to identify problems and understand performance perceptions. The team also had the pharmacy technicians collect data on product preparation times in the work hoods, which would later be used in a simulation of the process to analyze hood utilizations. Findings Through the team observations of the CC INF Pharmacy and interviews with the Pharmacy staff the team was able to determine the following:
• The CC INF Pharmacy has not had any regular staff meetings since Fall 2008 • Many members of the staff employ different methods to complete the same task • Interruptions are the largest complaint of the CC INF Pharmacy staff • Drug orders currently entering should exit in a first in – first out manner, but some
preferences are given at the discretion of the staff During the team’s literature research, a project with similar goals was conducted at the Cancer Center Pharmacy at Midwestern Regional. During their project, this hospital implemented the following main tasks:
• Sorted drug orders by complexity • Changed staffing patterns to meet high chemotherapy demand times • Implemented Lean Thinking methodology • Eliminated non-value added steps in the process
ii
• Created new standardized operating procedures • Improved and standardized the order entry process
After implementing the following changes, this Cancer Center Pharmacy was able to reduce the turnaround time by 20%. They reduced the steps in the process by 50% and established regular meetings to inform staff members of frequent changes to continually improve the process. Additional, Metropolitan hospital pharmacy in Grand Rapids, MI reduced their dispensing errors 40% by implementing a staff “Safe Zone” and a “To Go” zone. These zones eliminated interruptions when a pharmacy staff member was working on a drug order. After combining the two data collection systems, the team came across large variability in the pharmacy times and noticed that among CC INF staff, there was only a 60% compliance rate with the Arrival data collection system. CC INF staff members were not all familiar with how to track the patients using the system. In addition, nurses over time have lost trust in the system due to compliance issues and data variability; as a result, nurses interrupt the window pharmacy technician to ask about the status of a patient’s drug order, which triggers a domino effect of interruptions throughout the pharmacy, adding to the time a drug order spends in the pharmacy. It was perceived among the CC INF staff that scheduled day-before drug orders took less time in the pharmacy than same day on-demand drug orders. The team further analyzed this and found that day-before drug orders took, on average, seven minutes longer in the pharmacy than on-demand drug orders. The team believes this is attributed to the on-demand drug orders being given priority over day-before orders. The team found the highest volume of drug orders occurred on Tuesdays and Wednesdays. In addition, during an average workday, 9am to 11am had the highest volume of incoming drug orders. When comparing volume of drug orders by time of day to the current staffing schedule, the team found there was insufficient staffing from 8am to 11am during the week. The team believes this conclusion is beneficial in determining staffing schedules for a new part-time pharmacy technician the CC INF manager plans to add to the workforce. A simulation was run using work hood product preparation times collected by the pharmacy technicians, and arrival distributions gathered from the Arrival data collection system. The team found the simulation further supported the high workload from 7am to 12pm, with hood utilizations averaging at about 93%. Adding the new part-time technician from 7:30am to 11:30am decreased this average hood utilization to about 77% during this same timeframe. Investigational drugs (IDS drugs) were found to have very similar trends in demands during the day when compared to chemotherapy drugs. IDS drugs, on average, spend less time in the CC INF pharmacy than non-IDS drugs. A two-sample t-test with a 95% confidence interval found five IDS drugs took statistically significant more time in the pharmacy than their non-IDS counterpart. Only one IDS drug took statistically significant less time than their non-IDS counterpart did.
iii
Recommendations The team was asked to analyze the current Cancer Center Infusion Pharmacy sequence of work, staffing schedule, hood utilization, and develop quantifiable metrics to measure the pharmacy’s performance. Based on the goals and findings of the Cancer Center Infusion Pharmacy analysis the team suggests the following recommendations:
• Sort drug orders by complexity; less complex drug orders(i.e. less time to prepare) should be given a higher priority
• Redesign the current database collection systems – Allow the system to track individual components of multiple drug regimens – Eliminate the redundancy and multiple ways to perform the same task – Retrain the CC staff to use the updated system – Key terms should be standardized to avoid confusion
• Standardize Arrival system usage of hospital staff • Retraining hospital staff on proper use of the Arrival system • Eliminate overtime and add part time staff member working from 7:30am to 11:30am • Eliminate interruptions and implement a “Safe Zone” for all CC INF Pharmacy staff
Conduct daily/weekly staff meetings for the CC INF Pharmacy to allow continual improvement and to update the staff of any changes in the current procedures
• Give equal priority to Day-Before and On-Demand drug orders Decrease the numbers of drugs in each IDS instruction manual
• Provide and addition copy of each IDS manual • Provide training for pharmacists on how to use the electronic IDS instruction manuals
7.1 Literature Research .............................................................................................................. 5 7.1.1 Interruptions at Metropolitan Hospital Cancer Center ........................................................................... 6
7.3.1 Drug Order Times .................................................................................................................................... 7 7.3.2 Data Collection Systems .......................................................................................................................... 8 7.3.3 Data Collection Variability ..................................................................................................................... 8 7.3.4 Volume of Drug Orders by Day of Week ................................................................................................. 9 7.3.5 Volume of Drug Orders by Time of Day ................................................................................................ 11 7.3.6 CC INF Staffing vs. Volume of Drug Orders by Time of Day ................................................................ 12 7.3.7 Volume of IDS Drug Orders by Day of Week ........................................................................................ 13 7.3.8 Volume of IDS Drug Orders by Time of Day ......................................................................................... 14
7.3.8.2 IDS DRUG PREPARATION INSTRUCTIONS ...................................................... 17
7.4 On-Demand vs. Day-Before Drug Orders ......................................................................... 17 7.5 Interviews with CC INF Staff ............................................................................................ 18
7.5.1 Retraining/Standardization .................................................................................................................... 18 7.5.2 Environment of CC INF ......................................................................................................................... 18 7.5.3 Sequence of Work .................................................................................................................................. 19 7.5.4 Error Prevention .................................................................................................................................... 19
7.6 Data Collection by Pharmacy Technicians ........................................................................ 19 7.6.1 Simulation .............................................................................................................................................. 19
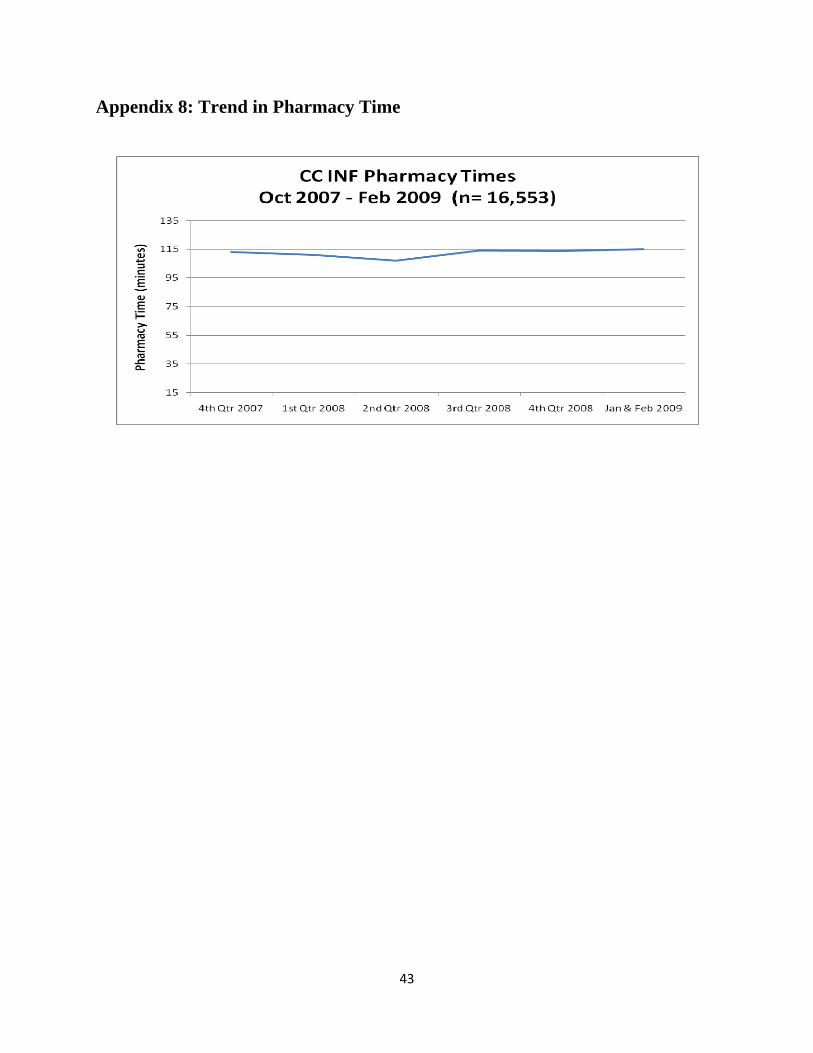
APPENDIX 8: TREND IN PHARMACY TIME ..................................................................... 43
vi
List of Figures and Tables Figures 1) General overview flowchart of CC INF pharmacy drug order preparation process ............ 7 2) Histogram of Bortezomib total pharmacy time (August 2008 – Feb 2009; n = 1,982) ....... 8 3) Volume of drug orders by day of week (Feb 16 – 28, 2009; n = 372) ................................ 9 4) Volume of drug orders by day of week (Aug 2007 – Feb 2009; n = 16,478) ................... 10 5) Volume of drug orders by day of week by Quarter (Oct 2007 – Dec 2008; n = 14,849) .. 10 6) Volume of drug orders by time of day (Feb 16 – 18, 2009; n = 413) ................................ 11 7) Volume of drug orders by time of day by 2008 calendar quarters (n = 11,301) ............... 12 8) Volume of drug orders by time of day (Feb 16 – 28, 2009; n = 747) ................................ 13 9) Volume of IDS drug orders by quarter (Oct 2007 – Dec 2008; n = 1,618) ....................... 14 10) Volume of IDS drug orders by time of day (Aug 2007 – Feb 2009; n = 1,886) ............... 14 11) Volume of IDS & Non-IDS drug orders by time of day (Aug 2007 – Feb 2009) ............. 15 12) Boxplot of Day-Before vs. On-Demand total pharmacy time (n = 17,373) ...................... 17 13) Simulation of drug product preparation process ................................................................ 20
Tables 1) Descriptive statistics for Non-IDS vs. IDS drug order total pharmacy time comparison . 16 2) Current staffing for pharmacy hood technicians ................................................................ 20 3) Hood percent utilizations under current staffing model .................................................... 21 4) Hood percent utilizations under proposed staffing model ................................................. 21 5) Recommended pharmacy hood technician staffing model ................................................ 24
1
1 Introduction The Cancer Center Infusion (CC INF) Pharmacy at the University of Michigan Health System (UMHS) carefully prepares and administers specific drug orders for cancer outpatients. The CC INF is experiencing an increase in the number of patients and the number of items dispensed, and according to the CC INF manager, there are opportunities to increase throughput. Each drug order is prepared by combining different drugs and diluents into a single container that a nurse later administers to a patient via intravenous infusion. There are over 800 possible drug product combinations; 95 percent of the drug orders spend over 30 minutes in the dispensing process in the CC INF Pharmacy before being administered to the patient. According to the CC INF Pharmacy manager’s perceptions, the CC INF staff, which includes pharmacists and pharmacy technicians, is overwhelmed with erratic workloads and often have difficulty scheduling time for lunches or full breaks. In addition, verbal Infusion Pharmacy patient feedback and patient comment cards have shown that patient satisfaction has decreased over the past year due to an increase in pharmacy turnaround times. The CC INF Pharmacy manager would like to address this issue and increase patient satisfaction. To address these issues, the IOE 481 student team observed the current process, analyzed data, and identified opportunities for improvement. The purpose of this report is to highlight the team’s methods, findings, conclusions, and recommendations to increase the efficiency of the CC INF pharmacy drug order preparation process.
2 Background According to the CC INF pharmacy manager, the volume of drug orders at the UMHS CC INF pharmacy has increased from 2006 to 2007, and started to plateau from 2008 to 2009 (See Appendix 1). The CC INF drug order process begins with a doctor’s request that a drug order1 to be made. A request for a drug order can either be received in advance (day-before) or on-demand. First, a registered nurse designates that a patient has arrived and is ready for treatment in the Arrival2 system database. A pharmacist receives this drug order via fax or retrieves the order from the hospital document imaging system and enters the order into the pharmacy computer system. Next, a second pharmacist performs an independent double-check of the order entry for clinical appropriateness and accuracy of order entry. The pharmacy system creates the label; the label and order are handed off to a pharmacy technician. The pharmacy technician collects all items necessary for drug preparation, which include the various drugs and equipment, and places all items in a box for transport. A second technician then grabs the next order to be prepared, in a first-in first-out (FIFO) manner, and goes to prepare the order in a biological safety cabinet (work hood). After the technician prepares the order, the pharmacist checks the completed drug order to ensure that it was prepared correctly. If the drug order was made correctly, the pharmacist signs the
1 Drug order: prescription written for one or more intravenous medications Completed drug order: finished CC INF drug 2 Arrival system database: tracks a patient's locations throughout the CC.
2
order and then gives it to the pharmacy technician assigned to workflow for the day. This technician then places the completed order on the correct pick-up shelf, indicates that the medication is ready electronically in the Arrival system and a nurse or medical assistant come to pick up the medication from the pharmacy. Lastly, the medication(s) are delivered to the chair side/bedside nurse for administration to the patient. The CC INF pharmacy prepares the following three types of drugs daily:
It was perceived that IDS drugs take longer to prepare since they are more complex. IDS drugs require instruction manuals listing the steps and procedures for preparation. The Cancer Center Infusion Pharmacy has 6.5 full-time equivalents (FTEs) and 2 contingent pharmacists. The CC INF Pharmacy also has 10 full-time pharmacy technicians. One pharmacist and one technician are assigned daily to an offsite satellite pharmacy. Average daily staffing in the CC INF pharmacy consists of 4.5 pharmacist FTEs and 9 technician FTEs. The CC INF pharmacy has 7 work hoods that the pharmacy technicians must use to prepare the medications in order to meet safety and sterility requirements. Each hood is occupied by one pharmacy technician, which leaves the remaining pharmacy technician(s) to rotate bins and triage work in the Infusion Pharmacy. Within the next six to twelve months, the CC INF manager expects that one of the work hoods will be removed and relocated to make room for a robot that will help the CC INF staff by physically making drug orders. Although orders may be written in advance, doses are prepared in an on-demand system. According to Arrival system data, approximately 40 to 50% of patient orders are currently coming into the pharmacy the night before a patient arrives for treatment, and approximately 50 to 60% of the orders are received on-demand, coming the same day the patients arrive for treatment. However, due to United States Pharmacopeia, chapter 797 guidelines, intravenous medications prepared in the CC INF satellite pharmacy must be prepared no more than 12 hours in advance. Also, due to individual drug stability limitations, many drugs must be prepared and used immediately. In addition, drug orders may be changed based on a patient’s laboratory results or following assessment by the M.D. on the day of scheduled treatment. Since many of the chemotherapy medications costs $1,000 - $10,000, the CC INF pharmacy manager wants to avoid waste. For these reasons, the Infusion Pharmacy is running a FIFO on-demand system. According to the CC INF nursing staff, verbal patient feedback has indicated that the number of patient complaints has increased. Patients have expressed frustration with wait times and prolonged infusion appointments. Many patients often note that they see patients who arrive later treated before them. Patients are not aware that their wait time is proportional to the complexity of the order; more complex drug orders take more time to prepare. Patient load is greatest Monday through Wednesday, and sometimes a rush of patients will come in the late afternoon. However, pharmacists and pharmacy technicians have a fixed schedule and will
3
come to work and leave at the same times every day. According to the CC INF manager, pharmacists and pharmacy technicians prefer standard dayshift hours (i.e. start times between 6-9AM and end times between 2:30-5PM). As a result, patient loads and CC INF pharmacy staff schedules are not optimizing the use of the currently available equipment, such as work hoods, in the pharmacy. The team has analyzed in detail the current state of the CC INF Pharmacy process using several methods to analyze sequence of work, hood utilization, and staffing schedules in the pharmacy. Because the CC INF works with high-risk drugs and treatment procedures, improving the efficiency of the CC INF pharmacy drug preparation and dispensing process without compromising patient safety has been the top priority for this project.
3 Key Issues The following key issues have been driving the need for this project:
• Pharmacists and pharmacy technicians feel overworked, leading to employee dissatisfaction, based on staff and management perceptions and employee surveys.
• Cancer patients are dissatisfied with wait times to receive scheduled medications, based on UMHS verbal infusion pharmacy patient feedback and comment cards.
• CC INF pharmacists and pharmacy management believe that staffing schedules may be inappropriate, leading to workflow inefficiencies and patient safety issues.
• Investigational drug orders are increasing, as a percentage of total orders prepared, and there is concern these orders may be creating bottlenecks in the current dispensing process. (Note: It is perceived that IDS orders require more time to prepare than other orders.)
4 Goals and Objectives The primary project goals were to determine the best sequence of work for pharmacists and pharmacy technicians in the Infusion Pharmacy, and determine an optimal staffing model to meet current daily patient fluctuations, improving the efficiency of the CC INF process without compromising patient safety. To achieve these primary goals, the team has performed a root cause analysis and developed recommendations to improve the efficiency of the CC INF process. Specifically, the team has done the following:
• Identified non-value added work, incidental work, and opportunities for process improvements to decrease patient turnaround times
• Identified appropriate metrics to analyze tasks involved with the CC INF process Compare drug preparation by time of day Compare IDS vs. non-IDS preparation times Model hood utilization
• Developed recommendations outlining how to best sequence work in the CC INF • Recommended future studies
4
5 Project Scope The scope of this project included only the CC INF pharmacy drug order dispensing process. The process begins when the pharmacy receives an order from the nurse in the clinic and ends when the finished order leaves the pharmacy. This project has investigated potential categories for types of drug orders to determine the best way to sequence or triage orders. The scope of this project excludes any tasks not performed within the pharmacy. Specifically, the team did not study tasks or activities associated with the incoming order procedure, the infusion clinic, or patient waiting rooms. In addition, this project did not include analyzing future construction and infusion pharmacy room layout to accommodate for the robot.
6 Approach and Methodology This section describes the specific tasks that were performed to collect and analyze data in the CC INF Pharmacy. These tasks include initial observations and flowcharting, historical databases extraction, CC INF staff interviews, and data collection by the pharmacy technicians.
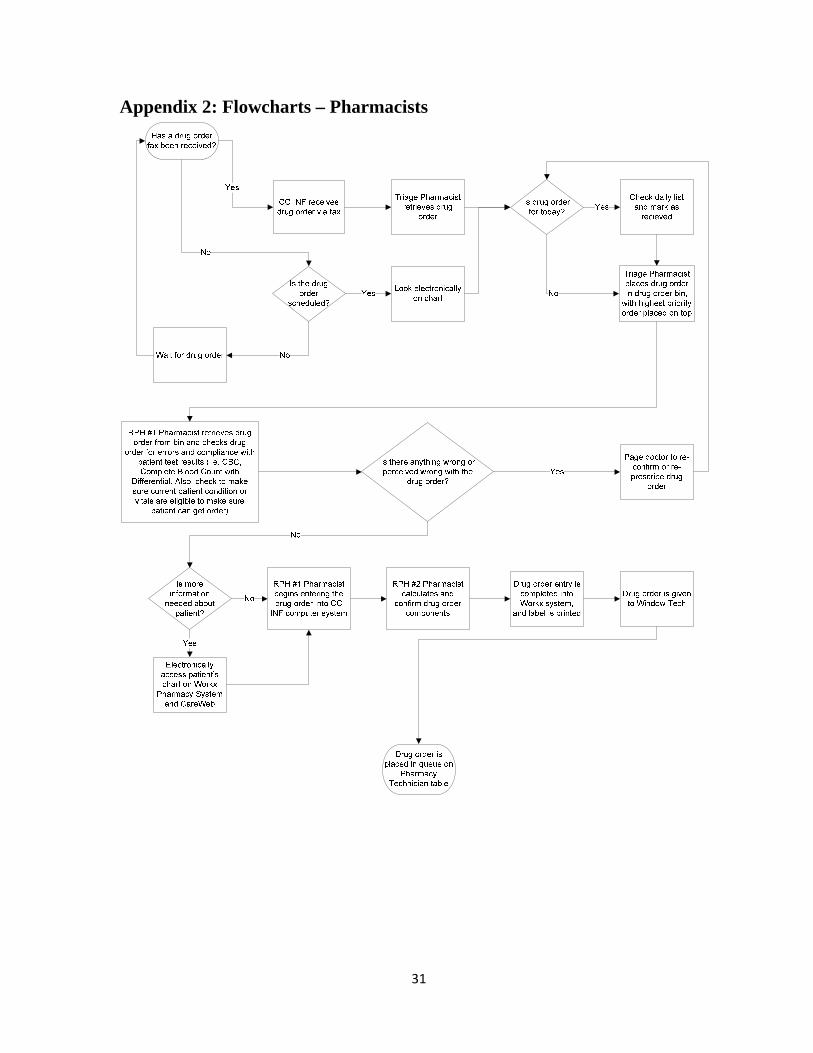
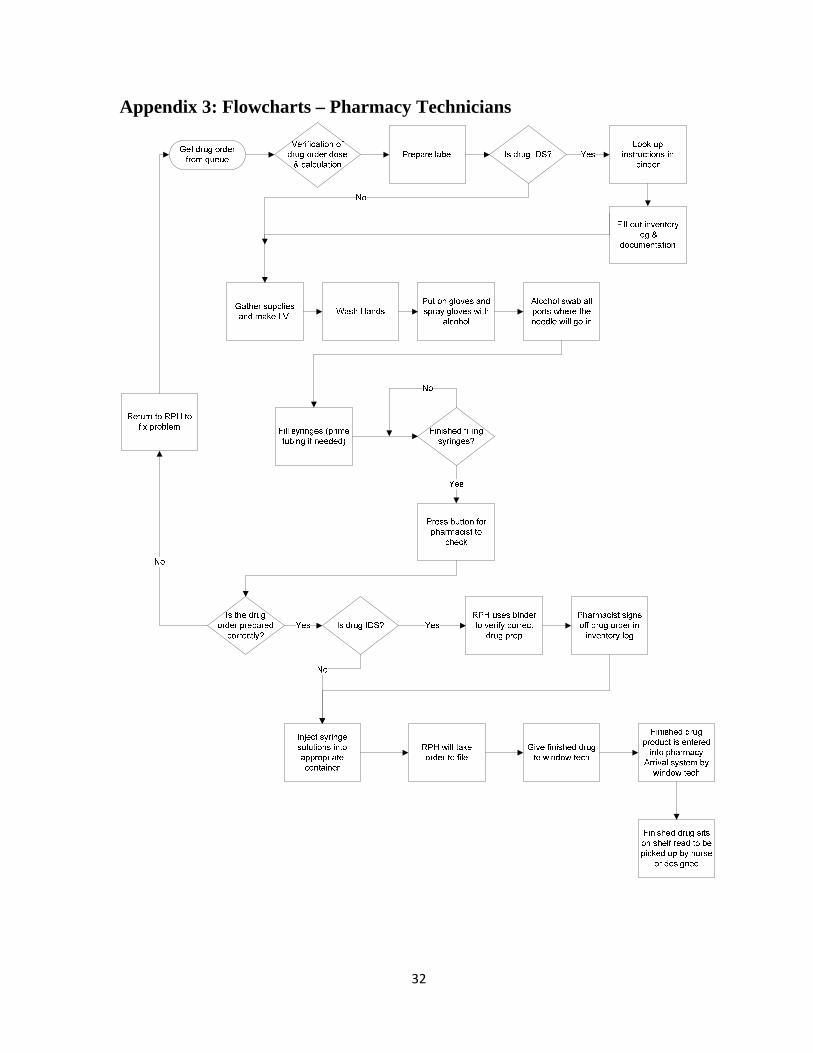
6.1 Initial Observations and Flowcharts The team has toured the CC INF pharmacy and INF patient treatment areas. Each member of the team individually observed the process and layout of the facility. One member shadowed a pharmacy technician as she prepared drug orders for patients waiting to be treated. The other two team members shadowed the pharmacists. From these observations, the team created flowcharts of the processes of the pharmacists (Appendix 2) and pharmacy technicians (Appendix 3). The team conducted total 6 hours of initial observations.
6.2 Historical database collection In addition, the team received all historical data from the following existing databases from the project clients:
• Patient Arrival system data from August 2007 through February 2009. This data contains information on total time a drug order is in the CC INF pharmacy.
• Worx3 CC Workload data from January 2007 through February 2009, which contains medical record number, drug name, and date of service.
The team combined the patient Arrival system data with the pharmacy Worx data to match drug names with appointment times and the time the drug order spent in the CC INF pharmacy. Once this combining process was complete, the team cleaned the data. Cleaning the data involved removing all non-compliance data entry, any non-major drug components (i.e. NaCl, D5W), drugs not prepared in the BSCs (i.e. tablets), and any total pharmacy times under 15 minutes and over 3 hours. After cleaning the data, the team analyzed drug order
3 Worx is the Pharmacy System used to generate labels and drug charges
5
preparation times by day of week, time of day, order type (i.e. IDS or non-IDS), hood utilization, and compliance of button clicks within the Arrival system database.
6.3 Interviews with CC INF Staff The team also interviewed two pharmacists and five pharmacy technicians onsite to gain a representative sample of staff suggestions. The team considered CC INF employee suggestions for improvement of workflow since the employees experience inefficiency issues first-hand. The team also asked employees to describe instances when the process was both good and bad, along with areas they see need for improvement in the current process and their reasoning.
6.4 Data Collected by Pharmacy Technicians Lastly, the team had the CC INF pharmacy manager randomly collect data from several pharmacy technicians for three consecutive days determine individual medication product start and finish preparation times. From this collection, the team received 224 samples of drug orders and the corresponding pharmacy technicians’ preparation times. This data was used to create a simulation of the current state of the CC INF pharmacy and develop recommendations for a future state.
7 Findings This section describes in detail the findings from literature research, initial observations, historical databases, interviews with staff, and the simulation.
7.1 Literature Research
The team researched other cancer center pharmacies that had recently completed a lean improvement project to improve their current processes. The most applicable pharmacy was the Cancer Treatment Centers of America at Midwestern Regional Hospital (Lepper). In December 2003, Midwestern Regional completed a lean optimization project of their pharmacy. They used four metrics to optimize their current process; chemotherapy turnaround time, number of process steps, distance walked each day, and internal medication errors. Midwestern Regional completed the following tasks to optimize their goals.
• Changed staffing patterns to meet high chemotherapy demand times • Redesigned the current pharmacy department • Implemented Lean Thinking methodology • Eliminated non-value added steps in the process • Created new standard operating procedures • Developed new chemotherapy safety logs • Improved and standardized the order entry process • Implemented 5S and visual workplace principles • Created Production/Safety board based on Lean theory
6
• Implemented a new inventory management system for IV supplies to allow just-in-time ordering
After Midwestern Regional implemented their ideas, the pharmacy decreased the chemotherapy prep time by 20% and decreased the number of steps in the system by 50%. Patient safety was always the number one goal of the pharmacy, and by implementing lean principles, they reduced the number of errors. Implementing a visual workplace allowed the employees to easily identify less and more complex drug orders. The visual workplace allowed the pharmacy to begin triaging by complexity to reduce their turnaround time by 20%. Weekly meetings were established to allow for continuous improvement of their pharmacy system. These weekly meetings also served as a forum in which to communicate with the staff changes to their current processes.
7.1.1 Interruptions at Metropolitan Hospital Cancer Center To also increase the level of patient safety in the CC INF pharmacy, Metropolitan Hospital researched ways to continuously improve the level of patient safety (Metropolitan). A study from January 2006 examined the effect interruptions have on the staff on the Cancer Center Pharmacy at Metropolitan Hospital in Grand Rapids, Michigan. The authors reported that the pharmacy reduced their dispensing errors by 40% by simply creating an area called the “safe zone.” In this area, the pharmacist was never to be interrupted. When a drug order was in this safe zone it was not ready; once the drug order was ready, it is placed on the “To Go” counter. This small step to avoid interruptions drastically increased the patient safety level of the pharmacy.
7.2 Initial Observations To allow the team to have a full understanding of the CC INF pharmacy, initial observations were performed. Each member of the team shadowed various members of the CC INF staff. During these shadowing sessions several observations were made.
• There are currently over 800 standard drug orders currently available on the clinical home page for prescribers
• There is high complexity due to multiple combinations used to prepare drug orders • There is redundancy within CC INF many times used for patient safety • There are areas for improvement in CC INF • There is an insignificant amount of non-value added work in the process identified • There have been no CC INF pharmacy staff meetings since Fall 2008
These shadowing sessions were also used to produce two flowcharts documenting the work of the CC INF pharmacist and pharmacy technician (See Appendix 2 and 3). The most important result indentified from the flowcharts of the CC INF pharmacy was the redundancy of work performed by various members of the CC INF. Much of this redundancy is due to a concern for patient safety. The “triage” pharmacist station was found to have the maximum potential to increase the efficiency of the CC INF; these findings were based on the observed actions compared to the designed actions of the “triage” pharmacist. The current state of the
7
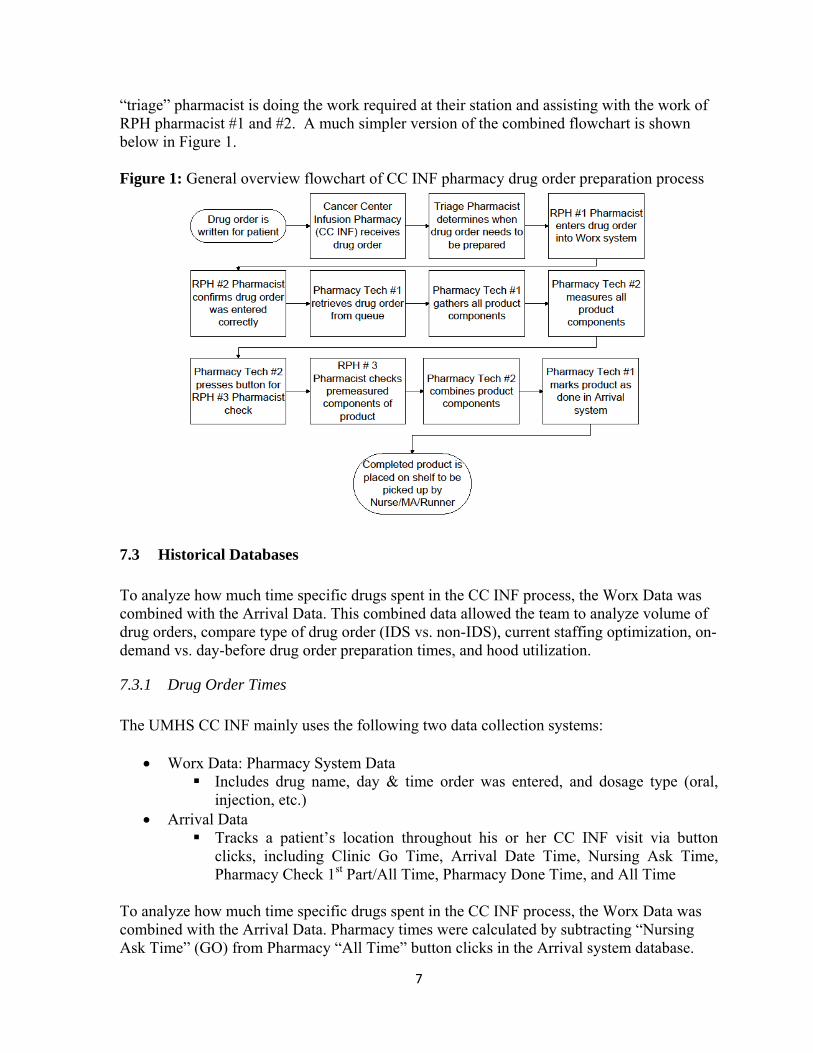
“triage” pharmacist is doing the work required at their station and assisting with the work of RPH pharmacist #1 and #2. A much simpler version of the combined flowchart is shown below in Figure 1. Figure 1: General overview flowchart of CC INF pharmacy drug order preparation process
7.3 Historical Databases To analyze how much time specific drugs spent in the CC INF process, the Worx Data was combined with the Arrival Data. This combined data allowed the team to analyze volume of drug orders, compare type of drug order (IDS vs. non-IDS), current staffing optimization, on-demand vs. day-before drug order preparation times, and hood utilization.
7.3.1 Drug Order Times The UMHS CC INF mainly uses the following two data collection systems:
• Worx Data: Pharmacy System Data Includes drug name, day & time order was entered, and dosage type (oral,
injection, etc.) • Arrival Data
Tracks a patient’s location throughout his or her CC INF visit via button clicks, including Clinic Go Time, Arrival Date Time, Nursing Ask Time, Pharmacy Check 1st Part/All Time, Pharmacy Done Time, and All Time
To analyze how much time specific drugs spent in the CC INF process, the Worx Data was combined with the Arrival Data. Pharmacy times were calculated by subtracting “Nursing Ask Time” (GO) from Pharmacy “All Time” button clicks in the Arrival system database.
8
In addition, the naming conventions used were inconsistent in the data collection systems and worksheets, with standardization at times lacking in program coding. This is creating confusion at times for CC INF staff, as they are not always aware of these changes and must spend time re-learning the new naming convention the programmer instituted.
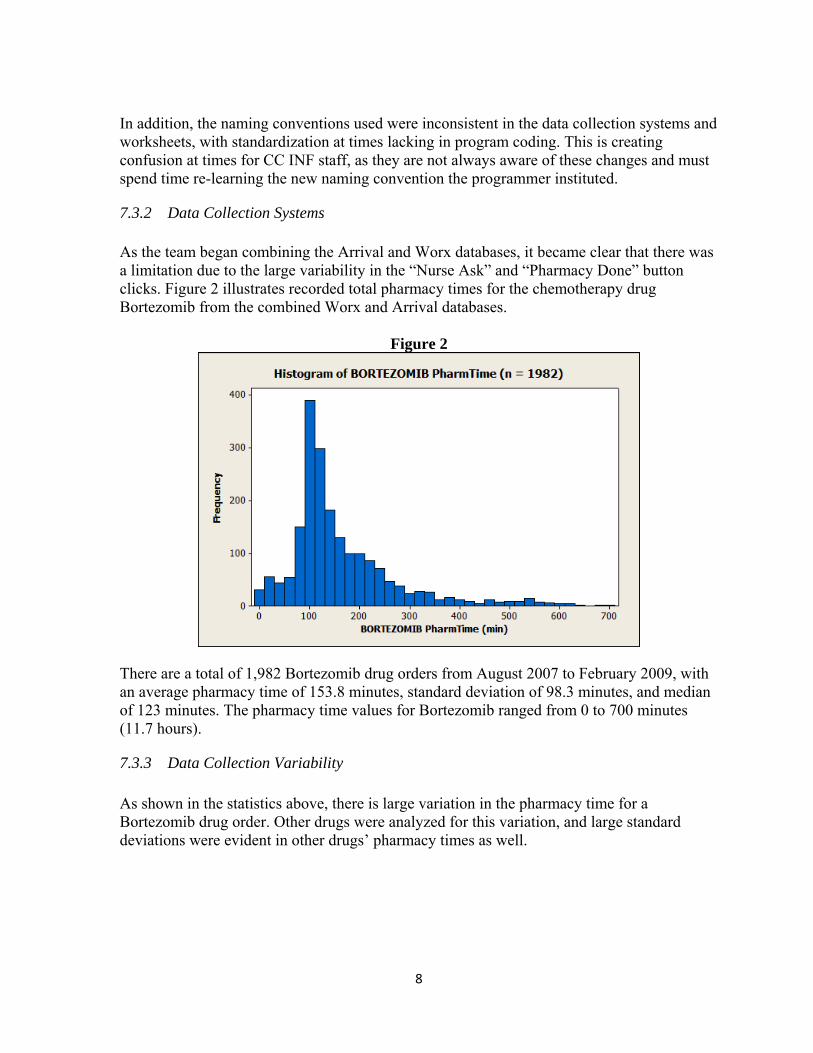
7.3.2 Data Collection Systems As the team began combining the Arrival and Worx databases, it became clear that there was a limitation due to the large variability in the “Nurse Ask” and “Pharmacy Done” button clicks. Figure 2 illustrates recorded total pharmacy times for the chemotherapy drug Bortezomib from the combined Worx and Arrival databases.
Figure 2
There are a total of 1,982 Bortezomib drug orders from August 2007 to February 2009, with an average pharmacy time of 153.8 minutes, standard deviation of 98.3 minutes, and median of 123 minutes. The pharmacy time values for Bortezomib ranged from 0 to 700 minutes (11.7 hours).
7.3.3 Data Collection Variability As shown in the statistics above, there is large variation in the pharmacy time for a Bortezomib drug order. Other drugs were analyzed for this variation, and large standard deviations were evident in other drugs’ pharmacy times as well.
9
To further analyze the large variation in the Arrival Data for pharmacy times, the team analyzed button click compliance rates of the nurses and pharmacists in the database. To do this, the team defined “compliance” as the following:
• Button was clicked (i.e. Time values present for “Nursing Ask Time” and “All Time”)
• “All Time” is greater than “Nursing Ask Time” • Total pharmacy time is between 15 minutes and 3 hours
Using the definition above, the team found button click compliance, based on Arrival Data from 8/27/07 - 2/28/09, to be 60%.
7.3.4 Volume of Drug Orders by Day of Week The team used data from February 16th through the 28th in the Arrival databases to examine the volume of incoming drug orders by day of the week. This data showed that Tuesdays and Wednesdays are the busiest days of the week for the CC INF pharmacy. See Figure 3 below.
Figure 3
This data was also consistent with the volume of drug orders by day of week from August 2007 through the end of February 2009 (See Figure 4).
10
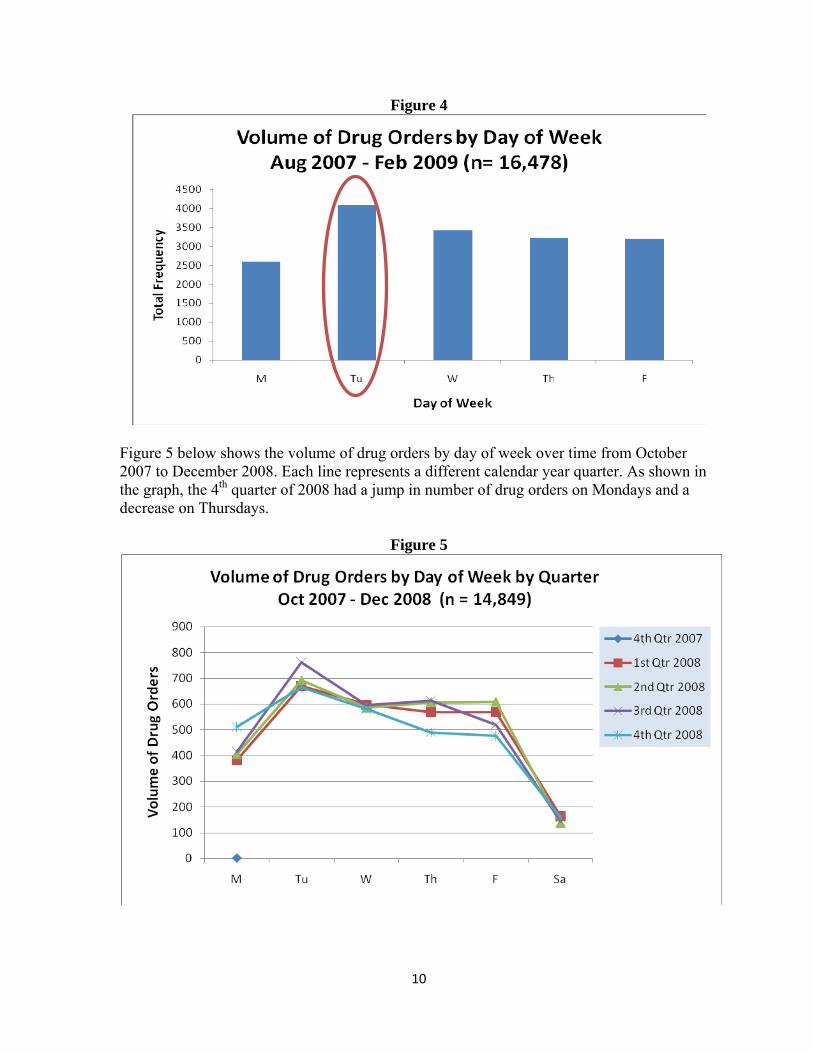
Figure 4
Figure 5 below shows the volume of drug orders by day of week over time from October 2007 to December 2008. Each line represents a different calendar year quarter. As shown in the graph, the 4th quarter of 2008 had a jump in number of drug orders on Mondays and a decrease on Thursdays.
Figure 5
11
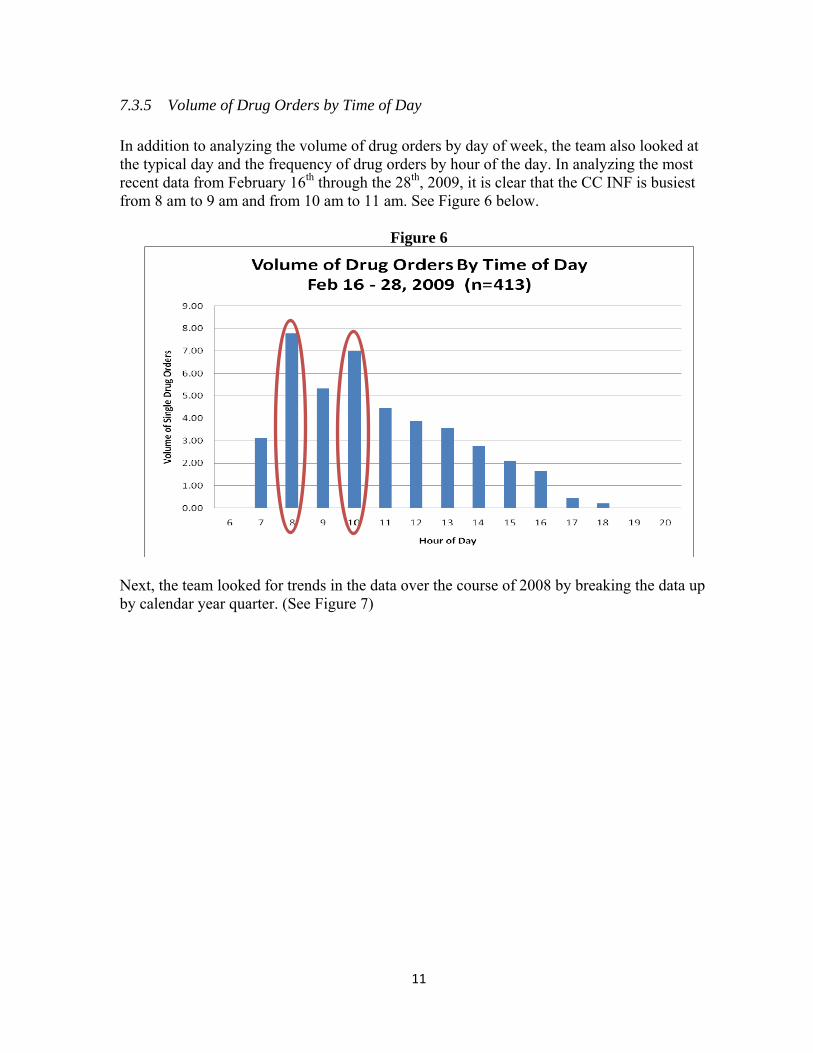
7.3.5 Volume of Drug Orders by Time of Day In addition to analyzing the volume of drug orders by day of week, the team also looked at the typical day and the frequency of drug orders by hour of the day. In analyzing the most recent data from February 16th through the 28th, 2009, it is clear that the CC INF is busiest from 8 am to 9 am and from 10 am to 11 am. See Figure 6 below.
Figure 6
Next, the team looked for trends in the data over the course of 2008 by breaking the data up by calendar year quarter. (See Figure 7)
12
Figure 7
0
50
100
150
200
250
300
350
400
450
500
7 8 9 10 11 12 13 14 15 16 17 18 19 20
Volume of Drug Orders
Hour of Day
Volume of Drug Orders by Time of Day2008 by Quarter (n=11,301)
1st Quarter
2nd Quarter
3rd Quarter
4th Quarter
Figure 7 shows that generally over the course of 2008, the volume of drug orders by time of day followed the same trends for each quarter. However, as shown in the figure, there are differences in the volume of drug orders. In general, the 2nd quarter typically has a higher frequency of orders over the course of a work day. There is also a difference between the 2nd and 4th quarters between 11:00 am and 1:00 pm.
7.3.6 CC INF Staffing vs. Volume of Drug Orders by Time of Day Next, the team computed the current staffing levels to the volume of drug orders coming into the CC INF by time of day. The red bars indicate pharmacy technicians that are preparing drug products in the work hoods. The green bars indicate other pharmacy technicians that are on break, working at the window, working on next day orders, a runner, etc. See Figure 8 below.
13
Figure 8
As shown in Figure 8 above, the staffing levels for the CC INF pharmacy technicians do not closely follow the volume of drug orders by time of day. According to this data, the pharmacy technicians are not adequately staffed during the 8 am to 9 am hour.
7.3.7 Volume of IDS Drug Orders by Day of Week The team also examined the volume of IDS drug orders by day of week to identify trends. See Figure 9 below for trends in data over calendar year quarters.
14
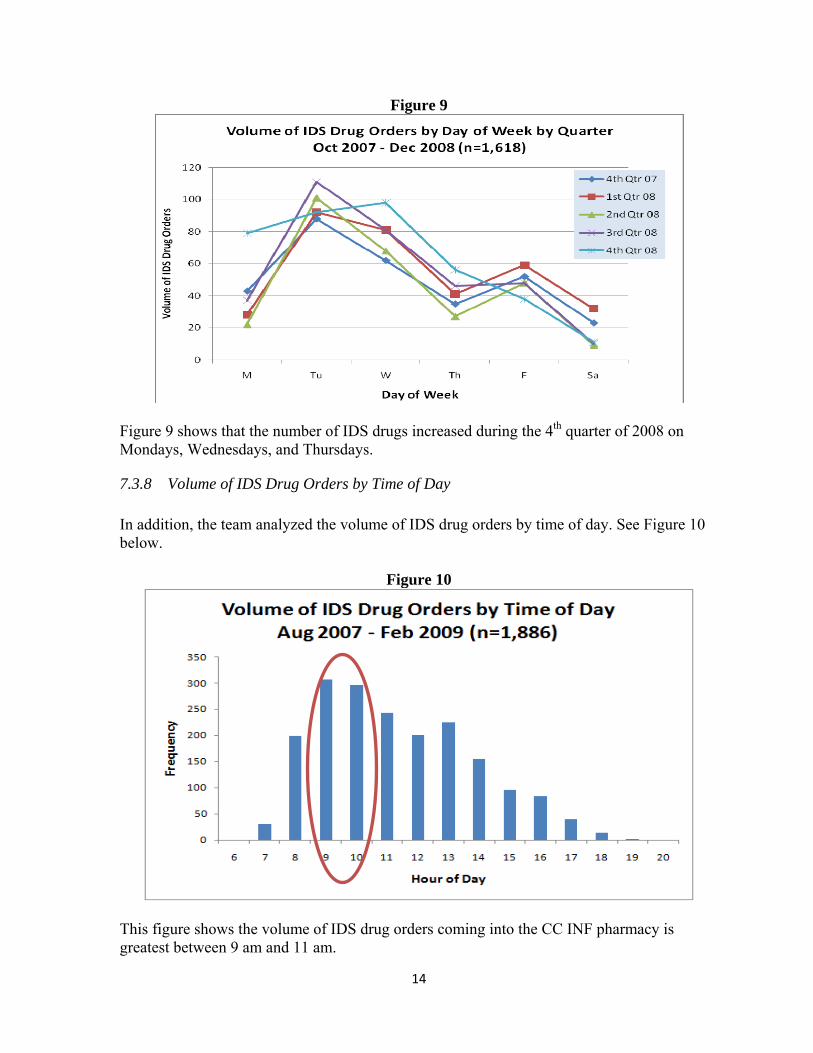
Figure 9
Figure 9 shows that the number of IDS drugs increased during the 4th quarter of 2008 on Mondays, Wednesdays, and Thursdays.
7.3.8 Volume of IDS Drug Orders by Time of Day In addition, the team analyzed the volume of IDS drug orders by time of day. See Figure 10 below.
Figure 10
This figure shows the volume of IDS drug orders coming into the CC INF pharmacy is greatest between 9 am and 11 am.
15
Figure 11 below displays the volume of drug orders by time of day for both non-IDS and IDS drug orders. This graph shows that there are a greater number of IDS drug orders starting at 8 am than for non-IDS. In addition, unlike non-IDS, there is a second peak of IDS drug orders at 1 pm.
Figure 11: Volume of IDS and Non-IDS Drug Orders by Time of Day (Aug 2007 – Feb 2009)
Non-IDS (n=17,373) IDS (n=1,886)
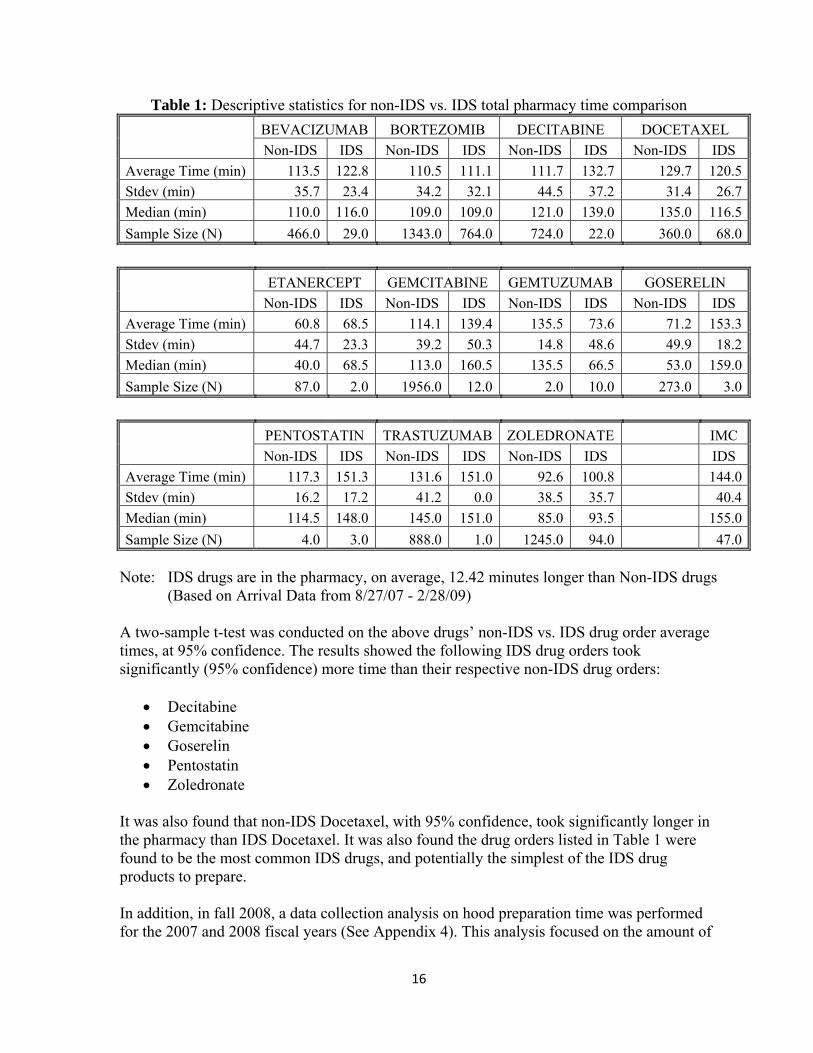
7.3.8.1 IDS vs. Non-IDS Drug Order Pharmacy Times There is a current perception throughout the CC INF pharmacy that IDS orders for a particular drug take longer than non-IDS orders for the same drug. Table 1 highlights several commercially available drugs prepared for both IDS and non-IDS orders and shows the descriptive statistics of specific drug orders in the CC INF, including the average time a particular drug order spends in the CC INF pharmacy dispensing process. Table 1 includes scheduled and on-demand orders.
Note: IDS drugs are in the pharmacy, on average, 12.42 minutes longer than Non-IDS drugs
(Based on Arrival Data from 8/27/07 - 2/28/09) A two-sample t-test was conducted on the above drugs’ non-IDS vs. IDS drug order average times, at 95% confidence. The results showed the following IDS drug orders took significantly (95% confidence) more time than their respective non-IDS drug orders:
It was also found that non-IDS Docetaxel, with 95% confidence, took significantly longer in the pharmacy than IDS Docetaxel. It was also found the drug orders listed in Table 1 were found to be the most common IDS drugs, and potentially the simplest of the IDS drug products to prepare. In addition, in fall 2008, a data collection analysis on hood preparation time was performed for the 2007 and 2008 fiscal years (See Appendix 4). This analysis focused on the amount of
17
time CC INF pharmacy technicians took to prepare specific IDS and non-IDS drug orders in the BSCs (i.e. hoods.) This analysis of hood preparation time found, on average, that IDS drug orders took 7 minutes longer than non-IDS drug orders to prepare. This 7-minute in-hood time can be compared to the 12.4-minute total in-pharmacy time. By direct observation, this comparison implies IDS drug orders spend 7 minutes longer in the work hood, and also 5.4 minutes longer in processes outside the hood while in the CC INF pharmacy.
7.3.8.2 IDS Drug Preparation Instructions To prepare an IDS drug order, pharmacy technicians use an instruction manual listing the steps and procedures for preparation. The CC INF pharmacy has hard copies of these instruction manuals, each manual containing instructions on how to prepare approximately 20 different IDS drugs. In addition, pharmacists have an electronic copy of the instruction manuals available through the intranet. Through observation and interviews, the team found pharmacy technicians, at times, have to wait for these instruction manuals because either other technicians or the pharmacists are using the same book for data entry and checks. In addition, not all pharmacists are currently familiar with how to access the online IDS instruction manuals or they simply do not like having to click multiple times to locate the electronic manual on the computer. As a result, the pharmacy technicians are left to wait for these hard copy manuals to become available, prolonging the time an IDS order spends in the pharmacy; this is non-value added work.
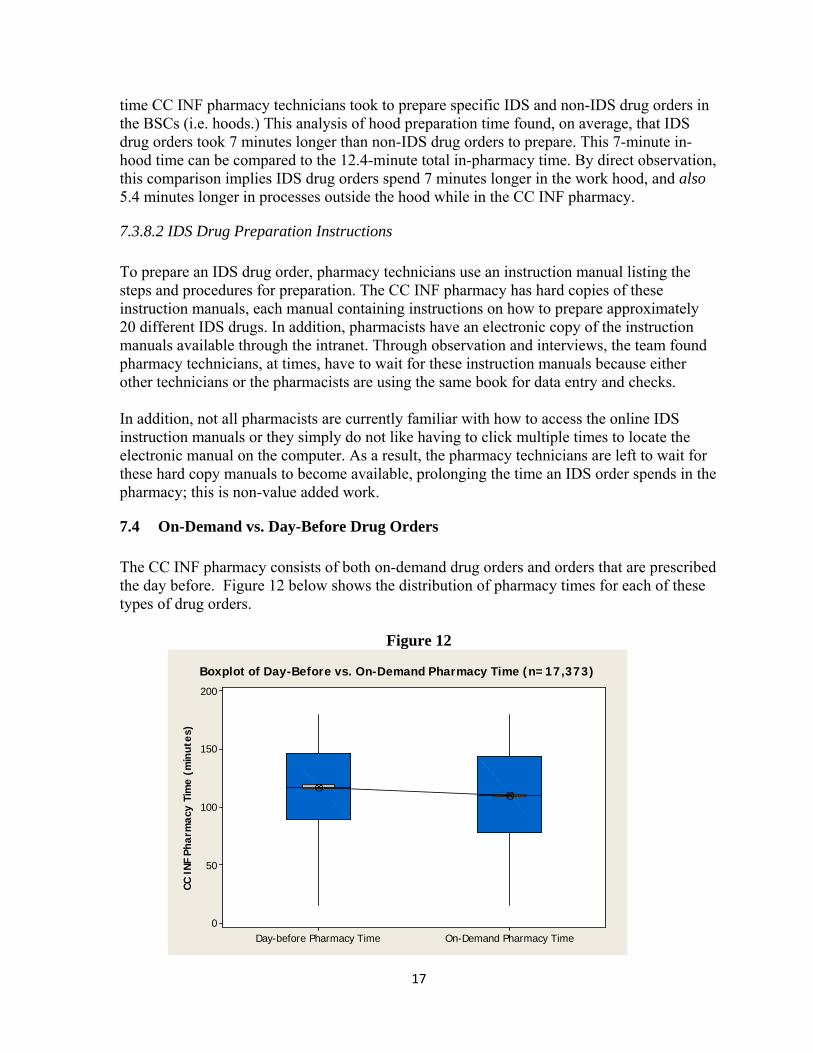
7.4 On-Demand vs. Day-Before Drug Orders The CC INF pharmacy consists of both on-demand drug orders and orders that are prescribed the day before. Figure 12 below shows the distribution of pharmacy times for each of these types of drug orders.
Figure 12
CC I
NF P
harm
acy
Tim
e (m
inut
es)
On-Demand Pharmacy TimeDay-before Pharmacy Time
200
150
100
50
0
Boxplot of Day-Before vs. On-Demand Pharmacy Time (n=17,373)
18
Figure 12 shows there is not a significant difference in pharmacy times for day-before orders and on-demand drug orders. From the data, day-before drug orders spend a median time of 7 minutes longer than on-demand drug orders in the CC INF.
7.5 Interviews with CC INF Staff The team interviewed the CC INF pharmacy staff. To provide an accurate view of the current environment within the CC INF pharmacy, the team interviewed two pharmacists and six pharmacy technicians. The team interviewed personnel with varying degrees of experience in the medical field and in the CC INF pharmacy. The following key results were obtained.
7.5.1 Retraining/Standardization
• The CC INF staff does not believe the nurses are properly using the computer system to determine when the completed product has been completed.
• Members of the CC INF staff believe that the nurses and the CC INF should standardize and simplify the processes used in the arrival system.
• CC INF staff believes it would be best to move away from paper drug orders, and start using electronic orders exclusively.
7.5.2 Environment of CC INF
• Interruptions are the main source of frustration and loss of productivity. • The current atmosphere places different departments, who must work well together,
in conflict with one another trying to complete a common goal. • If CC INF pharmacy staff could change one instance in the CC INF, they did not have
direct control over, it would be increasing their current amount of workspace and increasing the number of hoods and technicians, ultimately helping lead to an increase in throughput.
• The CC INF staff that have a long work history (e.g. greater than 10 years) note an increase in the volume of drug orders and a corresponding decrease in the quality of the CC INF pharmacy work environment.
• Many of the staff believes the current workload in the CC INF creates a poor environment.
• Some staff members feel underappreciated for their work. • The staff of the CC INF believes the current situation is too stressful to have a
productive work environment. • The current expectations of the CC INF are too high. • Many staff members believe there is a “disconnect” between the workers of the CC
INF pharmacy and the management of the CC INF pharmacy.
19
7.5.3 Sequence of Work
• The staff believes that when applicable, patients should have test results obtained on day 1, and then on day 2 return for their prescribed infusion.
• The Pharmacy Technicians believe the time needed to wait for a pharmacist check should be eliminated to increase efficiency in the system.
• The CC INF staff believes simple prescriptions that do not require the check of a 2nd pharmacist are completed the quickest.
• The current perception of the CC INF staff is that chemotherapy drugs take at least twice as long as non-chemotherapy drugs to complete the drug order.
• Many of the drugs that take the most time are due to increased safety for the patient and pharmacy technician making the drug.
• A small portion of the drugs must currently be agitated manually, requiring constant attention, this job should be replaced to free more technician time.
7.5.4 Error Prevention
• Sometimes staff members of the University of Michigan Hospital are blamed for errors instead of focusing on improving the processes to prevent errors.
7.6 Data Collection by Pharmacy Technicians The Arrival data and Worx data were used to find the total time a drug order was in the pharmacy. However, to model the current CC INF pharmacy process and determine how to best sequence work with the pharmacy technicians, the team needed to know the time it was taking technicians to prepare drug products in the hood. To do this the team asked the CC INF pharmacy manager to randomly collect data from several pharmacy technicians for three consecutive days determine individual medication product start and finish preparation times. From this collection, the team received 224 samples of drug orders and their pharmacy technicians’ preparation times. This data was used to create a simulation of the current state of the CC INF and develop recommendations for a future state.
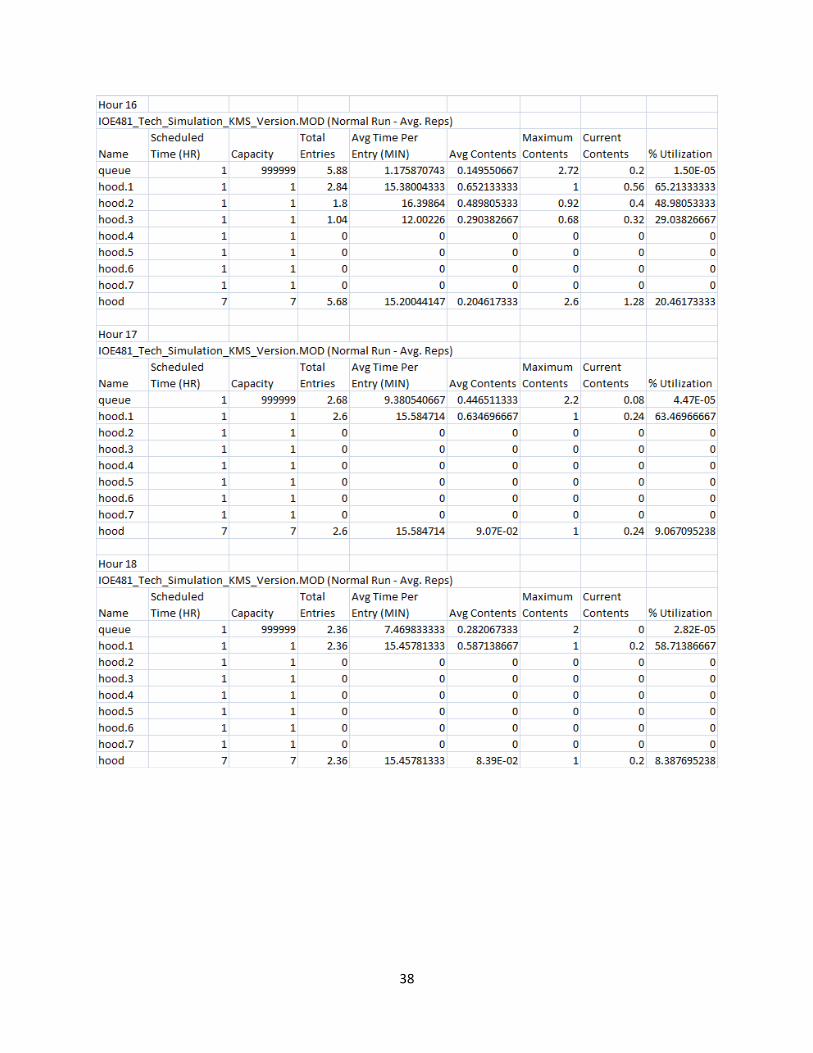
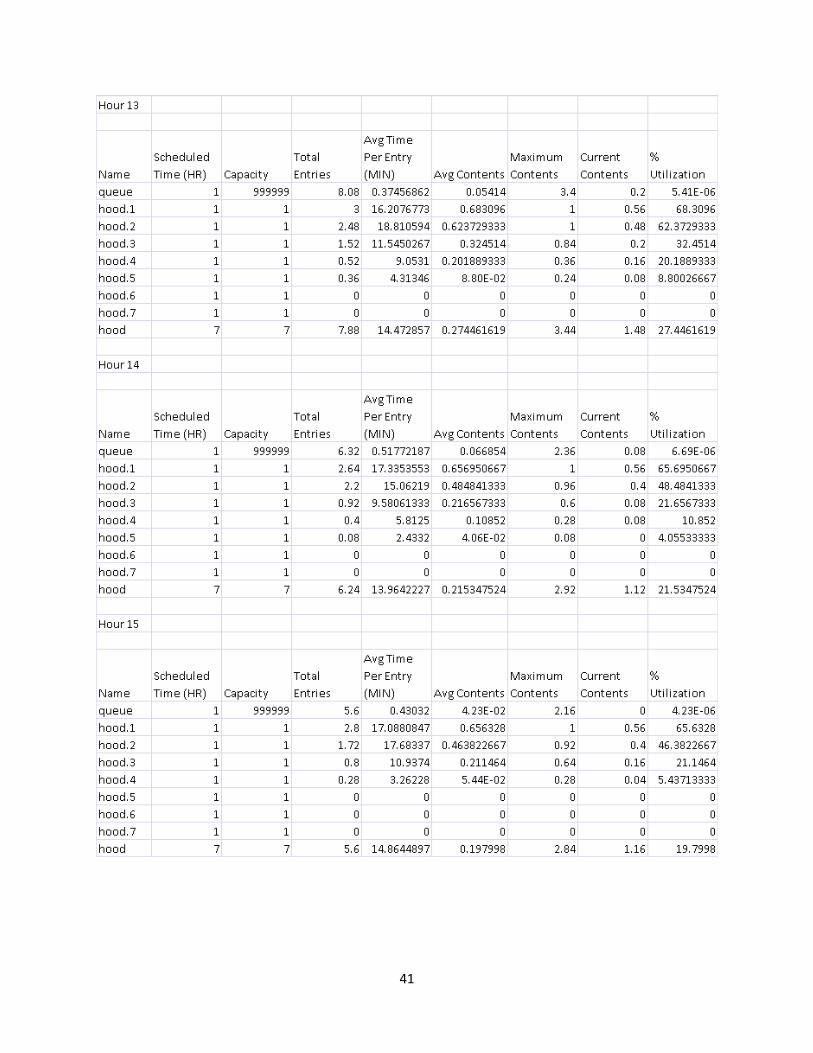
7.6.1 Simulation The team used simulation software, ProModel, to simulate the process of incoming drug orders coming into the queue, resembling the table by the pharmacy technicians, and modeling how the drug orders are distributed to different hoods depending on the number of available work hoods being occupied by a pharmacy technician. By modeling the drug order preparation process, the team was able to analyze different scheduling plans and how pharmacy technician staffing affected the average time a drug order was in the CC INF, as well as percent utilization of each hood being used. In addition to the in-hood drug order preparation times collected by the pharmacy technicians, the team found CC INF drug order inter-arrival times (IAT) by using “Nursing Ask Time” from the two most recent weeks, 2/16/09 to 2/28/09, in the Arrival Data. Using
20
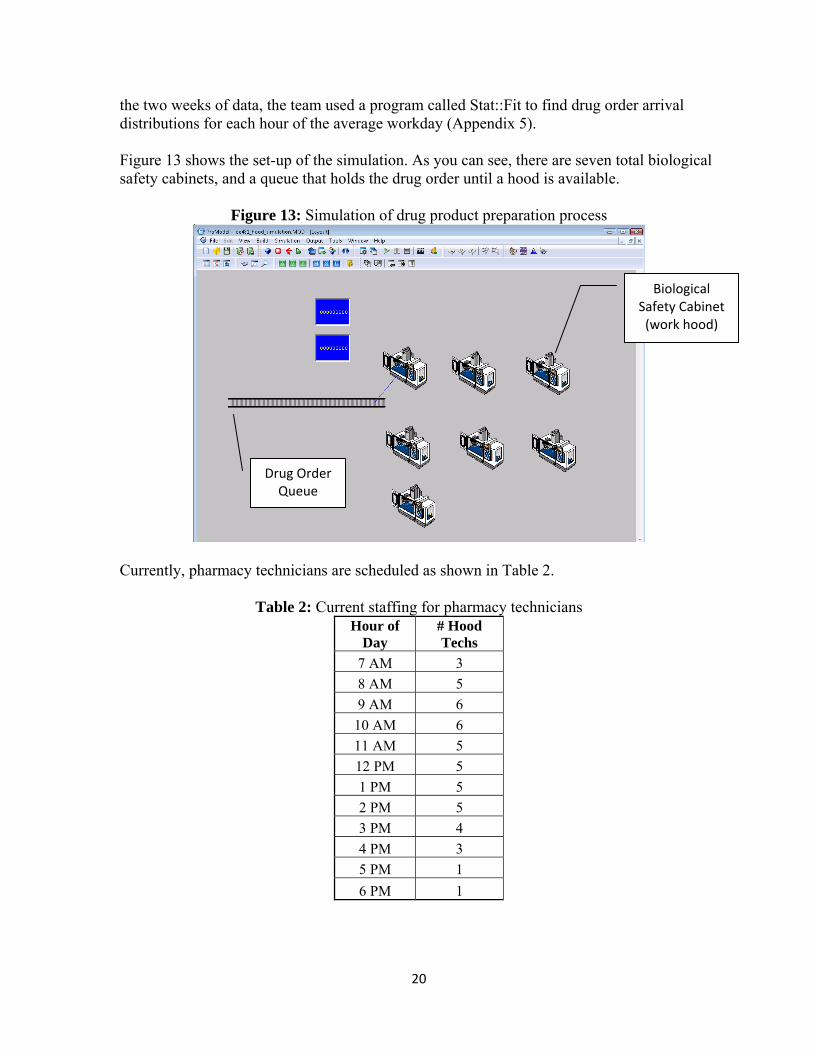
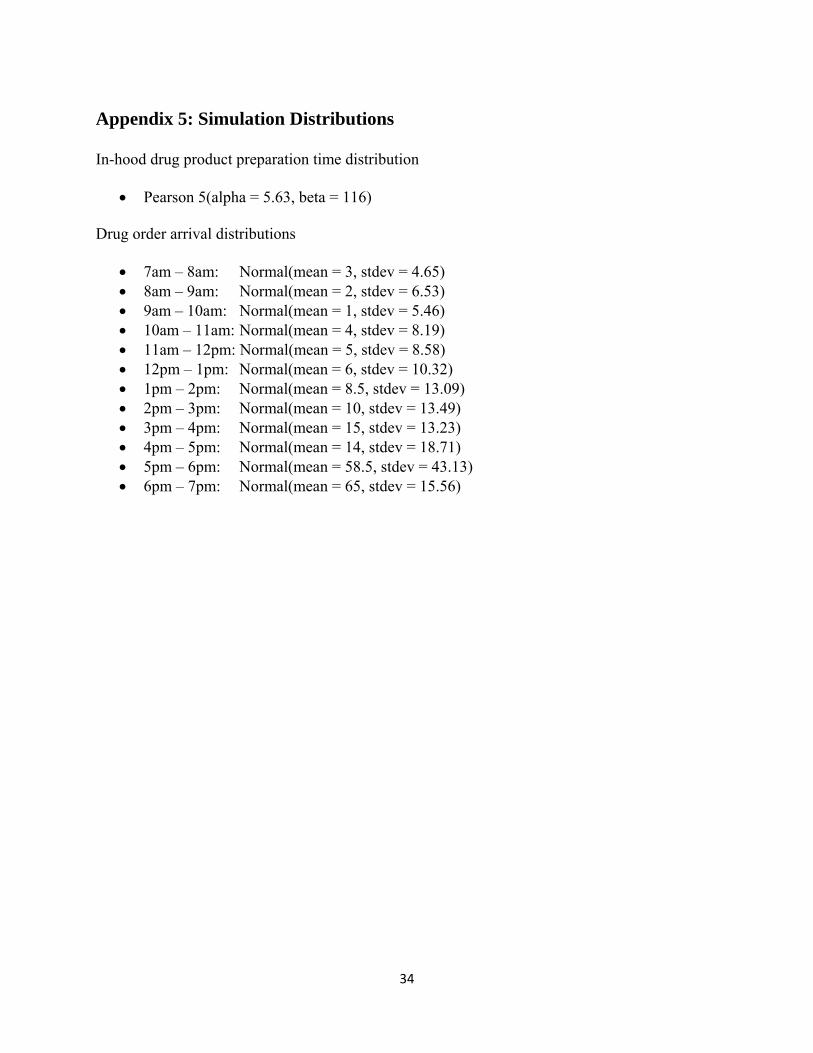
the two weeks of data, the team used a program called Stat::Fit to find drug order arrival distributions for each hour of the average workday (Appendix 5). Figure 13 shows the set-up of the simulation. As you can see, there are seven total biological safety cabinets, and a queue that holds the drug order until a hood is available.
Figure 13: Simulation of drug product preparation process
Currently, pharmacy technicians are scheduled as shown in Table 2.
Table 2: Current staffing for pharmacy technicians Hour of
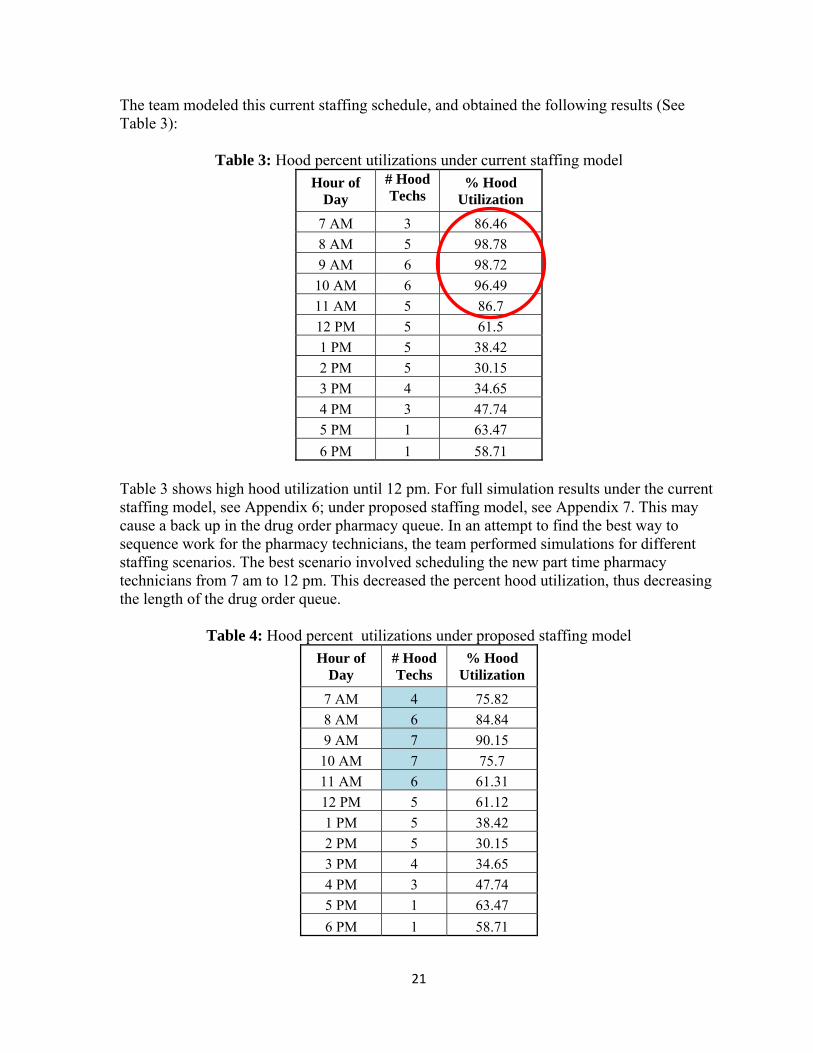
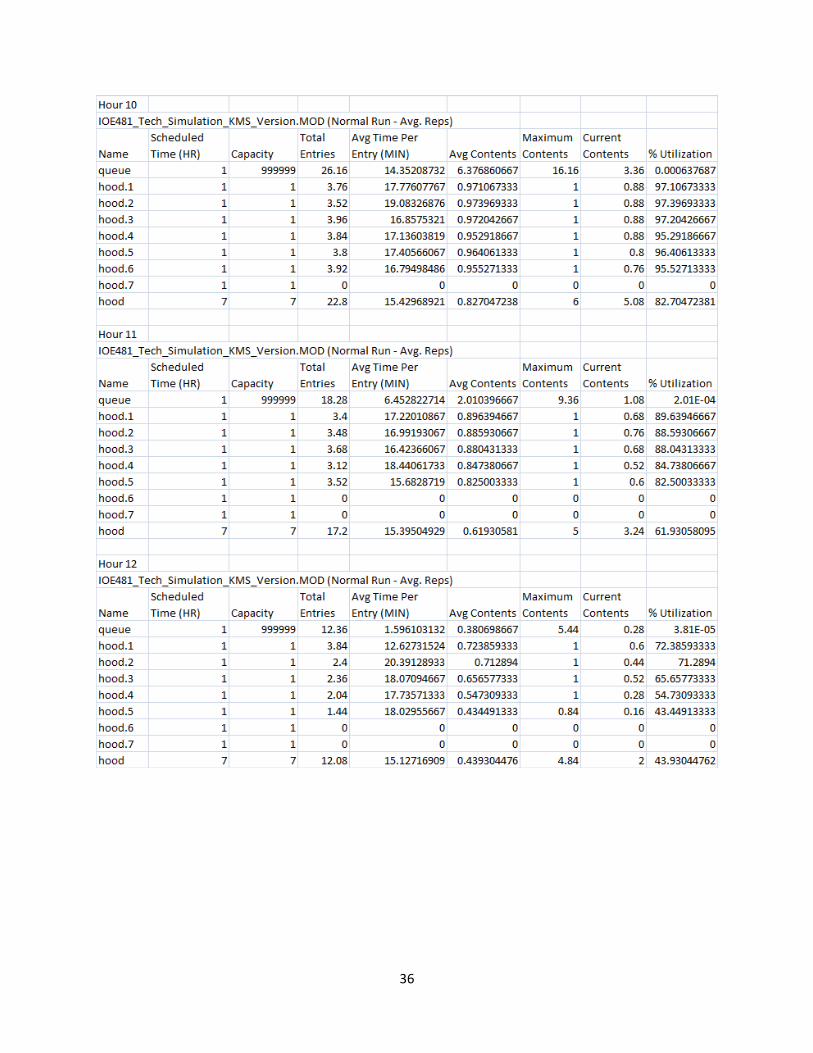
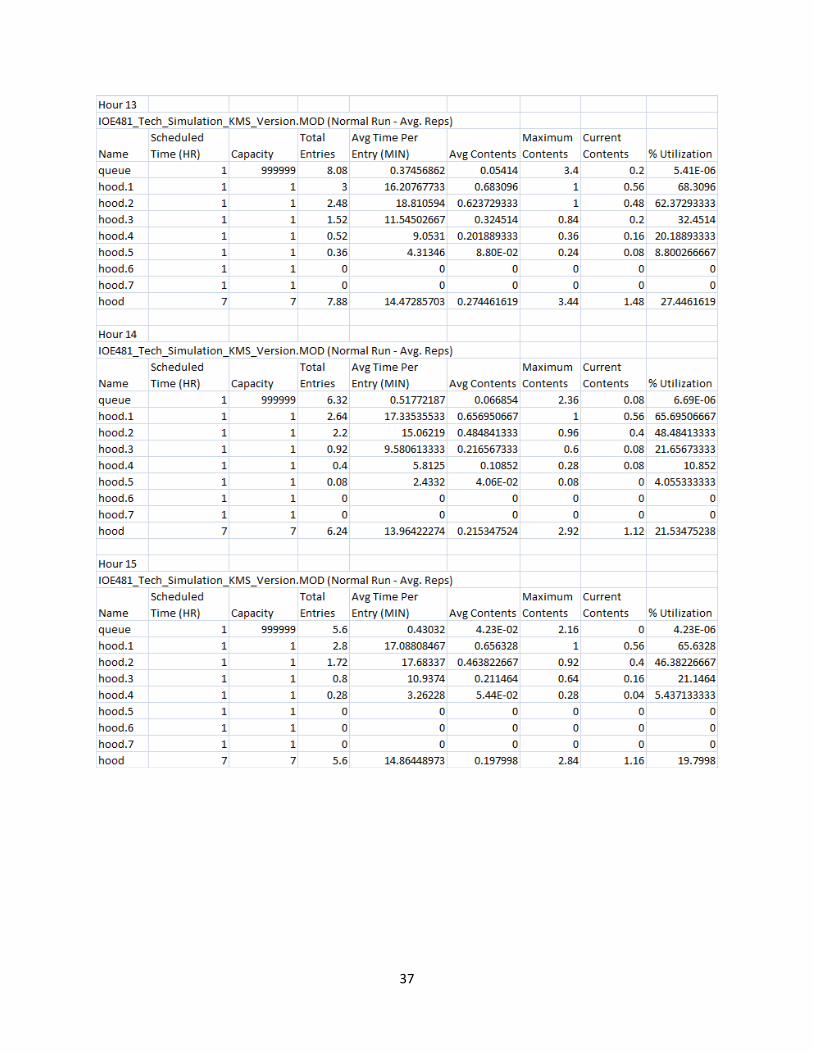
Table 3 shows high hood utilization until 12 pm. For full simulation results under the current staffing model, see Appendix 6; under proposed staffing model, see Appendix 7. This may cause a back up in the drug order pharmacy queue. In an attempt to find the best way to sequence work for the pharmacy technicians, the team performed simulations for different staffing scenarios. The best scenario involved scheduling the new part time pharmacy technicians from 7 am to 12 pm. This decreased the percent hood utilization, thus decreasing the length of the drug order queue.
Table 4: Hood percent utilizations under proposed staffing model Hour of
8 Conclusions From the findings described in the previous section, the team developed conclusions on pharmacy technician staffing, database errors, on-demand versus day-before drug orders, IDS versus non-IDS drug orders, sequence of work, interruptions, and staff meetings.
8.1 Current CC INF Pharmacy Technician Staffing
The current staffing in the CC INF pharmacy is inadequate for the number of drug orders coming in between 7 am and 12 pm. The maximum number of incoming drug orders is higher than the current staffing capabilities as seen in Figure 8.
8.2 Database Errors
As mentioned in findings of data collection variability, the team found button click compliance for the Arrival system database is low. The “Nursing Ask Time” button click should be clicked when the nurse requests that the drug order be made. However, from analyzing the Arrival data, there are several times when the buttons are clicked before all patient laboratory results are finished or before the patient is seated in the infusion area. There were also instances when the “Nursing Ask Time” and “All Done” button clicks were the same, yielding a pharmacy time of zero minutes; this is not correct. These incorrect times can be attributed to drug orders prepared the night before and placed on the pick-up shelf before the patient arrives (e.g. boxed and prepackaged items which require no preparation in the IV time). When these button click errors occur, the drug order pharmacy time becomes useless for analysis. As shown in Figure 2, there is a large variation in the total pharmacy time for drug orders based on the current database collection system. In addition, there were some pharmacy times as great as 13 hours for a drug order. From observations and interviews, there are no drug orders that spend more than 3 hours in the CC INF. Therefore, the large variation in total pharmacy time for a particular drug orders show there are forgotten button clicks in the system. The current database does not presently track multi-drug regimens. The team believes the current button clicks could be modified to track individual drug order components which would allow the CC INF pharmacy to conduct further analysis of these multi-drug regimens.
8.3 On-Demand vs. Day-Before Drug Orders From analysis of on-demand versus day-before drug order pharmacy times, the team discovered that day-before drug orders spend a median of 7 minutes longer than on-demand drug orders in the CC INF pharmacy. Ideally, day-before drug orders should spend less time in the pharmacy. However, as on-demand orders come in to the CC INF pharmacy, it is possible that scheduled orders get pushed back in the queue as on-demand drug orders are given priority. This also shows that the CC INF is not operating in a FIFO manner as previously assumed. This is also the result of both day-before and on-demand orders being
23
dependent on laboratory results before compounding, mixing, and drug product preparation can begin.
8.4 IDS vs. Non-IDS Drug Orders As seen from the pharmacy time analysis presented in Section 7.3.8.1, IDS drug orders are taking, on average, 5.4 minutes longer than non-IDS drug orders in processes outside the hood while they are in the CC INF pharmacy. Therefore, it can be concluded there exists additional processes associated with IDS drug orders outside the work hood that can be identified. The team found these additional 5.4 minutes involve inventory control, which is essential incidental work. The team also believes part of this issue can be attributed to pharmacy technicians sometimes waiting for the pharmacists to finish using a hard copy IDS instruction manual; this waiting is non-value added time and should be eliminated.
8.5 Sequence of Work
Drug orders in the CC INF pharmacy are currently being processed in a first in – first out manner, but some preferences are given at the discretion of the staff. The preferences given by the CC INF pharmacy staff are inconsistent and do not follow any standard operating procedures of the pharmacy.
8.6 Interruptions
Interruptions are one of the biggest complaints of the CC INF pharmacy staff. Interruptions can possibly lead to patient safety errors. Interruptions also add non-value added work to the process, increasing the average turnaround time of the pharmacy. Metropolitan Hospital conducted a study in January 2006, and was able to reduce dispensing errors by 40% after eliminating interruptions during drug order preparation.
8.7 Staff Meetings The last staff meeting was held in the fall of 2008. These meetings are critical to allow daily or weekly updates to the pharmacy staff. The Cancer Treatment Centers of America at Midwestern Regional Hospital conducted a lean optimization project and implemented daily staff meetings to allow for continual improvement within the pharmacy. The lack of staff meetings in the CC INF pharmacy is not allowing the staff to give continual updates on their current performance, share ideas for improvement opportunities, or voice any other concerns they may have in the pharmacy.
24
9 Recommendations The team has developed recommendations for the CC INF to optimize the pharmacy technician staffing schedules and training to improve workflow of the CC INF pharmacy and compliance of button clicks in the Arrival database system.
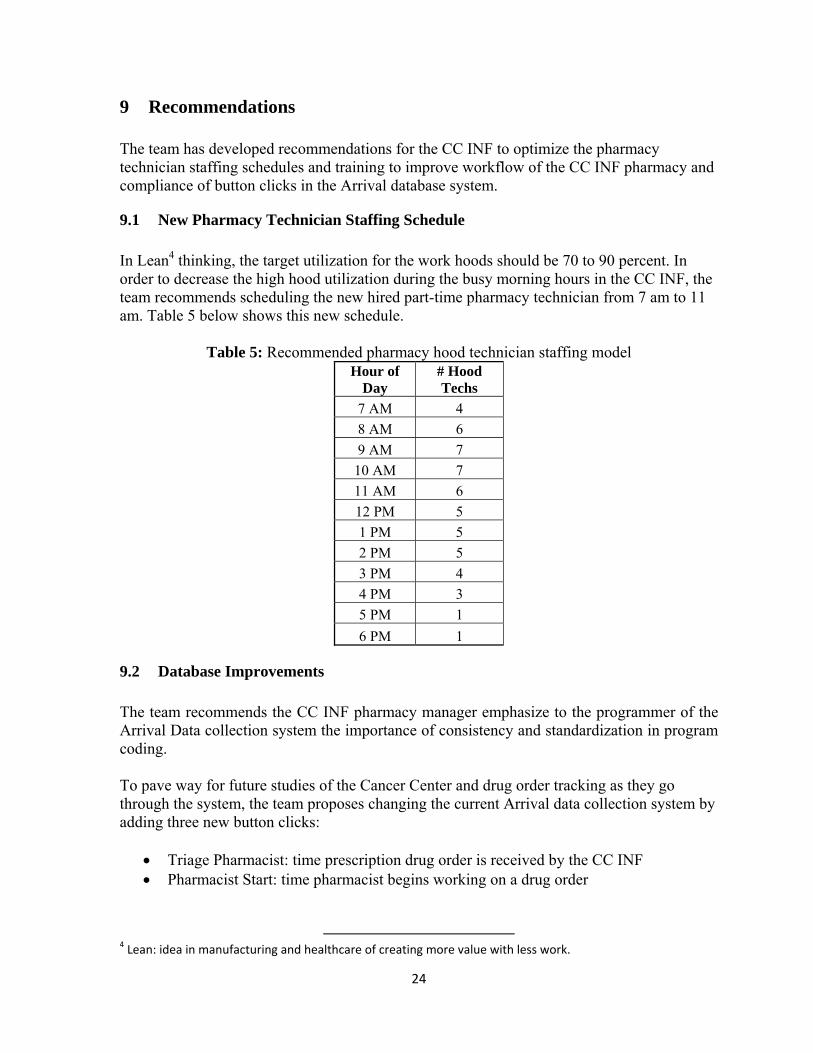
9.1 New Pharmacy Technician Staffing Schedule In Lean4 thinking, the target utilization for the work hoods should be 70 to 90 percent. In order to decrease the high hood utilization during the busy morning hours in the CC INF, the team recommends scheduling the new hired part-time pharmacy technician from 7 am to 11 am. Table 5 below shows this new schedule.
Table 5: Recommended pharmacy hood technician staffing model Hour of
9.2 Database Improvements The team recommends the CC INF pharmacy manager emphasize to the programmer of the Arrival Data collection system the importance of consistency and standardization in program coding. To pave way for future studies of the Cancer Center and drug order tracking as they go through the system, the team proposes changing the current Arrival data collection system by adding three new button clicks:
• Triage Pharmacist: time prescription drug order is received by the CC INF • Pharmacist Start: time pharmacist begins working on a drug order
4 Lean: idea in manufacturing and healthcare of creating more value with less work.
25
• Pharmacist End: time pharmacist finishes working on a drug order (before the drug order is placed in the pharmacy technician queue)
• Technician Start: time technician begins individual drug product preparation • Technician End: time technician completes individual drug product
9.3 Sequence of Work Recommendations To decrease the turnaround time of the CC INF pharmacy the drug orders should be sorted by complexity. This could achieve a 20% reduction in turnaround time as shown in the lean improvement project at Midwestern Regional Hospital. This recommendation is also supported by Little’s law (Little, 1960). Little’s Law states the following: Average number in the system = average arrival rate * average time in the system Using Little’s Law, if one can show the average arrival rate for drug orders coming into the CC INF remains the same, as well as the average number in the system is decreasing, one would be able to prove that the average time in the system would decrease. Less complex drug orders should be given a higher priority therefore allowing the fast drugs to leave the system sooner. This would decrease the average number of drug orders in the system and based on Little’s law, reducing average wait time. Additionally, to maintain equal patient wait times we believe no priority should be given based if the drug order was an on-demand or day-before drug orders.
9.4 Training The team recommends basic retraining of the pharmacists, pharmacy technicians, and nursing staff to eliminate errors with button click compliance in the Arrival system database, decrease interruptions of workflow, and improve general efficiency and communication between groups in the Cancer Center (clinic, infusion nurses, and infusion pharmacy).
9.4.1 Button Compliance Training Fundamental training on the importance and use of the Arrival system database would be useful to continue analysis on the CC INF drug order preparations times. As mentioned earlier in this report, button compliance in the Arrival Data is low and contributes to high variability in the data. Through training on the use of button clicks, staff will see their impact on future analysis and potential improvements in the Cancer Center. This training would be most beneficial for nurses working with the Arrival database and the pharmacists in the CC INF to achieve accurate and reliable data.
9.4.2 Workflow Interruption Awareness Additionally, the team researched ways to continuously improve patient safety. A recent study from January 2006 studied the effect of interruptions have on the staff on a Cancer Center Pharmacy (Metropolitan). The pharmacy was able to reduce their dispensing errors
26
by 40% by simply creating an area called the “safe zone”. In this area, the pharmacist is never to be interrupted. When a drug order is in this safe zone it is not ready, once it is ready, the finished drug product is placed on the “To Go” counter. This step, to avoid interruptions, drastically increased the patient safety level of the pharmacy and should be implemented in the CC INF pharmacy.
9.4.3 IDS Electronic Instruction Manuals In the CC INF pharmacy, both the pharmacists and pharmacy technicians share hard copies of the IDS instruction manuals. Currently, there is only one copy of each volume of these instruction manuals. This can become a bottleneck in the system when both a pharmacists and a pharmacy technician need the same instruction manual to prepare a drug order. The following are some possible solutions to reducing this bottleneck:
• Create one additional copy of each IDS instruction manual binder • Reduce the number of IDS drugs in each binder, thus creating more binders and
decreased chance for overlapping use • Provide training for the electronic IDS instruction manuals to pharmacists
The last recommendation for the electronic IDS instruction manual training for the pharmacists is to reserve the hard copy manuals for the pharmacy technicians. Some pharmacists do not feel comfortable using the electronic version, and training would help to familiarize them with the program. In addition, because some pharmacists are not using the electronic manuals due to all the button clicks needed to access it online, a desktop shortcut should be added to the pharmacists’ computers for faster access.
9.5 Regular Staff Meetings In order for the CC INF pharmacy to better work as a team, the team recommends implementing regular, weekly or bi-weekly, staff meetings. These brief meetings can be scheduled during low peak times during the day and will help staff collaborate to develop ideas on how to run the pharmacy more efficiently. This will also help to improve worker morale as ideas are brought forth to other workers and pharmacy managers.
9.6 Future Study Recommendations If more accurate data is collected, further studies can be done using simulation methods to determine if ordering by complexity - the time is takes to prepare a drug order in the hood - is in the best interest of the CC INF pharmacy. The team believes Little’s Law, as mentioned in Section 9.3, can be used to address this scheduling possibility. If the CC INF would like to decrease average wait times for patients, this study using the implications of Little’s Law should be further investigated. This could most likely be achieved by arranging the queue with less complex drug orders – ones that take less time to prepare – being placed in front of more complex drug orders. However, rules should be in place that make it possible for a more complex drug to be surpassed only a certain number of times, to ensure drug orders are completed within a reasonable amount of time.
27
10 Expected Impact The findings, conclusions, and recommendations of this report have the following expected impact:
• Provided CC INF faculty with quantifiable metrics for pharmacy performance • Reduced pharmacy staff high workload to allow proper breaks throughout workday • Decreased high turnaround times, which will lead to increased patient satisfaction • Reduced non-value added work while maintained patient safety • Sequenced work in the CC INF, improving the current process • Heightened awareness of improvement opportunities and suggested future studies • Improved overall safety of the CC INF
28
Acknowledgements The team would like to acknowledge the following individuals that help contribute to this project:
• Kelly Wright, CC INF Pharmacy, Manager • Kim Redic, UMHS IDS, Coordinator • Robert Beasley, Management Engineer Fellow • Zachary Shoup, Management Engineer Fellow • CC INF Pharmacists • CC INF Pharmacy Technicians • Mark Van Oyen, Professor IOE 481 • Brock Husby, G.S.I. IOE 481
29
References
Lepper, Carol. “Improvement Report: Lean Thinking Applied to Pharmacy Processes.” 2003. Institute for Healthcare Improvement. 16 March 2009 <http:ihi.org>. Little, John D. C. “A Proof for the Queuing Formula: L=λ·W” Case Institute of Technology, 1960. “Metropolitan Hospital Reduces Dispensing Errors in the Pharmacy by 40 Percent.” 2006. Institute for Healthcare Improvement. 16 March 2009 <http:ihi.org>.
30
Appendix 1: Volume of Appointments and Dispensed Drug Orders
2,000
2,200
2,400
2,600
2,800
3,000
3,200
3,400
3,600
Num
ber o
f Visits
Cancer Center Visits / AppointmentsJan 2006 ‐ Feb 2009 (n = 114,415)
2006
2007
2008
2009
31
Appendix 2: Flowcharts – Pharmacists
32
Appendix 3: Flowcharts – Pharmacy Technicians
33
Appendix 4: IDS Hood Product Preparation Time Study
34
Appendix 5: Simulation Distributions In-hood drug product preparation time distribution
• Pearson 5(alpha = 5.63, beta = 116) Drug order arrival distributions