University of Minnesota St. Anthony Falls Hydraulic Laboratory Project Report No. 212 HYDROPOWER FEASIBILITY AT THE RUM RIVER DAM IN ANOKA, MINNESOTA by Richard K. Renaud Avry Dotan and John S. Gulliver Prepared for STATE OF MINNESOTA DEPARTMENT OF NATURAL RESOURCES St. Paul, Minnesota August, 1982
Transcript
University of Minnesota St. Anthony Falls Hydraulic Laboratory
Project Report No. 212
HYDROPOWER FEASIBILITY
AT THE
RUM RIVER DAM IN ANOKA, MINNESOTA
by
Richard K. Renaud
Avry Dotan
and
John S. Gulliver
Prepared for
STATE OF MINNESOTA DEPARTMENT OF NATURAL RESOURCES
St. Paul, Minnesota
August, 1982
The University of Minnesota is committed to the policy that all persons shall have equal access to its programs, facilities, and employment without regard to race, creed, color, sex, national origin, or handicap.
ACKNOWLEDGEMENTS
This study was performed under the general supervision of Professor Roger E. A. Arndt, Director of the St. Anthony Falls Hydraulic Laboratory. Alan Rindels compiled hydrologic and project development information. Reza Taghavi made field observations and hydrologic computations.
i
r' TABLE OF CONTENTS
Page No~
Acknowl~dgemen t s •••••••••••••••••••••••••••••••••••••• i
Li s t of Figures ••••••••••••••••••••••••••••••••••••••• v
List of Tables •••••••••••••••••••••••••••••••••••••••• vii
II. SUMMARY, CONCLUSIONS, AND RECOMMENDATIONS •••••••••• 2
III. SITE CHARACTERISTICS AND EXISTING FACILITIES ., . , . , ..... 4
A. Site Description and Locati~n ••••••••••••••••••••• 4 B. Historical Background •••••• '. • • • • • • •.• • • • • • • • • • • • • • • 12
IV. HYDRAULICS AND HYDROLOGY •••••••••••••••••••••••••••••• 13
A. Description of the Drainage Area •••••••••••••••••• 13 B. Flow Duration •. " .......... ,." •• .;,. .•••.•.•.• "....... 13 C. Headwater and Tailwater Elevations •••••••••••••••• 16 D. Flood Frequency and Spillway Design Flood ••••••••• 16
V. CURRENT DEMAND AND VALUE OF ENERGy..................... 22
A. Current Demand and Energy Usage ••••••••••••••••••• 22 B. Value of Energy and Power ••••••••••••••••••••••••• 22
VI. FACILITY OPERATION •••••••••••••••••••••••••••••••••••• 25
VII. PROJECT DEVELOPMENT ALTERNATIVES •••••••••••••••••••••• 26
A. Alternative A: One 2000 rom Adjustable Blade Horizontal Tube Unit •••••••••••••••••••••••••••• 27
B. Alternative B: A Combination of a 72 in. and 48 in. Fixed Blade, Inclined Mini Tube Units •••• 31
C. Alternative C: One 2150 rom Horizontal Full Kaplan Unit ...................................... 35
D. Other Development Alternatives •••••••••••••••••••• 38 E. Summary of Project Development Alternatives ••••••• 38
iii
VIII.
IX.
ECONOMIC ANALYSIS ..................................... A.
Comparison of Project Development Alternatives •••• Cost and Benefit Streams •••••••••••••••••••••••••• Private Financing Example ••••••••••••••••••••••••• Sensitivity Analysis . ............................ . 1. Demand Charge Credit •••••••••••••••••••••••••• 2. Variation of Project Cost ••••••••••••••••••••• 3. 4.
5.
Value of Energy .•..••..••.••.•......••••..••.•• Variation in Operation, Maintenance, and
Replacement Costs ••••••••••••••••••••••••••• Discount and Escalation Rate ••••••••••••••••••
ENVIRONMENTAL IMPACT OF PROPOSED DEVELOPMENT
A. B. C. D. E. F. G. H. I.
Background •••••••.••••••••••••••••••••...•••• ~' •..• FERC Requirements ••••••••••••••••••••••••••••••••• Water Level Fluctuations and In-Stream F1QwS •••••• Water Quality ••••••••••••••••••••••••••••••••••••• Construction Impacts •••••••••••••••••••••••••••••• Historic Preservation ••••••••••••••••••••• ~ ••••••• Endangered Species . .............................. . Recreation ....................................... . Agency Contacts/Correspondence . .................. . References ........................................
iv
Page No.
39
39 39 40
41 41 46 48 48 48 48
48 48
52
52 52 53 53 54 54 56 56 56
60
figur~ No.
1
2
3
4
5
6
7
8
9
LIST OF FIGURES
Project location of the Anoka Dam on the Rum River.
Plan view of the Rum River Dam at Anoka.
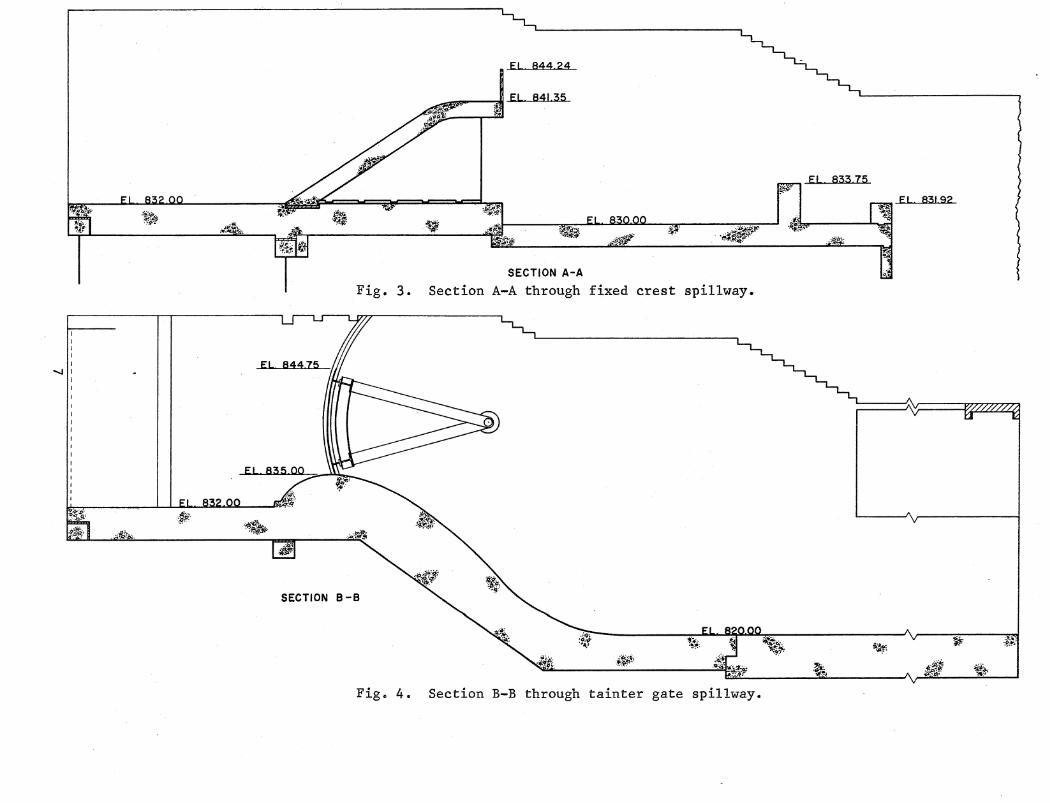
Section A-A through fixed crest spillway.
Section B-B through tainter gate spillway.
Elevation view of the Rum River Dam.
View upstream at Rum River Dam from Main Street bridge.
View from right abutment showing Amberson-Type spillway with flashboards and west retaining wall of the tainter gate spillway.
Upstream view of the tainter gate spillway. Note old foundation and proposed powerhouse area to the right of tainter gate spillway.
View of the tainter gate spillway and the proposed powerhouse intake.
10 View of the tainter gate spillway outlet. The location of the proposed tailrace is to the right of the spillway.
11 Downstream view from the tainter gate spillway outlet. Note Main Street bridge.
12 Flow duration curve for' the Rum River Dam.
13 Monthly flow duration curves for the Rum River Dam.
14 Dry year flow duration curve for the Rum River Dam, occurring in 1934.
15 Wet year flow duration curve for the Rum River Dam, occurring in 1972.
16 Tailwater elevation curve for the Rum River Dam.
17 Headwater elevation curve for the Rum River Dam.
v
Figure No.
18
19
20
21
22
23
24
25
26
27
Flood frequency of recurrence for the Rum River Dam.
Electricity demand curve for the City of Anoka on a typical day (July 15, 1980).
Plan view showing powerhouse location.
Section view of Alternative A: One 2000 rom adjustable blade horizontal tube turbine.
Plan view of Alternative A.
Plan view of Alternative B: One 72 in. and one 48 in. fixed blade inclined Mini-Tube unit.
Section view of 72 in. runner diameter unit for Alternative B with generator output is 375 kW at 460 cfs discharge and 12.3 feet net head.
Section view of 48 in. runner diameter unit for Alternative B with generator output of 177 kW at 215 cfs discharge and 12.3 feet net head.
Section view of Alternative C: One 2150 rom horizontal full Kaplan unit.
Plan view of Alternative C.
vi
LIST OF TABLES
Table No.
1 Monthly Demand and Energy Usage for the Municipality of Anoka During 1980.
2 First Year Cost of Power, Benefit-Cost Ratio, Net Present Value and Internal Rate of Return for Alternatives A, B, and C.
3 Cost and Benefit Streams for Development Alternative A at the Rum River Dam. Base Year for Present Worth is 1982. TwoYear Construction Period. 11 Percent Discount Rate and 9 Percent Escalation Rate. All Figures in Dollars.
4 Cost and Benefit Streams for Development Alternative B at the Rum River Dam. Base Year for Present Worth is 1982. TwoYear Construction Period. 11 percent Discount Rate and 9 Percent Escalation Rate. All Figures in Dollars.
5 Cost and Benefit Streams for Development Alternative C at the Rum River Dam. Base Year for Present Worth is 1982. TwoYear Construction Period. 11 Percent Discount Rate and 9 Percent Escalation Rate. All Figures in Dollars.
6 Example Cost and Benefit Stream for Development Alternative C Using Private Financing at the Rum River Dam. Base Year for Present Worth is 1982. Two-Year Construction Period. 13 Percent Discount Rate and a 9 Percent Escalation Rate. All Figures in Dollars.
7 Example Cost and Benefit Stream for Development Alternative C Using Private Financing at the Rum River Dam. Base Year for Present Worth is 1982. Two-Year Construction Time. 15 Percent Discount Rate and a 9 Percent Escalation Rate. All Figures in Dollars.
8 Benefit-Cost Ratio, Net Present Value and Internal Rate of Return with a 20 Percent Increase and Reduction in Demand Charge Credit for Alternative C.
9 Benefit~Cost Ratio, Net Present Value and Internal Rate of Return at a Thirty Percent Increase and Reduction of the Original Project Cost of Alternative C.
vii
Table No.
10
11
12
13
14
Benefit-Cost Ratio, Net Present Value and Internal Rate of Return at Various Values of Energy for Alternative C.
Benefit-Cost Ratio, Net Present Value and Internal Rate of Return at a Twenty-Five Percent Addition and Reduction from the Original Operation, Maintenance and Replacement Cost for Alternative C.
Benefit Cost Ratio, Net Present Value and Internal Rate of Return at Four Combinations of Discount and Escalation Rates for Alternative C.
Percent Composition and Spawning Season of Fish Population Upstream of the Rum River Dam.
Percent Composition and Spawning Season of Fish Population Downstream of the Rum River Dam.
viii
I. INTRODUCTION
The Rum River Dam MN 00549 is located on the Rum River in Anoka, Minnesota. The existing dam, completed in 1970, replaced a log timber dam operated by Pillsbury-Washburn Milling Company until 1935, when the title was trasferred to the City of Anoka. The mill was located on the left bank of the river adjacent to the dam, and its five turbines had a combined capacity of 450 HP. The purpose of this study is to assess the feasibility of developing hydropower production facilities at the Rum River Dam.
The Rum River Dam was included in a grant agreement dated September 22, 1980, between the Minnesota Department of Natural Resources and the St. Anthony Falls Hydraulic Laboratory for hydroelectric power feasibility studies on seven municipally owned dam sites in the State of Minnesota. The Minnesota Department of Natural Resources and the City of Anoka subsequently made a cost-sharing agreement for the feasibility study. Authorization to begin the Rum River Dam feasibility study was given on May 21, 1981.
This study begins with a hydraulic and hydrologic analysis of the site to determine the available power. The value of the power and marketing options are then determined. The core of the study is proposed development alternatives which include preliminary designs, project cost estimates, and the estimated power production of each alternative. Finally, the benefit and costs of each development alternative are compared and the environmental impact of the proposed development is evaluated.
1
II. SUMMARY, CONCLUSIONS, AND RECOMMENDATIONS
The Rum River Dam located at Anoka, Minnesota, is owned and operated by the City of Anoka. The Rum River Dam consists of an Amberson-type spillway 11.4 ft high and 236 ft long. The spillway is abuted on the east by an Ogee-type .t:ainter gate spillway. The tainter gate spillway is 20 ft wide, 15 ft high, with a spillway basin 88 ft in length. To the west of the spillway is a retaining wall set on pile footings which serves mainly for erosion control along the bank. The top of the abutment is 9 feet above the spillway crest and extends 84 feet along the west end of the fixed crest spillway and spilling basin. The dam is equipped with 2.9 ft high flashboards which are in good condition. 'There are presently no hydropower generating facilities at the Rum River Dam.
The averagz annual discharge at the site is 697 cfs, and the drainage area is 1590 mi. The design net head is approximately 12.3 ft. The maximum discharge over the period of record was 11,800 cfs, occurring in 1965. The minimum discharge recorded was 34 cfs occurring in 1934.
All of the energy produced at the proposed hydropower facilities will be used to offset energy purchases from Northern States Power Company (NSP). The value of the hydroelectric energy, therefore, is equal to the rate at which the Anoka utility purchases energy from NSP. Operation of hydropower facilities will also reduce the monthly demand charge paid by the Anoka utility to NSP. An estimate of the average reduction in demand charge which may be expected in each month of the year is given in Section V. Operating the hydropower facility in a peak mode will transfer some energy production from off-peak hours and reduce the demand charge.
The present contract between Anoka and NSP utilizes three separate rates: the energy charge, a fuel adjustment charge which is tied in with NSP fuel costs, and the demand charge. In January of 1982 the Federal Energy Regulatory Commission approved a rate increase on the energy and demand charges. This rate increase is effective as of January 1982 and sets the energy charge at 2.128 cents/kWH, leaving the fuel adjustment charge near zero. The demand charge is based upon the greatest 15 minute average demand of each month. The present demand charge is $4.60/kW/month.
All calculations in this study are based upon January 1982 dollars. The January 1982 value of energy (2.128 cents/kWH) is assumed to be applicable to energy plus the fuel adjustment charge. The energy value of 2.128/kWH and a demand charge of $4.60/kW/month will be used in the economic analysis in Section VIII.
Three development alternatives were considered. A summary of design capaci ty , total initial cos t, total average annual benef its, and 35-year
2
project life benefit-cost ratio for all three development alternatives are given below (1982 base year):
Total Total Average 35-Year Design Initial Annual Project Life
Alternative Capacity (kW) Cost ($) Benefits ($) Benefit-Cost Ratio
A 565 1,965,000 68,600 0.72 B 552 2,087,000 71,100 0.72 C 603 1,113,000 75,600 0.75
Of the three development alternatives considered, Alternative C has the best economic feasibility. The cost and benefit streams illustrated in Tables 3, 4, and 5 of Section VIII indicate that all three of the proposed development alternatives will not be feasible given the economic assumptions made herein.
An economic sensitivity analysis indicates that variation in project parameters and economic assumptions will not alter the negative feasibility of the proposed development. Variations in demand charge credit; project cost; value of energy; operation, maintenance, and replacement costs; and discount and escalation rates were considered.
The potential environmental impacts of the proposed development are minor since no new impoundment will be constructed. The greatest potential impact would occur during construction of the powerplant when dredging and other activities may impair water quality or interfere with fish spawning.
RECOMMENDATION:
Based upon the economic analysis of Section VIII, it is not recommended that hydropower facilities be constructed at the Rum River Dam.
3
III. SITE CHARACTERISTICS AND EXISTING FACILITIES
A. Site Description and Location
The Rum River Dam MN 005l.9 is located on the Rum River in the City of Anoka, approximately 0.75 miles upstream from the Mississippi River. The dam abuts land described as Lot 2 - Pillsbury-Watson Subdivision, and Lot 6 - Pillsbury Subdivision, City of Anoka, further described as SE1/4 of Section 1, Township 32 North, Range 25 West of the 4 P.M., Anoka County, Minnesota. The location of the Anoka Dam is shown in Fig. 1.
The Rum River Dam consists of an Amberson-type spillway 11.4 ft high and 236 ft long. The spillway is abuted on the east by an Ogee-type tainter gate spillway. The tainter gate spillway is 20 ft wide, 15 ft high, with a spilling basin 88 ft in length. A plan view of the project area is given in Fig. 2. Cross sections of the fixed crest spillway and the tainer gate spillway are given in Figs. 3 and 4. A view looking upstream towards the dam is given in Fig. 5. Photographs of the project are given in Figs. 6 through 11.
To the west of the spillway is a retaining wall set on pile footings which serves mainly for erosion control along the bank. The top of the abutment is 9 feet above the spillway crest and extends 84 feet along the west end of the fixed crest spillway and spilling basin. The west abutment and tainter gate spillway both allow public access and use of the facilities.
There are two rows of steel sheeting under the dam, both serving as seepage cutoffs. The front row is new sheeting placed upstream of the dam, and a second row 19 feet downstream of the new sheeting, which is part of the old structure. To monitor the effectiveness of these seepage cutoffs a piezometric system was installed under the foundation slabs. Piesometric readings are taken at least once each year and when there is maximum differential head, as outlined in Ref. [1]1.
The dam is equipped with 2.9 ft high flashboards which are in good condition. Through a system of cables the flashboards are automatically tripped at headwater elevation 848.5, if they are not removed manually at headwater elevation of 847, as advised in the operations and maintenance manual [1].
lNumber in brackets indicate references on page 60.
4
"
Fig. 1. Project locat:ton of the Anoka Dam ori. the RUm River.
5
- - - --I ';:; ;:; :: ...... . \
\ \
) , , PARKING
LOT 1- _
I , , 1
I - - - - - ----.) - - i = .= =' -=-, - - - - .-
I : CONC. ii , , RET. II
,J , WALL If
"
, , J
I ,_ 1- - -"--1 I '../ 1 _______ r, ANOKA
CO-OP EI,.EC.
, , , , I , , , , I '- - - ___ J
'1-r----., I ANOKA I BODY I SHOP L ____ ...J
CONC. RET.
WALL
TREE LINE
838 836
t N
~ FENCE
x-xi K
I x
'\0). - ..... , PARKING / 'LOT
'... '\0 , "'(11 ,
I 8· CONC. I CURB I
:"l I ... ,.. __ .J
co N co
R~T. WALL.
6' MONO WALK
" " 1.1
. 1 .. , II , ------, .... ---, , " , ,
.... ' 12" C.M.P. " , , , , ~... 4' FLAG STONE 1111 MONO.' ,
Fig. 4. Section B-B through tainter gate spillway.
III L __
\ \ \ \ \ \ -, I I I I I I III
'--=;~~i. : - - J rr- -r
I
8
I
I I
I
• bO
'0-1 f:l:.l
Fig. 6. View upstream at Rum River Dam from Main Street bridge.
Fig. 7. View from right abutment showing Amberson-Type spillway with flashboards and west retaining wall of the tainter gate spillway.
9
Fig. 8. Upstream view of the tainter gate spillway. Note old foundation and proposed powerhouse area to the right of tainter gate spillway.
Fig. 9. View of_the tainter gate spillway and the proposed powerhouse intake.
10
Fig. 10. View of the tainter gate spillway outlet. The location of the proposed tailrace is to the right of the spillway.
Fig. II. Downstream view from the tainter gate spillway outlet. Note Main Street bridge.
I I
B. Historical Background
The first dam on the Rum River at Anoka was built with logs cut near Round Lake and floated downstream to the dam site for a sawmill built on the site. The original dam structure was destroyed several times before 1856. A new structure was built which lasted until the late 1890's when a fire burned it to the waterline. At that time, the structure was again rebuilt to provide power for the Lincoln Mill Flour Company. The, 12 foot timber dam backed up the water for a distance of 5.7 miles. The mill was located on the left bank of the river adjacent to the dam and its turbines had a combined capacity of 450 HP.
In the early 1900' s the dam was obtained by the Pillsbury-Washburn Milling Company (forerunner of Pillsbury Mills, Inc.) and they maintained the dam until 1935 when the title was transferred to th.e City of Anoka. At Anoka the Pillsbury Mining Company of Minneapolis operated the Lincoln Mill by water power. The mill was later torn down and now only the foundation remains as an historical landmark. The flumes through which water formerly was conducted from the dam to the waterwheels are also gone and the openings in its upper end have been blocked by concrete bulkheads.
12
IV. HYDRAULICS AND HYDROLOGY
A. Description of the Drainage Area
The Rum River is a tributary of the Mississippi River and therefore part of the Upper Mississippi River drainage basin.
The area drained by the Rum River is in East-Central Minnesota, chiefly in Mille Lacs, Isanti and Anoka Counties. The Rum River originates in Lake Mille Lacs, and for 16 miles flows through three lakes bordered by flat, marshy shores; the entire fall over this range is less than 2 feet. Below the lal<.e the river winds southward as far as Princeton, where it is joined by the West Branch. Below Princeton it flows eastward in a still more winding course until it reaches Cambridge, where it turns to the south and enters the Mississippi at Anoka.
The principal tributaries are West Branch, Tibbetts, and Bogus Brooks, and Upper and Lower Stanchfield and Cedar Creeks. With the exception of the West Branch of the Rum River the streams are small.
The dam at Anoka is 0.75 miles above the confluence of the Rum and Mississippi Rivers. The drainage area at the dam site is 1590 miles squared.
B. Flow Duration
The flow duration curve for the Rum River Dam of Anoka was developed by the use of a drainage area relationship between the nearest U.S.G.S Gage and the dam site. The nearest U.S.G.S. Gage is located 20 miles upstream of the dam at Saint Francis. The drainage area at Saint Francis is given by the U.S.G.S. as 1360 miles. The following linear relationship was used:
Qi (at the dam site) [ Drainage Area at Anoka ] = Drainage Area at St. Francis Qi(USGS Gage
at St. Francis
or
Qi = 1.17 Qi(USGS Gage at St. Francis)
The resulting flow duration curve is given in Fig. 12. The Average annual flow at the Rum River Dam was similarly established to be 697 cfs.
Flow duration curves were also computed for each month over the period of record and are shown in Fig. 13. The driest and wettest years of record
13
4,000
3,000
-u w C/)
rt) .......
l-LL "-'"
LaJ 2,000 (!)
0:: <r: J: u tJ)
C
0::: LaJ > 0::: 1,000
o 20 40 60 80 100 I . .
0/0 OF TIME FLOW IS EQUALED OR EXCEEDED
Fig. ]2. Flow duration curve for the Rum River Dam.
14
2,000
-IJ.J (!) 1,000 ct: -' <f J: U (J) -a a: w >
500
J
% EXCEEDANCE FLOW 0= 25%
F M A M J
® = 50% e=75 %
e = 95% () = 100 %
J A SON 0
Fig. 13. Monthly flow duration curves for the Rum River Dam.
15
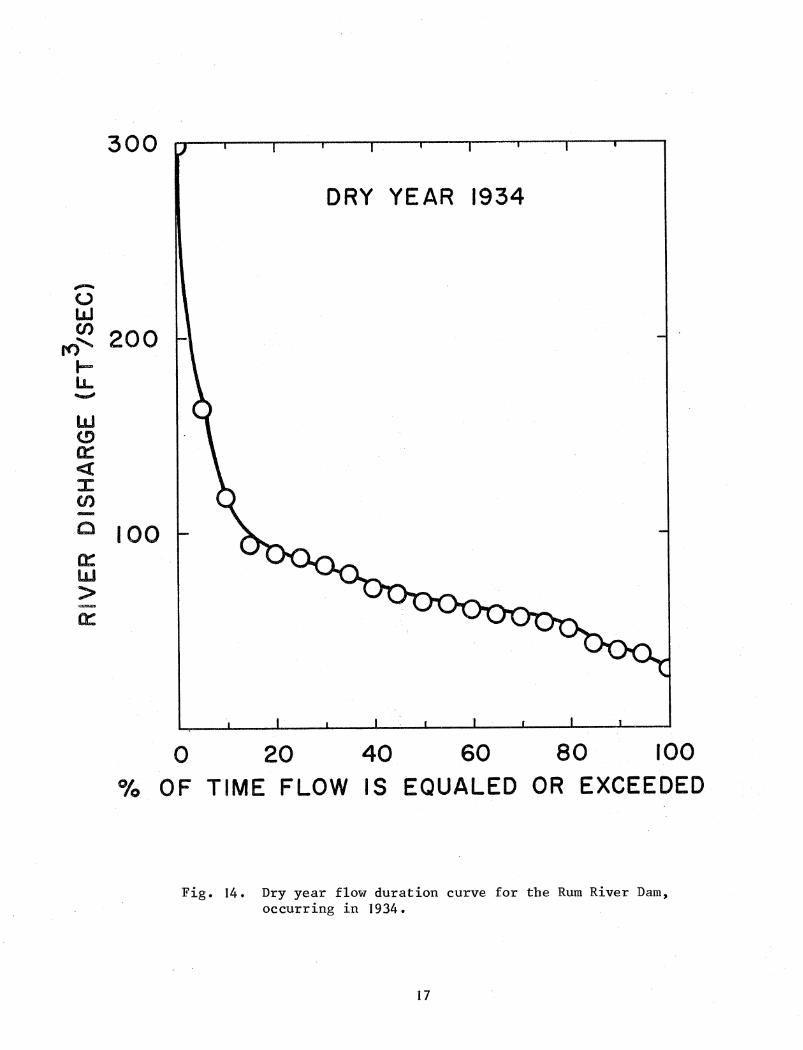
are water years (October through September) 1934 and 1972, respectively. The flow duration curves for these years are shown in Figs. 14 and 15.
The Rum River Dam at Anoka is classHied as a run-of-river since it has no seasonal peaking capabilities. There is, however, a small amount of storage which may be used for a limited amount of daily peaking. Daily peaking allows operation of the facilities during periods of low flow and peak demand.
The Rum River Dam at Anoka creates a reservoir extending about 6.0 miles upstream of the dam, with a surface area,of approximately 210 acres. ' Drawing the reservoir down 0.8 feet over 5 hours will add 407 cfs to the turbine discharge.
C. Headwater and Tailwater Elevations
The headwater, and tailwater elevation' curves have been established by Barr Engineering during the design of the dam. During a field test the tailwater curve was discovered to deviate from the original curve established by Barr Engineering at the lower flows. Low flow tailwater elevations were therefore adjusted and incorporated into the corrected Tailwater curve given in Fig. 16. The Headwater curve is given in Fig. 17.
Since the dam at Anoka is a short distance (0.75 miles) from the Rum River's confluence with the Mississippi River, the minimum tailwater elevation at Anoka will be established by the stage at the Mississippi River.
D. Flood Frequency and Spillway Design Flood
The discharge of the Rum River has bee~ gaged near St. Francis for a period of 32 years. Utilizing the record of flow at St. Francis and a drainage area relationship between St. Francis and Anoka, a dischargefrequency curve has been developed for Anoka by Barr Engineering as shown in Fig. 18. The curve indicates the probable flood discharge which could be expected for various recurrence intervals. For instance, the curve indicates that a flood flow of 16,000 cfs can be expected to occur on the, average of once in 150 'years. The greatest flood in the period of record was 11,800 cfs, occurring in 1965.
The dam is designed to handle all flood flows up to 16,000 cfs. Because of the tailwater conditions prevailing, the critical discharge for various parts of the dam are frequently at relatively low flood flows. Because the tailwater rises rather rapidly at high discharges, it is probable that flood flows even greater than 16,000 cfs can be passed without damage to the dam. [1]
16
-U I.&J en
rt)' ..... lL. ....".,
lLJ <!) a:: « :c (J) ..-
0
~ w > 0::
300
DRY YEAR 1934
200
100
o 20 40 60 80 100 % OF TIME FLOW IS EQUALED OR EXCEEDED
Fig. 14. Dry year flow duration curve for the RUm River Dam, occurring in 1934.
17
,,-u w (f)
rt)'
l-lL. -W (!) a::: <:( J: U (f)
0
a:: w > a::
12,000
WET YEAR 1972
10,000
8,000
6,000
4,000
2,000
o o 20 40 60 80 100
0/0 OF TIME FLOW IS EQUALED OR EXCEEDED
Fig. 15. Wet year flow duration curve for the Rum River Dam, occurring in 1972.
1,000 1.0 1.5 3.0 5.0 10 30 100 500 1,000 FREQUENCY OF RECURRENCE~YEARS
Fig. 18. Flood frequency of recurrence for the Rum River Dam [1].
V. CURRENT DEMAND AND VALUE OF ENERGY
A. ,Current Demand & Energy Usage
The City of Anoka is a municipal utility with its own distribution system. All power generated from the hydropower facilities will therefore be used to offset power purchases from Northern States Power Company (NSP) by the Anoka Municipal Utility.
A typical daily demand distribution shown in Fig. 19 indicates that the demand is relatively constant throughout the daytime period (8 a.m. through 8 p.m.), with the peak demand usually occurring between 3 p.m. and 8 p.m •• The. monthly demand and energy usage for 1980 are given in Table 1.
TABLE 1. Monthly Demand and Energy Usage for the Municipality of Anoka During 1980
Month Energy (GWH) Demand
January 126.00 25.198 February 115.75 23.542 March 119.44 22.279 April 105.00 21.972 May 112.56 26.384 June 109.36 29.129 July 130.00 31.800 August 126.84 28.116 September 99.96 28.811 October 108.69 21.357 November 112.00 22.657 December 119.00 23.897
B. Value of Energy and Power
(MW)
All of the energy produced at the Anoka hydropower facilities would be used to offset energy purchases from NSP. The value of the hydroelectric energy is therefore equal to the rate at which Anoka purchases energy from NSP.
22
30,000 I
:= ~
z N ~ 20,000 \..<)
Z <l ~ W Cl 10,000
o 4
PEAK DEMAND
8 12 HOUR
16 20
Fig. 19. Electricity demand curve for the City of Anoka on a typical day (July 15, 1980).
24
r
The terms of the present contract between Anoka and NSP has three separate charges; the energy charge, a fuel adjustment charge which is tied in with NSP fuel costs, and the demand charge. In January of 1982 the Federal Energy Regulatory Commission approved a rate increase on the energy and demand'charges. This rate increase is effective as of January 1982 and set the energy charge at 2.128 cents/kWH, leaving the fuel adjustment charge near zero. The demand charge is based upon the greatest 15 minute average demand of each month. The present demand charge is $4.60/kW/month.
All calculations in this study. are based upon January, 1982, dollars. The January, 1982, value of energy (2.128 cents/kWH) is assumed to be applicable to energy plus the fuel adjustment charge. The energy value of 2 .. 128/kWU and a demand charge of $4.60/kW/month will be used in the economic analysis in Section VIII.
Operation of the hydropower facilities during the peak period will reduce the monthly demand charge. The annual reduction in demand charge is herein referred to as capacity credit. Determination of the average reduction in demand charge which may be expected in each month of the year was determined as follows.
. 1. The minimum expected power output over the peak demand period was determined for each month over 20 years of record. The minimum power out-. put was assumed to occur at the minimum flow conditions of each month.
2. The minimum power output was averaged over the 20 year period to give dependable power output.
3. The value of dependable power was then determined, by applying the present demand charge to the dependable power output.
4. It is estimated that the actual peak demand will occur within the selec.ted peaking period of 3 p.m. to 8 p.m, approximately 80 percent of the time. Therefore 80 percent of the capacity credit of part 113 was used in the economic analysis in Section VIII.
24
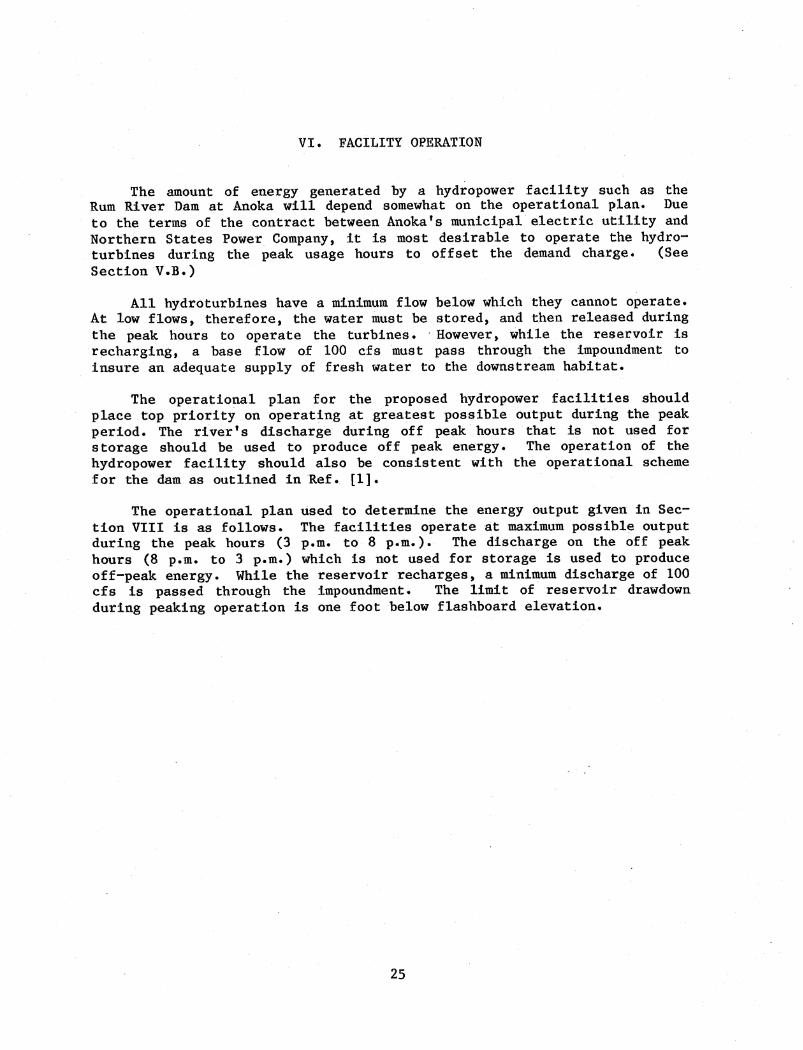
VI. FACILITY OPERATION
The amount of energy generated by a hydropower facility such as the Rum River Dam at Anoka will depend somewhat on the operational plan. Due to the terms of the contract between Anoka's municipal electric utility and Northern States Power Company, it is most desirable to operate the hydroturbines during the peak usage hours to offset the demand charge. (See SectionV.B.)
All hydroturbines have a minimum flow below which they cannot operate. At low flows, therefore, the water must be stored, and then released during the peak hours to operate the turbines. . However, while the reservoir is recharging, a base flow of 100 cfs must pass through the impoundment to insure an adequate supply of fresh water to the downstream habitat.
The operational plan for the proposed hydropower facilities should place top priority on operating at greatest possible output during the peak period. The river's discharge during off peak hours that is not used for storage should be used to produce off peak energy. The operation of the hydropower facility should also be consistent with the operational scheme for the dam as outlined in Ref. [1].
The operational plan used to determine the energy output given in Section VIII is as follows. The facilities operate at maximum possible output during the peak hours (3 p.m. to 8 p.m.). The discharge on the off peak hours (8 p.m. to 3 p.m.) which is not used for storage is used to produce off-peak energy. While the reservoir recharges, a minimum discharge of 100 cfs is passed through the impoundment. The limit of reservoir drawdown during peaking operation is one foot below flashboard elevation.
25
VII. PROJECT DEVELOPMENT ALTERNATIVES
In this section, the costs and expected annual energy production of three development alternatives for the Anoka hydropower facilities are considered. Project development alternatives were formulated in the following manner:
• Once the hydraulic and hydrologic analysis was performed, the first step in choosing development alternatives was to determine which types of hydroturbines are most applicable to the site. Turbine and generator manufacturers were then contacted to obtain cost estimates of specific turbine/generator units, since they are the major equipment item in a hydropower facility. Turbine performance curves were also obtained.
• The expected annual energy production was computed for each of the three alternatives using flow duration, headwater and tailwater information, and turbine performance curves.
• The income generated by displacing energy to be bought from NSP and reducing the monthly demand charge was computed by the method described in Section V.B.
• Construction costs were estimated on the basis of unit costs applied to preliminary layout drawings. Construction cost estimates include facilities' structural costs as well as diversion, removal, and excavation costs. A 25 per cent contingency allowance was added to cover smaller items and possible omissions. A 10 percent profit factor was also included in the total cost.
• When electrical equipment costs were not included in the turbine/ generator cost estimates, these costs were estimated based upon information obtained from a well known generator/switchgear/controls manufacturer. Electrical equipment costs include switchgear, transformer, control switchboard, wire and cable system, conduit, grouping, and lighting.
• Freight and installation estimates for turbines and generators were based on the manufacturer's recommendation.
• Miscellaneous powerplant equipment costs were estimated according to guidelines in Ref. [2]. Equipment for ventilation, fire protection, communication, and turbine/generator bearing cooling water is included in this category. The cost estimates include 15 percent for freight and installation. The July 1978 cost base was escalated to January, 1982, according to the Consumer Price Index.
26
• A multiplier of 20 percent was applied to the final project cost for engineering, construction management, and other costs [2]. These costs include expenditures for license and permit application, preliminary and final design, construction management, and administration.
• Annual operation, maintenance and replacement costs were computed using the technique described in Ref. [2] and escalated to January, 1982.
The plan view of the proposed powerhouse for the three development alternatives is shown in Fig. 20.
A. Alternative A: One 2000 nnn Adjustable Blade Horizontal Tube Unit
Alternative A consists of an Allis-Cha1mer standard Tube unit, with a maximum discharge of 637 and a rated generator output of 565 kW at 12.3 ft net head.
The advantage to an adjustable-blade turbine is that the turbine may be operated over a range of flows, rather than at one specific design discharge. The disadvantage is that the adjustable blade capability adds cost to the unit.
For Alternatives A andB, turbine/generator package and electrical equipment were obtained as one cost estimate. The turbine/generator package for these alternatives includes:
- Turbine - Gear speed increaser - Induction generator - Coupling - Blade positioner (for adjustable-blade units) - Hydraulic power unit to operate valve and blade positioner - Indoor generator protection and control panel - Outdoor switchgear - Outdoor step-up transformer - Outdoor disconnect switch - Fixed wheel intake gate
A plan and section view of a preliminary layout for Alternative A ·are given in Figs. 21 and 22. The cost estimates for Alternative A are as follows:
27
('
FLOW
U
DAM CREST ---------------.
DDDDDDDDDDDDDDDDDDDDDDDDDDDDDDDD
---..~------------
S30
TAl LWATER ------FL.OW
-U
DAM SPILLWAY
I. -!
IS" RIPRAP ON 10" OF SAND AND GRAVEL
RETAINING WALL
V ACCESS
TAILRACE
REMOVE
.-.-.-., - - I'"~
, '---' ' ___ I II I 1---' '---I I I I 'I 1_" I I I I 1 'SAVE,)" •
HEADRACE ! I .... '1
POWER- ......... . HOUSE ~
....... ............
L7'" ~ ...
y'"
RETAINING WALL
IS" RIPRAP --+11-- ON 10" OF
SAND AND GRAVEL
CITY PARKING LOT
Fig. 20. Plan view showing powerhouse location.
28
SITE PLAN
SCAL.E . 10' 5' 05' 10' e .......,
"'"' \.0
:if .;" ;~~~.
.' :!$J I !;:
.:f':e..
I 'I ..........
I .......... '~ I I
~ II-II: /
I ~ v-:!ij~}f~
/~:f:.
..pa~:
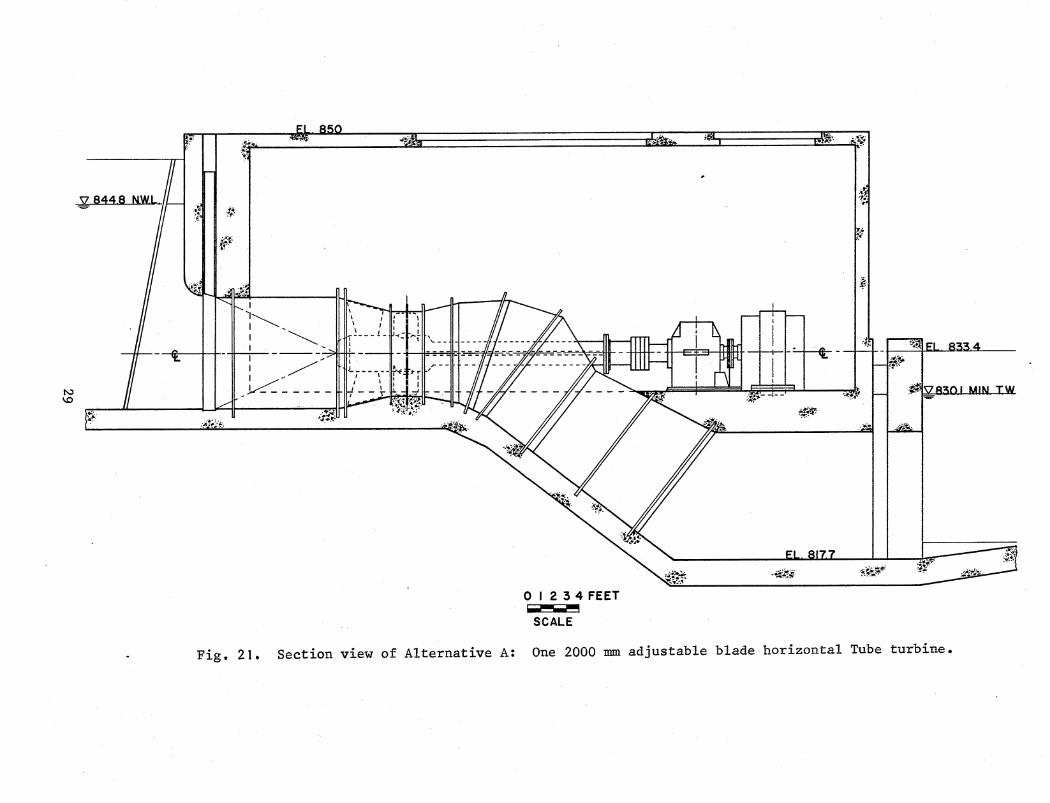
Fig. 21. Section view of Alternative A:
o I 2 34 FEET
--~ ~
SCALE
:lir
~.f~
.~~!;=
;.~"!i;;
~
·:4;.
'I', .~
. ....:.
·?l';..~~ ;f~;--;
One 2000 mm adjustable blade horizontal Tube turbine.
The annual energy production and benefits are (1982 base year):
Average Annual Energy Production Average Annual Energy Benefits Average Annual Demand Charge Credit Annual Gross Income
2.32 GWH $49,400 $19,200 $68,600
The annual operation, maintenance and replacement costs for Alternative A are estimated to be $19,300 (1982 base year).
B. Alternative B: A Combination of a 72 in. and a 48 in. Fixed Blade Incline.d Mini Tube Units
Alternative B consists of two Allis Chalmers inclined Mini-Tube units with a combined design discharge of 675 cfs and a generator output of 552 kW at 12.3 ft of net head.
Plans and section views of the preliminary layout for Alternative B are given in Figs. 23 through 25.
The cost estimates for Alternative B are as follows:
Alternative B Cost Estimates (1982 base year)
Civil works Turbine, generator, gates and electrical
equipment Turbine freight and installation Automatic controls Miscellaneous plant equipment Engineering, construction management, etc.
Fig. 23. Plan view of Alternative B: One 72 in. and one 48 in. fixed blade inclined Mini-Tube unit.
w w
:i~\:;
;~:. ,'ft. ':l~
;~i~l
..... ~N~ ... ~ I 't~, "6 EL 840..6 ~H~' .~l! <lit •• $'ft;Q n:qt<l.~ ......
.. ,~
o I 2 3 4 FEET
SCALE
.~ .:::~; -¥;'
EL 8369
.. :~l~ --:.
~'~if. 11.'
-~
=[;,
.f!'
A ~':;
1t~~
-------------- -----. ·Ai· ;j.~ .
Fig. 24. Section view of 72 in. runner diameter unit for Alternative B with generator output is 375 kW at 460 cfs discharge and 12.3 feet net head.
~'i' ~~~
::~~
MIN. T.W.
W .J:'o
Jf
1.~ :'!.#~
i!' ~y
I ,","':': S7 844 8 NWL ?ff;'
;.'¢,j.?
'i. ~ -~
.;~~-::~
.. ~~;;:
~
""!'i:: ~"
EL 8356
o I 23 4 FEET ..... ......, ~
SCALE
EL "8308
~j!, '~~i~
~~~l. ~r-'
~"f'
Fig. 25. Section view of 48 in. runner diameter unit for Alternative B with generator output of 177 kWat 215 cfs discharge and 12.3 feet net head.
;tl~
~
~
;-~~~
The annual energy production and benefits for Alternative Bare (1982 base year):
Average Annual Energy Production Average Annual Energy Benefits Average Annual Demand Charge Credit Annual Gross Income
2.44 GWH $51,900 $19,200 $71,100
The annual operation, maintenance and replacement costs for Alternative B are estimated at $19,200 (1982 base year).
C. Alternative C: One 2150 nun Horizontal Full Kaplan Unit
Alternative C is one horizontal full Kaplan turbine manufactured by The James Leffel & Company. The 2150 nun turbine has a design discharge of 650 cfs and a rated output of 603 kW at 12.3 ft of net head.
Leffel's preliminary cost estimate for generator, governor, and gear drive system was views of the preliminary layout for Alternative 27.
the turbine, synchronous $717,000. Section and plan C are given in Figs. 26 and
The cost estimates for this development alternative are as follows:
Alternative C Cost Estimates (1982 base year)
Civil works costs Turbine and generator Electrical equipment Turbine freight and installation Automatic controls Miscellaneous plant equipment Engineering, construction management, etc.
Total Initial Cost
$ 657,000 717,000 143,000 108,000
80,000 56,000
352,000
$2,113,000
The annual energy production and benefits for Alternative Care (1982 base year)
Average Annual Energy Production Average Annual Energy Benefits Average Annual Demand Charge Credit Annual Gross Income
2.57 GWH $54,700 $20,900 $75,600
The annual operation, maintenance, and replacement costs for Alternative C are estimated at $19,800 (1982 base year).
35
w ~
o o
ifJit: .~:I
;~~
,~. .it.
.9;.'
1 I
-HEIICc...=...: __ JC::::::: _
,. ~
o , 234 FEET ~~ ---SCALE
1£ r::L 0 ...... 0
·-iIiff f/)
Fig. 26. Section view of Alternative C: One 2150 mmhorizontal full Kaplan unit.
4 ~~~---=======~ ~ . ~~~'
"-
.",?+,' .,u,!
Ji.~
.:' ;;J.
- ~ l~: II---------~
w .......
II II II II
"lk: ·t.!:'fl>:
-rq.4q' ~"!'
~ - ------
,. 1ft I ANTI ;':,."
~~~T~: , ~ --- -"::J.:1~ ..... ""
)1)1.
../
.,-,.j'ff:'" ... -'!;i(!
o I 23 4 FEET .-..,IM'II ~
SCALE
Fig. 27. Plan view of Alternative C.
···~f.··
h---1
JJr=HliiFl--- ---I-
.... r-" ~~ ~
----Il---fl-+-I -I-
'i ~
-~- .... ~ £~~I J
D. Other Development Alternatives
There are other turbine manufacturers marketing turbines in the United States which are applicable to the Rum River Dam. Axel-Johnson, Inc. (KMW unit), Kvaerner-Moss (Sorumsand-Verksted unit), Dominion Bridge-Sulzer, Voest-Alpine, and Nissho-Iwa are all marketing tubular units with standardized designs which are comparable to Alternatives A, B, and C. The Neyrpic right-angle drive units manufactured in the United States by Hydro Energy System~, Inc., are a fixed-blade propeller turbine designed to fulfill the same market as the Allis-Chalmers Mini-Tube Units given in Alternative B. These manufacturers should be contacted during later stages of project development.
A number of generator manufacturers also responded to requests for bids on hydroelectric projects. In this case, the generator manufacturer would submit a bid in conjunction with one of the turbine manufacturers mentioned herein. Three generator manufacturers who have made bids for lOW-head hydroelectric developments are General Electric, Brown-Boveri, and Westinghouse.
E. Summary of Project Development Alternatives
There is not a great deal of difference in project cost and energy production between the project development alternatives. Alternative C appears to be most favorable because of the ability to generate more energy without a substantial increase in the project cost. All efforts should be made in the final design stages to increase the annual energy production and peaking capacity without substantially increasing the initial project cost.
38
VIII. ECONOMIC ANALYSIS
A. Background and Assumptions
This section of the report will compare the benefits and costs of hydropower development at the Rum River Dam. Certain basic assumptions which are required in benefit/cost analysis will be outlined before describing the results of the economic analysis. The sensitivity of the benefit/cost comparisons to these basic assumptions is investigated in Section VIlLE.
1. Economic Feasibility Indicators
A number of economic feasibility indicators will be given herein to provide interested parties with information to base future economic decisions and to outline the economic advantages and disadvantages of each option. These indicators are:
where
GThe first year cost of power is the cost of debt service, operation and maintenance, and other costs divided by the average annual energy production.
• The benefit-cost ratio is the present worth of the project benefits divided by the present worth of the initial project costs and annual costs
B/C =
Bi =
C. = l.
OMi
d =
benefit life of
benefits
n
iIo Bi / (1+d) i
B/C = --------
cost
C + i
ratio n years,
in year
n L OM i /(1+d/
i=O
for a project economic
i,
initial project cost,
operation, maintenance and replacement costs in year i,
discount rate, and
39
(1 )
n = project economic life.
• The net present value is the present worth of project benefits minus the present worth of project costs:
n NPV '" L NBi /(l+d)i
i=O (2 )
where NPV '" net present value for a project economic life of n years, and
NBi '" net present benefits in year i (benefits minus costs).
• The internal rate of return is the discount rate which would give zero net present value at the end of the project economic life.
• Payback period is the number of years generating power required to reach a zero net present value.
2. Assumptions
The following assumptions are incorporated into the economic analysis:
• The economic life of the pr'oject is assumed to be 50 years.
• The initial project cost will be amortized over the typical period used in public works, 20 years.
• Eleven perc~nt interest and discount rate. Historically, A-rated tax- exempt bonds have been near the rate of inflation. The recent tax cuts, however, have reduced the attractiveness of tax-exempt bonds. Many economic analysts believe the difference between longterm rates for tax-exempt bonds and nontax-exempt financing rates will decrease by approximately 1.5 percent. 2 For this reason, a 2 percent spread between interest rate and escalation rate will be used.
• Nine percent annual escalation in the value of energy and power. Power producing utilities in the State of Minnesota have projected that the value of electricity will increase at or near the rate of inflation over the next 20 years. 3 The annual increase in the
2Donald Porter. First Boston Corporation, New York, N. Y.
3Minnesota Energy Agency.
40
consumer price index between 1977 and 1981 has averaged 9.9 percent. The CPI is currently moderating; however, most economic forecasters are still predicting inflation rates near 9 percent over the next five to ten years'
• Annual operation, maintenance, dollars were determined from Ref.
and [2] •
replacement costs in 1981
o Nine percent annual escalation in operation, maintenance, and replacement costs. This rate was chosen to coincide with the predicted inflation rate.
o A two-year construction period [2].
• A linear expenditure of capital during project construction.
The sensitivity of the benefit/cost analysis to discount rate and escalation rates will be described in Section VIII.E.
B. Comparison of Project Development Alternatives
The first year cost of. power, benefit-cost ratio, net present value, and internal rate of return of each development alternative is given in Table 2. A 35-year and 50-year project economic life were used. The useful life of a hydropower facility is anywhere from 50 to 100 years. The 50-year project economic life is used herein because it corresponds most closely to the useful life of any proposed facility.
Net present value is an estimate of the net income or profit over an assumed project life in 1982 dollars. Of the indicators given herein, net present value is generally considered as the most appropriate means of comparing development alternatives.
All of the development alternatives have a payback period greater than 50 years. The economic indicators of Alternative C are slightly better than those of Alternatives A and B; all of the alternatives have poor feasibility indicators with the assumptions listed above. With these results hydropower development of the Rum River Dam would not be recommended unless 8 percent financing could be obtained.
C. Cost and Benefit Streams
The cost and benefit streams for Alternatives A, B, and C are given in Tables 3, 4, and 5. The negative net present value over the 50-year period for all of the proposed development alternatives indicates the poor economic feasibility. Alternative C gives the best (least poor) return of all the proposed development alternatives.
4Data Resources, Inc.
41
TABLE 2. First Year Cost of Power, Benefit Cost Ratio, Net Present Value and Internal Rate of Return for Alternatives A, B, and C
Development Alternatives
A B C
First Year Cost of Power ($/kWH) 0.115 0.115 0.111
35-Year Project Life
Benefit~Cost Ratio 0.72 0.72 0.75 Net Present Value (Millions $,
1982 Base Year) -0.65 -0.70 -0.63 Internal Rate of Return 8.2 8.1 8.4
50-Year Project Life
Benefit Cost Ratio 0.87 0.86 0.90 Net Present Value (Millions $,
1982 Base Year) -0.32 -0.35 -0.26 Internal Rate of Return 9.8 9.8 10.0
42
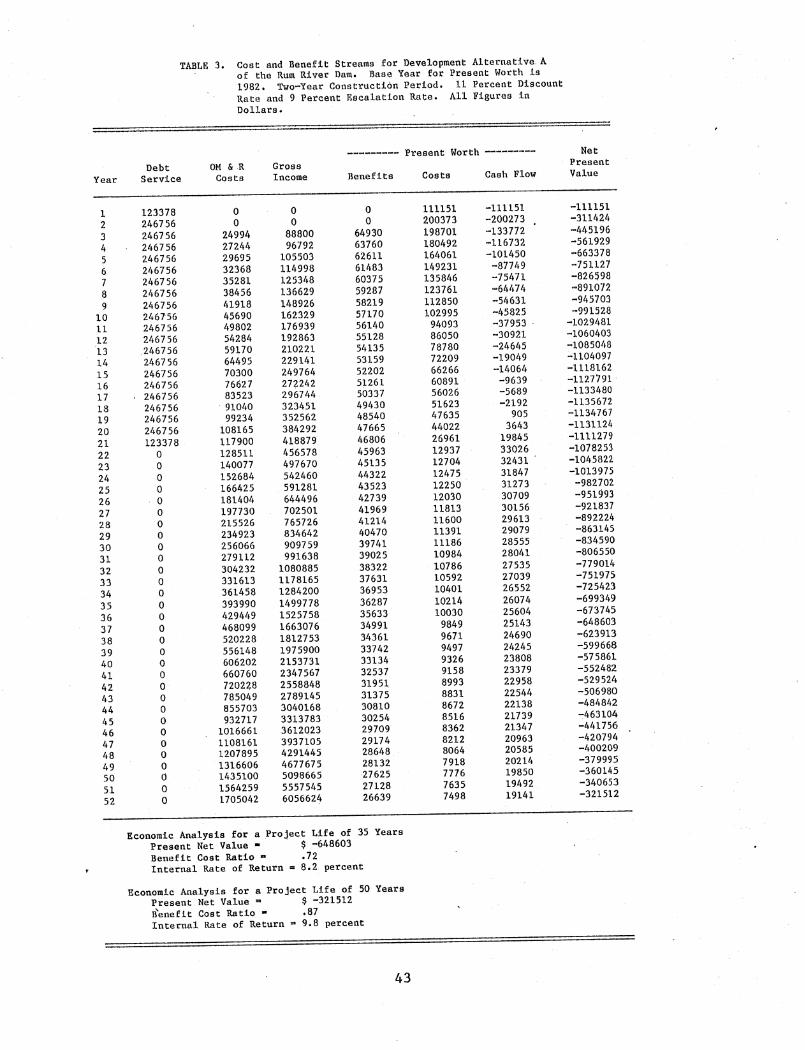
TABLE 3. Cost and Benefit Streams for Development Alternative. A of the Rum River Dam. Base Year for Present Worth is 1982. Two-Year Construction Period. 11 Percent Discount Rate and 9 Percent Escalation Rate. All Figures in Dollars.
--------- Present Worth --------- Net Debt OM &R Gross Present
Year Service Costs Income Benefits Costs Cash Flow Value
Economic Analysis for a Pro~ect Life of 35 Years Present Net Value - $ -648603 Benefit Cost Ratio· .72 Internal Rate of Return = 8.2 percent
Economic Analysis for a Project Life of 50 Years Present Net Value = $ -321512 Benefit Cost Ratio • .87 Internal Rate of Return = 9.8 percent
43
TAnLS 4. Cost snd Benefit Streams for Development Alternative B of the Rum River Dnm. BaRe Yenr for Prcllen~ Worth ill 1982. 'l'wo-Yellr COM truc t Lon Per.iod. 11 Percent Discount
,. Rate and 9 Percent Escalation Rate. ' All Figures in Dollars.
"
--------- Present Worth --------- Net Debt OM & R GroSIi Present
Year Service Costa lncome Benefits Coats Cash Flow Value
Economic Analysis 'for a :Project Life of 35 Years Present Net Value ~ $ -698902 Benefit Cost Ratio· .72 internal Rate of Return = 8.1 percent
Economic Analysis for a Project Life of 50 Years Present Net Value .. $ -354195 . ,- Benefit Cost Ratio • .86 Internal Rate of Return" 9.8 percent
44
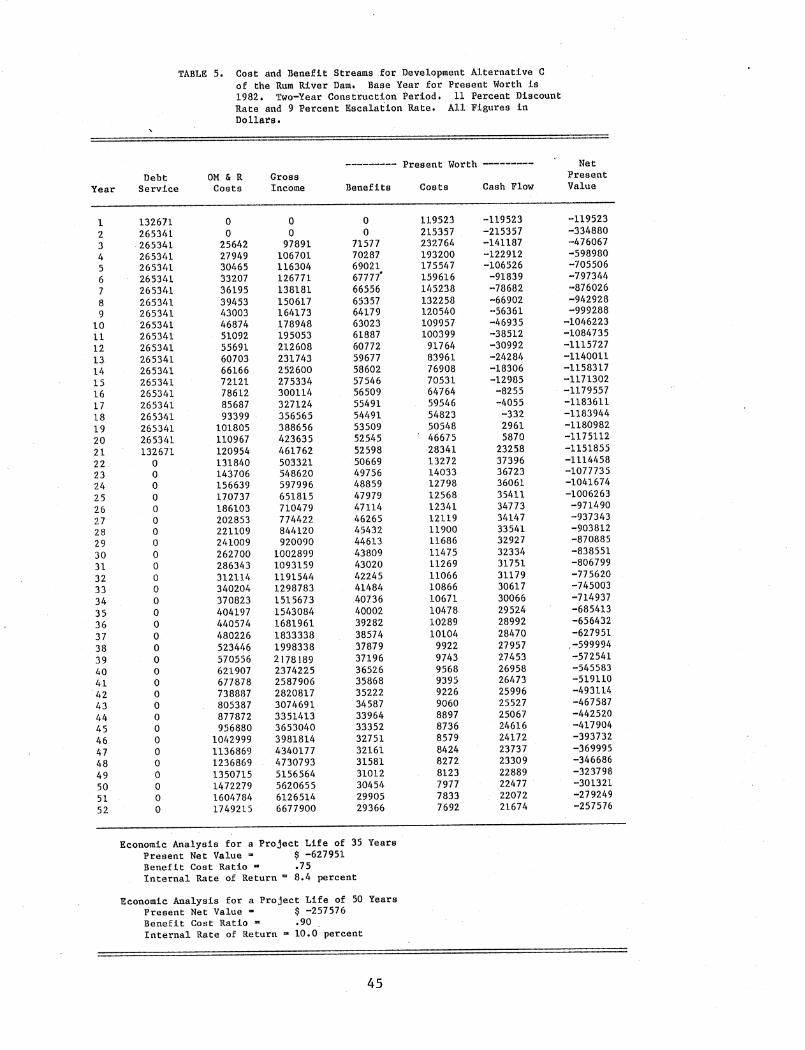
TABLE 5. Cost and Benefit Streams for Development Alternative C of the Rum River Dam. Base Year for Present Worth is 1982. Two-Year Construction Period. 11 Percent Discount Rate and 9 Percent Escalation Rate. All Figures in Dollars.
--------- Present Worth --------- Net Debt OM & R Gross Present
Year Service Costs Income Benefits Costs Cash Flow Value
Economic Analysis for a Project Life of 35 Years Present Net Value ~ $ -627951 Benefit Cost Ratio a .75 Internal Rate of Return = 8.4 percent
Economic Analysis for a Project Life of 50 Years Present Net Value - $ -257576 Benefit Cost Ratio D .90 Internal Rate of Return a 10.0 percent
45
r:
D. Private Financing Example
The City of Anoka may wish to consider leasing the Rum River Dam to a private concern for hydropower development. For this reason a typical example of the retdurn which may be expected by a private developer is included. Recent state legislation enables the City of Anoka to waive property taxes for the development in lieu of the lease arrangement.
There are many additional tax considerations to be incorporated into a economic analysis of private development. The tax bracket is individual to each developer so a 50 percent tax bracket is chosen herein as "typical" although the incremental tax bracket may be significantly higher. In addition, the following assumptions were made.
• An initial equity of 25 percent.
• A 13 and 15 percent discount rate.
• A 21 percent energy tax credit on the initial project investment.
• 15 year depreciation of equipment and structure.
• 15 year amortization period for loan.
• 15 year project economic life.
• Salvage value at 70 percent of original project cost in 1982 dollars, escalated to the year of sale. This corresponds to a linear decrease in present worth salvage value over a 50-year period.
The benefit and cost streams which would result from these private finance assumptions for Alternative C at discount rates of 15 and 13 percent are given in Tables 6 and 7, respectively. Although the net present value is positive for a 13 percent discount rate, it is not of the magnitude expected to attract private investment to the project. Thus, the feasibility of hydropower development at the Rum River Dam with private investment is also poor.
46
Year
1 2 3 4 5 6 7 8 9
10 11 12 13 14 15 16 17
Initial
TABLE 6. Cost and Benefit Streams for Development Alternative C using Private Financing at the Rum River Dam. Base Year for Present Worth is 1982. Two-Year Construction Period. 13 Percent Discount Rate and 9 Percent Escalation .Rate. All Figures in Dollars.
Tax Equity & Benefits --------- Present Worth ---------Debt OM & R & Gross
Present Net Value = $182,483 Benefit Cost Ratio = 1.08 Internal Rate of Return a 14.1 percent
TABLE 7. Cost and Benefit Streams for Development Alternative C using Private Financing at the Rum River Dam. Base Year for Present Worth is 1982. Two-Year Construction Period. 15 Percent Discount Rate and 9 Percent Escalation Rate. All Figures in Dollars.
Sensitivity analysis investigates the impact of variations in project parameters and economic assumptions on the feasibility indicators. The economic indicators of Alternative C are slightly better than those of Alternatives A and B. Therefore, Alternative C will be used in the sen ..... sitivity analysis.
1. Demand Charge Credit
A significant amount of projected income is the demand charge credit. It is unlikely that a complete loss of demand charge credit will occur, although future rate hikes may change the value of the demand charge cre~ dit. The impact of a 20 percent increase and decrease from the original value of the demand charge credit is given in Table 8. The variation in demand charge credit has only a minor effect upon project feasibility.
2. Variation of Project Cost
Cost estimates in a feasibility study are not as detailed as in the final design stage of a project. Feasibility cost estimates, therefore, have a limited degree of accuracy. In addition, unforeseen future events can alter a project. The economic feasibility indicators for a project cost 30 percent greater and 30 percent less than the original project cost estimate for Alternative C are given in Table 9. A decrease of 30 percent in project costs below that estimated herein would give the project marginal feasibility.
3. Value of Energy
Hydropower feasibility is naturally dependent upon the price at which the generated electricity is sold. Table 10 presents the economic indicators over a range of energy values for Alternative C. An energy value of 3¢/kWH would be required to give the project marginal feasibility.
4. Variation in Operation, Maintenance, and Replacement Costs
Operation, maintenance, and replacement costs cannot be precisely determined until the facility is in operation. The effects of a 25 percent addition and reduction from the original operation, maintenance, and replacement costs on the economic indicators for Alternative C are given in Table 11.
5. Discount and Escalation Rate
Economic feasibility is extremely sensitive to the difference between discount and escalation rates. The economic feasibility indicators for various magnitudes at spread between the discount and escalation rates for Alternative C are given in Table 12. Table 11 indicates that an extremely favorable relationship of discount and escalation rates would be required to given the project favorable feasibility.
48
TABLE 8. Benefit-Cost Ratio, Net Present Value and Internal Rate of Return with a Twenty Percent Increase and Reduction in Demand Charge Credit for Alternative C
Benefit-Cost Ratio 0.79 0.71 Net Present Value (Million $, 1982 Base Year) -0.52 -0.73 Internal Rate of Return 8.8 8.0
50-Year Project Life
Benefit-Cost Ratio 0.95 0.85 Net Persent Value (Million $, 1982 Base Year) -0.13 -0.39 Internal Rate of Return 10.4 9.7
TABLE 9. Benefit-Cost Ratio, Net Present Value and Internal Rate of Return with a Thirty Percent Increase and Reduction in Demand Charge Credit for Alternative C
Benefit-Cost Ratio 0.60 0.99 Net Present Value (Million $, 1982 Base Year) -1.23 -0.03 Internal Rate of Return 7.1 10.5
50-Year Project Life
Benefit-Cost Ratio 0.73 1.17 Net Persent Value (Million $, 1982 Base Year) -0.86 -0.35 Internal Rate of Return 8.9 11.7
49
TABLE 10. Benefit Cost Ratio, Net Present Value and Internal Rate of Return at Various Values of Energy for Alternative C
Value of Energy ($/kWH)
.010 .015 .020 .025 .030
35-Year Project Life
Benefit-Cost Ratio 0.46 0.59 0.72 0.84 0.97 Net Present Value -1.35 -1.03 -0.71 -0.39 -0.07
(MHlion $, 1982 base year) Internal Rate of Return 4.9 6.7 8.1 9.3 10.4
50-Year Project Life
Benefit-Cost Ratio 0.56 0.71 0.86 1.02 1.17 Net Present Value -1.17 -0.76 -0.36 -0.04 0.45
(Million $, 1982 base year) Internal Rate of Return 7.2 8.6 9.8 10.8 1l.6
TABLE 11. Benefit-Cost Ratio, Net Present Value and Internal Rate of Return at a Twenty-Five Percent Addition and Reduction from the Original Operation, Maintenance, and Replacement Cost for Alternative C
Operation, Maintenance, and Replacement 24,800 14,850 Costs ($, 1982 base year) (+25%) (-25%)
35-Year Project Life
Benefit-Cost Ratio 0.71 0.79 Net Present Value (Million $, 1982 Base Ye~r) -0.75 -0.51 Internal Rate of Return 8.0 8.9
50-Year Project T.Jife
Benefit-Cost Ratio 0.85 0.96 Net Persent Value (Million $, 1982 Base Year) -0.41 -0.10 Internal Rate of Return 9.6 10.4
50
TABLE 12. Benefit-Cost Ratio, Net Present Value and !nterna1 Rate of Return at Four Combinations of Discount and Escalation Rate for Alternative C
Benefit-Cost Ratio 1.27 0.97 0.75 0.58 Net Present Value (million $, 0.83 -0.07 -0.63 -0.98
1982 base year) Internal Rate of Return (%) 8.4 8.4 8.4 8.4
50-Year Project Life
Benefit Cost Ratio 1.74 1.25 0.90 0.66 Net Present Value (million $, 2.77 0.76 -0.26 -0.81
1982 base year) Internal Rate of Return (%) 10.0 10.0 10.0 10.0
51
· c.
::
IX. ENVIRONMENTAL IMPACT OF PROPOSED DEVELOPMENT
A. Background
Because small'""scale hydropower facilities are generally developed at existing dam sites, the environmental impact' is usually limited; there is no land inundated due to new dam construction and the character of the stream is not greatly altered. The environmental impact of small-scale hydropower facilities should not be entirely discounted; however. There are likely to be a few cases where a fishery may be harmed, public health may be threatened due to dredge spoils, or a historic structure. may be destroyed. The scope of this section is to identify the potential environmental impacts of hydropower development at the RUm River Dam. Ifhydropower development is more seriously contemplated, this section will provide information which is helpful in the preparation of license and permit applications.
B. PERC Requirements
The Federal Energy Regulatory Commission (FERC) in its application procedure for a hydropower license requires an environmental report to be filed. The environmental report should be consistent with the scope of the project and environmental impacts of the proposed action [3].
The report must be prepared in consultation with local, state, and federal agencies with expertise in environmental matters. The names and addresses of these agencie.s may be obtained from the Director, D::I,vision of Licensed ·Projects. All contact with the local, state, and federal agencies should be made well in' advance of the final design phase of the project. The .application for licensing should be filed during the final design phase. .
The environmental report should include the following section [3]:
1. General description of the project locale.
2. A report. on the current consumptive water use and the impact of the project on water quality.
3. A report on fish, wildlife, and botanical resources in the vicinity of the project and the impact of the project on those resources. Special attention should be given to endangered plant and animal species, critical habitats, and sites on Wild and Scenic Rivers.
4. A report on historical and archeological resources, with emphaSis on sites eligible for or included on the National Register of Historic Places.
52
S. A report on recreational resources which considers the existing and proposed recreational facilities and recreational opportunities of the project.
6. A report on land management and aesthetics which includes the management of wetlands, flood plains and other lands within the project boundary and the protection of the recreational and scenic values of the project.
C. Water Level Fluctuation and In-Stream Flows
The proposed operational plan used herein has a one-foot maximum reservoir drawdown during on-peak power generation. This limit is well below that which naturally occurs in the reservoir and will haVe a small or negligible impact on wildlife, shoreline erosion, and reservoir aesthetic qualities.
The stream reach downstream from the dam is only 0.7 miles long, before its confluence with the Mississippi River. Thus, the stream reach affected by reduced in-stream flows during on-peak power generation will be small. For this reason, a minimum stream flow of 100 cfs was selected at the 93 percent exceedance level on the flow duration curve as that which will protect the stream reach from any excessive degredation due to stranding of fish, etc.
D. Water Quality
The Minnesota Pollution Control Agency (PCA) classifies state lakes and rivers according to their water quality. The Rum River has been classified as a 2B river, which is defined as follows:
The quality of this class of the intrastate waters of the state shall be such as to permit the propagation and maintenance of cool or Warm water sport or commercial fishing and be .suitab1e for aquatic recreation of all kinds, including bathing, for which the water may be usable.
There are two permanent water quality testing sites on the Rum River that are monitored by the PCA. One is at river mile 34 in Isanti. The other is in Anoka at river mile 0.6.[4]
Reading from these testing sites indicates that water quality near the headwaters of the river is excellent. Near St. Francis, however, water quality occasionally exceeds the standards for a 2B classification because of the presence of fecal co1iforms.
The Rum River Dam reservoir has a low storage capacity and corresponding small hydraulic residence time. At the normal storage capacity of 9.3 million cubic feet and the average annual stream discharge (697 cfs), the hydraulic residence time at the reservoir is about four hours.
53
r
At the base flow of 100 cf s, the reservoir hydraulic residence time is still. only about one day. With the short hydraulic residence time and shallow reservoir depth at the Anoka Dam, a strong thermal stratification is unlikely during operating periods. It is therefore unlikely that the dissolved o~ygen concentrations of the reservoir will be depleted during operation of the propos~d facilities. Therefore the water quality problems associated with dissolved oxygen depletion, such as high nutrient levels, heavy metal and to~ics released from reservoir sediments, and high biochemical oxygen demand, will not occur. In addition, the facility intake will take water from the complete water column. This will eliminate the possibility of selective withdrawal of cold hypolimnetic water. Therefore, the facilities will not significantly alter the natural downstream temperature regime.
E. Construction Impacts
The temporary impacts due to construction activities at the Anoka Dam could potentially have adverse impacts on the environment. The most significant problem which may occur during construction concerns dredging and other activities affecting water quality. All necessary precautions should be' taken SO that no excessively. turbid water is released to the streams. All necessary stl;lte and federal permits JIlUst be obtained in addition to consultation with these agencies well in advance.
Care should be taken so that construction activities will not interfere with the natural spawning activities of fish. Species and diversity taken above and below the Rum River Dam are shown in Tables 13 and 14. The dates for the spawning season of each species are also shown in these tables.
Many construction activities involve excavation and dredging. Cofferdams around the construction area will minimize the impact of these construction activities. Turbid water should not be released during fish spawning season.
,Testing and/or sampling of the sediment should be taken to determine its physical, chemical, and biological characteristics to make a proper determination of adverse effects caused by sediment resuspension. A suitable disposal site for the dredge material should also be chosen.
F. Historic Preservation
In the course of FERC' s licensing procedure, the. Advisory Council on Historic Preservation and the State Historic PreserVation Officer must be consulted to assure that no historic or cultural sites will be adversely affected. Novak [5] observes that, "Many older hydropower sites, while not of national significance, have played an important role in the local' history of an area and thus important enough to stimulate local concerns. Additions and other needed alterations of the exterior of a structure should be designed in keeping with the historic and aesthetic value of an area, especially if other historic structures are in close proximity" [5].
54
TABLE 13. Percent Composition and Spawning Season of Fish Population Upstream of the Rum River Dam [4]
Percent Species* Composition Spawning Season
Northern Redhorse 51.1 Late May - Early June White Sucker 17 .6 Mid-May Silver Redhorse 13.8 Late May - Early June Carp 8.8 Mid-May Smallmouth Bass 8.2 May-July Rock Bass 0.5 May-Early June
*Minnows and other small fish species identified in the survey are not included.
TABLE 14. Percent Composition and Spawning Season of Fish Population Downstream of the Rum River Dam [4]
Percent Species Composition Spawning Season
Black Bullhead 35.4 May-June Carp 32.7 Mid-May Northern Redhorse 9.7 Late May-Early June White Sucker 7.1 Mid-May Smallmouth Bass 6.2 May-July Walleye 4.4 Spring shortly after Silver Redhorse 1.8 Late May-Early June Northern Pike 1.8 April-Early May· White Crappie 0.9 May-June
55
thaw
Sites on the National Register of Historic Places are g.iven special pro~ tection by federal law. It is therefore important to· review each site for potential archeological, cultural, and historic significance.
To date, the Minnesota Historical Society has no information of historical significance at the Rum River Dam.
The old powerhouse foundation to the east of the Rum River Dam, however, has attracted enough interest so that local officials have erected a historical marker that states the significance of the existing foun~ dat.ion. It.is the author's recommendation that the Minnesota Historical Society and any concerned local officials should have an opportunity to assess the historical significance well in advance of any development. These agencies and the developers should then work together to preserve and present the historical significance of the existing foundation.
G. Endangered Species
At this time, the Minnesota Natural Heritage Program (Minnesota Department of Natural Resources) has no records of priority animal elements at the Anoka site. There is a 1954 record of a Blandings Turtle (Emydoidea b1andingi) collected at Anoka. This uncommon turtle has been classified by the Natural Heritage Program as a Species of Special Concern. In Minnesota its distribution is confined primarily to the Anoka sand plain and the sand dunes along the Mississippi River south of the Twin Cities. Although it is likely that the turtle may still be found in the vicinity of Anoka, the proposed construction work should not pose any problems.
The Minnesota Natural Heritage Program performed a survey of the site area and found no recorded occurrence of rare or endangered plant species at the Anoka site.
H. Recreation
Rum R.iver Central Regional Park, Rum River South, and various Anoka city parks border the Rum River in the vicinity of the Rum River Dam. The natural beauty, fish, and wildlife and the historical legacy of the Rum Ri ver valley all contribute to the river's importance as a recreational resource. In fact, the river attracts many canoeists, fishermen, hunters and other people who enjoy the outdoors. It is in light of these recreational virtues, that the Rum River is classified a Wild and Scenic River under the Minnesota State Wild and Scenic River Act.
All of the project development alternatives proposed herein will have a minor (if any) impact upon recreational resources near the Rum River Dam.
I. Agency Contacts/Correspondence
Close coordination with public agencies is' essential early in the developmental phases of the project to assure that regulatory requirements and acceptable policies become known. "Both beneficial and adverse effects
56
of small hydropower development will be a function of project design and operation as well as the nature of the existing environment that will be altered. Successful mitigation of adverse effects associated with such development will depend upon (1) accurate prediction of the magnitude of adverse impacts and (2) early awareness of potentially significant environment issues. Ecologists and environmental scientists must be consulted during the preliminary design phase of project development. By defining the relevant environmental issues at this stage, meaningful discussions can be held with all responsible and interested agencies and groups" [6].
It should be noted that mitigation of impacts at existing dam sites should be viewed in the context of an already perturbed environment '[7]. Feasibility studies completed to date have validated this assumption: "The experience of our firm in conducting feasibility studies at three hydroelectric sites indicates that identifiable adverse environmental impacts associated with restoration of the three facilities are relatively minor" [8].
[9] : The various stage contact agencies are included on the following pages
STATE AGENCIES TO BE CONTACTED FOR SMALL HYDROPOWER DEVELOPMENT
1. MINNESOTA DEPARTMENT OF NATURAL RESOURCES - Division of Waters
a. Inquiries to the Director, Attn: Development Section
b. EAW (Environmental Assessment Worksheet). Even if not mandatory, we strongly suggest that one be prepared by mutual cooperation within DNR. Purposes:
• to give early and preliminary thought to any and all problems and benefits which may occur, and
• to bring the project before the public early in development and avoid delays later in project.
c. One permit may be issued to cover the concerns of:
• work in public waters, • water appropriation, • dam safety - modification of dam, • water regulation & usage, ., fish and wildlife habitat (including rare species), • recreation, and • water quality.
The decision to issue a single permit is made on a site specific basis.
57
\,
d. Generally DNR requires permits for raising or lowering of spillway level, fluctuating water level, and discharges which are different than historical records, dam modification, dredging and disposal of dredged material (spoil), shore protection, riprap, shoreline excavation, partial or complete drainage, water level control structure, stream .or channel enlargement, or relocation.
2. MINNESOTA POLLUTION CONTROL AGENCY
a. Inquiries to the Director, Attn: Permit Section - Water Quality
b. The 1977 Clean Water Act gives authority to the MPCA to certify hydropower projects. This MPCA Certification is a prerequisite for permitting by FERC, DOE, Coast Guard or any other Federal Agency issuing permits of this type.
c. The MPCA has authority to become the primary agency issuing NPDES (National Pollutant Discharge Elimination Systems) permits, replacing FERC, Corps, etc., but has not exercised this authority. They may possibly do so in the future.
d. Primarily concerned with water quality during construction and operation. These concerns include but are not limited to: maintaining minimum and constant flows, reaeration, thermal stratification dredging and downstream water supply.
e. The MPCA must also review all secondary consideration, such as downstream flooding, effects of fish and wildlife, etc., before issuing certification according to Minnesota Statutes, Part 116B,09, Subd. 2.
3. STATE PLANNING AGENCY (including Environmental Quality Board-EQB)
a. Power Plant Siting
• Certificate of site compatibility N/A to sites less than 50 MW
• Construction permit for transmission lines if:
greater than 200 kV greater than 50 miles
b. Environmental Planning
Current Rules
Actions Requiring Environmental Assessment Worksheet with Local Government as Responsible Agency:
• An action that will 'eliminate or significantly alter a wetland of Type 3, 4, or 5 (as defined in U.S. Department of
58
Interior, Fish and Wildlife Service, Circular 39, "Wetlands of the U.S.," 1956) of five or more acres in the seven-county metropolitan area, or of 50 or more acres outside the sevencounty metropolitan area, either singly or in a complex of two or more wetlands.
Actions Requirin~ Environmental Assessment Worksheet with State Agency as Responsible Agency:
" Any new or additional impoundment of water creating a water surface in excess of 200 acres. (DNR)
• Construction of electric generating plants at a single site designed for, or capable of, operation at a capacity of 200 or more megawatts (electrical). (PCA)
• Construction of electric transmission lines and associated facilities designed for, or capable of ,operation at a nominal voltage ,of 200 kilovolts AC or more, or operation at a nominal voltage of ± 200 kilovolts DC or more and of 50 miles or more in length. (EQB)
Proposed Rules -. (possibly effective in Oct. - not yet approved)
" Impoundment of 160 acres or more
o Generating capacity 10-200 megawatts - require an EAW
o Generating capacity 200 or more megawatts - required an EIS.
c. EQB could also serve as staff agency and oversee the analysis of EAW arid EIS if required.
4. WATERSHED DISTRICTS
a. Each concerned district should be contacted.
b. Permit may be required.
s. COUNTY
Individual county may have zoning or shoreline management requirements.
6. MINNESOTA ENERGY AGENCY
Certificate of Need - for sites greater than SO MW.
7. MINNESOTA HERITAGE PROGRAM
a. Concerned with rare species.
b. Part of DNR Environmental Review Process.
59
I'
'('
1.
2.
3,
REFERENCES
Barr Engineering Co., "Operation and Maintenance Rum River Dam Anoka, Minnesota.
Tudor Engineering (1980). "Reconnaissance Evaluation of Small, Low Head Hydroelectric Installations," submitted to Water and Power Resource Service (BuRec), U.S. Department of the Interior.
U. S. Army Corps of Engineers (1979). Feasibility Studies for Small Scale Hydropower Additions - A Guide Manual.
4. Minnesota Department of Natural Resources (1977). "A Management Plan for the Rum River."
5. Novak, W. J. (1979). "Small-Scale Hydro - An Opportunity for Historic Preservation," in Proceedings, Waterpower '79, U. S. Army Corps of Engineers and U. S. Department of Energy.
6. Hildebrand, S. G. (1980). "Analysis of Environmental Issues Related to a Small-Scale Hydroelectric Development III - Water Level Fluctuations," Oak Ridge National Laboratory, Environmental Science Div., Publ. No. 1591.
7. Hildebrand, S. G., M. C. Bell, E. P. Richey, J. J. Anderson, and Z. E. Parkhurst (1980). "Analysis ast Environmental Issues Related to an Small-Scale Hydroelectric Development II - Design Considerations for Passing Fish Upstream Around Dams," Oak Ridge National Laboratory, Env. Science Div., Publ. No. 1567.
8. Carlisle, R. K. (1979). "Environmental Impact Assessment Methodology of Small-Scale Hydroelec tric Pro jec ts," in Proceedings, l~a terpower '79, U. S. Army Corps of Engineers and U. S. Dept. of Energy. •
9. Regalia, C. (1981). Personal Communication. Division of Waters, Minnesota Department of Natural Resources, St. Paul, Minnesota.


![Minnesota Water Resources Conference · Minnesota Stormwater Manual: “… [to] manage stormwater in a way that conserves, enhances, and ... St. Anthony Falls Laboratory . Minnesota](https://static.documents.pub/doc/80x56/5f513ddfe5f918157102ae78/minnesota-water-resources-conference-minnesota-stormwater-manual-aoe-to-manage.jpg)
