Page 1
Single Particle Transport in Two-dimensional Heterojunction
Interlayer Tunneling Field Effect Transistor
Mingda (Oscar) Lia, David Esseni*, Gregory Snider, Debdeep Jena, and Huili Grace Xingb
University of Notre Dame, IN, USA
*University of Udine, Italy
E-mails: a. [email protected] ; b. [email protected]
(Dated: November 12, 2018)
Abstract
The single particle tunneling in a vertical stack consisting of monolayers of two-dimensional semi-
conductors is studied theoretically and its application to a novel Two-dimensional Heterojunction
Interlayer Tunneling Field Effect Transistor (Thin-TFET) is proposed and described. The tunnel-
ing current is calculated by using a formalism based on the Bardeen’s transfer Hamiltonian, and
including a semi-classical treatment of scattering and energy broadening effects. The misalignment
between the two 2D materials is also studied and found to influence the magnitude of the tunneling
current, but have a modest impact on its gate voltage dependence. Our simulation results suggest
that the Thin-TFETs can achieve very steep subthreshold swing, whose lower limit is ultimately
set by the band tails in the energy gaps of the 2D materials produced by energy broadening. The
Thin-TFET is thus very promising as a low voltage, low energy solid state electronic switch.
PACS numbers:
1
arX
iv:1
312.
2557
v1 [
cond
-mat
.mes
-hal
l] 9
Dec
201
3
Page 2
I. INTRODUCTION
The electronic integrated circuits are the hardware backbone of todays information society
and the power dissipation has recently become the greatest challenge, affecting the lifetime of
existing portable equipments, the sustainability of large and growing in number data centers,
and the feasibility of energy autonomous systems for ambience intelligence1,2, and of sensor
networks for implanted monitoring and actuation medical devices3. While the scaling of
the supply voltage, VDD, is recognized as the most effective measure to reduce switching
power in digital circuits, the performance loss and increased device to device variability are
a serious hindrance to the VDD scaling down to 0.5 V or below.
The voltage scalability of VLSI systems may be significantly improved by resorting to
innovations in the transistor technology and, in this regard, the ITRS has singled out Tun-
nel filed effect transistors (FETs) as the most promising transistors to reduce the sub-
threshold swing, SS, below the 60 mV/dec limit of MOSFETs (at room temperature), and
thus to enable a further VDD scaling4,5. Several device architectures and materials are
being investigated to develop Tunnel FETs offering both an attractive on current and a
small SS, including III-V based transistors possibly employing staggered or broken bandgap
heterojunctions6–9, or strain engineering10. Even if encouraging experimental results have
been reported for the on-current in III-V Tunnel FETs, to achieve a sub 60 mV/dec sub-
threshold swing is still a real challenge in these devices, probably due to the detrimental
effects of interface states6,11,12. Therefore, as of today the investigation of new material
systems and innovative device architectures for high performance Tunnel FETs is a timely
research field in both the applied physics and the electron device community.
In such a contest, two-dimensional (2D) crystals attract increasingly more attention pri-
marily due to their scalability, step-like density of states and absence of broken bonds at
interface. They can be stacked to form a new class of tunneling transistors based on an
interlayer tunneling occurring in the direction normal to the plane of the 2D materials. In
fact tunneling and resonant tunneling devices have been recently proposed13, as well as ex-
perimentally demonstrated for graphene-based transistors14,15. Furthermore, monolayers of
group-VIB transition metal dichalcogenides MX2 (M = Mo, W; X = S, Se, Te) have recently
attracted remarkable attention for their electronic and optical properties16,17. Monolayers
of transition-metal dichalcogenides (TMDs) have a bandgap varying from almost zero to 2
2
Page 3
eV with a sub-nanometer thickness such that these materials can be considered approxi-
mately as two-dimensional crystals18. The sub-nanometer thickness of TMDs can provide
excellent electrostatic control in a vertically stacked heterojunction. Furthermore, the 2D
nature of such materials make them essentially immune to the energy bandgap increase
produced by the vertical quantization when conventional 3D semiconductors are thinned to
a nanoscale thickness, and thus immune to the corresponding degradation of the tunneling
current density19. Moreover, the lack of dangling bonds at the surface of TMDs may al-
low for the fabrication of material stacks with low densities of interface defects19, which is
another potential advantage of TMDs materials for Tunnel FETs applications.
In this paper we propose a two-dimensional heterojunction interlayer tunneling field ef-
fect transistor (Thin-TFET) based on 2D semiconductors and develop a transport model
based on the transfer-Hamiltonian method to describe the current voltage characteristics
and discuss, in particular, the subthreshold swing. In Section II we first present the de-
vice concept and illustrate examples of the vertical electrostatic control, then we develop a
formalism to calculate the tunneling current. Upon realizing that the subthreshold swing
of the Thin-TFET is ultimately determined by the energy broadening, in Sec.II C we show
how this important physical factor has been included in our calculations. In Sec.II D we ad-
dress the effect of a possible misalignment between the two 2D semiconductor layers, while
in Sec.II E we derive some approximated, analytical expressions for the tunneling current
density, which are useful to gain insight in the transistor operation and to guide the device
design. In Sec.III we present the results of numerically calculated current voltage charac-
teristics for the Thin-TFET, and finally in Sec.IV we draw some concluding remarks about
the modeling approach developed in the paper and about the design perspectives for the
Thin-TFET.
II. MODELING OF THE TUNNELING TRANSISTOR
A. Device concept and electrostatics
The device structure and the corresponding band diagram are sketched in Fig.1, where the
2D materials are assumed to be semiconductors with sizable energy bandgap, for example,
transition-metal dichalcogenide (TMD) semiconductors without losing generality17,20. Both
3
Page 4
the top 2D and the bottom 2D material is a monolayer and the thickness of the 2D layers
is neglected in the modeling of the electrostatics.
The working principle of the tunneling transistor sketched in Fig.1(a) can be explained as
follows. When the conduction band edge ECT of the top 2D layer is higher than the valence
band edge EV B of the bottom 2D layer (see Fig.2(a)), there are no states in the top layer to
which the electrons of the bottom layer can tunnel into. This corresponds to the off state
of the device. When ECT is pulled below EV B (see Fig.2(b)), a tunneling window is formed
and consequently an interlayer tunneling can flow from the bottom to the top 2D material.
The crossing and uncrossing between the top layer conduction band and the bottom layer
valence band is governed by the gate voltages and it is described by the electrostatics of the
device.
To calculate the band alignment along the vertical direction of the intrinsic device in
Fig.1 we write the Gauss law linking the sheet charge in the 2D materials to the electric
fields in the surrounding insulating layers, which leads to
CTOXVTOX − CIOXVIOX = e(pT − nT +ND)
CBOXVBOX + CIOXVIOX = e(pB − nB +NA)(1)
where CT (I,B)OX is the capacitance per unit area of top oxide (interlayer, bottom oxide) and
VT (I,B)OX is the potential drop across top oxide (interlayer, bottom oxide). The potential
drop across the oxides can be written in terms of the external voltages VTG, VBG, VDS and
of the energy eφn,T = ECT − EFT and eφp,T = EFB − EV B defined in Fig.1(b) as
eVTOX = eVTG + eφn,T − eVDS + χ2D,T − ΦM,T
eVBOX = eVBG − eφp,B + EGB + χ2D,B + ΦM,B
eVIOX = eVDS − eφp,B − eφn,T + EGB + χ2D,B − χ2D,T
(2)
where EFT , EFB are fermi levels of majority carriers in the top and bottom layer. nT , pT are
the electron and hole concentration in the top layer, nB, pB the concentrations in bottom
layer, χ2D,T , χ2D,B are the electron affinities of the 2D materials, ΦT , ΦB the workfunctions
of the top and back gate and EGB is the energy gap in the bottom layer. Eq. 2 implicitly
assumes that the majority carriers of the two 2D materials are at thermodynamic equilibrium
with their Fermi levels, with the split of the Fermi levels set by the external voltages (i.e.
EFB−EFT=eVDS), and the electrostatic potential essentially constant in the 2D layers.
4
Page 5
Since in our numerical calculations we shall employ a parabolic effective mass approxima-
tion for the energy dispersion of the 2D materials, as discussed more thoroughly in Sec.III,
the carrier densities can be readily expressed as an analytic function of eφn,T and eφp,B21
n(p) =gvmc(mv)kBT
π~2ln
[exp
(−qφn,T (φp,B)
kBT
)+ 1
](3)
where gv is the valley degeneracy.
When Eq.2 and Eq.3 are inserted in Eq.1, we obtain two algebraic equations for φn,T
and φp,B that can be solved numerically and describe the electrostatics in a one dimensional
section of the device.
B. Transport model
In this section we develop a formalism to calculate the tunneling current based on
the transfer-Hamiltonian method22–24, as also revisited recently for resonant tunneling in
graphene transistors13,14,25. We start by writing the single particle elastic tunneling current
as
I = gv4πe
~∑kT ,kB
|M(kT ,kB)|2δ(EB(kB)− ET (kT ))(fB − fT ) (4)
where e is the elementary charge, kB, kT are the wave-vectors respectively in the bottom
and top 2D material, EB(kB) ET (kT ) denote the corresponding energies, fB and fT are the
Fermi occupation functions in the bottom and top layer (depending respectively on EFB and
EFT , see Fig.1), and gv is the valley degeneracy. The matrix element M(kT ,kB) expresses
the transfer of electrons between the two 2D layers is given by14
M(kT ,kB) =
∫A
dr
∫dz ψ†T,kT
(r, z)Usc(r, z)ψB,kB(r, z) (5)
where ψB,kB(ψT,kT
) is the electron wave-function in the bottom (top) 2D layer and Usc(r, z)
is the perturbation potential in the interlayer region.
Eq.5 acknowledges the fact that in real devices several physical mechanisms occurring in
the interlayer region can result in a relaxed conservation of the in plane wave-vector k in
the tunneling process. We will return to the discussion of Usc(r, z) in this section.
To proceed in the calculation of M(kT ,kB) we write the electron wave-function in the
Bloch function form as
ψk(r, z) =1√NC
eik·r uk(r, z) (6)
5
Page 6
where uk(r, z) is a periodic function of r and NC is the number of unit cells in the overlapping
area A of the two 2D materials. Eq.6 assumes the following normalization condition:∫ΩC
dρ
∫z
dz|uk(ρ, z)|2 = 1 (7)
where ρ is the in-plane abscissa in the unit cell area ΩC and A=NCΩC .
The wave-function ψk(r, z) is assumed to decay exponentially in the interlayer region
with a decay constant κ13,14; such a z dependence is absorbed in uk(r, z) and we do not need
to make it explicit in our derivations. It should be noticed that absorbing the exponential
decay in uk(r, z) recognizes the fact that in the interlayer region the r dependence of the
wave-function changes with z. In fact, as already discussed13, while the uk(r, z) are localized
around the basis atoms in the two 2D layers, these functions are expected to spread out while
they decay in the interlayer region, so that the r dependence becomes weaker when moving
farther from the 2D layers.
To continue in the calculation ofM(kT ,kB) we let the scattering potential in the interlayer
region be separable in the form14
Usc(r, z) = VB(z)FL(r) (8)
where FL(r) is the in-plane fluctuation of the scattering potential, which is essentially re-
sponsible for the relaxation of momentum conservation in the tunneling process.
By substituting Eqs.6 and 8 in Eq.5 and writing r=rj+ρ, where rj is a direct lattice
vector and ρ is the in-plane position inside each unit cell, we obtain
M(kT ,kB) =1
NC
NC∑j=1
ei(kB−kT )·rj∫
ΩC
dρ
∫dz ei(kB−kT )·ρ ×
× u†T,kT(rj + ρ, z)FL(rj + ρ)VB(z)uB,kB
(rj + ρ, z) (9)
We now assume that FL(r) corresponds to relatively long range fluctuations so that it can
be taken as approximately constant inside a unit cell, and that, furthermore, the top and
bottom 2D layer have the same lattice constant, hence the Bloch functions uT,kTand uB,kB
have the same periodicity in the r plane. Moreover, for the time being we consider that the
conduction band minimum in the top layer and the valence band maximum in the bottom
layer are at the same point of the 2D Brillouin zone, so that q=kB−kT is small compared
to the size of the Brillouin zone and eiq·ρ is approximately 1.0 inside a unit cell. These
6
Page 7
considerations and approximations allow us to rewrite Eq.9 as
M(kT ,kB) ' 1
NC
NC∑j=1
eiq·rjFL(rj)
∫ΩC
dρ
∫dz u†T,kT
(ρ, z)VB(z)uB,kB(ρ, z) (10)
where the integral in the unit cell has been written for rj=0 because it is independent of
the unit cell.
Consistently with the assumption that kB and kT are small compared to the size of the
Brillouin zone, in Eq.10 we neglect the kB (kT ) dependence of uB,kB(uT,kT
) and simply set
uT,kT(ρ, z)≈u0T (ρ, z), uB,kB
(ρ, z)≈u0B(ρ, z), where u0T (ρ, z) and u0B(ρ, z) are the periodic
parts of the Bloch function at the band edges, which is the simplification typically employed
in the effective mass approximation approach21. By recalling that the u0B and u0T retain
the exponential decay of the wave-functions in the interlayer region with a decay constant
κ, we now write ∫ΩC
dρ
∫dz u†0T (ρ, z)VB(z)u0B(ρ, z) 'MB0 e−κTIL (11)
where TIL is the interlayer thickness and MB0 is a k independent matrix element that will
remain a prefactor in the final expression for the tunneling current. Since FL(r) has been
assumed a slowly varying function over a unit cell, then the sum over the unit cells in Eq.10
can be rewritten as a normalized integral over the tunneling area
1
ΩcNC
NC∑j=1
Ωc eiq·rjFL(rj) '1
A
∫A
eiq·rFL(r)dr (12)
By introducing Eq.11 and 12 in Eq.10 we can finally express the squared matrix element
as
|M(kT ,kB)|2 ' |MB0|2 SF (q)
Ae−2κTIL (13)
where q=kB−kT and SF (q) is the power spectrum of the random fluctuation described by
FL(r), which is defined as21
SF (q) =1
A
∣∣∣∣∫A
eiq·rFL(r)dr
∣∣∣∣2 (14)
By substituting Eq.13 in Eq.4 and then converting the sums over kB and kT to integrals we
obtain
I =gve |MB0|2A
4π3~e−2κTIL
∫kT
∫kB
dkT dkB SF (q) δ(EB(kB)− ET (kT )) (fB − fT ) (15)
7
Page 8
Before we proceed with some important integrations of the basic model that will be discussed
in Secs.II C and II D, a few comments about the results obtained so far are in order below.
According to Eq.15 the current is proportional to the squared matrix element |MB0|2
defined in Eq.11 and decreases exponentially with the thickness interlayer TIL according to
the decay constant κ of the wave-functions. Attempting to derive a quantitative expression
for MB0 is admittedly very difficult, in fact it is difficult to determine how the periodic
functions u0T (ρ, z) and u0B(ρ, z) spread out when they decay in the barrier region and,
furthermore, it is not even perfectly clear what potential energy or Hamiltonian should be
used to describe the barrier region itself, which is an issue already recognized and thoroughly
discussed in the literature since a long time24. Our model essentially circumvents these
difficulties by resorting to the semi-empirical formulation of the matrix element given by
Eq.11, where MB0 is left as a parameter to be determined and discussed by comparing to
experiments.
It is also worth noting that in our calculations we have not explicitly discussed the effect
of spin-orbit interaction in the bandstructure of 2D materials, even if giant spin-orbit cou-
plings have been reported in 2D transition-metal dichalcogenides26. If the energy separations
between the spin-up and spin-down bands are large, then the spin degeneracy in current cal-
culations should be one instead of two, which would affect the current magnitude but not
its dependence on the gate bias. Our calculations neglected also the possible modifications
of band structure in the TMD materials produced by the vertical electrical field, in fact we
believe that in our device the electrical field in the 2D layers is not strong enough to make
such effects significant27.
The decay constant κ in the interlayer region may be estimated from the electron affinity
difference between the 2D layers and the interlayer material13. Moreover, according to Eq.15
the constant κ determines the dependence of the current on TIL, so that κ may be extracted
by comparing to experiments discussing such a dependence, which, for example, have been
recently reported for the interlayer tunneling current in a graphene-hBN system15.
As for the spectrum SF (q) of the scattering potential, in our calculations we utilize
SR(q) =πL2
C
(1 + q2L2C/2)3/2
(16)
where LC is the correlation length, which in our derivations has been assumed large compared
to the size of a unit cell. Eq.16 is consistent with an exponential form for the autocorrelation
8
Page 9
function of FL(r)21, and a similar q dependence has been recently employed to reproduce the
experimentally observed line-width of the resonance region in graphene interlayer tunneling
transistors14. Such a functional form can be representative of phonon assisted tunneling,
short-range disorder28, charged impurities29 or Moire patterns that have been observed, for
instance, at the graphene-hBN interface30–32. We will see in Sec.II E that the LC has an
influence on the gate voltage dependent current, which has a neat physical interpretation,
hence a comparison to experimental data will be very informative for an estimate of LC .
C. Effects of energy broadening
According to Eq.4 and Eq.15 the tunneling current is simply zero when there is no energy
overlap between the conduction band in the top layer and the valence band in the bottom
layer, that is for ECT>EV B. In a real device, however, the 2D materials will inevitably
have phonons, disorder, host impurities in the 2D layer and be affected by the background
impurities in the surrounding materials, so that a finite broadening of the energy levels is
expected to occur because of the statistical potential fluctuations superimposed to the ideal
crystal structure33. The energy broadening in 3D semiconductors is known to lead to a
tail of the density of states (DoS) in the gap region, that has been also observed in optical
absorption measurements and denoted Urbach tail34,35. It is thus expected that the finite
energy broadening will be a fundamental limit to the abruptness of the turn on characteristic
attainable with the devices of this work, hence it is important to include this effect in our
model.
Energy broadening in the 2D systems can stem from the interaction with randomly
distributed impurities and disorder in the 2D layer or in the surrounding materials33,36,37,
by scattering events induced by the interfaces38, as well as by other scattering sources.
We recognize the fact that a detailed description of the energy broadening is exceedingly
complicated due to the many-body and statistical fluctuation effects39, and thus resort to
a relatively simple semi-classical treatment36,33. We start by recalling that the density of
states ρ0(E) for a 2D layer with no energy broadening is
ρ0(E) =gsgv4π2
∫k
dk δ [E − E(k)] (17)
where E(k) denotes the energy relation with no broadening and gs, gv are spin and valley
9
Page 10
degeneracy. In the presence of a randomly fluctuating potential V(r), instead, the DoS can
be written as33,36
ρ(E) =
∫ ∞0
dv ρ0(v)Pv(E − v)
=gsgv4π2
∫k
dk
[∫ ∞0
dv δ [v − E(k)]Pv(E − v)
]=gsgv4π2
∫k
dkPv [E − E(k)]
(18)
where Pv(v) is the distribution function for V(r) (to be further discussed below), and we
have used the ρ0(E) definition in Eq.17 to go from the first to the second equality.
Comparing Eq.18 to Eq.17, we see that the ρ(E) of the system in the presence of broaden-
ing can be calculated by substituting the Dirac function in Eq.17 with a finite width function
Pv(v), which is the distribution function of V(r) and it is thus normalized to one.
In order to include the energy broadening in our current calculations, we rewrite the
tunneling rate in Eq.4 as
1
τkT ,kB
=2π
~|M(kT ,kB)|2δ [ET (kT )− EB(kB)]
=2π
~|M(kT ,kB)|2
∫ ∞−∞
dEδ [E − ET (kT )] δ [E − EB(kB)]
(19)
and note that, consistently with Eq.18, the energy broadening can be included in the current
calculation by substituting δ[E −E(k)] with Pv[E − E(k)]. By doing so the tunneling rate
becomes
1
τkT ,kB
' 2π
~|M(kT ,kB)|2SE(ET (kT )− EB(kB)) (20)
where we have introduced an energy broadening spectrum SE that is defined as
SE(ET (kT )− EB(kB)) =
∫ ∞−∞
dEPvT [E − ET (kT )]PvB [E − EB(kB)] (21)
where PvT and PvB is the potential distribution function due to the presence of randomly
fluctuating potential V (r) in the top and the bottom layer, respectively.
On the basis of Eq.20, in our model for the tunneling current we accounted for
the energy broadening by using in all numerical calculations the broadening spectrum
SE(ET (kT )−EB(kB)) defined in Eq.21 in place of δ[ET (kT )−EB(kB)]. More precisely we
used a Gaussian potential distribution for both the top and the bottom layer
Pv(E − Ek0) =1√πσ
e−(E−Ek0)2/σ2
(22)
10
Page 11
which has been derived by Evan O.Kane for a broadening induced by randomly distributed
impurities36, in which case σ can be expressed in terms of the average impurity concentration.
Quite interestingly, for the Gaussian spectrum in Eq.22 the overall broadening spectrum
SE defined in Eq.21 can be calculated analytically and reads
SE(ET (kT )− EB(kB)) =1√
π(σ2T + σ2
B)e−(ET (kT )−EB(kB))2/σ2
.
(23)
Hence also SE has a Gaussian spectrum, where σT and σB are the broadening energies for
the top and bottom 2D layer, respectively.
D. Rotational misalignment and tunneling between inequivalent extrema
The derivations in Sec.II B assumed that there is a perfect rotational alignment between
the top and the bottom layer and that the tunneling occurs between equivalent extrema
in the Brillouin zone, that is tunneling from a K to a K extremum (or from K ′ to K ′
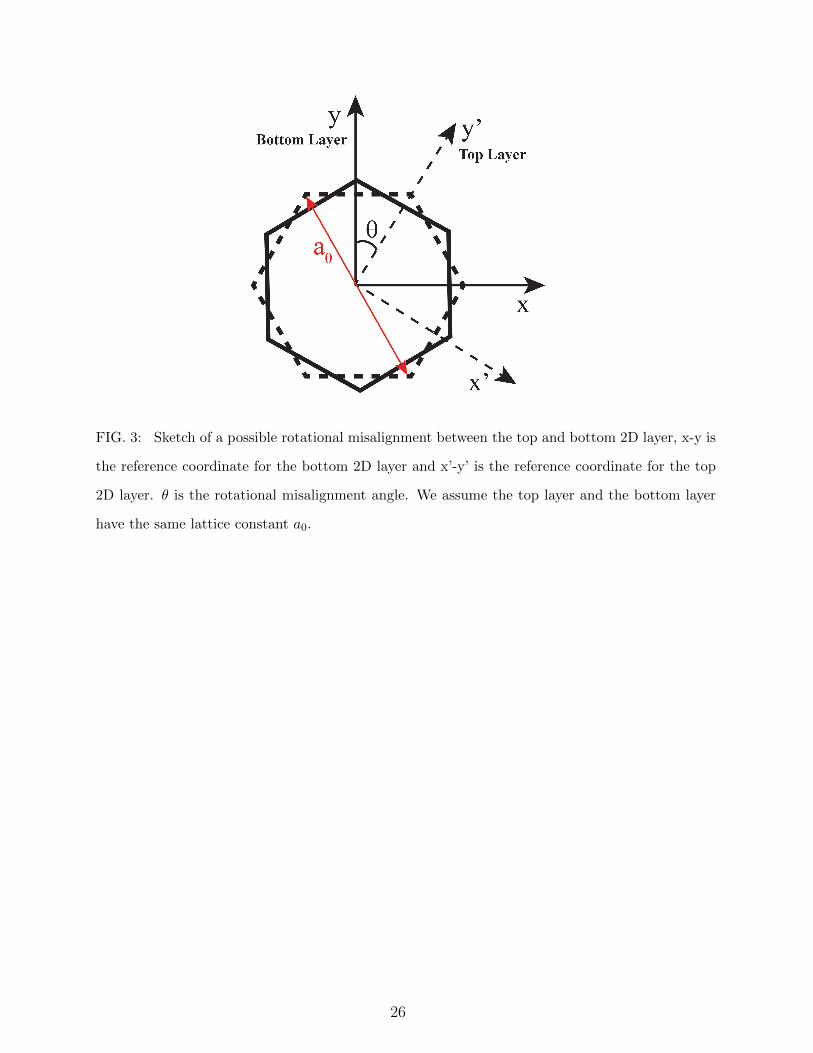
extremum). We now denote by θ the angle expressing a possible rotational misalignment
between the two 2D layers (see Fig.3), and still assume that the top 2D crystal has the same
lattice constant a0 as the bottom 2D crystal. The principal coordinate system is taken as
the crystal coordinate system in the bottom layer, and we denote with r′, k′ the position
and wave vectors in the crystal coordinate system of the top layer (with r, k being the
vectors in the principal coordinate system). The wave-function in the top layer has the
form given in Eq.6 in terms of r′, k′, hence in order to calculate the matrix element in
the principal coordinate system we start by writing r′=RB→T r, k′=RB→Tk, where RB→T is
the rotation matrix from the bottom to the top coordinate system, with RT→B=[RB→T ]T
being the matrix going from the top to the bottom coordinate system and MT denoting the
transpose of the matrix M . The rotation matrix can be written as
RT→B =
cosθ −sinθ
sinθ cosθ
(24)
in terms of the rotational misalignment angle θ.
Consistently with Sec.II B we set uT,kT(r′, z)≈u0T (r′, z), uB,kB
(r, z)≈u0B(r, z), where
u0T (r′, z), u0B(r, z) are the periodic part of the Bloch function respectively at the band
11
Page 12
edge in the top and bottom layer. We then denote with K0T the wave-vector at the conduc-
tion band edge in the top layer (expressed in the top layer coordinate system), and with K0B
the wave-vector at the valence band edge in the bottom layer (expressed in the principal
coordinate system); the derivations in this section account for the fact that K0T and K0B
may be inequivalent extrema (i.e. K0T 6=K0B).
By expressing r′ and k′ in the principal coordinate system we can essentially follow the
derivations in Sec.II B and write the matrix element as
M(kT ,kB) ' 1
NC
NC∑j=1
ei(q+QD)·rjFL(rj)×
×∫
ΩC
dr
∫dz u†0T (RB→T (rj + ρ), z)VB(z)u0B(rj + ρ, z) (25)
where q=(kB−kT ) and we have introduced the vector
QD = K0B − RT→BK0T (26)
Eq.25 is an extension of Eq.10 that accounts for a possible rotational misalignment between
the 2D layers and describes also the tunneling between inequivalent extrema. The vector
QD is zero only for tunneling between equivalent extrema (i.e. K0B=K0T ) and for a perfect
rotational alignment (i.e. θ=0). Considering a case where all extrema are at the K point,
we have |K0B|=|K0T |=4π/3a0, then for K0B=K0T the magnitude of QD is simply given by
QD=(8π/3a0) sin(θ/2)13.
One significant difference in Eq.25 compared to Eq.10 is that, in the presence of rotational
misalignment, the top layer Bloch function u0T (RB→T r, z) has a different periodicity in the
principal coordinate system from the bottom layer u0B(r, z). Consequently the integral over
the unit cells of the bottom 2D layer is not the same in all unit cells, so that the derivations
going from Eq.10 to Eq.15 should be rewritten accounting for a matrix element MB0,j de-
pending on the unit cell j. Such an MB0,j could be formally included in the calculations by
defining a new scattering spectrum that includes not only the inherently random fluctua-
tions of the potential FL(r), but also the cell to cell variations of the matrix element MB0,j.
A second important difference of Eq.25 compared to Eq.10 lies in the presence of QD in the
exponential term multiplying FL(rj).
For the case of tunneling between inequivalent extrema and with a negligible rotational
misalignment (i.e. θ'0), Eq.26 gives QD=K0B−K0T and the current can be expressed as
12
Page 13
in Eq.15 but with the scattering spectrum evaluated at |q+QD|. Since in this case the
magnitude of QD is comparable to the size of the Brillouin zone, the tunneling between
inequivalent extrema is expected to be substantially suppressed if the correlation length Lc
of the scattering spectrum SR(q) is much larger than the lattice constant, as it has been
assumed in all the derivations.
Quite interestingly, the derivations in this section suggest that a possible rotational mis-
alignment is expected to affect the absolute value of the tunneling current but not to change
significantly its dependence on the terminal voltages.
From a technological viewpoint, if the stack of the 2D materials is obtained using a dry
transfer method the rotational misalignment appears inevitable14,40. Experimental results
have shown that, when the stack of 2D materials is obtained by growing the one mate-
rial on top of the other, the top 2D and bottom 2D layer can have a fairly good angular
alignment41,42.
E. An analytical approximation for the tunneling current
The numerical calculations for the tunneling current obtained with the model derived in
Secs.II B and II C will be presented in Sec.III, while in this section we discuss an analytical,
approximated expression for the tunneling current which is mainly useful to gain an insight
about the main physical and material parameters affecting the current versus voltage char-
acteristic of the Thin-TFET. In order to derive an analytical current expression we start by
assuming a parabolic energy relation and write
EV B(kB) = EV B −~2k2
B
2mv
ECT (kT ) = ECT +~2k2
T
2mc
(27)
where EV B(kB), ECT (kT ) are the energy relation respectively in the bottom layer valence
band and top layer conduction band and mv, mc the corresponding effective masses.
In the analytical derivations we neglect the energy broadening and start from Eq.15, so
that the model is essentially valid only in the on-state of the device, that is for ECT<EV B.
We now focus on the integral over kB and kT in Eq.15 and first introduce the polar
coordinates kB=(kB,θB), kT=( kT ,θT ), and then use Eq.27 to convert the integrals over kB,
13
Page 14
kT to integrals over respectively EB, ET , which leads to
I ∝∫kT
∫kB
dkT dkB SF (q) δ(EB(kB)− ET (kT )) (fB − fT ) (28)
=mcmv
~4
∫ 2π
0
dθB
∫ 2π
0
dθT
∫ ∞ECT
dET
∫ EV B
−∞dEB SF (q) δ(EB − ET ) (fB − fT )
where the spectrum SF (q) is given by Eq.16 and thus depends only on the magnitude q of
q=kB−kT . Assuming ECT<EV B, the Dirac function reduces one of the integrals over the
energies and sets E=EB=ET , furthermore the magnitude of q=kB−kT depends only on the
angle θ=θB−θT , so that Eq.28 simplifies to
I ∝ mcmv(2π)
~4
∫ 2π
0
dθ
∫ EV B
ECT
dE SF (q) (fB − fT ) (29)
In the on-state condition (i.e. for ECT<EV B), the zero Kelvin approximation for the Fermi-
Dirac occupation functions fB, fT can be introduced to further simplify Eq.29 to
I ∝ mcmv(2π)
~4
∫ 2π
0
dθ
∫ Emax
Emin
dE SF (q) (30)
where Emin=maxECT , EFT, Emax=minEV B, EFB define the tunneling window [Emax−
Emin].
The evaluation of Eq.30 requires to express q as a function of the energy E inside the tun-
neling window and of the angle θ between kB and kT . By recalling q2=k2B+k2
T−2kBkT cos(θ),
we can use Eq.27 to write
q2 =2mv
~2(EV B − E) +
2mc
~2(E − ECT )−
4√mcmv
~2
√(EV B − E)(E − ECT ) cos(θ) (31)
with E=EB=ET . When Eq.31 is substituted in the spectrum SF (q) the resulting integrals
over E and θ in Eq.30 cannot be evaluated analytically. Therefore to proceed further we now
examine the maximum value taken by q2. The θ value leading to the largest q2 is θ=π, and
the resulting q2 expression can be further maximized with respect to the energy E varying
in the tunneling window. The energy leading to maximum q2 is
EM =ECT + (mc/mv)EV B
1 + (mc/mv)(32)
and the corresponding q2M is
q2M =
2(mc +mv)(EV B − ECT )
~2(33)
14
Page 15
When neither the top nor the bottom layer are degenerately doped the tunneling window
is given by Emin=ECT and Emax=EV B, in which case the EM defined in Eq.32 belongs to
the tunneling window and the maximum value of q2 is given by Eq.33. If either the top or
the bottom layer is degenerately doped the Fermi levels become the edges of the tunneling
window and the maximum value of q2 may be smaller than in Eq.33.
A drastic simplification in the evaluation of Eq.30 is obtained for q2M1/L2
c , in which
case Eq.16 returns to SF (q)≈πL2c , so that by substituting SF (q) in Eq.29 and then in Eq.15
the expression for the current simplifies to
I ' egvA(mcmv)
~5|MB0|2 e−2κTIL L2
c (Emax − Emin) (34)
where we recall that Emin=maxECT , EFT, Emax=minEV B, EFB define the tunneling
window.
It should be noticed that Eq.34 is consistent with a complete loss of momentum conser-
vation, so that the current is simply proportional to the integral over the tunneling window
of the product of the density of states in the two 2D layers. Since for a parabolic effective
mass approximation the density of states is energy independent, the current turns out to be
simply proportional to the width of the tunneling window. In physical terms, Eq.34 corre-
sponds to a situation where the scattering produces a complete momentum randomization
during the tunneling process.
As can be seen, as long as the top layer is not degenerate we have Emin=ECT and the
tunneling window widens with the increase of the top gate voltage VT,G, hence according to
Eq.34 the current is expected to increase linearly with VT,G. However, when the tunneling
window increases to such an extent that q2M becomes comparable to or larger than 1/L2
c , then
part of the q values in the integration of Eq.30 belong to the tail of the spectrum SF (q) defined
in Eq.16, and so their contribution to the current becomes progressively vanishing. The
corresponding physical picture is that, while the tunneling window increases, the magnitude
of the wave-vectors in the two 2D layers also increases, and consequently the scattering can
no longer provide momentum randomization for all the possible wave-vectors involved in
the tunneling process. Under these circumstances the current is expected to first increase
sub-linearly with VTG and eventually saturate for large enough VTG values.
15
Page 16
III. NUMERICAL RESULTS FOR THE TUNNELING CURRENT
The 2D materials used for the tunneling current calculations reported in this paper are
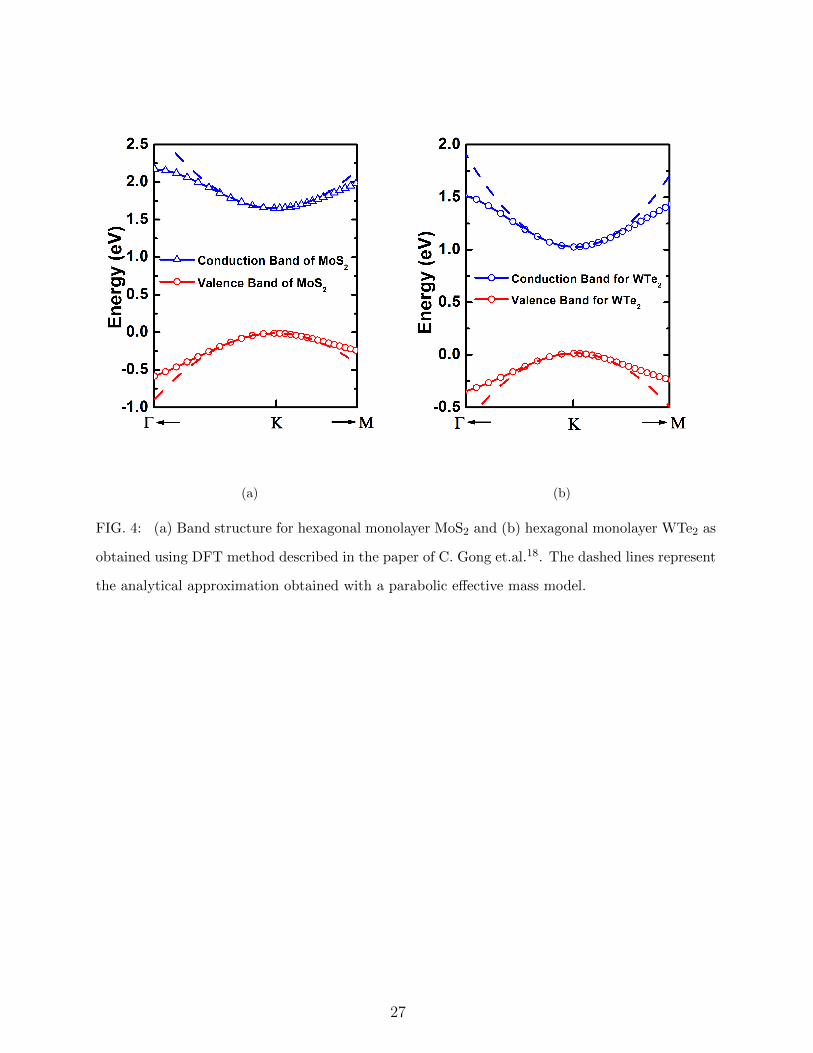
the hexagonal monolayer MoS2 and WTe2. The band structure for MoS2 and WTe2 have
been calculated by using a density functional theory (DFT) approach18,43, showing that
these materials have a direct bandgap with the band edges for both the valence and the
conduction band residing at the K point in the 2D Brillouin zone. Fig.4 shows that in a
range of about 0.4 eV from the band edges the DFT results can be fitted fairly well by using
an energy relation based on a simple parabolic effective mass approximation (dashed lines).
Hence the parabolic effective mass approximation appears adequate for the purposes of this
work, which is focussed on a device concept for extremely small supply voltages (< 0.5 V).
The values for the effective masses inferred from the fitting of the DFT calculations are
tabulated in Tab.I together with some other material parameters relevant for the tunneling
current calculations.
In all current calculations we assume a top gate work function of 4.17 eV (Aluminium)
and back gate work function of 5.17 eV (p++ Silicon) and the top and bottom oxide have an
effective oxide thickness (EOT) of 1 nm (see Fig.1). The top 2D layer consists of hexagonal
monolayer MoS2 while the bottom 2D layer is hexagonal monolayer WTe2. An n-type and
p-type doping density of 1012cm−2 by impurities and full ionization are assumed respectively
in the top and bottom 2D layer and the relative dielectric constant of the interlayer material
is set to 4.2 (e.g. boron nitride). The voltage VDS between the drain and the source is set
to 0.3 V and the back gate is grounded for all calculations, unless otherwise stated.
In Fig. 5, the results of numerical calculations are shown for the band alignment and the
current density versus the top gate voltage VTG. Figure 5(a) shows that the top gate voltage
can effectively govern the band alignment in the device and, in particular, the crossing and
uncrossing between the conduction band minimum ECT in the top layer and the valence
band maximum EV B in the bottom layer, which discriminates between the on and off state
of the transistor.
The IDS versus VTG characteristic in Fig.5(b) can be roughly divided into three different
regions: sub-threshold region, linear region and saturation region. The sub-threshold region
corresponds to the condition ECT>EV B (see also Fig.5(a)), where the very steep current
dependence on VTG is illustrated better in Fig.6 and will be discussed below.
16
Page 17
In the second region IDS exhibits an approximately linear dependence on VTG, in fact
the current is roughly proportional to the energy tunneling window, as discussed in Sec.II E
and predicted by Eq.34, because the tunneling window is small enough that the condition
q2M1/L2
c is fulfilled. In this region IDS is proportional to the long-wavelength part of
scattering spectrum (i.e. small q values), hence the current increases with Lc, as expected
from Eq.34. The super-linear behavior of IDS at small VTG values observed in Fig.5(b) is
due to the tail of the Fermi occupation function in the top layer. When VTG is increased
above approximately 0.5V, the current in Fig.5(b) enters the saturation region, where IDS
increasing with VTG slows down because of the decay of the scattering spectrum SR(q) for
q values larger than 1/Lc (see Eq.16).
In Fig.6 we analyze the I-V curves for different interlayer thicknesses TIL and broadening
energies σ; in all cases an average inverse sub-threshold slope (SS) is extracted in the IDS
range from 10−3 and 1 [µA/µm2]. Figure 6(a) shows that the tunneling current increases
exponentially by decreasing TIL, and the decay constant κ=3.8 nm−1 employed in our
calculations results in a dependence on TIL that is roughly consistent with the dependence
experimentally reported in graphene based interlayer tunneling devices15. The threshold
voltages are also shifted to lower values by increasing TIL. It can be seen that the TIL
impact on SS is overall quite modest and for all the TIL values the simulations indicate a
very steep I-V curve in the sub-threshold region (< 20 mV/dec).
Figure 6(b) shows that according to the model employed in our calculations SS is mainly
governed by the parameter σ of the energy broadening (Eq.22). This result is expected,
as already mentioned in Sec.II C, since in our model the energy broadening is the physical
factor setting the minimum value for SS and the IDS versus VTG approaches a step-like
curve when σ is zero due to the step-like DoS of these 2D semiconductors44. These results
suggest that the energy broadening in the 2D materials plays a very critical role in achieving
experimentally low SS values in the proposed Thin-TFETs.
IV. DISCUSSION AND CONCLUSIONS
This paper proposed a new steep slope transistor based on the interlayer tunneling be-
tween two 2D semiconductor materials and presented a detailed model to discuss the phys-
ical mechanisms governing the device operation and to gain an insight about the tradeoffs
17
Page 18
implied in the design of the transistor.
The tunnel transistor based on 2D semiconductors has the potential for a very steep sub-
threshold region and the subthreshold swing is ultimately limited by the energy broadening
in the two 2D materials. The energy broadening can have different physical origins such as
disorder, charged impurities in the 2D layers or in the surrounding materials39 ,37, phonon
scattering45 and microscopic roughness at interfaces38. In our calculations we accounted
for the energy broadening by assuming a simple gaussian energy spectrum with no explicit
reference to a specific physical mechanism. However, a more detailed and quantitative de-
scription of the energy broadening is instrumental in physical modeling of the device and its
design.
Quite interestingly, our analysis suggests that, while a possible rotational misalignment
between the two 2D layers can affect the absolute value of the tunneling current, the mis-
alignment is not expected to significantly degrade the steep subthreshold slope, which is the
crucial figure of merit for a steep slope transistor.
An optimal operation of the device demands a good electrostatic control of the top gate
voltage VTG on the band alignments in the material stack, as shown for example in Fig.5(a),
which may become problematic if the electric filed in the interlayer is effectively screened
by the high electron concentration in the top 2D layer. Consequently, since high carrier
concentrations in the 2D layers are essential to reduce the layer resistivities, a tradeoff exists
between the gate control and layer resistivities; as a result, doping concentrations in these 2D
layers are important design parameters in addition to tuning the threshold voltage. In this
respect, chemical doping of TMD materials have been recently demonstrated46,47, however
these doping technologies are still far less mature than they are for 3D semiconductors,
and improvements in in-situ doping will be very important for optimization of the device
performance. Since our model does not include the lateral transport in the 2D materials,
an exploration of the above design tradeoffs goes beyond the scope of the present paper and
demands the development of more complete transport models.
The transport model proposed in this work does not account for possible traps or de-
fects assisted tunneling, which have been recently recognized as a serious hindrance to the
experimental realization of Tunnel-FETs exhibiting a sub-threshold swing better than 60
mV/dec11,12. A large density of states in the gap of the 2D materials may even lead to a
Fermi level pinning that would drastically degrade the gate control on the band alignment
18
Page 19
and undermine the overall device operation. In this respect, from a fundamental viewpoint
the 2D crystals may offer advantages over their 3D counterparts because they are inherently
free of broken/dangling bonds at the interfaces19. However, the fabrication technologies
for 2D crystals are still in an embryonal stage compared to technologies for conventional
semiconductors, hence the control of defects in the 2D materials will be a challenge for the
development of the proposed tunneling transistor.
The simulation results reported in this paper indicate that the newly proposed transistor
based on interlayer tunneling between two 2D materials has the potential for a very steep
turn-on characteristic, because the vertical stack of 2D materials having an energy gap is
probably the device structure that allows for the most effective, gate controlled crossing
and uncrossing between the edges of the bands involved in the tunneling process. Our
modeling approach based on the Bardeen’s transfer Hamiltonian is by no means a complete
device model but instead a starting point to gain insight about its working principle and
its design. At the present time an experimental demonstration of the device appears of
crucial importance, first of all to validate the device concept, and then to help estimate the
numerical value of a few parameters in the transport model that can be determined only by
comparing to experiments.
Acknowledgments: This work was supported in part by the Center for Low Energy
Systems Technology (LEAST), one of six SRC STARnet Centers, sponsored by MARCO
and DARPA, by the Air Force Office of Scientific Research (FA9550-12-1-0257), and by a
Fulbright Fellowship for D. Esseni. The authors are also grateful for the helpful discussions
with Profs. K. J. Cho, R. Feenstra and A. Seabaugh. The authors are especially thankful
to Dr. Cheng Gong in Dr. K. J. Cho’s group for providing the calculated band structure
data shown in Fig. 4.
1 J. M. Rabaey, J. Ammer, T. Karalar, S. Li, B. Otis, M. Sheets, and T. Tuan, in Solid-State
Circuits Conference, 2002. Digest of Technical Papers. ISSCC. 2002 IEEE International (IEEE,
2002), vol. 1, pp. 200–201.
2 R. Amirtharajah and A. P. Chandrakasan, Solid-State Circuits, IEEE Journal of 33, 687 (1998).
3 R. G. Dreslinski, M. Wieckowski, D. Blaauw, D. Sylvester, and T. Mudge, Proceedings of the
19
Page 20
IEEE 98, 253 (2010).
4 I. W. Group et al., URL http://www. itrs. net (2011).
5 A. C. Seabaugh and Q. Zhang, Proceedings of the IEEE 98, 2095 (2010).
6 G. Zhou, R. Li, T. Vasen, M. Qi, S. Chae, Y. Lu, Q. Zhang, H. Zhu, J.-M. Kuo, T. Kosel, et al.,
in Electron Devices Meeting (IEDM), 2012 IEEE International (IEEE, 2012), pp. 32–6.
7 K. Tomioka, M. Yoshimura, and T. Fukui, Nano letters (2013).
8 L. Knoll, Q.-T. Zhao, A. Nichau, S. Trellenkamp, S. Richter, A. Schafer, D. Esseni, L. Selmi,
K. K. Bourdelle, and S. Mantl, Electron Device Letters, IEEE 34, 813 (2013).
9 D. Mohata, R. Bijesh, S. Mujumdar, C. Eaton, R. Engel-Herbert, T. Mayer, V. Narayanan,
J. Fastenau, D. Loubychev, A. Liu, et al., in Electron Devices Meeting (IEDM), 2011 IEEE
International (IEEE, 2011), pp. 33–5.
10 F. Conzatti, M. Pala, D. Esseni, E. Bano, and L. Selmi, Electron Devices, IEEE Transactions
on 59, 2085 (2012).
11 M. Pala and D. Esseni, Electron Devices, IEEE Transactions on 60, 2795 (2013), ISSN 0018-
9383.
12 D. Esseni and M. G. Pala, Electron Devices, IEEE Transactions on 60, 2802 (2013).
13 R. M. Feenstra, D. Jena, and G. Gu, Journal of Applied Physics 111, 043711 (2012).
14 L. Britnell, R. Gorbachev, A. Geim, L. Ponomarenko, A. Mishchenko, M. Greenaway,
T. Fromhold, K. Novoselov, and L. Eaves, Nature communications 4, 1794 (2013).
15 L. Britnell, R. V. Gorbachev, R. Jalil, B. D. Belle, F. Schedin, M. I. Katsnelson, L. Eaves, S. V.
Morozov, A. S. Mayorov, N. M. Peres, et al., arXiv preprint arXiv:1202.0735 (2012).
16 B. Radisavljevic, A. Radenovic, J. Brivio, V. Giacometti, and A. Kis, Nature nanotechnology
6, 147 (2011).
17 Q. H. Wang, K. Kalantar-Zadeh, A. Kis, J. N. Coleman, and M. S. Strano, Nature nanotech-
nology 7, 699 (2012).
18 C. Gong, H. Zhang, W. Wang, L. Colombo, R. M. Wallace, and K. Cho, Applied Physics Letters
103, 053513 (2013).
19 D. Jena, Proceedings of the IEEE 101, 1585 (2013), ISSN 0018-9219.
20 K. F. Mak, C. Lee, J. Hone, J. Shan, and T. F. Heinz, Physical Review Letters 105, 136805
(2010).
21 D. Esseni, P. Palestri, and L. Selmi, Nanoscale MOS transistors: Semi-classical transport and
20
Page 21
applications (Cambridge University Press, 2011).
22 J. Bardeen, Phys. Rev. Letters 6 (1961).
23 W. A. Harrison, Physical Review 123, 85 (1961).
24 C. B. Duke, Tunneling in solids (Academic Press New York, 1969), vol. 1999.
25 P. Zhao, R. Feenstra, G. Gu, and D. Jena, Electron Devices, IEEE Transactions on 60, 951
(2013), ISSN 0018-9383.
26 Z. Zhu, Y. Cheng, and U. Schwingenschlogl, Physical Review B 84, 153402 (2011).
27 A. Ramasubramaniam, D. Naveh, and E. Towe, Physical Review B 84, 205325 (2011).
28 Q. Li, E. Hwang, E. Rossi, and S. D. Sarma, Physical review letters 107, 156601 (2011).
29 J. Yan and M. S. Fuhrer, Physical Review Letters 107, 206601 (2011).
30 M. Yankowitz, J. Xue, D. Cormode, J. D. Sanchez-Yamagishi, K. Watanabe, T. Taniguchi,
P. Jarillo-Herrero, P. Jacquod, and B. J. LeRoy, Nature Physics 8, 382 (2012).
31 J. Xue, J. Sanchez-Yamagishi, D. Bulmash, P. Jacquod, A. Deshpande, K. Watanabe,
T. Taniguchi, P. Jarillo-Herrero, and B. J. LeRoy, Nature materials 10, 282 (2011).
32 R. Decker, Y. Wang, V. W. Brar, W. Regan, H.-Z. Tsai, Q. Wu, W. Gannett, A. Zettl, and
M. F. Crommie, Nano letters 11, 2291 (2011).
33 P. Van Mieghem, G. Borghs, and R. Mertens, Physical Review B 44, 12822 (1991).
34 F. Urbach, Physical Review 92, 1324 (1953).
35 G. Cody, Journal of non-crystalline solids 141, 3 (1992).
36 E. O. Kane, Physical Review 131, 79 (1963).
37 S. D. Sarma and B. Vinter, Surface Science 113, 176 (1982).
38 A. Knabchen, Journal of Physics: Condensed Matter 7, 5209 (1995).
39 A. Ghazali and J. Serre, Solid-State Electronics 28, 145 (1985).
40 L. Britnell, R. Gorbachev, R. Jalil, B. Belle, F. Schedin, A. Mishchenko, T. Georgiou, M. Kat-
snelson, L. Eaves, S. Morozov, et al., Science 335, 947 (2012).
41 S. Tiefenbacher, C. Pettenkofer, and W. Jaegermann, Surface science 450, 181 (2000).
42 A. Koma, Journal of crystal growth 201, 236 (1999).
43 G.-B. Liu, W.-Y. Shan, Y. Yao, W. Yao, and D. Xiao, arXiv preprint arXiv:1305.6089 (2013).
44 S. Agarwal and E. Yablonovitch, arXiv preprint arXiv:1109.0096 (2011).
45 U. Bockelmann and G. Bastard, Physical Review B 42, 8947 (1990).
46 H. Fang, M. Tosun, G. Seol, T. C. Chang, K. Takei, J. Guo, and A. Javey, Nano letters 13,
21
Page 22
1991 (2013).
47 H. Fang, S. Chuang, T. C. Chang, K. Takei, T. Takahashi, and A. Javey, Nano letters 12, 3788
(2012).
22
Page 23
Bandgap (eV) Electron affinity (χ) Conduction band Valence band
effective mass (mc) effective mass (mv)
MoS2 1.8 4.30 0.378 0.461
WTe2 0.9 3.65 0.235 0.319
TABLE I: The band gaps, electron affinities and effective masses used for MoS2 and WTe2
23
Page 24
0
VBG
VTG Top 2D
Bottom 2D
VDS
Back Oxide
Top Oxide
Interlayer
(a)
(b)
FIG. 1: (a) Schematic device structure for the Thin-TFET, where VTG, VBG and VDS are the
top gate, bottom gate and drain to source voltages; (b) sketch of the band diagram, where ΦM,T ,
ΦM,B are the work-functions and EF,MT , EF,MB the Fermi levels of the metal gates, while χ2D,T ,
χ2D,B are the electron affinities, EFT , EFB the Fermi levels, ECT , ECB the conduction band edges
and EV T , EV B the valence band edges respectively in the top and bottom 2D layer. VTOX , VIOX
and VBOX are the potential drops respectively across the top oxide, interlayer and bottom oxide.
24
Page 25
EVB
ECT
EFT
EFB
Top 2D Layer Bottom 2D Layer
(a)
EVB
ECT
EFT
EFB
Top 2D Layer Bottom 2D Layer
Tunnel Window
(b)
FIG. 2: Sketch of the band alignments in a Thin-TFET between the top and bottom 2D layer in:
(a) OFF state and (b) ON state.
25
Page 26
FIG. 3: Sketch of a possible rotational misalignment between the top and bottom 2D layer, x-y is
the reference coordinate for the bottom 2D layer and x’-y’ is the reference coordinate for the top
2D layer. θ is the rotational misalignment angle. We assume the top layer and the bottom layer
have the same lattice constant a0.
26
Page 27
(a) (b)
FIG. 4: (a) Band structure for hexagonal monolayer MoS2 and (b) hexagonal monolayer WTe2 as
obtained using DFT method described in the paper of C. Gong et.al.18. The dashed lines represent
the analytical approximation obtained with a parabolic effective mass model.
27
Page 28
(a) (b)
FIG. 5: Numerical results of (a) band alignment versus the top gate voltage VTG and (b) tunnel
current density versus the top gate voltage VTG for different values of the correlation length LC .
The parameters used in (b) are: matrix element is MB0 = 0.1 eV ; decay constant of wave-function
in the interlayer is κ = 3.8nm−1; energy broadening is σ = 10meV and interlayer thickness is
TIL = 0.6nm (e.g. 2 atomic layers of BN). VBG = 0 and VDS = 0.3V in both (a) and (b).
28
Page 29
(a) (b)
FIG. 6: Numerical calculations for: (a) current density versus VTG with several interlayer thick-
nesses; (b) current density versus VTG with different values of energy broadening σ. The matrix
element is MB0 = 0.1 eV ; the decay constant of wave-function in the interlayer is κ = 3.8nm−1.
In (a) the energy broadening is σ = 10meV . In (b) the interlayer thickness is TIL = 0.6nm (e.g.
2 atomic layers of BN). VBG = 0 and VTG = 0.3V in both (a) and (b).
29