University of Nigeria Research Publications Author NDOFOR, Harriet Mbumwen PG/M.Sc/99/27110 Title Estimation of Genetic Parameters of Growth Traits of Local Chicken Ecotypes Reared in Nsukka in the Derived Savanna Faculty Agricultural Sciences Department Animal Science Date August, 2003 Signature
Transcript
University of Nigeria Research Publications
Aut
hor
NDOFOR, Harriet Mbumwen
PG/M.Sc/99/27110
Title
Estimation of Genetic Parameters of Growth Traits of Local Chicken Ecotypes Reared in
Nsukka in the Derived Savanna
Facu
lty
Agricultural Sciences
Dep
artm
ent
Animal Science
Dat
e
August, 2003
Sign
atur
e
TITLE PAGE
ESTIMATION OF GENETIC PARAMETERS OF GROWTH TRAITS OF LOCAL CHICKEN ECOTYPES REARED IN NSUKKA IN THE DERIVED SAVANNA
NDOFOR, HARRIET MBUMWEN PG/MSC/99/27110
DEPARTMENT OF ANIMAL SCIENCE UNIVERSITY OF NIGERIA, NSUKKA
AUGUST 2003
CERTIFICATION
NDOFOR, HARRIET MBUNWEN, a Postgraduate Studcnt in the Dcpartmcnt of Aninla1
Science, Faculty of Agriculture, University of Nigeria, Nsukka with registration number,
PG/M.SC. 1 991271 10 has satisfactorily conlpletcd the requirements for course and rcscarch
work for the degree of Master of Scicncc in Animal Sciencc.
The work embodied in this Project Rcport is original and has not been submitted in
part or full for any other Diploma or degree of this or any other University, to the best of my
knowledge.
/$rofesessor (Dr) C. C. NWOSU i SUPERVISOR
DEDICATIOIN
For t k i r h e , &ndness andencourienrent
ACKNOWLEDGEMENTS
My sincere gratitude goes to God Almighty for his Grace. To my supervisor Professor (Dr)
C.C. Nwosu for his tireless interest and effort to see me succeed in this programme. I am
much thankful to Dr. L.N. Nwakalor for providing me with all the materials, which were
necessary for the realisation of my programme. I am indebted to all members of teaching staff
in Animal Science Department, who made favourable recommendations towards this research
work. My special thanks goes to all the members of staff of the Poultry Unit of the
Department of Animal Science farm and Dr. Lucas Ngongeh for their various contributions.
Success in the whole programme could not have been possible without the wonderful
cooperation and assistance of my mother, my brothers Calemba Ndofor, Marius, Vally and
Gabo and my sisters Adeline, Ethel, Drl Mrs Musongong, Meta, Afanui, Abongwa, Llody
and Che. During my course, I benefited from pleasures and support of the family of DrIMrs
Manfred Besong. To my friends Relyndise Tabe Engineer Josephine Mbunwe, Peps Tanyi,
Ebene, Andison, Ene, Bro John Wansah, Collins, just to name a few I say thank you for your
support. My profound gratitude goes to Dom Fobellah and Harry Foleng for leading in the
typing of this work and Greg Fombo for giving me his computer to type this work.
To Evaristus Foleng and the Foleng's family, I remain ever grateful for your love,
' moral and financial support. You are wonderful. While acknowledging the contributions of
the above persons, I accept any shortcomings and omissions contained in this work.
Ndofor, H. M University of Nigeria August 2003
Abstract
In a study to investigate the usefulness of two ecotypes of local chickens (light ecotype and heavy
ecotype) in chicken breeding programmes in Nigeria, heritability estimates of body weight,
coefficients of simple correlation between growth traits, and genetic correlation between
bodyweight at four weekly intervals were obtained from the 4th to the 20th week of age.
Heritability was estimated using the sire components of variance on the basis bf data obtained in
a one-way layout. 136, 58 and 60 chicks of both sexes raised from a non-inbred and randomly
mating population of the light, heavy and main cross respectively, were used in the investigation.
The chicks were pedigreed from day-old according to sires and raised under a deep litter system
of management from day-old to 20 weeks of age. Fertility percentages of 58.20,48.78, and 36.97
were obtained for the light, heavy and main cross chickens respectively, while hatchability
percent of 47.89, 72.50 and 76.92 were obtained for light, heavy and main cross chickens
respectively. Mean feed efficiency throughout the experimental period were obtained as 0.29 f
0.04, 0.35 f 0.08 and 0.31 f 0.08 for the light, heavy and main cross chickens respectively. A
mean conversion ratio of 3.79 f 0.66, 3.63 _+ 1.002 and 4.69 f 1.48 were calculated for the light,
heavy, and main cross chickens respectively. There were however, no significant (PB0.05)
differences in mean feed consumption, mean feed efficiency and mean feed conversion ratio,
between the 3 groups.
Average body weights of the birds at day-old were 21.82g, 28.06g, 26.30g; at 4 weeks were
95.413, 143.68, 126.72g;at 8weeks were 349.89g, 561.7lg, 458.57g; at 12 weeks were 568.14g,
816.67g, 714.00g; at 16 weeks were 768.858, 1066.67g, 811.54g; and at 20 weeks 931.34g, 1196.67g,
950.00g, for light, heavy and main cross chickens respectively. There were highly significant
differences in average body weights at 0,4,8,12,16 and 20 weeks in all the 3 groups.
Heritability estimates from sire components of variance averaged 0.40, 0.37, and 0.29
between 4 and 20 weeks for the light, heavy and main cross respectively. Based on these estimates it
could be concluded that the body weight at different ages is moderately to highly heritable and as such
could be improved through breeding and selection.
Genetic correlation estimates of body weight between different ages were obtained.
Similarly, coefficients of simple correlation were obtained among some economically important
growth traits, for the 3 groups. Age and body weight at first egg were obtained as 145 days and
940g, 149 days and 1208.33g and 154 days and 1050g for the light, heavy and main cross
chickens respectively. The average weights of first egg were obtained as 30.0g, 35.248 and
31.60g and for the light, heavy and main cross chickens respectively. The experiment indicates
that the heavy local chickens and the main cross performed better in bodyweight, bodyweight at
point of lay, and egg weight over the light local chickens.
CHAPTER ONE
INTRODUCTION
1.0 Background Information
The total number of poultry in the world has been estimated to be 14,718 million, with 1,125
million distributed throughout the African continent, 1,520 million in South America, 6,752
million in Asia, 93 million in Oceania, 3,384 million in North America and 1,844 million in
Europe (FAO, 1991).
The population of livestock in Nigeria has been estimated to be about 14 million
cattle, 21.1 million sheep, 34.5 million goats (Abubakar et al., 2003), and 70,928 million
chickens of which 68.164 n~illion are raised in rural areas while 2764 are raised in urban
areas '(FDLPCS, 1992). Despite these enormous livestock and poultry resources, a serious
gap has been observed between demand and supply, due to the growth rate of the human
population (Kehinde et al., 2002), leading to the problems of protein malnutrition (Egbunike,
2002). To meet the demand for cheap animal protein in Nigeria, improved breeds of chicken
from developed countries, which require expensive imported inputs dominate the commercial
poultry sector. It has become increasingly difficult to sustain these industries over the years
under a poor economy with high exchange rates required for inputs (Okpeku et al., 2003).
Altlmugh the introduction of these high-yielding chicken breeds in Africa dates back to the
1920s, the local chicken population in most African countries account for more than 60
percent of the total national poultry production (Sonaiya, 1990).
Generally, the local chickens are small-bodied mongrels raised on free range
(traditional or village system) and backyard system called the "family" or subsistence system
(Lul, 1990). On the free range they are allowed to scavenge around household compounds
and because of the absence of shelter, birds perch on high places or take shelter in human
habitations such as kitchens (Sall, 1990). In the backyard system birds spend the night in
constructed shelters with water and supplementary grains generally being provided. In both
systems, birds almost never receive veterinary care (Assan, 1990). A number of studies
(Oluyemi and Oyenuga, 1974; Akinokum and Dettmers, 1977; and Nwosu et a1 1985) on the
indigenous breed as an alternative or complementary source of animal protein reveals that the
local chicken has an early growth rate, early initiation of lay, medium to high heritability of
body weight and a quick response to egg production under improved management and dietary
conditions.
It is obvious that individual animals within a population and between populations of
the same species differ in some characters. Much of these differences are seen when animals
have different genetic constitution, and nutritional status (Sastry and Thomas, 1980). These
variations are the raw materials with which breeders work (Schmidt and Van Vleck, 1974).
The animal breeder is concerned with how to improve those animals in the 'Rock whose
production capacity are below average, to a point of ''maximum production", and how to
maintain such animals in the face of all disturbing factors (Ensininger, 1969).
Statement of Problem
In the mid- 1980s most developing countries suffered a slow down in economy and this
affected the import - dependent sectors such as conlmercial poultry as well as affccted the
intensive and semi-intensive production systems, which mushroomed in the 1970s. This lcd
to a substantial increase in the quantity of rural poultry meat in the market as a result of
decreasing supply of commercial poultry (Suleiman, 1989). Althouph thcre is n gcncrnl
acceptability of poultry products in developing countries this sector of the economy is
plagued with a lot of problems, which must be resolved for any meaningful progress to be
made (Ibrahim et al., 2000). This will mean tackling the problems of input, marketing,
infrastructure and heavy financial requirement for capital development and recurrent
requirement. The problems facing the Nigerian poultry industries today einanatcd from
Nigeria's over dependence on foreign inputs, importation of breeding stock to commercial
day- old chicks and importation of grains (Nwosu, 1979 and Tait, 1980). Replenishment of
parent stock by importation has its toll on the countries foreign exchange earnings (lbe,
1990).
Importation of animals from one climatic zone to the other constitutes a major
problem in breeding work, leading to a genotype x environment interaction, and subscqucntly
to a reduction in fitness (Falconer, 1989). It is important, therefore, that farm anin~als be
improved under the conditions identical to those under which they will bc subjected for
production. There is then the need to improve local fowls, within our cnvironmcntal
conditions, for optimum productivity (Njue el al., 2002). There is equally the problcnl of
.disease importation arising from the importation of exotic fowls, which, to reduce mortality
among the exotic stocks from the endemic diseases, a lot of money has to be cxpended on
health management schemes. If, however, thc local chickens can be dcvclopcd from the
unselected group and they perform wcll with respect to traits such as egg production ant1
carcass weight, then, the path will be paved towards the solution of thc prohlcn~ crcntctl by
heavy dependence of the poultry subsector on foreign sources. This is becaltsc thc Nigcriatl
fowl population has already shown relative rcsistancc to son~c discasc (Oluycnli cl r r l . , 1 970).
There is the problem of random and uncontrolled mating between the local and
imported birds and lack of an organized improvement scheme for local birds. This has
resulted in birds characterized by such survival traits as small body size, growth, late
mortality and production, tolerance and resistance to prevalent local diseases and perversities
and hardiness ([be, 1990). With random and uncontrolled mating, it is not possible to define
distinctive feature of the local fowl of the country, which could justify its recognition as a
breed.
In recognition of the above-mentioned problems, and considering the fact that primary
breeders in developed countries may be reluctant in supplying developing countries with
outstanding elite stock for improvement of their local stock, there is need for a systematic and
~nethodological approach for the improvement of the large population of local chickens. This
can be achieved by exploiting the valuable gene resources of different ecotypes of local
chickens for future breeding plans designed to improve their productivity and adaptability to
tropical production system.
The present study focuses on estimating genetic parameters of growth traits of light
ecotype, heavy ecotypes and main cross of local chickens reared in Nsukka, South Eastern
Nigeria. Earlier studies carried out at the local chicken laboratory at the University of
Nigeria, involved assessment of the local, light ecotype chickens and imported breeds'
performance.
Objective of the Study
The general objective of the study is to obtain information on the genetic parameters of body
weight, and assess the differences in some economically important traits of two ecotypes of
~odal chicltens and main cross, reared in Nsukka in the derived savanna.
The specific objectives of the study are:
1) To measure and determine the feed consumption, feed efficiency, feed conversion
ratio, body weight, body weight gain of the light, heavy, and main cross chickens at
day-old, 4 weeks, 8 weeks, 12 weeks, 16 weeks and 20 weeks of age
2) To note age, body weight at first egg and weight of first egg.
3) To compare the light, heavy, and main cross chickens in a number of growth
parameters and assess the suitability of their involvement in future breeding
programmes.
4) To estimate heritability and genetic correlation among body weights at different ages
of the light, heavy, and main cross chickens.
Justification
Through the years, a large number of breeds and varieties of chickens have been developed,
but most of these are of historic significance. Many of these early breeds. have been
eliminated; a few breeders interested in developing uncommon varieties have retained others.
Geneticists do not want to lose these genes forever, which would be the case if all the rare
breeds cease to exist (North, 1978).
For any meaningful progress on the local chicken to take place, there is real need for
the improvement of the local chicken - their body size and egg size. An important
requirement for this improvement is an appropriate breeding method for bringing about rapid
genetic progress. This can only be achieved when there is more systematic information on
physical, productive and reproductive parameters of the local chicken. The choice of brccding
method will depend on estimates of gcnetic parameters of body weight in thc popuht' ion.
Such estimates will be useful in the identification of superior genotypes for sclection, which
is an important tool for genetic improvement (Mshelia and Abubakar, 1997). Estimates of
heritabilities and genetic correlations of body weight reflect the magnitude of the expected
response to selection, which will influence the choice of selection method and breeding plans
to be considered in future.
Hence, the estimation of heritability and genetic correlation of body weight of
different ecotypes is the pivot of this investigation. The result of this study might hclp in
formulating important breeding plans for the light and heavy ecotypes of the Nigerian local
chickens. Secondly, if the cross between light and heavy types achieves fast growth ratc, thcn
breeders might consider it as a parent in broiler chicken development in Nigeria.
CHAPTER TWO
LITERATURE REVIEW
2.1 Origin and History of Poultry
Most scholars believe that the indigenous chickens were domesticated from the red jungle
fowls (Gullus g~il l t~s) on the Indus valley about 2000 B.C. From there, they gradually spread
to the East and West where they eventually encircled the globe (Austic and Nesheim, 1990).
However not all scholars accept this view, some believed that other wild Gallus species may
have contributed to the domestic birds. Some believed that South East Asian chicken stock
were domesticated separately and might have been derived from one or more extinct species
orjungle fowls (Sasimowski, 1997). Others hold the view that there was early domestication
i n Burma, diffusing in all directions with first archaeological evidence appearing in China
and the Indus valley (Craw ford, 1993).
2.2 Importance of Local Chickens in Household and National Economies
l'hc importance of rural poultry in national economies of developing countries and its role in
improving the nutritional status and incomes of many small farmers and landless
coinmunities have been recognised by various scholars and rural development agencies in the
last two decades (FAO, 1982, 1987; Bembridge, 1988; Mokotjo, 1990; Creevey, 199 1).
The rural poultry population in most African countries account for more than 60
pcrcent of the total national poultry production, which has been accorded an asset value of
$ U S 5750 millions (Sonaiya, 1990). In Bokina Faso, Ouandaogo (1990) reported that the 25
inillion rural poultry produce 15 000 tonnes of meat, out of which 5,000 tonnes are exported
a1 a value of U.S. $ 19.5 millions, mainly to Coat D71voire.
Village chickens are more widely distributed in rural Africa than the other livestock
spccics. In the United Republic of Tanzania, a survey of 6,00 households in 20 villages
showed that chickens were the only form of livestock found in most households (Collier et
( I / . , 1986). Similar observations have been reported in Ghana (Van Veluw, 1987), Niger
(Abdou and Bell, 1992), in Cameroon (Ngou Ngoupayou, 1995) and in Nigeria (Adetayo and
Babarunso, 2001). Surveys in some African countries have reported that the main function of
villagc chickens from the farmer's perspective is the provision of meat and eggs for home
consumption [in Nigeria (Nwosu, 1979), Mali, (Kuit et al., 1986); South Africa, (Cairns and
Lea, 1990); and Cameroon, (Ngou Ngoupayou, 1995)l. In addition to this, local chickens are
kcpt for other purposes: barter that is in the context of intra-and inter community exchanges
and/or religious ceremonies (cocl<s as offerings to the deities), (Lul, 1990; Yami, 1995) and
to meet the obligation of hospitality. Chale and Carloni (1982) review the attributes of local
chicken meat and eggs in rural areas. Egg dishes and chicken meat cook fatter than pulses
and red meat, and therefore, use less firewood. Income received from the sale of eggs in a
woman project in Sudan was used to purchase household consumable goods, thus increasing
household welfare. Gittinger et u1 (1987), in a survey on food production by women and it's
impact on food security found that rural households that had cropping as their only source of
food production were more food insecure than households that had livestock including
poultry. However, local chickens do not rate high in the mainstream national economies
because of the lack of measurable indicators of their contribution to macro economic indices
such as Gross Domestic Product (GDP).
2.3 Potentials of the Local Chicken.
There is sufficient scientific evidence to warrant the use of the local chicken as a parent in
breeding programmes aimed at either developing egg-type or meat-type breeds for Nigeria
(Egbunike, 2002). According to Horst (1988), the genetic resource base of the indigenous
chickens in the tropics is rich and should form the basis for genetic improvement and
diversification to produce a breed adapted to the tropics. The established major gene in
exotic/local chicken populations according to Horst (1988), include: Dwarf (dw), Naked neck
(Na), Frizzle (F), Silky (h), Slow feathering (K), Non-inhibitor, Pea comb (P) and Blue Shell
(0), lnformation for the use of these genes for genetic improvement is scanty, but Mathur et
ul (1989) reported an increase in egg production through incorporating naked neck (Na)
genes in a cross breeding programme of local Fayoumi chicken in Egypt. Similarly, Horst
and Mathur (1992) reported favourable effects of naked neck (Na) and frizzle (F) genes on
egg production and egg weight and of the dwarf gene (dw) on feed efficiency of chickens
under heat stress.
Nwosu et a1 (1984) reported that the growth rate of local chickens from day-old to
point of inflection (1 3-14 weeks) was rapid and did not differ from that of an imported stock.
Secondly the local chickens posses the potential to grow fast at the early stages of life and
therefore, fitted for use as a parent in broiler chicken development in Nigeria. Thirdly, they
found out that the local pullets lay their first egg at an average age of 135 days in contrast to
145 days of the Starcross, a difference that could be significant in poultry breeding
programmes. Fourthly, that generally the local birds consumed less food and drank less water
than the Starcross (exotic birds). Obioha et a1 (1983) maintained that the local cocks tended
to be superior in high economic cuts than the exotic cocks, and concluded that the local fowls
to meet the obligation of hospitality. Chale and Carloni (1982) review the attributes of local
chicken meat and eggs in rural areas. Egg dishes and chicken meat cook fatter than pulses
and red meat, and therefore, use less firewood. Income received from the sale of eggs in a
woman project in Sudan was used to purchase household consumable goods, thus increasing
household welfare. Gittinger et a1 (1987), in a survey on food production by women and it's
impact on food security found that rural households that had cropping as their only source of
food production were more food insecure than households that had livestock including
poultry. However, local chickens do not rate high in the mainstream national economies
because of the lack of measurable indicators of their contribution to macro economic indices
such as Gross Domestic Product (GDP).
2.3 Potentials of the Local Chicken.
There is sufficient scientific evidence to warrant the use of the local chicken as a parent in
breeding programlnes aimed at either developing egg-type or meat-type breeds for Nigeria
(Egbunike, 2002). According to Horst (1988), the genetic resource base of the indigenous
chickens in the tropics is rich and should form the basis for genetic improvement and
diversification to produce a breed adapted to the tropics. The established major gene in
exotic/local chicken populations according to Horst (1988), include: Dwarf (dw), Naked neck
(Na), Frizzle (F), Silky (h), Slow feathering (K), Non-inhibitor, Pea comb (P) and Blue Shell
(0). Information for the use of these genes for genetic improvement is scanty, but Mathur et
(11 (1989) reported an increase in egg production through incorporating naked neck (Na)
genes in a cross breeding programme of local Fayoumi chicken in Egypt. Similarly, Horst
and Mathur (1992) reported favourable effects of naked neck (Na) and frizzle (F) genes on ' egg production and egg weight and of the dwarf gene (dw) on feed efficiency of chickens
under heat stress.
Nwosu et ul (1984) reported that the growth rate of local chickens from day-old to
point of inflection (13-14 weeks) was rapid and did not differ from that of an imported stock.
Secondly the local chickens posses the potential to grow fast at the early stages of life and
therefore, fitted for use as a parent in broiler chicken development in Nigeria. Thirdly, they
found out that the local pullets lay their first egg at an average age of 135 days in contrast to
145 days of the Starcross, a difference that could be significant in poultry breeding
programmes. Fourthly, that generally the local birds consumed less food and drank less water
than the Starcross (exotic birds). Obioha et a1 (1983) maintained that the local cocks tended
to be superior in high economic cuts than the exotic cocks, and concluded that the local fowls
can be developed into a broiler bird if the cocks are fattened like broilers. The local cock is
very vigorous and has a high libido. Another potential of the local chicken is its maternal
ability, a behavioural adaptation normally referred to as broodiness. It involves the hen's
ability to lay a few fertile eggs in a clutch, incubate the eggs by sitting on them naturally and
brood the chicks (Nwosu, 1979). According to Oluyemi et a1 (1979) the most important
physical characteristic of the local chicken is its resistance to economic diseases as well as
other harsh environmental and management conditions. Nwosu and Omeje (1984) reported
on some production and reproduction parameters as follows: clutch size 3.1 + 0.4, number of
pause 1.5 + 0.43, pause length (days) 3.0 k 0.4 and broodiness 4.4 f 0.00.
The local chicken has been shown to have good meat quality, flavour and general
acceptability of cut-up parts when compared with the exotic and crossbred (Nwosu et al.,
1985), and the egg has a biological value close to 100% (Oluyemi and Roberts, 2000). Further
more, the local chicken is reported to have exhibited appreciable heterosis and "nicking" in
body weight and egg production when crossed with exotic breeds (Asuquo, 1984; Nwosu and
Omeje, 1984).
2.4 Fertility and Hatchability
Fertility is defined as the percent fertile of total eggs set (Mack, 1978). The successful
transfer of adequate normal viable spermatozoa to an oviduct suited to enhancing their
survival is necessary for fertility. Therefore, the ability of the female breeder to produce
fertile eggs depends on factors in the laying pen. Good, viable breeding males and healthy
normal breeding female are a prerequisite. Therefore fertility is the result of laying house
management rather than the outcome of hatchery management (Singh, 1990). The egg must
therefore be fertile for it to have the potential to hatch (Austic and Nesheim, 1990).
Hatchability on the other hand is the number of chicks hatched as a percent of the fertile eggs
set (Mack, 1978). The actual process of hatching a chick is complicated and there are many
factors affecting the normal procedure. The environment in which eggs are incubated plays
an important part, as do position and turning of the eggs (Austic and Nesheim, 1990).
Obioha (1992), reported that the hatchability and quality of chicks deteriorate every
day an egg is held after the fifth day of collection. The effects of storage temperature and
storage position seem to be more pronounced if the storage duration is prolonged (Andrews,
1990).
2.5 Health and Disease Control
Poultiy diseases have continued to play very important role in retarding the progress of
poultry industry. This is even more so with native scavenging chickens where there is no
organised disease control programmes through vaccinations and proper hygiene (Njike,
2001). Major diseases of poultry in Africa that have been predominantly identified in
commercial poultry are Newcastle disease, Gumboro Marek disease, fowl typhoid, cholera,
mycoplasmosis and coccidiosis, (Adene, 1996). However, Chabeuf, (1990) reported that the
most devastating disease of village chickens in Cameroon is Newcastle disease, where as in
commercial poultry, coccidiosis, Marek disease and Gumboro are more prevalent. Research
work in other African Countries such as Burkina Faso (Bourzat and Saunders 1990),
Mauritania (Kane and Le Jan, 1990), Benin (Chrysostome et nl., 1995) and Nigeria (Njilte,
2001) support the argument that Newcastle is the most devastating disease of local chickens.
Other health problems in local chickens are external and internal parasites. A study carried
out on ectoparasites of domestic fowls in Nigeria showed that Lice, Meizacunthus stramineiz,
were the major problem in rural poultry (Zaria et al., 1993). From this above study, the
external parasite problem was associated with season-higher rate of infection occurring
during the rainy season.
2.6 Feed Consumption and Feed Efficiency
Feed resources are major inputs in poultry production systems, estimated to account for about
60 percent of total production cost in the commercial poultry sector (Renkema, 1992). In
village chicken production systems, it is difficult to estimate the economic andlor physical
values of these inputs because there are no direct methods of estimating the scavenged feed
resource, which constitute most of the feed input (Roberts and Gunaratne, 1992). Williamson
and Payne, (1978) reported that from 1 - 8 weeks of age a bird will consume 0.014 - 0.051
kg of feed per day, 0.054 - 0.09 kg per day at 9 - 20 weeks and mature birds would consume
more than 0.09 kg of feed per bird per day. However, the local chickens under good
management conditions consumes 0.010 - 0.050 g per bird per day at 1 to 8 weeks old; 0.061
to 0.079 kg per bird per day at 9 - 20 weeks; and above 20 weeks 0.082 kg per day for
matured birds (Obioha, 1992). Safalaoh, (1997) reported a feed consumed per bird per day of
30 g at 0 to 8 weeks.
Extensive work has not yet been done on the efficiency of feed utilisation of the
Nigerian indigenous fowls but they could be expected to utilise less feed to maintain their
small body size. The more feed that is consumed, the less the nutritive utilisation per unit
food. Conversely, the less feed consumed within a certain limit, the higher the utilisation per
unit feed (Obioha, 1992). Feed efficiency gives an insight on nutrient quality availability and
utilisation of the feed by the chicken. It also gives an indication of the efficiency with which a
particular feed is being converted into useful animal products. It is influenced by factors such
as breed, sex, age, health and physiological state of the animal and management (Branckaert,
1992). Rapidly growing chicks require adequate feed to express their rapid growth potential.
This applies also for the expression of optimum feed efficiency. Improvements in feed
efficiency arise fi-om reduction in feed wastage, increase in feed intake, increase in
digestibility of nutrients and reduction in maintenance energy requirements (Obioha, 1992).
2;7 Phenomenon of Growth and Growth Rate
Growth is a complex physiological process that exists from conception until maturity in
animals. Obioha (1 992), defines growth as an increase in weight and/or size that occurs over
time and when this increase in weight is plotted against time an S-shaped sigmoid curve is
obtained. Onuora et a1 (1 979) also define growth as a correlated increase in the mass of body
in definite interval of time in a way characteristic of a species. This indicates that growth
varies with age and genetic make-up. Growth involves the synthesis and deposition of
minerals (bone growth), of protein (tissue growth), but fat deposition is, however not
regarded as growth because fat is expendable. The rate of growth differs from one organ to
the other, some being faster than the other. Another thing about growth is that it is not
uniform from week to week (Crawford, 1993). Ngere (1975), reported important factors
affecting growth: nutrition (which is an important factor in growth because it harnesses
hereditary make up in such a way as to bring about maximum growth possible), hormones,
temperature and heredity. Appropriate mathematical functions have the potential to concisely
and biologically represent the entire growth phase of the chicken. Graphic illustration of these
functions gives rise to growth curves. These curves are universal sigmoid curve, which can
define the growth rates (Crawford, 1993). Growth curve have four characteristics: an
accelerating growth phase following hatch; a point of inflection coincident with maximum
growth rate; a decelerating growth phase; and a limiting mature weight which is approached
asymptotically.
2.7.1 Body Weight
Body weight at a specific age is probably the most frequent used indicator of growth. It is
attractive because it is relatively easy to measure (Craw ford, 1993). Various researchers have
reported different body weight for the local chickens in Nigeria at various ages. Hill and
savanna); Pie-Zarama, Yenegoa (Swamp forest), Obo-hag in Rot-Ekpene in Akwa Ibom
State and Ndoro in lkwuano local government area of Abia state (Rain forest) areas of South
Eastern Nigeria and the heavy ecotype (HE) of local chickens purchased from Vandekiya
Kastina Ala of Benue state, Obudu, a montane region of South Eastern Nigeria. The acquired
birds were quarantined to check and monitor their health conditions and left to acclimatise
with the environment before introducing them into the experimental units. 88 non-pedigreed,
unselected and unimproved random bred males and females of the light local birds housed at
the farm formed the base population for light ecotype (LE) while 55 males and females that
were non-pedigreed, unselected and unimproved, formed the base population for the heavy
ecotype (HE). This study was carried out between June 2001-February 2003.
3.3 Breeding Procedure
The parents were arranged into the following mating groups:
Table: 1 Breeding Procedure
Group Breeding Groups Number of Breeders Mating Ratio
Males Females
LE males x LE females 8 80 1:lO
HE males x HE females 5 50 1:lO
HE males x LE females 5 50 1:lO
The above arrangements resulted in 3 breeding parent groups (plates 1 ,2 and 3) from
where the "purebred" and main cross progeny populations were derived.
PLATE 1: LIGHT MALE X LIGHT FEMALES
PLATE 2: HEAVY MALE X HEAVY FEMALES
PLATE 3: HEAVY MALE X LIGHT FEMALES
The mating design used was onc-way layout (Becker, 1992) in which each sirc was
mated randomly to 10 dams. In each brceding group, the males were allowed to stay with thc
females for a week to ensure that mating was effected, at the end of which cggs werc
collected, pedigreed and stored in crates inside a room under ambic~lt tcmperaturc. Thc
incubator was cleaned and disinfected prior to setting of the eggs. Eggs incubated wcrc
candled for each group on the 8th and 18th day of incubation.
3.4 Fertility and Hatchability
3.4.1 Fertility
Fertility was tested at the 81h day of incubation by directing candlelight across an cgg in thc " dark. Fertile eggs showed a dark spot at the ccntre with radiating streaks of blood vcsscls.
mimicking the structure of spider. Infertile eggs wcrc removed and fertility pcrcentagc
computed thus:
Total nttmber of fertile eggs 1 00 Fertility Percentage = x-
Total rlurrlber of eggs sel 1
3.4.2 Hatchability
These were the proportion of fertile eggs that hatched.
Total numbcr of hatched eggs 100 ~ a t c h a b i l i t ~ percentage = X- Total number of fertile eggs 1
3.5 Management Procedure
Prior to chicks' arrival, the broodcr house and cquipmcnt wcrc disinfcctcd and then frcsh
litter was put to a depth of about 6cm. On the day of hatching all chicks wcrc pedigrccd by
sire. The chicks were given chick mash and watcr on arrival, and proper managcmcnt and
hygiene were ensured. Thc recoinmcndcd schcdule and the evcntual programmc of
vaccination practiced are as follows:
Reconlmended programme
Newcastle (1ntraocular)- Day - old
'~asota - 3-4 weeks, and 6 weeks
Merek's Disease vaccine- Day-old
Gumboro vaccination -10-14 days, and Sweeks
Fowl Pox vaccine - 12 weeks
Fowl typhoid vaccinc 4weeks
Cholera vaccine
Vaccines givcr~
Newcastle (Tntraocu1nr)- 1 Otlays
Lasota vaccination - 3 wccks and
----- Gumboro vaccination - 16 days
Fowl Pox vaccinc - 12 wccks old
-----
-------
Coccidiostat was given to all birds for the prevention of coccidiosis. Chicks were
brooded in pens for 4 weeks; and management conditions were the same for all chicks. At the
end of brooding, chicks were transferred and managed in rearing pens with feeding and
drinking troughs provided. Birds were reared up to 20 weeks of age.
3.6 Measurements
Three commercial diets were used in feeding the birds. The diet comprised: chick mash fed
up to 8 weeks, growers' mash fed until 18 weeks and layers mash fed up to 20 weeks. These
feeds were analysed for proximate composition. Water was given ad libitum, whereas
A measured quantity of the analysed feed was given to the groups daily for seven days after
which left over feed accumulated over the week, was weighed to determine by difference the
Protein 19.58 15.75
amount of food'consumed by each group. It was possible from the above to determine the
mean feed consumption per bird per week.
Fat 3.47 4.4
Total amount of feed served -Total amount of leftover feed Mean feed consumption =
Average number of birds housed and fed during the week
3.6.2 Feed Conversion Ratio
Fibre 5.03 4.8
It is the ratio of the weight of feed consumed to one unit of weight gain.
- - Feed consumed Feed coversion ratio
weight gained
P .076 0.35
3.6.3 Feed Efficiency
It is the ratio of live-weight gain per unit of feed intake in grams.
Ca 1.02 0.58
Feed Efficiency
M.E.Kcal/kg 2800 2900
Gain =- Feed
3.6.4 Body Weight
Birds from each mating group were weighed first at day-old and then at 4 weekly intervals
subsequently up to 20th weeks, using a mettler D lOOON sensitive scale with a capacity of
1000 grams (lkg) from day-old to 8 weeks and a lOkg capacity "Salter" scale from 9-20
weeks. The birds were weighed individually, and then the mean for each group computed.
3.6.5 Body Weight Gain
The most common way of expressing growth in terms of weight is by absolute gain in weight
per unit time. This can be expressed as average daily gains, average growth rate or rate of
gain (Oparaugo, 1988). The rate of growth was computed thus:
Final weight - Initial weight Average growth rate = -.
Time interval
After obtaining this, a growth curve was plotted for body weight against age to get the growth
curve while plotting live weight changes against time gave the Rate of growth (Rate of gain).
3.6.6 Disease Incidence and Mortality: It was recorded as it occurred.
3.6.7 Age, Body Weight at First Egg and Weight of First Egg
Age was recorded as the time the hens dropped their first egg, after which the egg, and the
hens were weighed to get the weight of the first egg and the body weight at first egg.
3.7 Statistical Analysis I
3.7.1 Descriptive Statistics: Descriptive statistics such as mean @), standard error (S.E), I
coefficient of variation (C.V) and 95% confidence limit were used to describe the parameters
measured.
3.7.2 F- test was used to compare all genotypes simultaneously and Duncan's Multiple
Range Test was used to test for significant differences.
3.7.3 Body weight data of the 3 ecotypes offsprings were compared at day-old and during
subsequent age periods, to obtain differences between ecotypes. This was done by means of a
one-way ANOVA in a completely randomised design (CRD) involving unequal subclass
numbers, as well as the Duncan's Multiple Range Test. The statistical model used was:
Xij = U+ Si+ eij
Where:
Xij= the record of the j th progeny of the ith sire
U = the overall mean
Si = Effect of the ith sire
eij= the uncontrollable environmental and genetic deviations attributable to the
individuals. All effects are random, normal and independent with expectations
equal to zero.
3.7.2 Components of variance and covariance were computed using SPSS (2001)' from
which heritability from Paternal Half Sib and genetic correlation were estimated according to
the procedures outlined by Becker (1992).
CHAPTER FOUR
RESULTS AND DISCUSSION
The results obtained for the parameters measured of the local chicken ecotypes are presented
in the appropriate tables and figures on subsequent pages.
4.1 Fertility
Table 3 shows the fertility percentage of 58.20 % for light chickens, 48.78 % for the heavy
chickens and 36.97 % for the main cross chickens. These values are far less than the 80.6%,
98.0%, 93.0 %, for young flock reported by Kuit et a1 (1986), Andrews (1990), and Singh
(1990), respectively. Age, light, nutrition, mating ratio, semen quality and rate of egg
lkoduction are some of the factors that affect fertility (Austic and Neshmein, 1990). The low
fertility in this work might have resulted from the fact that the parents stock spent most of the
time getting acclimatised to the environment and had a high rate of disease incidence, which
affected the frequency of mating and probably fertilisation.
4.2 Hatchability
Table 3 shows hatchability percentage of 47.89 %, 72.50% and 76.92% for the light, heavy
.and main cross chickens respectively. These values are lower than the 91.0 % hatchability for
young stock observed by Singh (1 WO), but not different from the 4O.l6%, 37.08%, and 65%
obtained by Okeke (2002). The poor values could be attributed to longer holding time of
eggs, sub-normal storage temperature and relative humidity conditions, disease incidence, as
well as fluctuations in temperature during incubation and poor incubator environment.
Obioha (1990) and Jordan and Pattison (1990) reported that the above factors affect
hatchability adversely. Austic and Nesheim (1990) recommended egg holding room
temperature of 65 to 75 OF (18.3"C to 21.1 OC) and 75 % relative humidity. Mack (1978)
reported that the optimum temperatures in which chicken eggs hatch is 95 to 105 OF (35 to
40.5 OC).
4.3 Liveability Rates
From Table 3, liveability percentages of 75 %, 93.33% 60.34% were obtained between 0 to
12 weeks for light, heavy and main cross chickens respectively. Liveability percentages based
on females were 74.58%, 64% and 66.67% were obtained for light, heavy and main cross
chickens respectively. The high mortality recorded was as a result of Newcastle disease and
coccidiosis. This probably was due to the fact that the proper vaccination programmes was
not followed because of scarcity of vaccines and the ones used were not too reliable due to
their storage conditions. The high mortality rate caused by Newcastle disease goes a long
way to confirm the report of Chabeuf (1990) that the most devastating disease of local
chickens is Newcastle disease (Bell et al., 1990; Chrysostome et al., 1995; Yongola, 1996).
Adene (1996) reported that the high rate of mortality of local chickens is as a result of
confinement and bad management during the period of confinement. It is therefore,
reasonable to believe that if local chickens are given optimum veterinary care and good
management at all levels of husbandry, their liveability figures will improve over time.
4.4 Feed Consumption, Feed Efficiency and Feed Conversion Ratio
Mean feed consumption per bird per week is presented on Table 4. There was a tendency for
mean feed consumed per bird per week (g) to be highest for the heavy chickens, followed by
the main cross and then the light chickens throughout the experimental period. Table 5 shows I
the feed efficiency of the light, heavy and main cross chickens at various ages. It was
observed that the mean feed efficiency throughout the experimental period was 0.29 f 0.04, i 0.35 f 0.08, 0.31f0.08 for light, heavy and main cross chickens. Therefore it could be I
koncluded that there was a tendency for the heavy chickens to have had the highest feed
efficiency among the groups. However, the younger birds had a higher feed efficiency than
the older birds. This trend is in accordance with the report of Jurgens (2002) that feed
efficiency is higher for young birds, which reduces, as the birds grew older. Statistically,
there were no significant differences (p>0.05) in the mean feed consumed, and the feed
efficiency for the three groups of birds (Tables 4a and 5a). Though much work has not been
done so far on feed utilisation of the local birds, these values obtained would be expected
since the birds require less feed to maintain their small body size. Therefore, the highest
value obtained for the heavy bird, and the least values for the light bird were expected
possibly because of the difference in body size.
The mean feed conversion ratio of 3.79 + 0.66, 3.63 + 1.002 and 4.69 + 1.48 and
obtained for the light, heavy chickens and main cross (Table 6) were not different from the
3.50 obtained by Obioha (1992). Feed conversion ratio is the opposite of feed efficiency,
which increases, as the birds grow older. These differences (Table 6a) however were not
significant.
Table 3: Fertility (%) and Hatchability (Oh) of Incubated Eggs of light, heavy
chickens and main cross chickens
Light chickens Heavv chickens Main cross chickens Numbers of eggs set 488 164 21 1 Number fertile 284 80 78 Number unfertile 204 84 133 Number hatched 136 5 8 60 Fertility percent 58.20 48.78 37.97 Hatchability percent 47.89 72.50 76.92 Liveability(%) 0-12 weeks, 12-20 weeks 75; 74.58 93.33; 64 60.34; 66.67
Table 4: Mean feed consumed /bird/ week by light, heavy and main cross
chickens
Age (weeks) Light chickens Heavy chickens Main cross chickens 4 210.01 250.01 200.03 8 607.50 700.04 700.01 12 750.30 850.01 800.00 16 850.40 900.06 9 10.00 i
20 950.40 960.08 950.01 Total 3368.3 1 3660.20 3560.05
Table 4a: ,Analysis of variance of mean feed consumed /bird/week by light, heavy
chickens and main cross chickens
Source of variation d.f SS MS Fcal. F tab (5%) F tab (1%) Total 14 Between ecotypes 2 8799.60 4399.8 0.051 3.89 6.93NS Error 12 1026258.86 85521.54
Table 5: Feed efficiency of light, heavy chickens and main cross chickens
Age (weeks) Light chickens Heavy chickens Main cross chickens 4 0.35 0.46 0.50 8 0.42 0.59 12 0.29 0.30 16 0.24 0.28 20 0.16 0.14
Total - 1.46 1.77 Mean 0.29 f 0.04 0.35k 0.08
Table 5a: Analysis of variance of feed efficiency Ibirdlmonth of light, heavy
chickens and main cross chickens
Source of variation d.f SS MS Fcal. F tab (5%) F tab (1%) Total 14 Between ecotypes 2 0.0104 0.0052 0.216 3.89 6.93NS Error 12 0.2884 0.0240
Table 6: Feed conversion ratio of light, heavy chickens and main cross chickens
Age (weeks) Light chickens Heavy chickens Main cross chickens 4 2.85 2.16 1.99 8 2.39 1.69 2.12 12 3.42 3.29 3.1 1 16 4.09 3.60 9.48 20 6.18 7.39 6.79 Total - 18.93 18.13 23.49 Mean 3.79 f 0.66 3.63 + 1.002 4.70 + 1.48
Table 6a: Analysis of variance of feed conversion ratio of light, heavy chickens and
main cross chickens -
Source of variation d.f SS MS Fcal. F tab (5%) F tab (1%) Total 14 Between ecot'ypes 2 3.344 1.672 0.276 3.89 6.93NS Error 12 72.206 6.058
4.5 Body Weight Statistics of the Local Chicken Offspring
The mean (5, standard deviation (S) variance (s2), standard error (S.E), coefficient of
variation (C.V), 95 % confidence interval limit and, minimum and maximum body weights of
. light, heavy chickens and main cross at 0-, 4-, 12-, 16-, and 20- weeks are presented on
Tables 7, 8, 9, 10, 11, and 12 respectively. Generally, the heavy ecotype chickens had the
highest mean body weight followed by main cross chickens and the least, the light chickens
at all ages. Data (Tables 7a, 8a, 9a, 10a, lla,andl2a) reveal that body weight in the three
groups were significantly (pC0.05) different among all ages but at the 2oth week there was a
significant difference between heavy and the other two groups, but no significant difference
(p>0.05) between the main cross and the local chickens. Omeje and Nwosu (1984) showed
that the Gold-link parents weighed heavier than the local chickens. The mean body weight of
the two crossbred groups was about equal to that of the Gold-link but higher than the local
chickens. On the other hand, the heavy ecotypes chicken in this work performed better than
the main cross and the light. The mean body weight of the main cross group even though
different from the heavy bird was higher than the light ecotype chickens. Crossing of the
local chicken with the parent stock of Gold-link was effective in bridging the gap in body
weight between the exotic and the local chickens (Nwosu and Omeje 1984). From this study
it could equally be concluded that crossing the heavy ecotype chickens with the light chicken
was effective in bridging the gap in body weight between the light and heavy ecotype
chickens. The main cross of this experiment were significantly (p<0.01) inferior to the heavy
ecotype due partially to the heterotic or hybrid effect of crossing inherently low yielding
genotypes in the main cross, and due mainly to the maternal influence. The important factor
which may be responsible for the light chickens having the least body weight through out the
experimental period could be gene effect. The below expectation in body weight performance
of the main cross was probably due to maternal and genic effect. It meant that in the main
cross chickens of this study, the expected crossing effect as well as sire influence were
probably absent or were suppressed by the overpowering maternal influence. Hutt (1964)
observed that the original size of the chick was limited completely by the size of the egg shell
in which if was incubated because dams would not "wrap up goods in packages bigger than
they could deliver". This might have been the case with the main cross whose small sized
dam with her small sized egg completely controlled the chick size. The maternal influence in
' main cross chicks as a result of suppression by their mothers small size was apt to clear after
8 weeks of age, which was to correspond with the gradual emergence of paternal inheritance
and the expected hybrid advantage. These effects probably did not take upper hand as was
expected from then onwards to 20 weeks of age because of the disease conditions of these
birds. When the mean body weight of the Gold-link at day-olds, 4-, 8-, 12-, 16-, 20-weeks of
age (30.97 g, 108.73 g, 292.65,660.00 g, 1041.00 g, and 1195.42 g respectively (Nwosu and
Omeje, 1984) are compared with the heavy ecotype chickens at day -old, 4-, 8-, 12-, 16-, and
20- weeks of age (28.06 g, 143.68 g, 561.7 g, 714.00 g, 1066.67 g, and 1196.67 g
respectively), it could be concluded that the heavy local chickens showed superiority at 4-, 8-,
12-, 16-, and 20- weeks of age; and as such should be used for breeding programmes rather
than importing exotic chickens which may require huge financial expenses, and involved
genotype x environment interactions and disease importat ion.
The growth curves presented in Fig. 1 elucidate the picture presented in Tables 7,8,
9,10,11 and 12. The differences between these three groups started after the first week,
widened each month but between the 16- and 20- weeks the light and main cross had little
difference while the gap between the two and the heavy chicken became very conspicuous.
Therefore, both the light and main cross showed marked inferiority to the heavy chickens.
There is little or no previous work reported on the main cross chickens and the heavy
chickens (Tiv) of the montane area of South Eastern Nigeria.
Table 7: Descriptive statistics for body weight for day- old for light, heavy
chickens and main cross chickens
Statistics (Day-old) Light Heavy Main cross chickens chickens chickens
Ecotype mean (g) 21.82' 28.06a 26.30~ Ecotype S Ecotype s2
Minimum 12-weeks body weight 550.00 750.00 650.00 Maximum 12-weeks body weight 600.00 900.00 850.00 a,b,c.. ... Means of a parameter followed by different letter is significantly different at 5%level.
Table 10a: Analysis of variance of ecotype effect on body weight at 12-weeks old
Source of variation d.f SS MS Fcal. Ftab (5%) Ftab (1%) Total 98 Betweenecotypes 2 909088.92 454544.46 295.58 3.07 4.98 Error 96 147628.25 1537.79
Table 11: Descriptive statistics for body weight at 16 weeks for light, heavy chickens and main cross chickens
Statistics (16-weeks) Light chickens Heavy chickens Main cross chickens - - - - -
Ecotype mean (g) 768.85' 1 066.67a 81 1.54~ Ecotype S 46.22 48.79 45.40 Ecotype s2 2136.29 2380.46 2061.16
.. Ecotype S.E. (g) 6.41 12.59 8.90
Ecotype C.V. (%) 4.70 4.57 5.63 Ecotype Number 5 2 15 26 95 % confidence interval-lower bound 755.98 1039.64 793.20 95 % confidence interval -upper bound 781.71 1093.69 829.89 Minimum 16-weeks body weight 650.00 1000.00 700.00 Maximum 16-weeks body weight 850.00 1 150.00 850.00 a,b,c.. ... Means of a parameter followed by different letter is significantly different at 5%level
Table l l a : Analysis of variance of ecotype effect on body weight at 16-weeks old
Source of variation d.f SS MS Fcal. Ftab (5%) Ftab (1%) Total 92 Between ecotypes 2 1043367.3 521683.66 242.27 3.07 4.98 Error 90 193802.56 2153.36
Table 12: Descriptive statistics for body weight at 20 weeks for light, heavy chickens and main cross chickens
Statistics (20-weeks) Light Heavy Main cross chickens chickens chickens
Ecotype C.V. (%) 3.09 6.97 3.80 Ecotype Number 44 15 24 95 % confidence interval: lower bound 922.38 1 150.49 934.75 95 % confidence interval: upper bound 939.89 1242.84 965.25 Minimum 20-weeks body weight 850.00 1000.00 900.00 Maximum 20-weeks body weight 980.00 1250.00 1000.00 a,b,c.. ... Means of a parameter followed by different letter is significantly different at 5%level
Table 12a: Analysis of variance of ecotype effect on body weight at 20-weeks old
Source of variation d.f Total 8 2 Between ecotypes 2 829083.73 41454 1.82 203.49 3 .07 4.98 Error 80 162976.52 2037.2 1
Statistically, however, there are highly significant (P < 0.001) differences in mean
body weight across the ages and genotypes (Tables7a, 8a, 9a, 1 Oa, 1 1 a, and 12a). The genetic
implication of this difference is that since there is a genetic gap between the 3 groups, with
the heavy chickens being significantly heavier, the best option is to continue using the main
cross chickens and back cross with the heavy chickens so as to increase the body size of the
local chickens. Fig 2 is a graphic representation of the trend in body weight gain of the 3
breeding groups. From this figure, it was observed that the rate of body weight gain increased
up to 8 weeks in the 3 groups. This was followed by decline after the 81h week of age to 20 &LC WB'
weeks of age for the main cross and heavy chickens; while the increase of body weight gain Y
continue for the light chickens. The trend observed for the light chickens is in agreement
with the report of Nwosu and Asuquo, (1984). The drop observed after the 81h week for the
main cross and the heavy chickens in this study might have been caused by the out-break of
coccidiosis which attacked the birds. Nwosu, (1979) reported that the local chicken reaches
its point of inflection at 13 weeks. Oluyemi and Oyenuga, (1974), earlier observed this early
'fast growth in the indigenous fowl. This could be advantageous in dual-purpose bird
development in future breeding programmes and genetic improvement of growth through
selection (Okpeku et al., 2003).
As a means of comparing variances of different populations, the coefficient of
variations of the different groups of chickens have been plotted against age (Fig. 3). This is
because variance of some characters especially body weight is known to be under " scale
effect" and as such is dependent upon the mean: when the mean changes, the variance
automatically changes with it, and plotting the variance as the coefficient of variation will
eliminate the scale effect (Falconer, 1989). The light, heavy and main cross chickens fall
under three categories of variability viz: high, middle and least respectively. Nwosu et nl.,
(1984) obtained a high variability for the local chicken while for the main cross (a cross
between Gold- Link and local chickens) had the least variability. The lower variance in the
main cross compared to the parents in this work agrees with the findings of and Nwosu and
Omeje, (1984) which implies that main cross chickens were more uniform, possessing
identical heterozygous genotypes as compared to their more homozygous parental counter
parts, a situation that is in tune with the Mendelian expectation of uniformity of FI
individuals. This variability of the parental is indicative of their coming from a population
that has yet to undergo improvement in body weight.
Fig 1. Mean body wi& ag& age in \;cieel(s
I --t Main cross chickens
+Heavy chickens -
Age (weeks)
Fig. 2: Rate of weight gain against age in weeks
4.6 Age, Body Weight at First Egg and Egg Weight of First Egg
Table 13 shows the age, body weight at first egg and egg weight of first egg. The ages at first
egg were 145 days, 149 days, and 154 days for light, heavy and main cross chickens
respectively. The 145 days for the light chicken fall within the range reported by Akinokum
and Dettmers (1977). According to their report, the average age at first egg for the local
chickens ranges between 127 to 168.7 days. The difference in the age at first egg between
the three groups could be significant in poultry breeding programmes involving the different
ecotypes of local chicken. The average body weights at first egg were 940 g, 1208.33 g, 1050
g and for the light, heavy and main cross chickens. The average body weight at first egg for
the local chickens was in agreement with the range (0.9-1.8kg) reported by Nwosu and
Omeje (1984), Adetayo and Babafunso (2001) and Okpeku (2003) The average egg weight at
first egg were 30.6 g, 35.24 g and31.60 g, for the light, heavy chickens and main cross
respectively. Nwosu and Omeje, (1 984) obtained average weight of first egg as 25.978, There
is no in information literature on age, weight of first egg and body weight at first egg of the
main cross (heavy males and light females) and heavy chickens (Tiv). Egg weight is highly
heritable, and therefore could be manipulated easily by genetic selection, although the genetic
correlation with rate of lay is negative (Austic and Neisheim, 1990). Equally, the genetic
'control of egg weight is highly correlated to body weight, so that selection for egg weight
tends to produce a larger hen and vice versa. Age is a major determinant of egg size in all
fo~ms of poultry. At the onset of lay, egg weight is much smaller than in subsequent weeks.
4.7 Heritability Estimate of Body weight
For a given trait, heritability is the amount of the superiority of the parents above their
conten~poraries, which on the average is passed on to the offspring. Heritability estimate of
body weight derived from sire components of variance are shown on Table 14. The
heritability estimate for the light ecotype chicken was 0.40 f 0.44. This estimate is similar to
0.35 _+ 0.06 obtained between 4 and 20 weeks of age by Nwosu and Asuquo (1 985) and those
reported by Oluyeini and Oyenuga, (1974), Akinokum and Dettmers (1977), and Ebangi and
Ibe (1995). On the other hand heritability estimate for heavy and main cross chickens were
obtained as 0.37f 0.90 and 0.29 f 0.57 respectively. This is probably the first time the body
weight heritability of chickens from the montane area and that of the main cross (heavy males
crossed with light females) has been estimated. A comparison of the heritability estimate of
the main cross and the "pure" parents reveal that body weight is more highly heritable in the
light ecotypes than the main cross and the heavy. Based on these observations it can be said
that the body weight of all the 3 groups is moderately to highly heritable. These estimates
suggest that with mass selection much improvement can be achieved in the three populations.
With these high heritabilities of body weight, flock improvement will be rapid and the
progress in improving future generations will be fast. The magnitude of heritability is
important in choosing the method of selection and breeding plan, in determining the relative
amount of emphasis to be given to each trait when selecting breeding stocks, in determining
the breeding value of individual animals and in the estimation of the rate of progress in a
selection programme.
4.8 Coefficients of simple Correlation.
Table 15 shows the coefficients of simple correlation of some traits for the 3 groups studied.
From this table it can be concluded that there is a positive coi-relation between:
Body weight and feed intake
Body weight and feed conversion ratio
Feed intake and feed conversion ratio
It also shows a negative correlation between
Feed intake and feed efficiency
Feed efficiency and feed conversion ratio
Body weight and feed efficiency for all the 3 groups studied
Positive correlation means that there is favourable association between two traits and
negative correlation indicates an unfavourable association of the traits. The correlation
. coefficient measures the strength and indicates the direction of relationship between two
variables (Falconer, 1989). The coefficient of correlation between body weight and feed
intake was very high (0.96). Ibe (1981) reported 0.976 as coefficient of correlation between
body weight and shank length in broilers. Generally there is little or no information on
coefficients of simple correlation of the parameters studied on local chicken ecotypes.
Table 13: Age, body weight a t first egg and weight of first egg
- Light chickens Heavy chickens Main cross chickens Age at first egg (days)' 145 149 154 Mean body weight at first egg (g) 940 1208.33 1050 Weight of first egg (g) 30.60 35.24 3 1.60
Table 14: Heritability estimates for Body weight of light, heavy and main cross chickens from sire component of variance
Age (weeks) Light chicken Heavy chickens Main cross chickens 4 0.46k0.35 0.25k0.49 0.1 2kO.33 8 0.23k0.29 0.43k0.64 0.26k0.37 12 0.56k0.51 0.2Sf 0.92 0.43k0.80 16 0.53k0.52 0.42k1.26 0.1 8k0.71 20 - 0.23+0.50 0.46k1.21 0.46*0.68 Mean ' 0.40k0.44 0.37k 0.90 0.29k0.57
Table 15: Coefficients of simple correlations of some economic traits of light, heavy and the main cross chickens
Genetic correlation estimates between of body weights at various ages for the three breeding
groups are presented in Table 16. The result shows that most of the genetic correlation
estimates are positive and consistent with reported values in literature (Nwosu and Asuquo,
1985). The differences within groups could be due to differences in genetic effects at the
various stages of growth (Jaap et al, 1962). Negative genetic estimates were obtained in some
cases but this is not consistent with reports of other workers in literature, probably due to
sampling error. Secondly, the positive gene actions at the self- accelerating phases of growth
could possibly explain the positive genetic correlations obtained at the early ages. The
negative genetic correlations could be due to the de-accelerating phase of growth, which was
controlled more by environmental influences rather than the genetic factors (Falconer, 1989).
However, genetic correlation estimates are of more interest to the breeder than either the
phenotypic or environmental correlation values. The genetic correlation and heritability
estimates of a population enable the breeder to predict the future performance of his flock
with some degree of accuracy (Falconer, 1989). This could be advantageous in animals where
selection may be used to increase body weight in the following generations. Mack (1978)
reported that body weight in broilers is closely correlated with the weights of the parents at 8
'weeks of age. From a genetic standpoint, certain quantitative characters have positive genetic I coi-relation, for instance, when selection is made to improve liveability within the line, egg
production also increases (Asuquo, 1984).
CHAPTER FIVE
CONCLUSION AND RECOMMENDATIONS
Native fowls still have a position in the genetic improvement of tropically oriented stock.
Although only small genetic response can be expected in pure breeding, the local fowl
genome will still be usefbl in breeding for special conditions in extensive production systems.
Heritability estimate for the 3 groups show that, on the average, body weight is
moderately heritable. This indicates that appreciable improvement in the trait could be
achieved if the pure parents are individually selected at the age of 12 or 16 weeks. The
performance of an animal in terms of growth rate, feed intake and utilisation depends on the
genetic potentialities of the animal, and the environment. The reported values for the growth
rate are highest for the heavy ecotype chickens followed by the main cross and the light
ecotype at all ages.
The local chickens show a lot of variations in body weight and other growth traits.
With such variability and knowing well that variation is the breeders' tool for animal
improvement genetically, the result indicate that the potentials for the local fowls are yet to
be tapped hence the need to improve them.
The mean mature body weight of 940 g, 1050 g, and 1208.66 g observed for the light,
' main cross and heavy chickens indicate that the local chicken is a small bodied strain when
compared to some exotic chicken breeds (Gold-link) at the same age. A continuous cross of
the heavy males with the light females (main cross) will not be favourable for body size
improvement because the light chickens had the least mean body weight whereas the cross of
light males on heavy males (reciprocal cross) would advantageously elevate the body size of
the light locals towards the heavy ecotype chickens. There is, therefore a real need for genetic
improvement in growth traits for any meaningful and objective economic productivity to be
attained in both the meat and egg producing enterprise.
The local chicken of Nigeria so far presents a great diversity as in its adaptation to
harsh environmental conditions as well as in its performance. This large diversity can serve
as the base for the creation of foundation stock for national poultry industry. A concomitant
improvement of the husbandry and management conditions will result to a net improvement
notably the productivity (egg/meat) of the local fowl and to make in source of cheap and
quality protein.
In view of the fact that native fowls meet a high proportion of total human food
requirement and that it is still an important source of livelihood or income to marginal
farmers, they surely deserve more attention as a genetic reserve, and also as a source for
genetic improvement of breeding stock for tropical locations as well as for unfavourable
environments. These conclusions could be supported by the report of Horst (1988) that the
genetic base of the indigenous chickens in the tropics is rich and should form the basis for
genetic improvement and diversification to produce a breed adapted to the tropics.
Given these potentials and in addition that they are more adapted to the local
prevailing climatic conditions more than the exotic breeds, it is recommended that a new era
of the poultry industry be opened in Nigeria, which should totally be dependent on the
indigenous local stock. The best tool to start with to achieve this objective will be through the
creation of a reasonable baseline population of the local chicken through selection of
indiscrete population of the available local chicken stock. This will facilitate genotype
~ate~orisation and conservation of the native chicken for the national poultry industry. This
should be followed closely by more purposeful and scientific crossbreeding work by
geneticists and breeders to improve on the economic traits and vigour of the local chickens by
the use of tested / proven local chicken ecotypes.
To understand the genotypic and chromosomal characteristics of the local chickens,
detailed cytogenetically research on the indigenous fowls should be undertaken. This will
help in distinguishing the local chicken ecotypes as genetically different and help also in
identifying different breeds or strains of the native birds. Imrnunogenetic studies should also
be carried on the local fowl to understand its genotype with regards to resistance to different
diseases.
From the results of this study, there are indications that crossing the two ecotypes of
local chickens -the light males and the heavy females (reciprocal crosses), reasonable hybrid
vigour could be generated. Future studies should estimate the amount of heterosis involved.
Secondly, studies should assess their nutrient requirements and different types of
management systems.
REFERENCES
Abdou, I. and Bell, J.C (1992). "Dynamique de la volaille villageoise dans la region de Keita au Niger." In: Village Poultry Production in Africa, Proceedings of an International workshop held in Rabat, Morocco, 7-1 1 May 1992: 6-1 1.
Abubakar, M., Ngele, M. B. and Alhaji, M.B. (2003). "Problems of livestock production in Nigeria: A case study of Akko local government area of Gombe State." In:
Proceedings of 281h Annual Conference of Nigeria Society for Animal Production held at Ibadan, 1 61h - 2oth March 2003.
Adetayo, A.S. and Babafunso, S.E. (2001). "Comparison of the performance of Nigerian indigenous chickens from three ago-ecological zones". Livestock Research for Rural Development; 2(13): 2001.
Adene, D.F. (1996). "International poultry health problems: Perspective fiom the poultry Industry in Africa." In: Proceedings, 201h World Poultry Congress, held at New Delhi, India, 1 "- 51h September, 1996; 2: 401 - 41 4.
Akinokum, 0. and Dettmers, A. (1977). "Comparison of the Ife breed of the indigenouschicken of Nigeria with an exotic strain, body weight and sexual maturity." In: Proceedings, 41h Annual Conference of Nigeria Society for Animal Production, Ile- Ife, 2oth - 241h March 1977.
Jmdrews, P. (1990). "Rural poultry development in the Gambia." In: Proceedings, CTA seminar on small holder rural poultry production, Thessaloniki, Greece, 9' - 13 '~ October, 1990; 2: 81 - 85.
Assan, B. E. (1990). "L'615vage villageois de la volaille en Republique du Benin: Situation actuelle". In: Proceedings, CTA Seminar, volume 2, small holder rural poultry production, Thessaloniki, Greece: 17-26.
Asuquo, B.0.(1984). "Improvement of the local chicken through cross breeding and nutrition." PhD Thesis, University of Nigeria Nsukka, Nigeria.
Austic, R.E and Nesheim, M.C. (1990). Poultry production, 131h Edition, Lea and Febiger, Philadephia, London: 19.
Becker, W.A. (1992). Manual of Quantitative Genetics. 5th edition Students Book Corporation, Pullman, Washington. : 41-52.
Bell, J. G., Kane, M. and Le Jan, C. (1990). An investigation of the disease status of village poultry in Mauritania, preventive veterinary medicine; 8(4): 291 - 294.
Bembridge, T.J. (1988). "Impact of maise extension program in Transkei, South Africa." Journal of Agricultural Extension; 17: 22 - 28.
Bourzat, D. and Saunders, M. (1990). "Improvement of traditional methods of poultry production in Burkina Faso." In: Proceedings, CTA seminar; 3rd International symposium on poultry production in hot climate, Hameh, Germany, 1 21h June 1987.
REFERENCES
Abdou, I. and Bell, J.C (1992). "Dynamique de la volaille villageoise dans la region de Keita au Niger." In: Village Poultry Production in Africa, Proceedings of an International workshop held in Rabat, Morocco, 7- 1 1 May 1992: 6- 1 1.
Abubakar, M., Ngele, M. B. and Alhaji, M.B. (2003). "Problems of livestock production in Nigeria: A case study of Akko local government area of Gombe State." In:
Proceedings of 281h Annual Conference of Nigeria Society for Animal Production held at Ibadan, - 20'" March 2003.
Adetayo, A.S. and Babafunso, S.E. (2001). "Comparison of the performance of Nigerian indigenous chickens from three agro-ecological zones". Livestock Research for Rural Development; 2(13): 200 1.
Adene, D.F. (1996). "International poultry health problems: Perspective from the poultry Industry in Africa." In: Proceedings, 20"' World Poultry Congress, held at New Delhi, India, 1"- 5'" September, 1996; 2: 401 - 414.
Akinokum, 0. and Dettmers, A. (1977). "Comparison of the Ife breed of the indigenouschicken of Nigeria with an exotic strain, body weight and sexual maturity." In: Proceedings, 4'" Annual Conference of Nigeria Society for Animal Production, Ile- Ife, 20'" - 24'" March 1977.
Andrews, P. (1990). "Rural poultry development in the Gambia." In: Proceedings, CTA seminar on small holder rural poultry production, Thessaloniki, Greece, 9th - 13'"" October, 1990; 2: 81 - 85.
Assan, B. E. (1990). "L'klevage villageois de la volaille en Republique du Benin: Situation actuelle". In: Proceedings, CTA Seminar, volume 2, small holder rural poultry production, Thessaloniki, Greece: 17-26.
Asuquo, B.0.(1984). "Improvement of the cross breeding and nutrition." PhD Thesis, University
Austic, R.E and Nesheim, M.C. (1990); Lea and Febiger, Philadephia, London: 19.
Becker, W.A. (1992). Manual of Quantitative Genetics. 5th edition Students Book Corporation, Pullman, Washington. : 41 -52.
Bell, J. G., Kane, M. and Le Jan, C. (1990). An investigation of the disease status of village poultry in Mauritania, preventive veterinary medicine; 8(4): 291 - 294.
Bembridge, T.J. (1988). "Impact of maise extension program in Transltei, South Africa." Journal of Agricultural Extension; 17: 22 - 28.
Bourzat, D. and Saunders, M. (1990). "Improvement of traditional methods of poultry production in Burkina Faso." In: Proceedings, CTA seminar; 3rd International symposium on poultry production in hot climate, Hameh, Germany, 121h June 1987.
Branckaert, R.D.S. (1992). Constrains in poultry development feed availability and health. In: Proceedings, 1 9 ' ~ World poultry congress, Amsterdam, The Netherlands, 2oth - 24th September, 1992; 2:655 - 661.
Cairns, R.E. and Lea, J.D. (1990). An agricultural survey of the subsistence farmers in the Nkandla district of Kwazulu development organisation, Southern Africa; 7(1): 77 - 104.
Chaheuf, N. (1990). Diseases prevention in smallholder village poultry production in Afiica. In : Proceedings, 6th CTA seminar on small-holder rural poultry production. Thessalonica, Greece, 9th - 1 3th 0ctober 1990; 1 : 129 - 137.
Chale, F. and Carloni, A.S. (1982). Nutrition and rural poultry and rabbit production projects. Food and nutrition, (FAO); 8(2): 26 - 3 1.
, Chambers, J. R., Bernon, D.E. and Gavora, J.S. (1984). Synthesis and parameters of new populations of meat-type chickens. Theor. Appl. Genet; 69: 22 - 30.
Chrysostome, C.A.A.M., Bell, J.G., Demey, F. and Verhulst, A. (1995). Seroprevalences of three diseases in village chickens in Benin. Preventative Veterinary Medicine; 22(4): 257 - 261.
Collier, P., Radwan, S., Wangwe,S. and Wagner, A. (1986). Labour and poverty in rural Tanzania. In: Ujamaa and rural development in the United Republic of Tanzania, Oxford, United Kingdom, Oxford University Press: 143.
Crawford, R.D. (1993). Development in Animal and Veterinary Science, Poultry Breeding and Genetics. Elsevier Science Publishers, B.V.: 701 - 703.
Creevey, L. E. (1991). Supporting small-scale enterprise for women farmers in the Sahel. Journal of International Development; 3(4): 355 - 386.
Ebangi, L.A., and Ibe, S.N. (1994). Heritability of growth trait in local chickens at six weeks in Nigeria. Revue. Elev. Med. Vet. Pays Trop.; 47(2): 238 - 240.
Egbunike, G.N. (2002). Effects of crude inhibin on the attainment of puberty and ovarian activities in layers in the humid tropics. In: Book of proceedings, 7th annual conference of Animal Science Association of Nigeria, University of Agriculture Abeokuta. September 1 6 ~ ~ - 1 9th 2002.
El-ibiary, H.M. and Shaffier, C.S. (195 1). The genetic effects of induced hypothyroidism on the genetics of growth in the chickens. Poultry Sci.; 30: 435 - 444.
Ensminger, M.E. (1969). Animal Science, 6th ed. The interstate printer and publishers, Inc. Danville, Illinois.
Falconer, D.S. (1 989). Introduction to Quantitative Genetics. 3rd edition, Longrnan, London, New York: 160 - 174.
FAO, (1982). Report on the expert consultation on rural poultry and rabbit production. Animal production and health division, Publ. No. 226521. Rome
Branckaert, R.D.S. (1992). Constrains in poultry development feed availability and health. In: Proceedings, 1 91h World poultry congress, Amsterdam, The Netherlands, 2oth - 24'h September, 1992; 2:655 - 66 1.
Cairns, R.E. and Lea, J.D. (1990). An agricultural survey of the subsistence farmers in the Nkandla district of Kwazulu development organisation, Southern Africa; 7(1): 77 - 104.
Chaheuf, N. (1 990). Diseases prevention in snlallholder village poultry production in Africa. In : Proceedings, 6"' CTA seminar on small-holder rural poultry production. Thessalonica, Greece, 9"' - 1 31h 0ctober 1990; 1 : 129 - 137.
Chale, F. and Carloni, A.S. (1982). Nutrition and rural poultry and rabbit production projects. Food and nutrition, (FAO); 8(2): 26 - 31.
Chambers, J. R., Bernon, D.E. and Gavora, J.S. (1984). Synthesis and parameters of new populations of meat-type chickens. Theor. Appl. Genet; 69: 22 - 30.
Chrysostome, C.A.A.M., Bell, J.G., Demey, F. and Verhulst, A. (1995). Seroprevalences of three diseases in village chickens in Benin. Preventative Veterinary Medicine; 22(4): 257 - 261.
Collier, P., Radwan, S., Wangwe,S. and Wagner, A. (1986). Labour and poverty in rural Tanzania. In: Ujamaa and rural developn~ent in the United Republic of Tanzania, Oxford, United Kingdom, Oxford University Press: 143.
Crawford, R.D. (1993). Development in Animal and Veterinary Science, Poultry Breeding and Genetics. Elsevier Science Publishers, B.V.: 701 - 703.
Creevey, L. E. (1991). Supporting small-scale enterprise for women farmers in the Sahel. Journal of International Development; 3(4): 355 - 386.
Ebangi, L.A., and Ibe, S.N. (1994). Heritability of growth trait in local chickens at six weeks in Nigeria. Revue. Elev. Med. Vet. Pays Tsop.; 47(2): 238 - 240.
Egbunike, G.N. (2002). Effects of crude inhibin on the attainment of puberty and ovarian activities in layers in the humid tropics. In: Book of proceedings, 7'" annual conference of Animal Science Association of Nigeria, University of Agriculture Abeokuta. September 16'" - 1 9Ih 2002.
El-ibiary, H.M. and Shaffner, C.S. (1 95 1). The genetic effects of induced hypothyroidism on the genetics of growth in the chickens. Poultry Sci.; 30: 435 - 444.
Ensminger, M.E. (1969). Animal Science, 6'" ed. The interstate printer and publishers, Inc. Danville, Illinois.
Falconer, D.S. (1 989). Introduction to Quantitative Genetics. 3rd edition, Longman, London, New Yorlc 160 - 174.
FAO, (1982). Report on the expert consultation on rural poultry and rabbit production. Animal production and health division, Publ. No. 226521. Rome
FAO, (1 987). Report on the expert cons~~ltation on rural poultry development in Asia, Dhaka, Bangladesh, 23 -28 March 1987, Animal production and health division, Publ. No. 27441 5 Rome.
FAO, (1991) Epidemiology, diagnosis and control of poultry parasites. Food and Agricultural Organisation, Animal health manual. The Royal Veterinary and Agricultural University, Copenhagen, Denmark: 1 - 4.
FDLPCS, (1992). Nigerian livestock resources; 12. National synthesis, Federal department of livestock and pest control services, Abuja, Nigeria.
Fisher , R.A.(1918). The correlations between relatives on the supposition of Mendelian inheritance. Trans. roy. Soc. Edinb, 52:399-433
Friars, G.W. (1984). Relationship among growth carcass composition and feed utilisation in broilers. In: Proceedings, 33rd National breeders Round table, Saint Louis, Missouri.
Gittinger, G.P., Leslie, J. and Hoisington, C. (1987). "Women in African food production and food security". In: Gittinger, G.P., Leslie, J. and Hosington, C. (eds) Food policy integrating supply distribution and consumption, Baltimore, Maryland, U.S.A., Johns Hopkin llniversity press: 133 - 141. i
Goodman, B.L., and Godfi-ey, G.F. (1 956). "Heritability of body weight in domestic fowl." , 1 I
Poultry Sci.; 35: 50 - 53.
Hill, D.H., and Modebe, A.N.A. (1961). Poultry production at university college, Ibadan 1950 - 1958, Tech. Bull. (2): Faculty of agriculture, U. C. Ibadan.
Horst, P. (1 988). Native fowl as a reservoir for genomes and major genes with direct and indirect effects on production adaptability. In: Proceedings, 1 8Ih World poultry congress, Nagofa, Japan, 4 - 9 September 1988: 105.
Horst, P., and Mathur, P.K. (1 992). Trends in economic values of selection traits for local egg production. In: Proceedings, 19"' World poultry congress, Amsterdam, The Netherlands, 24"' - 24"' September 1992; 2: 577 - 583.
Hutt,F.B.(1964). Animal Genetics. Ronald Press Co; New York.pp.260-3 14
Ibe, S.N., (1981). A genetic analysis of poultry breeding program. Ph.D Thesis, submitted to the University of Wisconsin, USA
Ibe, S.N. (1990). "Utilising local poultry gene resources in Nigeria." In: Proceedings, 4Ih World Congress on genetics applied to livestock production. Edinburgh and London.
Ibrahim, U.I., El-Yuguda, A.D. and Tambari, P.S. (2000). " Traits of feed base New castle disease." Lasota "Vaccine in chickens using feeds as vaccine vehicles " Nigerian Journal of Experimental and Applied Biology; l(20).
Ihemelandu, E.C., Nwosu, C.C. and lbe, C.G. (1985). "Comparison of muscle and bone growth in Nigeria and Gold-link chickens." Trop. Vet; 1: 226 - 233.
Jaap, R.G., Smith, J.H. and Goodman, B.L. (1962). A genetic analysis of growth and egg production in meat-type chicken. Poult. Sci.41: 1439-1446
Jordan, F.Y.W. and Pattison, M. (1990). Poultry Diseases. W.B. Saunders company Ltd, London, Tokyo: 1,507,510.
Kane, M. and Le Jan, C. (19900. An investigation of the disease status of village poultry in Mauritani~, Preventive Votorinnry Medicine; 8(4): 291 - 294.
Kempthorne, 0 , and Tandom, O.B. (1953). The estimation of Heritability by regression of offspring on parents Biometrics.
Kinney Jr., T.B. (1969). A summary of reported estimates of heritabilities and gel~ctioc phenotypic correlations for traits of chickens. Agricultural Handbpok No. 363. ARSUDA: 49.
Kitalyi, A.Y. (1996). "Socio-economic aspects of villagc chicken production in Africa: thc role of women, children and non-goverizmental organisations." In: Proceedings 20"' World's Poultry Congress, New Delhi, India; 1: 35-45.
Kuit, H.G., Traore, A. AND Wilson, R.T. (1986). Livestock production in ccntral Mali: Ownership, management and productivity of poultry in traditional scctor. Tropical
. Animal Health and Production; 18: 222 - 23 1.
Lerner, I. M., Asmundson, U S . and Cruden, D.M. (1950). The iinprovcmcnt of new Hampshire fryers. Poultry Sci.; 26: 51 5 - 524.
Lul, S.A. (1990). "Smallholder rural poultry production in the Somalia Dcinocratic Republic". In: CTA Seminar Proceedings on, Sinallholder Rural Poultry Production, Thessaloniki, Greece; 2: 207-214.
Mathur, P.K., El-Hmmady, H. and Sharara, H. (1989). Specific use of high yiclding strains carrying major genes for improving perfom~ance of local fowl of tropics (Casc study: Uer, Egypt), A paper presented at the 4Ih DLG synlposiuin on po~~ltry protluction i n hot climate, 18' - 21'' Junc. I-Iarncln, Germany.
Mshelia, J.L. and Abubakar B.Y. (1997). "Possibility of genetic iniprovcriicnt of the Indigenous chicken in Nigeria". Review. Nig. Soc for Animal Prod. 22"" Annual
I
Conference Bauchi 23-27"' March 1997: 121.
Mokotlo, J.L. (1990). Supply, demand and marketing of principal food grains in Lesotho. Food security policies in SADCC regions. In: Rukuni, M., Mudimu, G, and Jnyvnc, T.S. (eds.). In: Proceedin~s 51h annual conference on food security research in Southern Africa, 1 61h - 1 8Ih october, 1989: 204.
Ngere, L.O. (1975). The improvement of livestock production in Nigeria Llirougli brcctling. Nigcria Journal of Animal Production; 2: 10- 15.
Ngou Ngoupayou, J.D. (1995). "The role of smalll~olders in poullry produclion in Cameroon". ANRDD Newsletter; 5: 3-4.
Njike, M.C. (2001). Poultry production as a tool for poverty alleviation in Nigeria. Aninlal Science Associatiuon of Nigeria (ASAN) conference, Maiduguri, 17"' - 19"' Scy7t, 2001: 8.
Njue, S.W., Kasiiti, J.L., Machria, M.J., Gacheni, S.J. and Mbugua, H.C.W. (2002). I-Ieallh and management improvement of family poultry production in Africa. A survey result from Kenya. Result of a FA01 IAEA co-ordinated research program. Anitnal Production and Health section: 39.
North, M. 0 (1978). Commercial Chicken Production Manual. The Avi publishing Company, Inc. West Port, Connecticut : 1.
.. Nwosu, C.C. (1979). "Characterisation of local chicken of Nigeria and its potential for egg and meat production." In: Proceedings, 1" National Seminar on Poultry Production in Nigeria. Zaria: 187-2 10.
Nwosu, C.C. (2002). Lecture notes on applied animal breeding, Universily of Nigeria, Nsukka: 24 - 28.
Nwosu, C.C. and Asuquo, B.0 (1985). "Heritability estimates of body weight in local chickens". In: Proceedings, 9Ih Annual Conference on Self-Sufficiency in Aninial
, protein supplies under changing econonlic fortunes. University of Nigeria, Nsukka
. Nwosu, C.C: and Omeje, S.S. (1984). Improved animal health production from Nigeria local chicken by Gold-link F1 cross progeny. In: Proceedings, 171h World poultry congress, Helsinki : 8Ih - 1 21h August, 1984.
Nwosu, C.C., Obioha, F.C., Omeje, S.S., Gowen, F.A., Bellonwu, C.T. and Ouora, G.E. (1984). Growth performance of local and Shaver Star Cross chickens undcr dccp lillcr system of management. World. Rev. Anim. Prod; 20(2): 17 - 26.
Nwosu, C.C., Gowen, F.A., Obioha, F.C., Akpan, E.A. and Onuora, G.I. (1985). A biometrical study of the conformation of the nake chicken. Nigeria Journal of Animal Production; 12(12): 141 -146.
Obioha, F.C. (1992). A guide to Poultry Production in the Tropics. Longman p 4 1-70
' Obioha, F.C., Nwosu, C.C., Gowen, F.A., Etim, D.B., Obanu, Z., Iliemelandu, E. and
Onuora, G.I. (1983). "Comparative meat yield and anthropometric indiccs of thc Nigerian chicken and an exotic strain." World Rev. h i m . Prod; 19(1): 59 - 64.
Okeke, B.I. (2002) "Raising local chickens through conventional techniques and moniloring their growth rate to 10 weeks". B. Agric. Thesis, University ofNigcria, Nsukka: 20.
Okpeku, M., Orheruata, M. and Imunorin, I.G. (2003). Phcnotype, genetic variation among local chickens in Edo State ofNigeria. Jouriial Socicty of Animal Production; 28: 1 19.
Oluyemi, J.A and Oyenuga, V. A. (1974). "Evaluation of the Nigerian Indigenous Fowl". ls t World Congress on Genetics Applied to livestock Production held in Madrid. Spain from 7-1 1"' October 1974. vol 111 (ed.): 1 187- 1 189.
Oluyemi, J.A., Adene, D.F. and Ladoge, G.O. (1979). "A comparison of the Nigerian indigenous fowl with white rock under conditions of disease and nutritional stress." Tropical Animal Health Production; 1 l(4): 199 - 202.
Oluyemi, J.A. and Roberts, F.A. (2000). Poultry production in warm wet climate. 2'ld Edition.Published by Spectrum Books Limited, Ibadan, Nigeria: 244.
Omeje, S.S.I. and Nwosu, C.C. (1982). Heterosis of early growth in crosses between Gold- link parents stocks and local chickens of Bigeria. In: Proceedings, 2" World congress on Genetics Applied to livestock production, Madrid; 8 (6e): 847 -852.
0rne,e, S.S.I. and Nwosu, C.C. (1984). Heterosis and superiority in body weight and feed efficiency evaluation of exotic parent stock by local chicken F1 crossbreeds. Nigerian journal of Genetics; 5: 1 1 - 26.
Ouandaogo, Z. C. (1 990). Programme de developpement des animaux villageoise (PDAV). In Proceedings,CTA Seminar on smallholder Rural Poultry Production, Thessaloniki, Greece, 9'h-l 3th October 1990.Vol. 2, P.29-36
Oparaugo, D.A (1 988). "The Growth Rates of three types of so-called vedette Broilers-White, Black and Brown". (Unpublished)
~ y h , R.A.E. and Nicholls, P.J. (1979). Selection for food conversion in broilers: direct and correlated responses to selection for body weight gain, food consumption and food conversion ratio. Brit. Poultry Sci.; 20: 73 - 86.
Renkema, J.A. (1992). "Economic aspects of nutrition in relation to environment and product quality of eggs and broilers". In: Proceedings, 1 9 ' ~ World poultry congress, Amsterdam, The Netherlands, 20"' - 24"' September, 1992; 2: 465 - 471.
Roberts, J.A. and Gunaeratne, S.P. (1992). "The scavenging feed resource base for village chickens in a developing country". In: Proceedings, 1 9 ' ~ World poultry congress, Amsterdam, The Nertherlands, 20Ih - 24th September, 1992; 1: 822 - 825.
Salalaoh, A.C.L. (1997). "Characteristics of indigenous chickens of Malawi". Animal Genetic Resources Infornation; 22: 6 1 - 69.
Sall, B, (1990). "Contribution a l'etude des possibilities d'amklioration de la production en agriculture traditionnelles: mesure du potentielle de la race lacalle et des produit d'un croisement ameliorateur ". Travail de fin d'etudes d'Igenieur Agronome, INDR, Thies, Senegal.
Sasimowski, E. (1987). Animal breeding and production (Developments in animal and veterinary sciences). Translation of 2 arys Szezegolowe, hodowlizier gat bugfts 54 by Magdalene Bichnich from the polish edition. PWN-Polish Scientific Publishes Warszawa: 14- l 7 & 124- 125.
A1qxmdis S: ( 'a lculat ions 011 I lcsitabilily ol'ninin cross chickens (12-wecks)
I F F - I MS - ems
:. (11 ?.s) L- 0:lO i 0.08 Alywntlix I 1 : ('illculalions o n Ilcrilability of hcnvp chickens (4-wccks)
A~I)L'IK!~X 12: ( ' ; \ I C ~ I I ~ ~ I ~ O I ~ S on I lcritability ol'henvy chiclicns (8-wcclis)
Appc~dis I ? : ( ';llculi\~ion~ on I Icr-ilabilily of heavy chickens (12-weeks)
1 I
&\,\.\. = -L---- -- C'.F - 10020000- C:,F = 15833.33 t r i .
:. (h ' s )= 0.28 1 0.02 ill qw~idis 14: C'illculahns on I leritahility of heavy chickens ( 1 6- weeks)
a's = 255.7 1
.\ppcntlis 28: ('ocl'licicut of' corrclntiotr b c t w c c ~ ~ body weight awl f'cctl c o l ~ v c r s i o ~ ~ ratio ot' tllc 11c;ir~y chickcns - - .. - .L. - . . - -- - - --
klca~i .- Ootly .. - - - wig111 - - (s) - . - - T r e e d conversion ralio - - (y)
i)ppcnclix 29: ('hefficicat of corrclntio~~ I ) e t ~ v e c ~ ~ body weight :mi f'ccd cfficicncy of (Ilc
Appendis 3 1 : ('ocflicicats of correlation between feed conversion ratio and feed
I)iSi'crcncus bctwecn grol~ps are not significant
Appc'11dis.34: 1;cctl c ' o ~ ~ s l ~ ~ ~ l l ) t i o ~ ~ l l ) i r t l / ~ ~ c ~ c l < ......... of tlic 3 groups .... ......
Age (wucl.;) j 1..igl~l iiiickins Ilea\/y chickens Main cross chickens ----
1)il'fkl.cnccs I~clwccn groups arc not significant
,Ippwdi\: 30: 1;cctl convcl-sion ratio for t l ~ c 3 g r o u p - .- - .7 - - -- - - - .- - /-Age ( u C C ~ ) ( I .ipllt chickcris I 1 Iwvy chickens mz cross T i x . 1
ESI'IMATION OF GENETIC CORIIEIATION
Ap~cndis : 38 rc; 0 f4 - \vcelis alltl 1 2 - \ \ r ~ ~ k ~ -- -- - - .. - - - - SV 1- 1 ti.1' I SCI' I MCP !
,\1)1)~'11(lis: 40 I-(; of 4- we l t s awl 20-\veel<s I)od wei@t for light c l~ icke~is -- . ~.


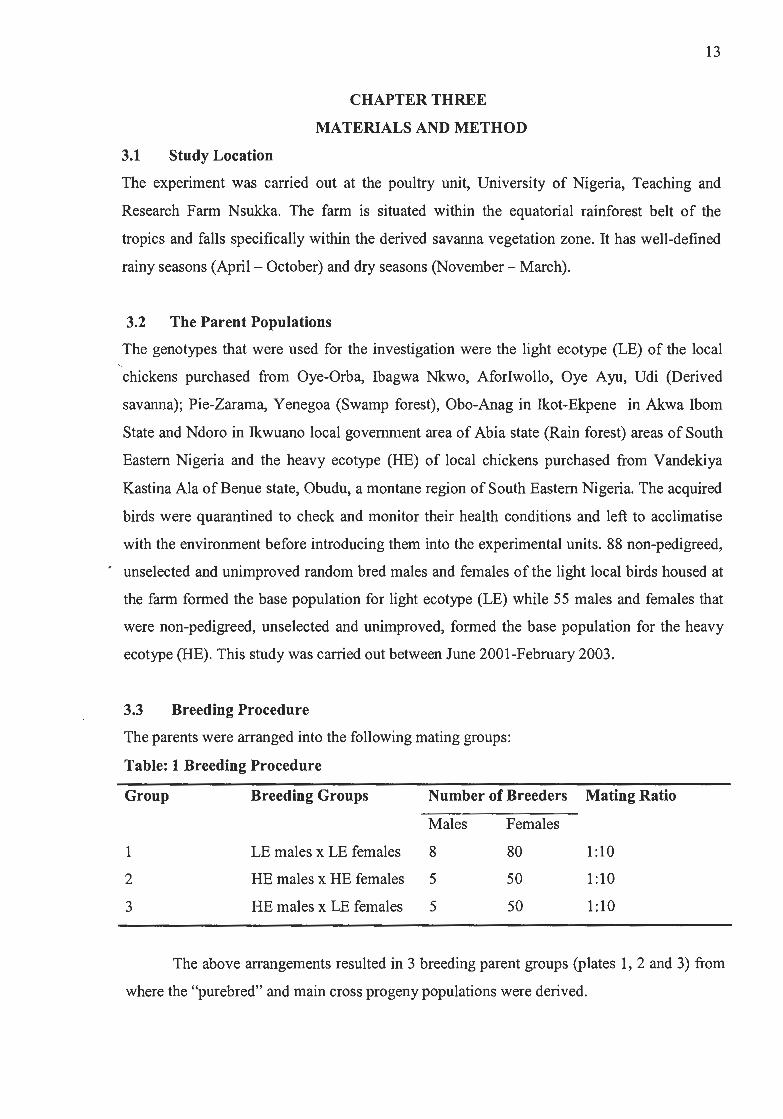


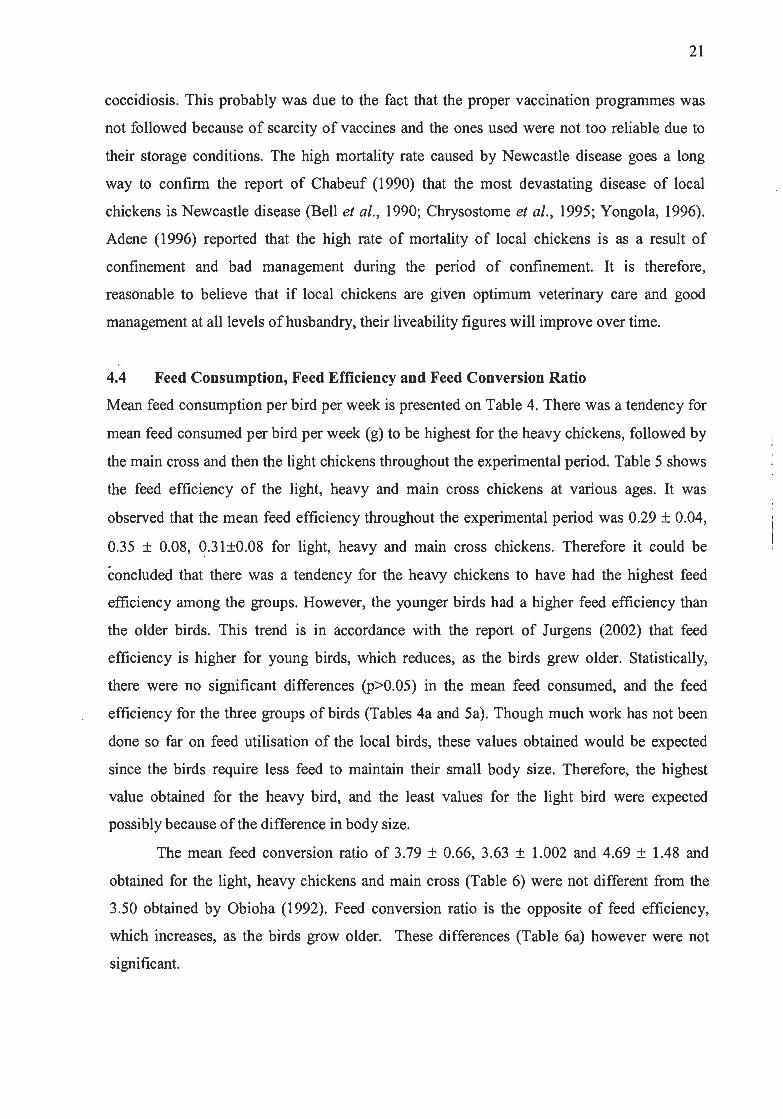
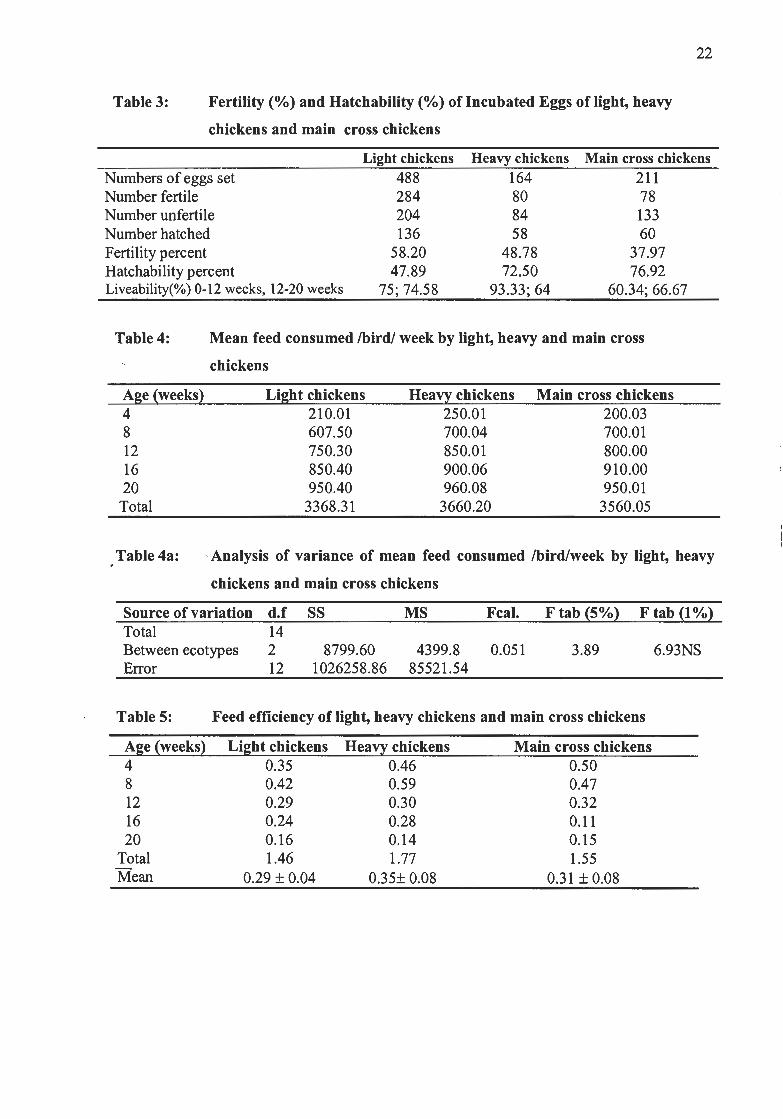


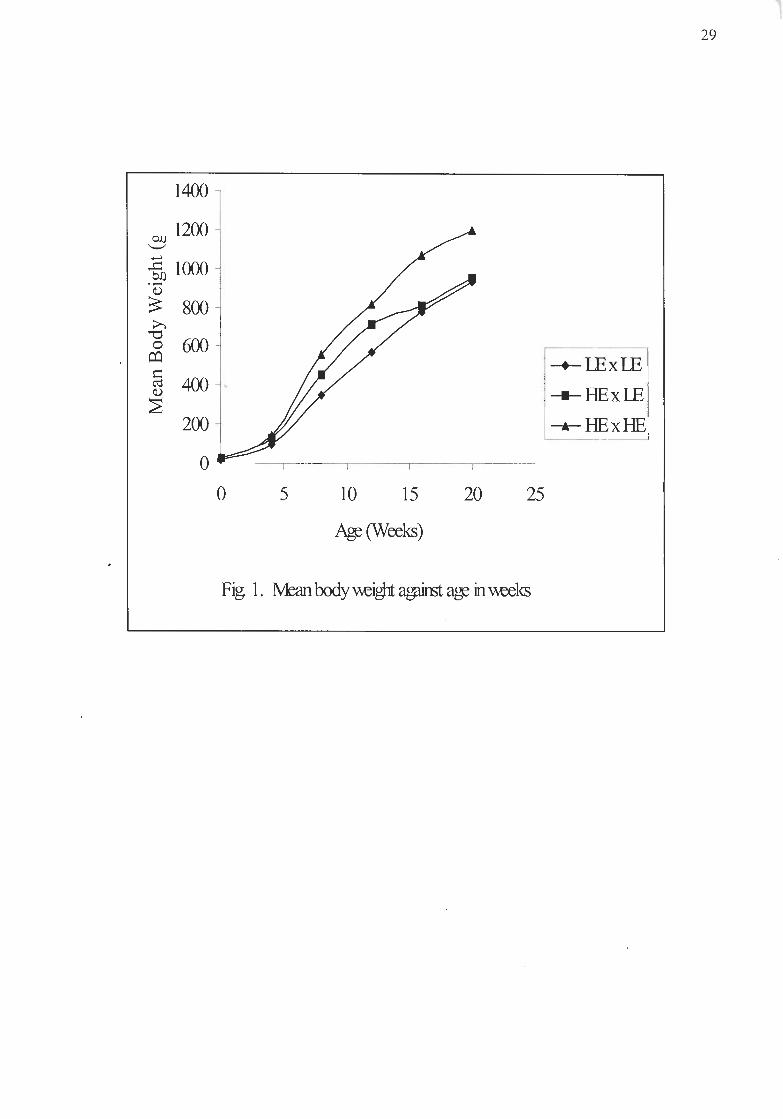
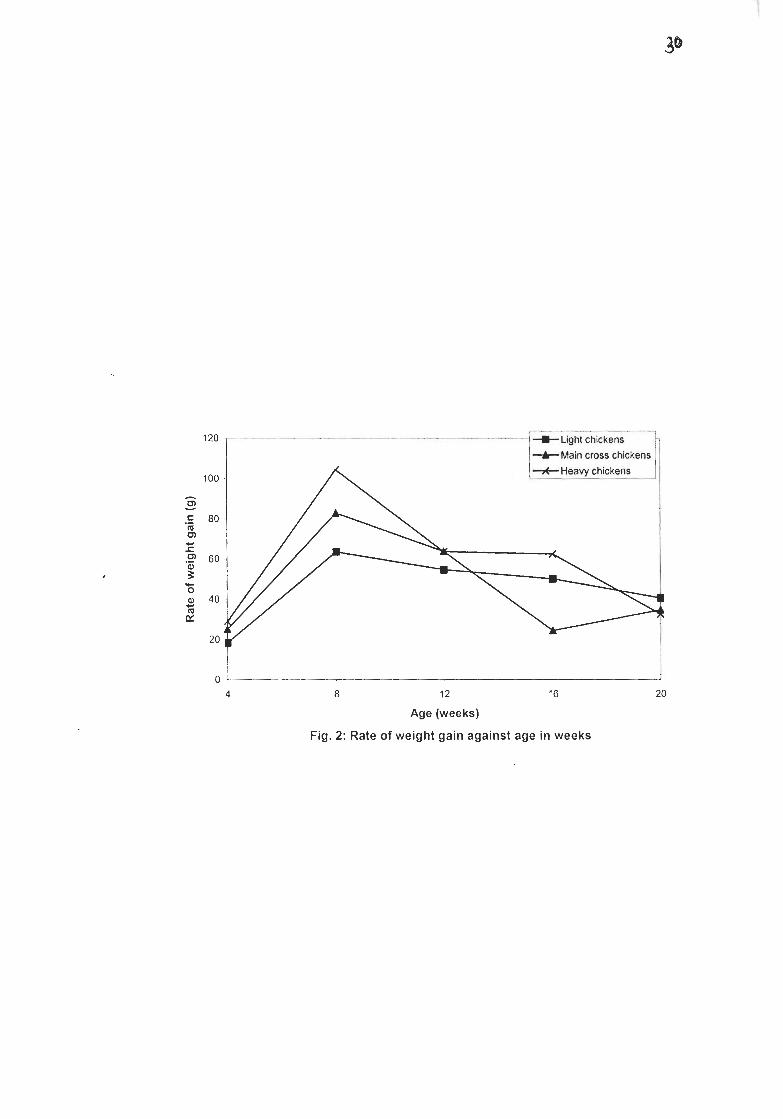


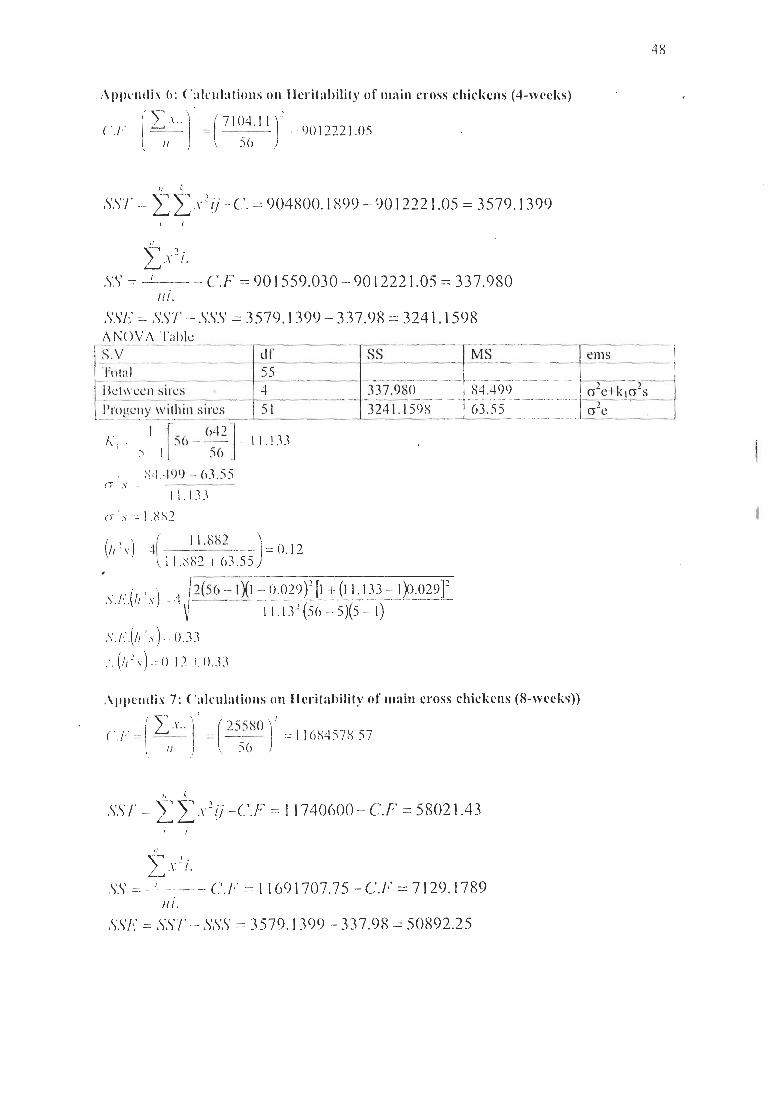

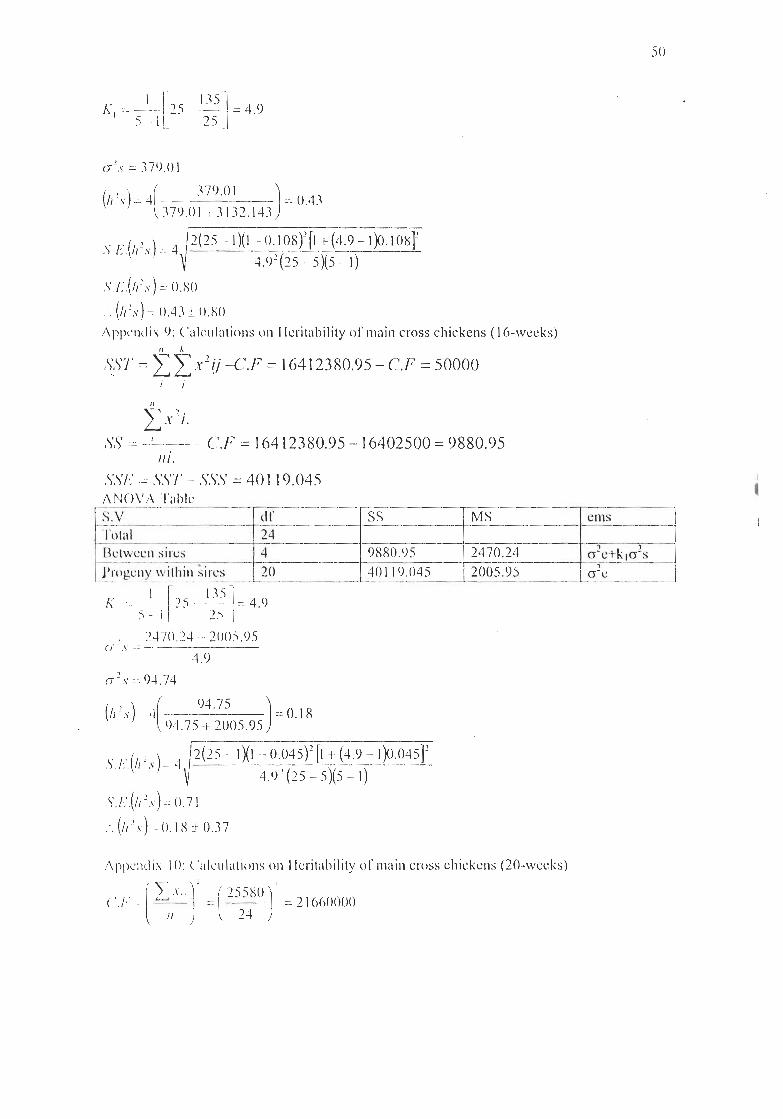

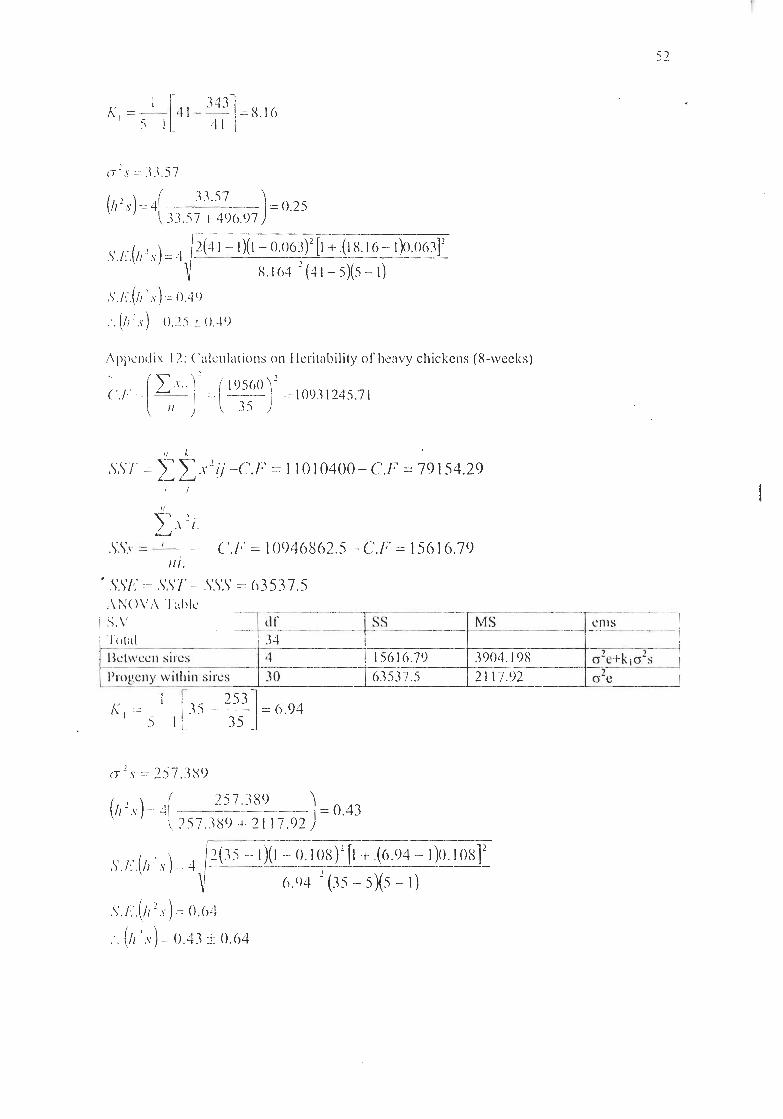


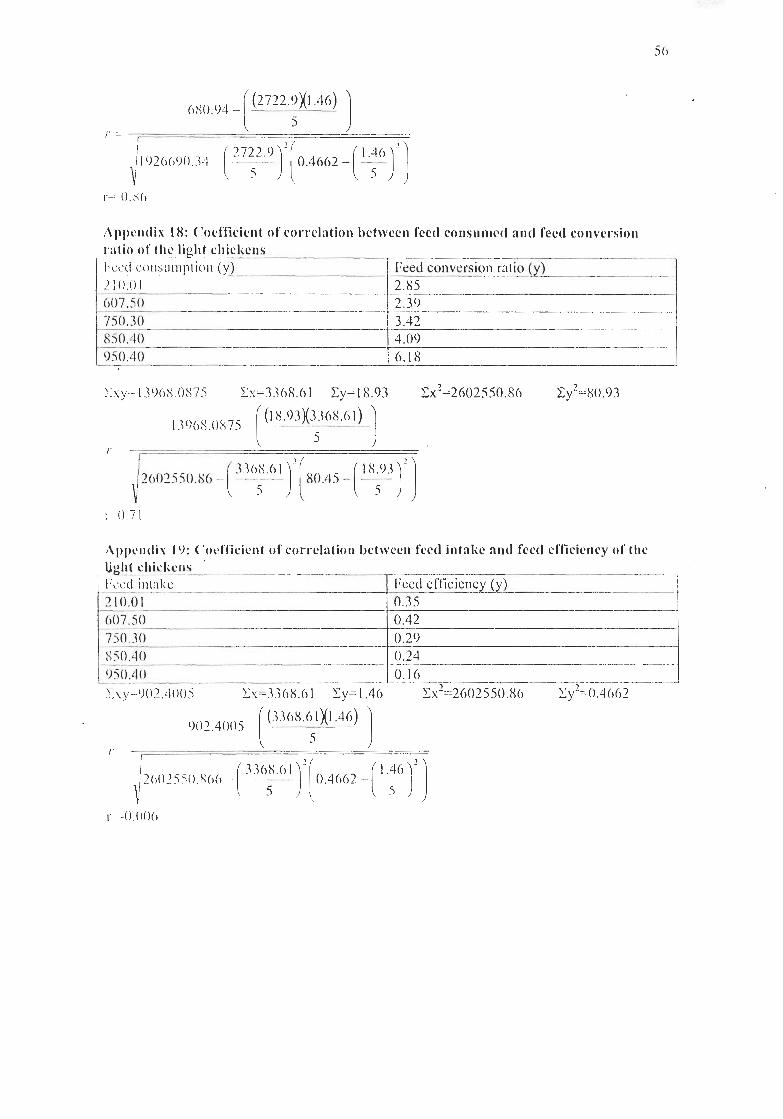


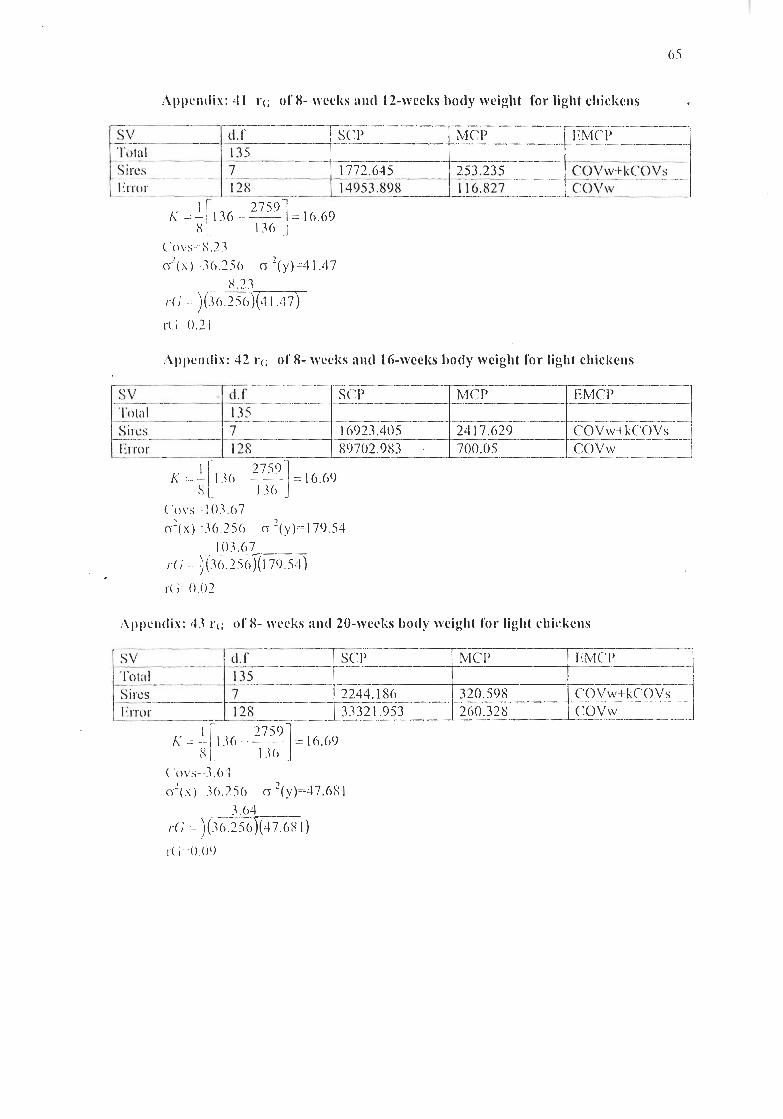


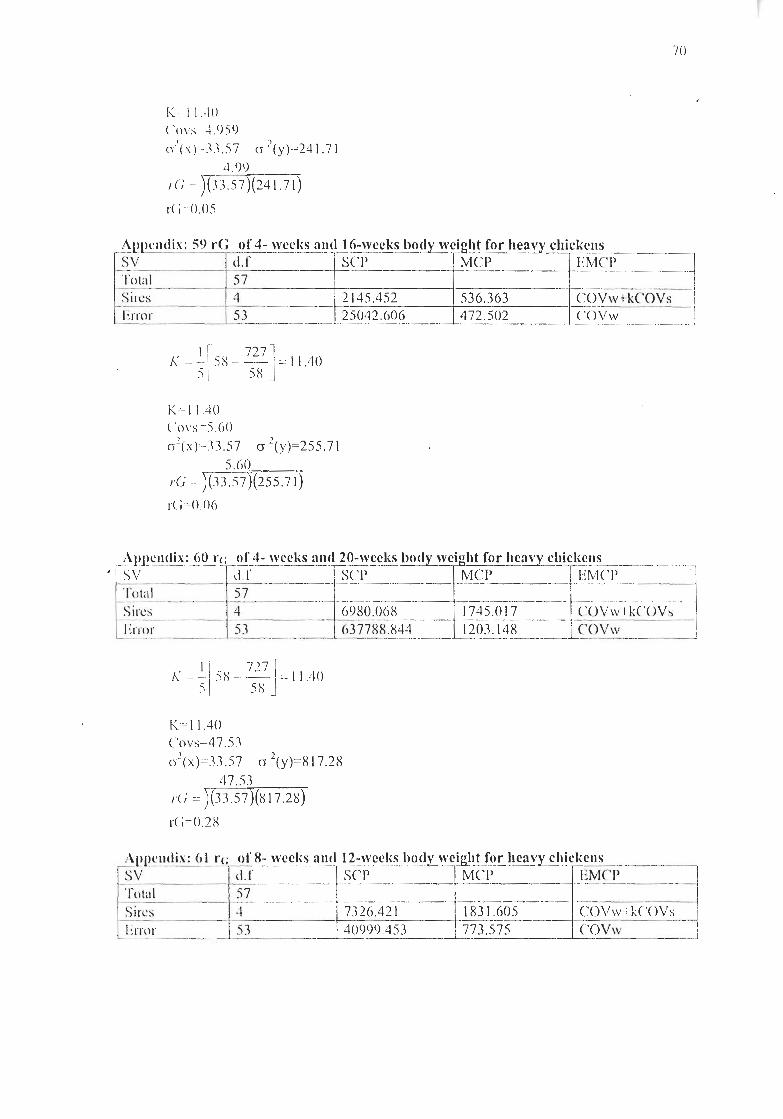


![Comparative Analysis of Arabidopsis Ecotypes Reveals a · Comparative Analysis of Arabidopsis Ecotypes Reveals a Role for Brassinosteroids in Root Hydrotropism1[OPEN] Rui Miao,a,2](https://static.documents.pub/doc/80x56/5fd77669ed73d6608c569009/comparative-analysis-of-arabidopsis-ecotypes-reveals-a-comparative-analysis-of-arabidopsis.jpg)


