Internal Control Quality and Credit Default Swap Spreads * Dragon Tang † The University of Hong Kong Feng Tian ‡ The University of Hong Kong Hong Yan § University of South Carolina and Shanghai Advanced Institute of Finance January 2014 * We thank John Abernathy, Gary Biddle, Konan Chan, Mark DeFond, Fei Du, Yanling Guan, Jun Han, Grace Hu, Qiao Liu, Kirill Novoselov, Chul Park, Morton Pincus, Wing Suen, Eric Yeung, Liandong Zhang, Yinglei Zhang, Liu Zheng, and conference and seminar participants at the 2011 American Accounting Association (AAA) annual conference, the 2011 Asian Academic Accounting Association annual meeting, and at the University of Hong Kong for useful comments and discussions. Ying Deng provided excellent research assistance. This work is supported in part by the National Natural Science Foundation of China (NSFC, No. 70971006). † [email protected]‡ [email protected]§ [email protected]
Transcript
Internal Control Quality and Credit Default Swap Spreads*
Dragon Tang†
The University of Hong Kong
Feng Tian‡
The University of Hong Kong
Hong Yan§
University of South Carolina and Shanghai Advanced Institute of Finance
January 2014
* We thank John Abernathy, Gary Biddle, Konan Chan, Mark DeFond, Fei Du, Yanling Guan, Jun Han, Grace Hu, Qiao Liu, Kirill Novoselov, Chul Park, Morton Pincus, Wing Suen, Eric Yeung, Liandong Zhang, Yinglei Zhang, Liu Zheng, and conference and seminar participants at the 2011 American Accounting Association (AAA) annual conference, the 2011 Asian Academic Accounting Association annual meeting, and at the University of Hong Kong for useful comments and discussions. Ying Deng provided excellent research assistance. This work is supported in part by the National Natural Science Foundation of China (NSFC, No. 70971006). † [email protected] ‡ [email protected] § [email protected]
Internal Control Quality and Credit Default Swap Spreads
SYNOPSIS: This paper presents the first study on the effects of internal control quality on
derivatives pricing. Specifically, we utilize data from the credit default swap (CDS) transactions
of well-monitored companies to examine the relationship between the quality of internal control
and the cost of debt. The CDS data we employ are advantageous for our analysis because CDS
contracts are comparatively more homogeneous, standardized, and liquid than bank loans and
public bonds. We find that CDS spreads increase around the disclosure of internal control
material weaknesses (MWs) and that, all else equal, companies experiencing MWs with respect
to internal control have higher CDS spreads than companies with effective internal control.
Moreover, companies with company-level MWs have higher CDS spreads than those with less
severe, account-specific MWs. In addition, remediating internal control MWs is associated with
a decrease in CDS spreads. Our study offers a new perspective on the relationship between the
quality of internal control and the cost of debt.
Key Words: internal control over financial reporting, SOX 404, internal control material
weaknesses, credit default swaps, CDS, cost of debt Data Availability: The data are available from public sources JEL Classification: M41; G00; G32; K22
1
INTRODUCTION
This study examines the effect of internal control quality under Section 404 of the
Sarbanes-Oxley Act of 2002 (SOX 404) on the pricing of credit derivatives by analyzing a
unique transaction dataset from the credit default swap (CDS) market. CDSs are derivatives that
reference the credit risk of the reference firms, and CDSs are considered one of the most
important developments in the credit markets in recent decades. Thus, the CDS market has
enjoyed exponential growth; in 2007, this market exceeded $62 trillion in notional value.1 CDS
contracts are the primary instrument for credit risk transfer and provide a superior measure of
credit risk because they are more standardized, more homogeneous, and more liquid than public
bonds or bank loans.2 Popular media outlets, such as Bloomberg, often cite CDS spreads as a
summary measure of a firm’s financial health. Therefore, we believe that the CDS market is a
good setting in which to examine the relationship between internal control quality under SOX
404 and credit risk.
SOX 404 requires that managers and auditors provide an assessment regarding the
effectiveness of internal control over financial reporting (i.e., internal control quality) in the
annual report. The compliance requirements under SOX 404 have remained controversial for a
decade, which has led lawmakers to repeatedly revisit them (Gupta et al. 2013). One of the main
rationales behind SOX 404 is that material weaknesses (MWs) in internal control signal the
likelihood of unreliable financial reporting and greater information risk, which will thereby
increase the costs of capital (e.g., U.S. House of Representatives 2005). 1 The International Swap and Derivatives Association (ISDA) survey shows that the CDS market grew to $62 trillion in 2007 (http://www.isda.org/statistics/pdf/ISDA-Market-Survey-historical-data.pdf). These figures imply an annualized growth rate of 179% during the 1998-2007 period. Since the credit crisis, the CDS market remains active, with a market size of $26 trillion as of June 2010. 2 Callen et al. (2009) and Shivakumar et al. (2011) argue that CDS spreads provide a relatively pure pricing of credit risk and reflect changes in credit risk more accurately and quickly than other debt instruments because of the unique characteristics of CDS contracts.
2
Academic research has examined this type of SOX 404 impact from the perspective of
both the equity and the credit markets (Schneider et al. 2009). Studies using equity data have
yielded mixed findings regarding the association between internal control quality and the cost of
equity (Ogneva et al. 2007; Ashbaugh-Skaife et al. 2009; Gordon and Wilford 2012). Several
studies use debt market data—such as bank loans and public bonds—to investigate the
relationship between internal control quality and credit spreads, but these studies have also
produced inconsistent results. Although Kim et al. (2011) demonstrate that bank loan rates are
higher for companies with internal control MWs than for firms without such MWs, Dhaliwal et
al. (2011) find that there is no association between reporting internal control MWs and increased
bond spreads in their study of companies monitored by banks or rating agencies (essentially large
firms). Moreover, Kim et al. (2011) show that the remediation of internal control MWs is related
to decreased credit spreads, but Costello and Wittenberg-Moerman (2011) find no evidence for
such a remediation effect. Furthermore, Kim et al. (2011) find that credit spreads are higher for
companies with company-level internal control MWs than for companies with account-specific
internal control MWs, but Dhaliwal et al. (2011) find no such difference.
These conflicting results may be due to heterogeneous characteristics and measurement
issues in using bank loans and public bonds to measure credit spreads. Covenants, embedded
optionalities (such as callability and convertibility), and other complicating factors associated
with bank loans and public bonds may distort the relationship between credit risk and internal
control quality. Furthermore, because information on bank loans is only available when
companies receive new loans, researchers are relegated to three- or four-year windows in their
observations of changes in loan spreads (Dahilwal et al. 2011). By contrast, CDS contracts are
relatively homogeneous and standardized, and CDS spreads reflect credit risk better than loan or
3
bond spreads (Shivakumar et al. 2011; Callen et al. 2009) because the CDS market is not as
plagued with the liquidity issues that affect the public bond and bank loan markets. Therefore,
CDS spreads are a superior means of examining the impact of internal control quality on credit
pricing.
We expect CDS spreads to be positively related to internal control MWs for two reasons.
First, a firm that is experiencing MWs in internal control suggests that its financial reporting may
be unreliable, which thereby increases the perceived information risk from the perspective of a
credit investor. Such information risk related to unreliable information sources leads an investor
to charge a higher credit risk premium (e.g., Duffie and Lando 2001; Lambert et al. 2007).
Second, internal control MWs make it easier for managers to misappropriate a company’s assets,
which increases the default risk. For example, Skaife et al. (2013) report that the profitability of
insider trading is significantly greater in firms with internal control MWs, which suggests the
risk of expropriation of outside shareholders when there are weak internal controls.
In an examination of the period from November 15, 2004, to May 31, 2007, we find that
CDS spreads are significantly higher for firms with internal control MWs than for firms with
effective internal control. The effect of the quality of internal control on CDS spreads is
economically large: debt interest expense is $35.7 million per year higher for the average firm
associated with MWs. Moreover, CDS spreads are higher for firms with company-level MWs as
opposed to firms with account-specific MWs. Furthermore, CDS spreads decrease when internal
control MWs are remediated. These findings are robust to the choice of observation windows,
measurements, and control variables for accruals and corporate governance. Moreover, CDS
spreads increase significantly by 1.78 % within a three-day window of disclosures of internal
control MWs. This percentage change means that the debt holders of an average firm in our
4
sample lose $14 million during a three-day window surrounding MW disclosures. In addition,
we separately study the effect of internal control MWs on CDS spreads during the financial crisis
period, and our findings remain consistent. We thus conclude that CDS spreads are higher for
firms with lower quality internal control, which is consistent with the theoretical model by
Duffie and Lando (2001) that information risk is important for credit pricing.
Our study contributes to the literature in the following ways. First, we clarify the impact
of the quality of internal control on the debt market. Our study uses CDS spreads—which are a
cleaner measure of credit risk in comparison with the bond or loan spreads that have been used in
previous studies—and finds that internal control MWs are associated with higher credit risk even
for companies that are intensively monitored by sophisticated investors that are active in the
derivatives markets. This finding from the credit derivatives markets complements prior findings
that use other types of credit spread measures. We further show that the severity of internal
control weaknesses (company-level versus account-specific) influences CDS spreads and that
remediating internal control MWs reduces CDS spreads. These findings improve our
understanding of the findings of Dhaliwal et al. (2011) and Costello and Wittenberg-Moerman
(2011).
Second, this paper contributes to research in CDS pricing. Previous studies demonstrate
that financial information (such as earnings) significantly affects CDS pricing (Das et al. 2009;
Callen et al. 2009). We extend this line of research by providing evidence that CDS pricing is
influenced by financial information risk proxied by the quality of internal control. In addition,
our findings support theoretical research regarding the effect of information uncertainty by
offering evidence from the financial derivatives markets (Duffie and Lando 2001; Lambert et al.
2007). Together with previous studies on CDS pricing, such as Blanco et al. (2005), our work
5
also helps attenuate concerns that the CDS market may be manipulated by a small group of
banks (Alloway 2013). Third, this study provides new evidence from the CDS market that SOX
404 disclosures are informative for credit market investors.
The rest of the paper is organized as follows. First, we introduce the CDS market and
hypothesize the relationship between CDS spreads and internal control quality. We then describe
our sample and the empirical design; then, we report our findings on the effects of internal
control quality on CDS prices. We end by drawing conclusions from our results.
BACKGROUND AND HYPOTHESIS DEVELOPMENT
The CDS Market and Related Studies
CDSs can be regarded as insurance contracts protecting credit claims. In a CDS
transaction, the protection seller agrees to compensate the protection buyer if a default event with
respect to a reference issue occurs before the contract expires. For this credit protection, the
buyer pays the seller a fee that resembles an insurance premium. The annualized fee for a CDS
contract is referred to as the CDS spread or the CDS price. The CDS market has grown rapidly in
recent years. An ISDA survey shows that the outstanding notional size of the CDS market was
$180 billion in 1998 and grew to $62 trillion by 2007 (it remained at approximately $25-30
trillion after the 2008 global financial crisis). Longstaff et al. (2005) and Callen et al. (2009)
provide excellent overviews of the CDS market.
CDS contracts have become the main financial instrument to undertake credit risk
transfer. The major participants in the CDS market include large commercial banks, insurance
companies, and hedge funds; and CDS reference companies are normally large. CDSs attracted a
substantial amount of attention during the 2008 global financial crisis and the 2010-2012
6
European sovereign crisis. CDS spreads are often quoted as a timely barometer of the financial
health of a reference firm or sovereign entity. Recent empirical research on credit risk employs
CDS contracts as the main instrument, and Longstaff et al. (2005) suggest that CDS spreads are a
superior measure of the credit risk premium. The advantages of CDSs in credit risk analysis are
also supported by other studies. For instance, Blanco et al. (2005) find that the CDS market leads
the bond market in the price discovery of credit risk. Acharya and Johnson (2007) report that
there is an information flow from the CDS market to the equity markets, particularly for major
negative news. Ericsson et al. (2009) show that much of the variation in CDS spreads can be
explained by structural model factors linked to firm fundamentals.
Callen et al. (2009) and Das et al. (2009) find that accounting earnings are priced into the
levels of and changes in CDS spreads, whereas De Franco et al. (2009) show that CDS prices are
responsive to debt analysts’ reports. Shivakumar et al. (2011) demonstrate that CDS pricing
reacts significantly to management forecast news and that the reaction to forecast news is
stronger than to actual earnings news. Batta (2011) examines the direct relevance of accounting
information for CDS pricing. Kim et al. (2013) find that greater financial statement
comparability is associated with lower CDS spreads. These papers have cleared the way for the
broad use of CDS data in empirical accounting research.
Internal Control over Financial Reporting (SOX 404)
The evaluation of internal control over financial reporting has long been an important
part of the auditing process (Kinney et al. 1990). Prior to the enactment of the Sarbanes-Oxley
Act (SOX) in 2002, U.S. companies were required to disclose the effectiveness of internal
control only occasionally (e.g., in the event of an auditor termination). Since November 15, 2004,
SOX 404, which is the focus of our study, has required firm management to assess the quality of
7
internal control over financial reporting and to provide periodic auditor-attested evaluations of
internal control effectiveness.3 Broad discussions of SOX and market reactions around relevant
events are available in Li, Pincus, and Rego (2008) and Zhang (2007).
A number of studies have evaluated the determinants of internal control quality (e.g.,
Ashbaugh-Skaife et al. 2007; Doyle et al. 2007b; Ge and McVay 2005) and find that smaller,
younger, riskier, and financially weaker firms tend to have internal control MWs. With respect to
the capital market implications of internal control quality, previous studies offer a mixed picture
in the equity market. On the one hand, Ogneva et al. (2007) find no association among internal
control MWs and several risk measures—including the cost of equity capital, earnings quality,
and return volatility—after controlling for other firm characteristics. Beneish et al. (2008)
demonstrate that equity markets do not react to Section 404 internal control weakness disclosures.
On the other hand, Ashbaugh-Skaife et al. (2009) show that internal control weaknesses are
associated with higher idiosyncratic risk, higher systematic risk, and higher cost of equity.
Gordon and Wilford (2012) use a more recent sample of internal controls under SOX 404 to
revisit the relationship between internal control quality and the cost of equity and suggest that
internal control weaknesses are related to higher costs of equity.
Internal Control Quality and CDS Spreads
3 Section 404 has been one of the most controversial provisions of SOX because of the costs associated with compliance with it. Consequently, the Securities and Exchange Commission (SEC) has issued several management guidelines, and the Public Company Accounting Oversight Board (PCAOB) replaced Audit Standard #2 (AS #2) with Audit Standard #5 (AS #5) to alleviate the burden on filing firms and their auditors. In addition, compliance with Section 404 for small firms (assets below $75 million) was postponed several times. See http://www.sec.gov/rules/interp/2007/33-8810.pdf and http://pcaobus.org/News/Releases/Pages/05242007_Board-ApprovesNewAuditStandard.aspx. Furthermore, the Dodd-Frank Wall Street Reform and Consumer Protect Act of 2010 granted small firms, i.e., non-accelerated filers, permanent exemptions from auditor certification requirements under Section 404 (b) of SOX. On April 5, 2012, the Jumpstart Our Business Startups Act (JOBS Act) further exempted emerging growth companies, newly publicly listed companies and middle-sized companies with revenues below $1 billion or market value below $700 million, from compliance under SOX section 404 (b).
8
Internal control quality may be useful to credit investors in assessing information risk.
First, MWs in internal control cast doubt on the reliability of firms’ financial reports. As defined
by auditing standards (i.e., AS #2 or AS #5), MWs in a filing firm imply that there is more than a
remote likelihood that the firm’s internal control system will fail to detect or avoid material
misstatements in financial reports. This definition implies greater uncertainty regarding whether
financial reports and disclosures of a company are reliable. Such uncertainty increases the
information risk to creditors when assessing potential credit losses resulting from default.
Eventually, according to theory, creditors require compensation for information-related risk
(Duffie and Lando 2001; Lambert 2007). Second, weak internal control exacerbates agency
conflicts because expropriation of debt-holders by equity holders may be more difficult to detect.
Cheng et al. (2013) show that firms with weak internal controls tend to either over-invest or
under-invest. Skaife et al. (2013) find that internal control weaknesses are associated with higher
profitability for insider trading, which suggests that wealth transfers from companies to
managers may occur with inferior internal control regimes. Ineffective internal controls might
thus increase the information asymmetry between managers and creditors, which should lead to
higher CDS spreads. 4 Therefore, we expect that, all else equal, internal control MWs are
associated with higher CDS spreads.5
A few recent studies have examined the relationship between internal control quality and
the cost of debt and employed this line of reasoning using data on public bonds or private loans.
Dhaliwal et al. (2011) find that corporate bond spreads are marginally higher for firms disclosing
internal control MWs, but this relationship is non-existent for firms monitored by banks.
4 Such theoretical models on information asymmetry include Lambert et al. (2007), Easley and O'Hara (2004), Verrecchia (2001), and Duffie and Lando (2001). 5 There are concerns that the CDS market is volatile and manipulated by a small number of banks (e.g., Alloway 2013). If that were the case, the relationship between internal control quality and CDS spreads may be distorted, but that would bias the results against our hypothesis.
9
Conversely, Costello and Wittenberg-Moerman (2011) and Kim et al. (2011) document that loan
spreads are higher for firms reporting internal control MWs among bank-monitored companies.
Therefore, the evidence is mixed. Because credit risk estimations in both bond and bank loan
markets are complicated by their embedded heterogeneous features—such as covenants,
callability, and convertibility—it is important to examine the relationship between credit risk and
internal control quality in a cleaner setting. We analyze this relationship in the largest market for
credit derivatives, i.e., the CDS market, because CDS-reference companies are arguably
monitored by a broader set of market participants that includes banks and participants in both the
bond and derivatives markets. Therefore, given the theoretical prediction regarding the
relationship between the quality of internal control and credit risk, we hypothesize the following:
H1: CDS spreads are positively associated with internal control MWs.
MWs have different types and severities. Doyle et al. (2007a) classify internal control
MWs as two types. The first type of internal control MW is related to specific accounts and
transactions that can be easily overcome by auditors with additional procedures (i.e., additional
substantive tests). The other type of material weakness, however, is associated with a firm’s
overall control environment and/or financial reporting process. Such systematic weaknesses can
have a pervasive and permanent effect on the reliability of financial reporting. This type of MW
calls into question whether managers’ are able to maintain an effective management system for
their companies. Thus, debt market analysts regard company-level MWs as more severe than
account-specific MWs (Moody’s 2004, 2006, and 2007). Moreover, earlier studies find that
company-level internal control weaknesses are more strongly related to a range of risk measures
(e.g., earnings quality, management forecast accuracy, etc.) than are account-specific MWs (e.g.,
10
Doyle et al. 2007a). Therefore, we expect that company-level MWs have a greater impact on
CDS spreads than account-specific MWs. Therefore, our second hypothesis is as follows:
H2: Company-level MWs are more positively associated with CDS spreads than account-specific
MWs.
If the quality of internal control is important to CDS pricing, we expect that the year-by-
year change in internal control quality should be associated with a change in CDS spreads. For
example, if internal control weaknesses are remediated, we expect to observe a decrease in CDS
spreads because the reliability of financial reporting will have improved, which will lead to
lower information risk. Consistent with this prediction, Ashbaugh-Skaife et al. (2008) find that
earnings quality improves when internal control weaknesses are remediated. For credit market
reactions, we hypothesize the following:
H3: CDS spreads decrease as MWs are remediated.
To test this hypothesis specifically, we examine changes in MWs in the following scenarios:
remediation cases in which MWs are corrected, repeated weakness cases in which MWs repeat
annually, and deterioration cases in which companies’ internal control changes from effective to
ineffective.
DATA AND SAMPLE DESCRIPTION
Our dataset is drawn from the intersection of SOX 404 disclosure data and CDS trading
data for U.S. corporations. We combine three sets of data in our empirical analysis: CDS data
from interdealer broker GFI Group Inc., Section 404 internal control reports compiled by Audit
Analytics, and firm financial and accounting information from CRSP and Compustat.
11
Sample Selection
We first retrieve all internal control data under Section 404 from Audit Analytics for
firms with a fiscal year ending between November 15, 2004, and May 31, 2007.6 The reports
contain management and auditor opinions about a firm’s internal control quality. We define a
dummy variable, MW, which takes the value of 1 if the firm reports internal control MWs and 0
otherwise.
We require CDS transaction data over the sample period for firms with internal control
reporting. Our main CDS dataset comes from the GFI Group, a leading CDS interdealer broker.
The data, captured by GFI Group's CreditMatch electronic and voice hybrid trading system,
include all transacted prices and tradable quotes with varying maturities for a reference entity.
We augment the GFI data with CDS trades and quotes from CreditTrade, another major
interdealer broker operating until 2006. CreditTrade data were previously used by Blanco et al.
(2005) and Acharya and Johnson (2007). The combined GFI and CreditTrade CDS data provide
comprehensive coverage of the market, although our findings are similar if we use only the GFI
data.
Summary Statistics
Table 1 reports summary statistics for our main variables. Our final sample consists of
average CDS spread is 80.1 basis points (bps) over our sample observations (the median is 42.3
basis points). The data period corresponds to an economic expansion period with relatively low
CDS spreads. Nevertheless, there is substantial variation across CDS observations, and the
standard deviation is 109.1 basis points. The average CDS spread is 204 bps for firms reporting
6 We end the sample period before the credit crisis for our main analysis. Later we extend the data beyond 2007 and discuss the findings for the crisis period findings.
12
internal control MWs firms and 71 bps for firms with effective internal control (untabulated).
The difference in CDS spreads between these two groups is statistically significant at the 1%
level.
Our sample firms are relatively large; the median total asset value of our firms is
approximately $11.7 billion. During our sample period, only firms with more than $75 million in
assets were required to comply with SOX 404. In addition, most CDS transactions involve large
firms with relatively high leverage. The mean firm age is 35.4 years and the average leverage
ratio is 0.24. Our sample firms therefore tend to be larger, more leveraged, and older than those
included in some other studies on SOX 404 (e.g., Ashbaugh-Skaife et al. 2009). A total of 41%
of the firms in our sample have undergone restructuring, and 27.2% of the sample observations
are involved in foreign transactions. Overall, our sample represents an important cross-section of
the U.S. capital market.
EMPIRICAL RESULTS
Event Studies on Material Weakness Disclosures
We first conduct event studies to examine whether investors in the CDS market react to
the disclosure of MWs in internal controls. The extant studies on bank loan and public bond
markets focus on long-run changes in credit spreads because of the illiquidity of these markets.
By contrast, we utilize the higher trading frequency of CDS data to provide evidence on whether
internal control disclosures provide relevant information to the credit derivatives markets. To
conduct such an investigation, we seek relevant news items through 10K Wizard and Factiva to
determine the first date of the disclosure of internal control MWs 90 days prior to the filing date
of internal control reports for firms disclosing MWs in our sample. For these event dates, we
13
estimate percentage changes in CDS spreads over the [-1, +1] three-day or [-2, +2] five-day
event windows. For purposes of comparison, we also calculate cumulative stock returns during
the same event window. Our estimation of the CDS spread change follows Shivakumar et al.
(2011). We use changes in CDS spreads instead of returns because our window is a three-day
(five-day) period, and calculating returns may involve estimation errors.7 Our results are robust
to different ways of adjusting the CDS changes.
Table 2 reports that CDS spreads increase by 1.78% (1.51%), on average, over a three-
day (five-day) event window surrounding MW disclosures. These CDS spread increases are
statistically significant, which suggests that disclosures of SOX 404 MWs convey new negative
information to the credit derivatives market. The reaction to the MW disclosure is also
economically meaningful, which implies that the debt value of an average MW firm in our
sample may be reduced by approximately 0.16% or $14 million during the three days
surrounding MW disclosures.8 Furthermore, we estimate the adjusted CDS spread changes by
subtracting the average CDS spread change with the same credit rating over the same period
from raw CDS spread changes and find similar results. Moreover, we examine the first-time
disclosure of MWs under SOX 404 and find that the percentage change in CDS spreads increases
slightly in magnitude. By contrast, the cumulative stock return does not change significantly.
This finding is consistent with the findings of Beneish et al. (2008) that SOX 404 MW
7 Lok and Richardson (2011) provide a method to calculate the credit return by considering the carry component of a CDS contract and its duration and show that, over short windows, raw changes and credit returns are highly correlated. We find similar results using CDS raw changes instead of percentage changes. 8 We estimate the bond price change using the duration relationship: ∆p D ∆CDS, where D is the debt duration of the company and ∆p is the percentage change in debt value. Because the average CDS spread for MW firms is 204 bps, the change in CDS spreads is 3.63 bps. We obtain these approximate percentage and dollar estimates using the average debt duration of 4.5 years and total long-term liabilities of $8.5 billion in our sample.
14
disclosures have no noticeable impact on stock prices.9 The combined results from both the
credit derivatives markets and the stock market suggest that MW disclosures provide relevant
new information to the CDS markets.
Cross-Sectional Regression Analysis
The evidence regarding the immediate CDS market reaction to disclosures of internal
control MWs suggests that CDS pricing is affected by internal control quality. To test our
hypotheses, we construct cross-sectional regressions to analyze how internal control quality
(internal control weaknesses versus effective internal control) is associated with CDS spreads,
whether the severity of internal control MW are related to CDS spreads differently, and whether
a change in MW status is associated with a change in CDS spreads.
Detailed information about a firm’s internal control MWs is frequently contained in its
annual 10-K filings. Therefore, we first average the 5-year CDS transaction prices over the three-
month period after internal control disclosures10 and use a regression model to compare CDS
spreads among firms with and without MWs after controlling for other important factors that
affect internal control quality and CDS spreads in cross-sectional regressions, as suggested by
prior studies (e.g., Ericsson et al. 2009; Callen et al. 2009; Ashbaugh-Skaife et al. 2007; Doyle et
al. 2007b; Ge and McVay 2005). The regression model we use is as follows:
9 We conjecture that the lack of a significant reaction in the stock market may be related to two factors: 1) Stock prices reflect MW information in a noisier way; 2) MW information is explicitly taken into consideration by rating agencies such as Moody’s but not by equity analysts. 10 We use the three-month period after internal control disclosures for two reasons. First, it is before the release of the next quarterly report that contains the SOX 302 internal control information. Second, because trading in their CDS contracts remains sparse for many firms (although still more frequent than trading in their bonds), averaging trades over the three-month period might help reduce noise in the data caused by transitory liquidity issues because fundamental components in CDS prices move at lower frequencies. We assess the sensitivity of window length in the robustness checks.
15
&
%
| |
∑
………………………….(1)
where t denotes fiscal years. We use the logarithm of CDS SPREAD, which is the average five-
year CDS spread over the three-month period subsequent to internal control filings for fiscal year
t, 11 as the dependent variable. The five-year CDS contracts are the most popular and most
actively traded in the market. Our key independent variable is an indicator, MW, for whether a
company reports internal control MWs (MW=1) or not (MW=0) in year t. We control for the
commonly used determinants of credit spreads by including stock return volatility (VOL RET)
and leverage (LEVERAGE) (see, e.g., Ericsson et al. 2009; Callen et al. 2009). We include a
ranked Altman (1968) Z-score (RZSCORE) to control for financial distress. We also control for
macroeconomic conditions by including SWAPRATE and TERMSLOPE. Moreover, we control
for the determinants of internal control weaknesses and include the number of segments (SEG),
foreign transactions (FOREIGN), mergers and acquisitions (M&A), restructuring
(RESTRUCTURE), sales growth (SALE GROWTH), book-to-market ratio (BM), inventory
11 We use the three-month period after internal control disclosures for two reasons. First, averaging trades over the three-month period might help reduce noise in the data caused by transitory liquidity issues because trading in many firms’ CDS contracts remains sparse and temporarily volatile (although still heavier than trading in their bonds). Second, we want to ensure that there is sufficient time for the CDS market to fully digest the internal control quality information before the release of the next quarterly report that contains the SOX 302 internal control information.
16
(INVENTORY), firm size (SIZE), past losses (%LOSS), and big auditor indicator (BIG
AUDITOR). Detailed definitions of these variables are provided in the appendix. All control
variables are measured at the end of fiscal year t and prior to the estimation of CDS spreads.
In addition, to mitigate concerns that information contemporaneous with the internal
control disclosures may lead to a positive relationship between MW and CDS spreads, we also
include the following control variables: 1) Disclosure intensity, for which we use the disclosure
of research and development expenditures, order backlog, and the number of employees at the
segment level (RDS DIS, OBS DIS, EMPS DIS) as proxies (Karuna 2013); 2) Strength of
corporate governance, for which we follow Gompers et al. (2003) to include governance index,
GINDEX, to control for the strength of corporate governance; 3) Accruals quality, for which we
include the absolute value of abnormal accruals, |DA|, to ensure that the effect of internal control
quality on CDS spreads is incremental to the effect of accruals quality; 4) Information
environment, for which we include the number of analysts covering the firm, FOLLOWING, to
control for the firm’s information environment; 5) News prominence, for which we include
unexpected trading volume (TRD VOL) as a proxy for news prominence (There are two reasons
to use this proxy. First, Huberman and Regev’s (2001) analysis suggests that prominent news is
associated with high trading volume in the stock market; therefore, we control for news
prominence by including abnormal stock trading volume. Second, prior studies, such as Beaver
(1968) and Cready and Hurtt (2002), suggest that equity trading volume contains information
content for the equity market; therefore, we control for information relevant to the equity market
by including stock trading volume.); and 6) Stock returns, for which we incorporate stock returns
over the same period in the regressions to explore whether the effect of internal control
disclosures on CDS spreads is incremental to factors affecting equity markets.
17
Our main regression analysis is conducted on a pooled time-series and cross-sectional
panel with treatment for industry and year fixed effects. We cluster standard errors by firms.
Regarding these six sets of control variables, the proxies for disclosure intensity, strength of
corporate governance, accruals quality and information environment are measured before the
estimation of our dependent variables; the proxies for stock returns and news prominence are
estimated at the same time that the CDS spreads are estimated to control for contemporaneous
information. In the empirical tests, we run our regressions with and without these six sets of
control variables to ensure that our results are robust.
Table 3 reports our baseline panel regression results using Log (CDS SPREAD) as the
dependent variable. Column (1) reports the results controlling for factors affecting CDS spreads
or MWs. Column (2) further controls for information contemporaneous with internal control
disclosures. This control is a conservative test that could bias against our finding. In Column (2),
the coefficient estimate on MW are positive and significant at the 5% level or better, which
supports our first hypothesis that CDS spreads are positively associated with MWs. The
coefficient on MW is 0.248, which suggests that internal control MWs are associated with a 28.1%
(=exp(0.248)−1) higher CDS spread with a full set of control variables. To provide a more direct
explanation regarding the effect of MWs on CDS spreads, we also use CDS SPREAD without
taking a logarithm to repeat the regressions and find that the coefficient estimate on MW is 41.71,
which is significant at the 5% level. This estimate suggests that CDS spreads are 42 basis points
higher for MW firms than firms with effective internal control. This CDS spread difference can
18
be translated into a $35.7 million difference in annual interest expenses between a MW and a
non-MW firm.12
In sum, our results in Table 3 suggest that internal control MWs are significantly
associated with higher CDS spreads.13 Therefore, our baseline empirical tests support our first
hypothesis. Our findings also imply that internal control quality plays an important role in credit
risk pricing in the CDS market, a market in which reference companies are intensely monitored
by sophisticated market participants.
To test our second hypothesis—that company-level MWs are more positively associated
with CDS spreads than account-specific MWs—we further analyze the effect of the severity of
MWs on CDS spreads by employing the following regression:
&
%
| |
∑
………………………….(2)
12 Given the average debt amount of $8.5 billion, the annual interest expense is estimated as 8,500×0.42%=$35.7 million. Since the average long-term debt interest rate (the risk free rate in our sample period plus the credit spread) for a MW firm in our sample is 6.1%, the 42 bps accounts for 6.8% of the total interest expense for a MW firm. 13 The analysis in Table 3 is based on a cross-sectional regression model so that it does not imply any potential to exploit the slow diffusion of MW news.
19
where all the variables are defined in the appendix. Equation (2) extends Equation (1) by
classifying MWs into account-specific (ACCOUNT SPECIFIC MW) and company-level
categories (COMPANY LEVEL MW).
Table 4 presents evidence on how CDS spreads are affected by company-level and
account-specific internal control MWs. In both columns, the coefficients for company-level
MWs are consistently positive at the 5% significance level, whereas the coefficients for account-
specific MWs are insignificant, which suggests that the association between CDS spreads and
internal control weaknesses are mainly driven by company-level internal control weaknesses.
Column (2) shows that reporting company-level MWs is associated with approximately 47.3%
(=exp(0.388)-1) higher CDS spreads, whereas reporting account-specific MWs has an
insignificant impact on CDS spreads. 14 These findings support our second hypothesis that
company-level MWs have a much greater impact on CDS spreads than account-specific MWs.
To test our third hypothesis—that the change in CDS spreads is related to the change in
MWs—we conduct a change analysis to examine how CDS spreads vary as internal control
quality evolves. Table 5 reports our regression results using change variables. We report the
differential effect of directional MW changes by separating ∆MW to remediated (“corrected
weaknesses”) cases (MW=1 to MW=0), repeated weakness (“uncorrected weaknesses”) cases
(MW=1 to MW=1), and deterioration cases (MW=0 to MW=1). The default type is continuously
effective internal control cases (MW=0 to MW=0). The results show that the remediation case
significantly affects the CDS spread change. The evidence is weak for year-by-year changes in
CDS spreads in deterioration cases in the change analysis. We note that the number of
deterioration cases is only half the number of remediated cases in our sample, as we
14 The difference between these two types of MWs is significant at the 5% level. We find similar results when we use raw CDS spreads in our regressions.
20
conservatively drop the MW cases in the first year to measure the shift in internal control
weaknesses. However, our event study discussed above provides supplemental evidence.
Robustness Checks
To assess the robustness of our results, we conduct several sensitivity analyses. We first
change the observation window for CDS spreads. Table 6 shows that when we use a two-month
or one-month observation window for CDS spreads, the results are similar to our baseline results
using a three-month window. We also find that our results are robust when we use individual
CDS contracts directly, similar to Callen et al. (2009), instead of averaging CDS spreads across
all contracts for the same name. In addition, when we restrict our sample of companies to those
covered by rating agencies, we find results similar to those reported in Tables 3-5, which
suggests that the effect of MWs on CDS spreads is beyond the rating agency monitoring channel
documented by Dhaliwal et al. (2011).15 Those results are not tabulated here to conserve space.
Relation of MW and CDS spreads during the Financial Crisis Period
In our main analysis, we end the sample on May 31, 2007, which is before the 2008
global financial crisis. However, we are interested in exploring the role of internal control quality
in the CDS market during the financial crisis also. We have managed to collect additional data
for the period from June 1, 2007 through June 30, 2008 to extend our analysis. Our additional
sample has 208 firm-year observations with all relevant information but with only two instances
of MWs.16 Whereas we do not believe that including this additional dataset in cross-sectional
15 Because the major investors in the CDS market are financial institutions, we expect that these financial institutions—such as banks and hedge funds—actively trade and monitor CDS reference companies. 16 The downward trend of the number of ineffective internal control reports filed is consistent with other studies on MWs. For example, Skaife et al. (2013) document that the fraction of MWs decreases from 17.3% in 2004 to 3.2% in 2008 in their sample. Several speeches by practitioners also confirm this trend (SEC 2009). We further explore the CDS sample from July 2008 to March 2009 and find that there is no MW case covered by the CDS sample during this period.
21
regressions will add much insight,17 we conduct event studies of these two MW instances to
investigate the CDS market reaction to MW disclosures during the financial crisis, which shows
that CDS spreads increase by 4.5% in the three-day event window, albeit not statistically
significant for only two observations (t-stat=1.00). Nevertheless, this result is consistent with our
previous finding that CDS spreads are positively associated with the presence of MWs.
CONCLUSIONS
We investigate how internal control quality affects the pricing of CDSs. From cross-
sectional regressions, we find that, all else equal, CDS spreads are 28.1% (or 42 basis points)
higher, on average, for firms with internal control MWs than for firms with effective internal
controls. This effect is driven mainly by company-level weaknesses rather than by account-
specific weaknesses. We further document that remediation of internal control weaknesses is
related to a reduction in CDS spreads. In addition, we find that CDS spreads increase
significantly around the announcement dates of internal control MWs.
Our study is the first to examine the effect of internal control quality on derivatives
pricing. There is growing interest in using CDS spreads for empirical accounting research
because they represent a superior measure of credit risk. The usage of CDS data in this study
enables us to employ a new perspective to several mixed findings in previous studies on the
relationship between internal control quality and the cost of debt. For instance, the previous
studies present inconclusive evidence on whether there is a relationship between internal control
quality and credit spread among bank-monitored companies (Kim et al. 2011; Dhaliwal et al.
17 Given that the CDS market becomes volatile during the financial crisis, including these observations would lower the power of our tests but provide little to examine the internal control quality and CDS spread relationship because of the small number of reports of internal control weaknesses added. Even if we include this group of the sample, we find similar results with slightly lower statistical significance.
22
2011). A confirmed finding on this question should have implications for the ongoing debate as
to whether SOX 404 should apply only to large companies and not to small or even middle-size
businesses (Gupta et al. 2013). Because large companies are normally better monitored, the lack
of a cost-of-debt benefit from SOX 404 for these companies calls into question the efficacy of
SOX 404 for investors. Our analysis using unique CDS data confirms that even in a sophisticated
market in which companies are continuously monitored, internal control quality plays an
important role in credit pricing. Therefore, our study offers new evidence that will help inform
the debate. Moreover, regulatory bodies such as the Public Company Accounting Oversight
Board (PCAOB) differentiate the type of internal control MWs (i.e., company-level versus
account-specific MWs) in their regulatory documents, and our finding regarding the differential
effects of these two types of MWs may provide partial justification for such considerations.
There are several caveats in our study. First, we do not have information on the identities
of CDS traders and are thus unable to control for counterparty risk, which is of particular
concern during the financial crisis. Second, we rely on information about internal control quality
as disclosed by companies, but many companies may not disclose such information in a timely
manner (Rice and Weber 2012). Therefore, we may under- or over-estimate the effect of internal
control MWs on CDS spreads. Nevertheless, we believe that our study provides consistent
evidence that will help advance the related literature and enhance our understanding of the
impact of internal control quality on the pricing of debt capital in the market.
23
REFERENCES
Acharya, V. V., and T. C. Johnson. 2007. Insider trading in credit derivatives. Journal of Financial Economics 84 (1):110-141.
Alloway, T.2013. Pension fund sues banks over CDS ‘dominance’. Financial Times May 7 2013 Altman, E. I. 1968. Financial ratios, discriminant analysis and prediction of corporate bankruptcy.
Journal of Finance 23 (4):589-609 Ashbaugh-Skaife, H., D. W. Collins, and W. R. Kinney Jr. 2007. The discovery and reporting of
internal control deficiencies prior to SOX-mandated audits. Journal of Accounting and Economics 44 (1-2):166-192.
Ashbaugh-Skaife, H., D. W. Collins, W. R. Kinney, and R. LaFond. 2008. The effect of SOX internal control deficiencies and their remediation on accrual quality. The Accounting Review 83 (1):217-250.
Ashbaugh-Skaife, H., D. W. Collins, W. R. Kinney, and R. LaFond. 2009. The Effect of SOX internal control deficiencies on firm risk and cost of equity. Journal of Accounting Research 47 (1):1-43.
Batta, G. 2011. The Direct Relevance of Accounting Information for Credit Default Swap Pricing. Journal of Business Finance & Accounting 38 (9-10):1096-1122.
Beaver, W. H. 1968. Information Content of Annual Earnings Announcements. Journal of Accounting Research 6:67-92.
Beneish, M. D., M. B. Billings, and L. D. Hodder. 2008. Internal control weaknesses and information uncertainty. The Accounting Review 83 (3):665-703.
Bharath, S. T., J. Sunder, and S. V. Sunder. 2008. Accounting quality and debt contracting. The Accounting Review 83 (1):1-28.
Blanco, R., S. Brennan, and I. W. Marsh. 2005. An empirical analysis of the dynamic relation between investment-grade bonds and credit default swaps. The Journal of Finance 60 (5):2255-2281.
Callen, J. L., J. Livnat, and D. Segal. 2009. The impact of earnings on the pricing of credit default swaps. The Accounting Review 84 (5):1363-1394.
Cheng, M., D. Dhaliwal, and Y. Zhang. 2013. Does investment efficiency improve after the disclosure of material weaknesses in internal control over financial reporting? Journal of Accounting and Economics 56 (1):1-18.
Costello, A. M., and R. Wittenberg-Moerman. 2011. The impact of financial reporting quality on debt contracting: Evidence from internal control weakness reports. Journal of Accounting Research 49 (1): 97-136.
Cready, William M., and David N. Hurtt, 2002, Assessing investor response to information events using return and volume metrics, The Accounting Review 77, 891-909.
Das, S. R., P. Hanouna, and A. Sarin. 2009. Accounting-based versus market-based cross-sectional models of CDS spreads. Journal of Banking & Finance 33 (4):719-730.
De Franco, G., F. P. Vasvari, and R. Wittenberg-Moerman. 2009. The informational role of bond analysts. Journal of Accounting Research 47 (5):1201-1248.
Dhaliwal, D., C. Hogan, R. Trezevant, and M. Wilkins. 2011. Internal Control Disclosures, Monitoring, and the Cost of Debt. The Accounting Review 86 (4):1131-1156.
Doyle, J., W. Ge, and S. McVay. 2007a. Accruals quality and internal control over financial reporting. The Accounting Review 82 (5):1141-1170.
24
Doyle, J., W. Ge, and S. McVay. 2007b. Determinants of weaknesses in internal control over financial reporting. Journal of Accounting and Economics 44 (1-2):193-223.
Duffie, D., and D. Lando. 2001. Term structures of credit spreads with incomplete accounting information. Econometrica 69 (3):633-664.
Easley, D., and M. O'Hara. 2004. Information and the cost of capital. The Journal of Finance 59 (4):1553-1583.
Ericsson, J., K. Jacobs, and R. Oviedo. 2009. The determinants of credit default swap premia. Journal of Financial and Quantitative Analysis 44 (1):109-132.
Ge, W., and S. McVay. 2005. The disclosure of material weaknesses in internal control after the Sarbanes-Oxley Act. Accounting Horizons 19 (3):137-158.
Gompers, P., J. Ishii, and A. Metrick. 2003. Corporate Governance and Equity Prices. Quarterly Journal of Economics 118 (1):107-155.
Gordon, L. A., and A. L. Wilford. 2012. An Analysis of Multiple Consecutive Years of Material Weaknesses in Internal Control. The Accounting Review 87 (6):2027-2060.
Gupta, P. P., T. R. Weirich, and L. E. Turner. 2013. Sarbanes-Oxley and Public Reporting on Internal Control: Hasty Reaction or Delayed Action? Accounting Horizons 27 (2):371-408.
Huberman, G., and T. Regev. 2001. Contagious speculation and a cure for cancer: A nonevent that made stock prices soar. Journal of Finance 56 (1):387-396.
Karuna, C. 2013. Industry Product Market Competition and Corporate Voluntary Disclosure: Evidence from Discretionary Forward-Looking Line Items at the Industrial Segment: University of Houston.
Kim, S., P. Kraft, and S. Ryan. 2013. Financial statement comparability and credit risk. Review of Accounting Studies 18 (3):783-823..
Kim, J.-B., B. Y. Song, and L. Zhang. 2011. Internal Control Weakness and Bank Loan Contracting: Evidence from SOX Section 404 Disclosures. The Accounting Review 86 (4): 1157-1188.
Kinney, W. R., M. W. Maher, and D. W. Wright. 1990. Assertions-based standards for integrated internal control. Accounting Horizons 4 (4):1-8.
Lambert, R., C. Leuz, and R. E. Verrecchia. 2007. Accounting information, disclosure, and the cost of capital. Journal of Accounting Research 45 (2):385-420.
Li, H., M. P. Pincus, and S. O. Rego. 2008. Market reaction to events surrounding the Sarbanes-Oxley Act of 2002 and earnings management. Journal of Law & Economics 51, 111-134.
Lok, S., and S. Richardson. 2011. Credit markets and financial information. Review of Accounting Studies 16 (3):487-500.
Longstaff, F. A., S. Mithal, and E. Neis. 2005. Corporate yield spreads: Default risk or liquidity? New evidence from the credit default swap market. The Journal of Finance 60 (5):2213-2253.
Moody’s Investors Service. 2004. First year Section 404 reports on internal control: Impact on rating will depend on nature of material weaknesses reported. New York, NY: Moody’s Investors Service.
Moody’s Investors Service. 2006. Second year Section 404 reports on internal control: Delinquent filers are most at risk of negative rating action. New York, NY: Moody’s Investors Service.
25
Moody’s Investors Service. 2007. Third year Section 404 reports on internal control: Control problems are decreasing, but reporting can be improved. New York, NY: Moody’s Investors Service.
Ogneva, M., K. Raghunandan, and K. R. Subramanyam. 2007. Internal control weakness and cost of equity: Evidence from SOX Section 404 disclosures. The Accounting Review 82 (5):1255-1297.
Rice, S. C., and D. P. Weber. 2012. How Effective is Internal Control Reporting Under SOX 404? Determinants of the (Non-)Disclosure of Existing Material Weaknesses. Journal of Accounting Research 50 (3):811-843.
Schneider, A., A. A. Gramling, D. R. Hermanson, and Z. Ye. 2009. A Review of Academic Literature on Internal Control Reporting Under SOX. Journal of Accounting Literature 28:1-46.
Securities and Exchange Commission (SEC). 2009. Remarks before the 2009 AICPA National Conference on current SEC and PCAOB developments, by Doug Besch. Available at: http://www.sec.gov/news/speech/2009/spch120709db.htm
Shivakumar, L., O. Urcan, F. Vasvari, and L. Zhang. 2011. The debt market relevance of management earnings forecasts: evidence from before and during the credit crisis. Review of Accounting Studies 16 (3):464-486.
Skaife, H. A., D. Veenman, and D. Wangerin. 2013. Internal control over financial reporting and managerial rent extraction: Evidence from the profitability of insider trading. Journal of Accounting and Economics 55 (1):91-110.
U.S. House of Representatives. 2005. The impact of the Sarbanes-Oxley Act. Hearing before the Committee on Financial Services (April 21). Washington, D.C.: Government Printing Office.
Verrecchia, R. E. 2001. Essays on disclosure. Journal of Accounting & Economics 32 (1-3):97-180.
Zhang, I. X. 2007. Economic consequences of the Sarbanes-Oxley Act of 2002. Journal of Accounting and Economics 44 (1-2):74-115.
26
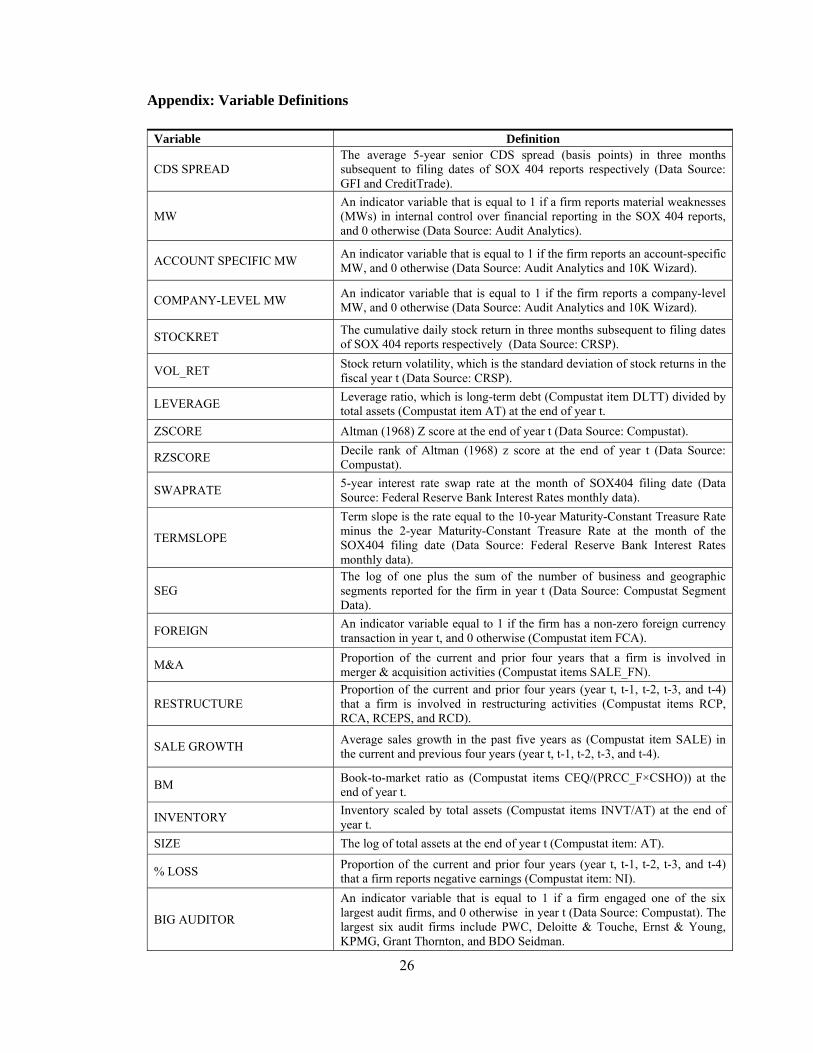
Appendix: Variable Definitions
Variable Definition
CDS SPREAD The average 5-year senior CDS spread (basis points) in three months subsequent to filing dates of SOX 404 reports respectively (Data Source: GFI and CreditTrade).
MW An indicator variable that is equal to 1 if a firm reports material weaknesses (MWs) in internal control over financial reporting in the SOX 404 reports, and 0 otherwise (Data Source: Audit Analytics).
ACCOUNT SPECIFIC MW An indicator variable that is equal to 1 if the firm reports an account-specific MW, and 0 otherwise (Data Source: Audit Analytics and 10K Wizard).
COMPANY-LEVEL MW An indicator variable that is equal to 1 if the firm reports a company-level MW, and 0 otherwise (Data Source: Audit Analytics and 10K Wizard).
STOCKRET The cumulative daily stock return in three months subsequent to filing dates of SOX 404 reports respectively (Data Source: CRSP).
VOL_RET Stock return volatility, which is the standard deviation of stock returns in the fiscal year t (Data Source: CRSP).
LEVERAGE Leverage ratio, which is long-term debt (Compustat item DLTT) divided by total assets (Compustat item AT) at the end of year t.
ZSCORE Altman (1968) Z score at the end of year t (Data Source: Compustat).
RZSCORE Decile rank of Altman (1968) z score at the end of year t (Data Source: Compustat).
SWAPRATE 5-year interest rate swap rate at the month of SOX404 filing date (Data Source: Federal Reserve Bank Interest Rates monthly data).
TERMSLOPE
Term slope is the rate equal to the 10-year Maturity-Constant Treasure Rate minus the 2-year Maturity-Constant Treasure Rate at the month of the SOX404 filing date (Data Source: Federal Reserve Bank Interest Rates monthly data).
SEG The log of one plus the sum of the number of business and geographic segments reported for the firm in year t (Data Source: Compustat Segment Data).
FOREIGN An indicator variable equal to 1 if the firm has a non-zero foreign currency transaction in year t, and 0 otherwise (Compustat item FCA).
M&A Proportion of the current and prior four years that a firm is involved in merger & acquisition activities (Compustat items SALE_FN).
RESTRUCTURE Proportion of the current and prior four years (year t, t-1, t-2, t-3, and t-4) that a firm is involved in restructuring activities (Compustat items RCP, RCA, RCEPS, and RCD).
SALE GROWTH Average sales growth in the past five years as (Compustat item SALE) in the current and previous four years (year t, t-1, t-2, t-3, and t-4).
BM Book-to-market ratio as (Compustat items CEQ/(PRCC_F×CSHO)) at the end of year t.
INVENTORY Inventory scaled by total assets (Compustat items INVT/AT) at the end of year t.
SIZE The log of total assets at the end of year t (Compustat item: AT).
% LOSS Proportion of the current and prior four years (year t, t-1, t-2, t-3, and t-4) that a firm reports negative earnings (Compustat item: NI).
BIG AUDITOR
An indicator variable that is equal to 1 if a firm engaged one of the six largest audit firms, and 0 otherwise in year t (Data Source: Compustat). The largest six audit firms include PWC, Deloitte & Touche, Ernst & Young, KPMG, Grant Thornton, and BDO Seidman.
27
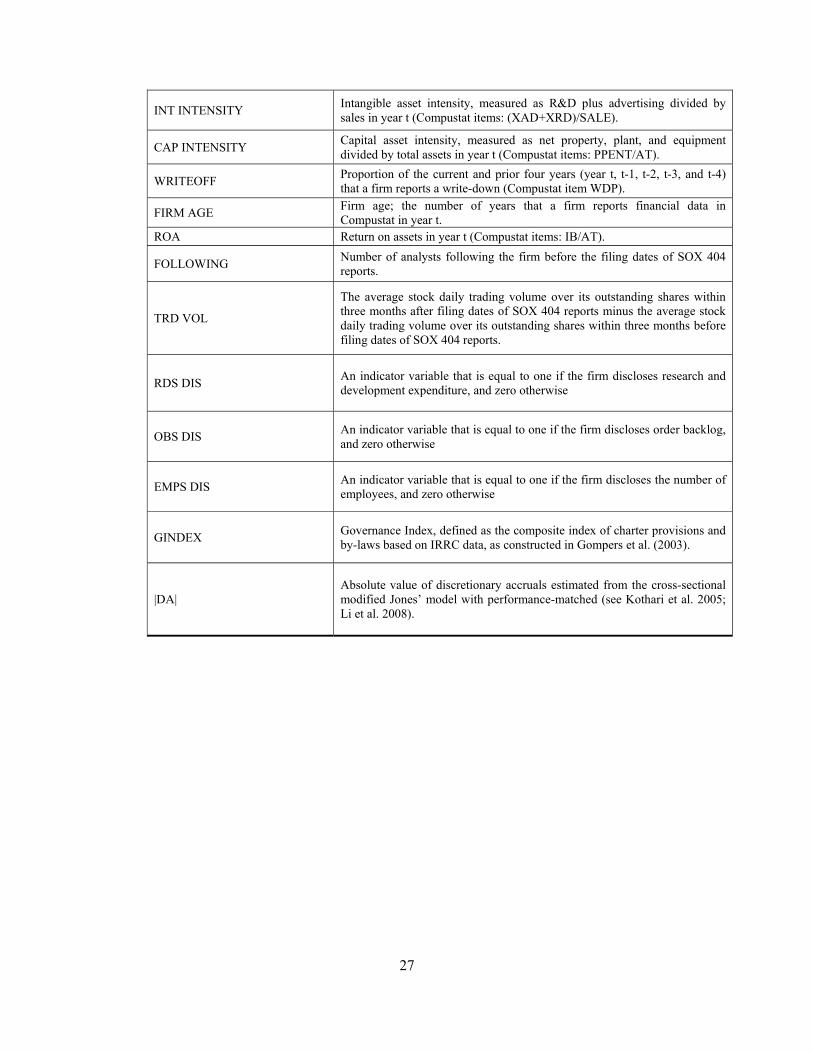
INT INTENSITY Intangible asset intensity, measured as R&D plus advertising divided by sales in year t (Compustat items: (XAD+XRD)/SALE).
CAP INTENSITY Capital asset intensity, measured as net property, plant, and equipment divided by total assets in year t (Compustat items: PPENT/AT).
WRITEOFF Proportion of the current and prior four years (year t, t-1, t-2, t-3, and t-4) that a firm reports a write-down (Compustat item WDP).
FIRM AGE Firm age; the number of years that a firm reports financial data in Compustat in year t.
ROA Return on assets in year t (Compustat items: IB/AT).
FOLLOWING Number of analysts following the firm before the filing dates of SOX 404 reports.
TRD VOL
The average stock daily trading volume over its outstanding shares within three months after filing dates of SOX 404 reports minus the average stock daily trading volume over its outstanding shares within three months before filing dates of SOX 404 reports.
RDS DIS An indicator variable that is equal to one if the firm discloses research and development expenditure, and zero otherwise
OBS DIS An indicator variable that is equal to one if the firm discloses order backlog, and zero otherwise
EMPS DIS An indicator variable that is equal to one if the firm discloses the number of employees, and zero otherwise
GINDEX Governance Index, defined as the composite index of charter provisions and by-laws based on IRRC data, as constructed in Gompers et al. (2003).
|DA| Absolute value of discretionary accruals estimated from the cross-sectional modified Jones’ model with performance-matched (see Kothari et al. 2005; Li et al. 2008).
28
Table 1: Summary Statistics
Variable Mean StdDev P25 Median P75
MW 0.070 0.255 0 0 0
CDS SPREAD 80.270 107.672 23.667 42.833 86.167
Log (CDS SPREAD) 3.855 0.987 3.164 3.757 4.456
RDS DIS 0.211 0.352 0 0 0.402
OBS DIS 0.186 0.348 0 0 0.221
EMPS DIS 0.342 0.426 0 0 0.560
GINDEX 9.793 2.422 8.000 9.080 12.000
|DA| 0.043 0.041 0.013 0.034 0.065
STOCKRET 0.034 0.128 -0.035 0.025 0.098
VOL_RET 0.246 0.087 0.185 0.228 0.289
LEVERAGE 0.242 0.156 0.135 0.210 0.315
RZSCORE 4.850 1.721 4.000 5.000 6.000
SWAPRATE 4.874 0.352 4.560 5.020 5.150
TERMSLOPE 0.232 0.386 -0.100 -0.010 0.770
SEG 1.540 0.815 1.099 1.792 2.079
FOREIGN 0.272 0.445 0 0 1.000
M&A 0.238 0.262 0 0.200 0.400
RESTRUCTURE 0.412 0.347 0 0.400 0.800
SALE GROWTH 0.114 0.171 0.028 0.075 0.156
BM 0.416 0.257 0.259 0.396 0.569
INVENTORY 0.099 0.121 0.013 0.058 0.142
SIZE 9.440 1.199 8.537 9.366 10.234
%LOSS 0.122 0.206 0 0 0.200
BIG AUDITOR 0.990 0.100 1.000 1.000 1.000
INT INTENSITY 0.031 0.055 0 0.011 0.040
CAP INTENSITY 0.319 0.236 0.126 0.263 0.511
WRITEOFF 0.259 0.251 0 0.200 0.400
FIRM AGE 35.389 17.652 18.000 37.000 54.000
ROA 0.054 0.061 0.026 0.050 0.087
FOLLOWING 14.822 6.858 10.000 14.000 19.000
TRD VOL 0.099 0.256 -0.051 0.098 0.241
LONG TERM DEBT (Mil. $) 8,508.03 31,996.98 927.27 2,521.11 5,673.5
TOTAL ASSETS (Mil. $) 42,814.44 131,275.95 5,097.86 11,704.5 27,858.25
MARKET VALUE (Mil. $) 23,785.22 39,552.28 4,461.75 10,643.39 23,120.89
This table reports the summary statistics of our sample. Our sample consists of 887 firm-year observations from fiscal year 2004 to 2006 covering 422 unique companies. See the appendix for variable definitions.
29
Table 2: Event Studies on Material Weakness Disclosures
CDS Spread Change Cumulative Stock Return
Event Window [-1, 1] N. Mean t-stats. Mean t-stats.
Raw Change/Return
All SOX 404 MW disclosures 72 1.777 (2.02)** 0.289 (0.53)
First time SOX 404 MW disclosure 53 2.195 (1.88)** 0.323 (0.54)
Adjusted Change/Return
All SOX 404 MW disclosures 71 1.802 (2.02)** 0.212 (0.42)
First time SOX 404 MW disclosure 52 2.237 (1.88)** 0.258 (0.45)
Event Window [-2, 2]
Raw Change/Return
All SOX 404 MW disclosures 72 1.508 (1.89)** 0.342 (0.59)
First time SOX 404 MW disclosure 53 1.727 (1.66)* 0.248 (0.50)
Adjusted Change/Return
All SOX 404 MW disclosures 71 1.529 (1.89)** 0.282 (0.45)
First time SOX 404 MW disclosure 52 1.76 (1.66)* 0.263 (0.46)
CDS changes are the percentage changes of CDS daily closing spreads from the beginning of the event window to the end of the window. ***, **, * denote significance at the 0.01, 0.05, 0.10 levels, respectively.
30
Table 3: Internal Control Quality and CDS Spreads
Variable Log(CDS SPREAD)
INTERCEPT 5.627 (6.47) *** 5.250 (5.96) ***
MW 0.297 (2.44) ** 0.248 (2.10) **
VOL_RET 2.896 (7.06) *** 2.991 (7.13) ***
LEVERAGE 0.734 (2.34) ** 0.664 (2.19) **
RZSCORE -0.124 (-3.55) *** -0.124 (-3.54) ***
SWAPRATE -0.093 (-0.70) -0.088 (-0.67)
TERMSLOPE 0.467 (2.88) *** 0.480 (2.8) ***
SEG -0.054 (-1.12) -0.047 (-0.93)
FOREIGN 0.038 (0.57) 0.057 (0.85)
M&A -0.007 (-0.07) -0.006 (-0.06)
RESTRUCTURE 0.201 (2.30) ** 0.183 (2.07) **
SALE GROWTH 0.103 (0.73) 0.113 (0.77)
BM 0.622 (4.44) *** 0.564 (4.08) ***
INVENTORY 0.460 (0.84) 0.452 (0.84)
SIZE -0.285 (-6.41) *** -0.245 (-5.00) ***
%LOSS 0.319 (1.92) * 0.304 (1.83) *
BIG AUDITOR -0.220 (-0.65) -0.175 (-0.53)
INT INTENSITY -0.090 (-0.17) -0.005 (-0.01)
CAP INTENSITY -0.172 (-0.68) -0.128 (-0.50)
WRITEOFF 0.269 (2.21) ** 0.255 (2.15) **
FIRM AGE -0.008 (-4.43) *** -0.009 (-4.62) ***
ROA -2.529 (-3.08) *** -2.234 (-2.80) ***
RDS_DIS 0.078 (0.83)
OBS_DIS -0.134 (-1.57)
EMPS_DIS -0.041 (-0.54)
GINDEX 0.004 (0.42)
|DA| 0.526 (0.95)
STOCKRET -0.139 (-0.71)
FOLLOWING -0.011 (-1.99) **
TRD VOL 0.190 (1.29)
Year & Industry Fixed Effect Included Included
# of Obs. 887 887
Adjusted R2 0.6618 0.6664
This table reports the regression results of Equation (1). The dependent variable is log(CDS SPREAD) of three month CDS spreads. The independent variables are MW (internal control material weaknesses) and the control variables, which are described in the appendix. t-values are in parentheses.***, **, * denote significance at the 0.01, 0.05, 0.10 levels, respectively. The standard errors are estimated by clustering firms. See the appendix for variable definitions.
31
Table 4: Severity of Internal Control Quality and CDS Spreads
Variable Log(CDS SPREAD)
INTERCEPT 5.722 (6.52) *** 5.354 (6.08) ***
ACCOUNT SPECIFIC MW 0.089 (0.47) 0.047 (0.26)
COMPANY-LEVEL MW 0.440 (2.76) *** 0.388 (2.38) **
VOL_RET 2.889 (7.19) *** 2.989 (7.28) ***
LEVERAGE 0.732 (2.29) ** 0.665 (2.16) **
RZSCORE -0.123 (-3.55) *** -0.124 (-3.54) ***
SWAPRATE -0.109 (-0.82) -0.103 (-0.78)
TERMSLOPE 0.416 (2.44) ** 0.431 (2.43) **
SEG -0.055 (-1.12) -0.048 (-0.94)
FOREIGN 0.036 (0.54) 0.055 (0.82)
M&A 0.001 (0.01) 0.003 (0.03)
RESTRUCTURE 0.203 (2.32) ** 0.185 (2.11) **
SALE GROWTH 0.099 (0.71) 0.109 (0.76)
BM 0.633 (4.55) *** 0.576 (4.19) ***
INVENTORY 0.481 (0.88) 0.477 (0.88)
SIZE -0.285 (-6.33) *** -0.247 (-4.97) ***
%LOSS 0.323 (1.99) ** 0.309 (1.89) *
BIG AUDITOR -0.221 (-0.65) -0.177 (-0.53)
INT INTENSITY -0.022 (-0.04) 0.053 (0.09)
CAP INTENSITY -0.169 (-0.67) -0.126 (-0.49)
WRITEOFF 0.271 (2.24) ** 0.256 (2.18) **
FIRM AGE -0.008 (-4.42) *** -0.009 (-4.63) ***
ROA -2.512 (-3.15) *** -2.217 (-2.84) ***
RDS_DIS 0.074 (0.78)
OBS_DIS -0.136 (-1.58)
EMPS_DIS -0.040 (-0.52)
GINDEX 0.004 (0.41)
|DA| 0.528 (0.95)
STOCKRET -0.149 (-0.76)
FOLLOWING -0.010 (-1.89) *
TRD VOL 0.193 (1.38)
Year & Industry Fixed Effect Included Included
# of Obs 887 887
Adjusted R2 0.6635 0.6680
This table reports the regression results of Equation (2). The dependent variable is log(CDS SPREAD) of three month CDS spreads. The independent variables are MW (internal control material weaknesses) and the control variables, which are described in the appendix. t-values are in parentheses.***, **, * denote significance at the 0.01, 0.05, 0.10 levels, respectively. The standard errors are estimated by clustering firms. See the appendix for variable definitions.
32
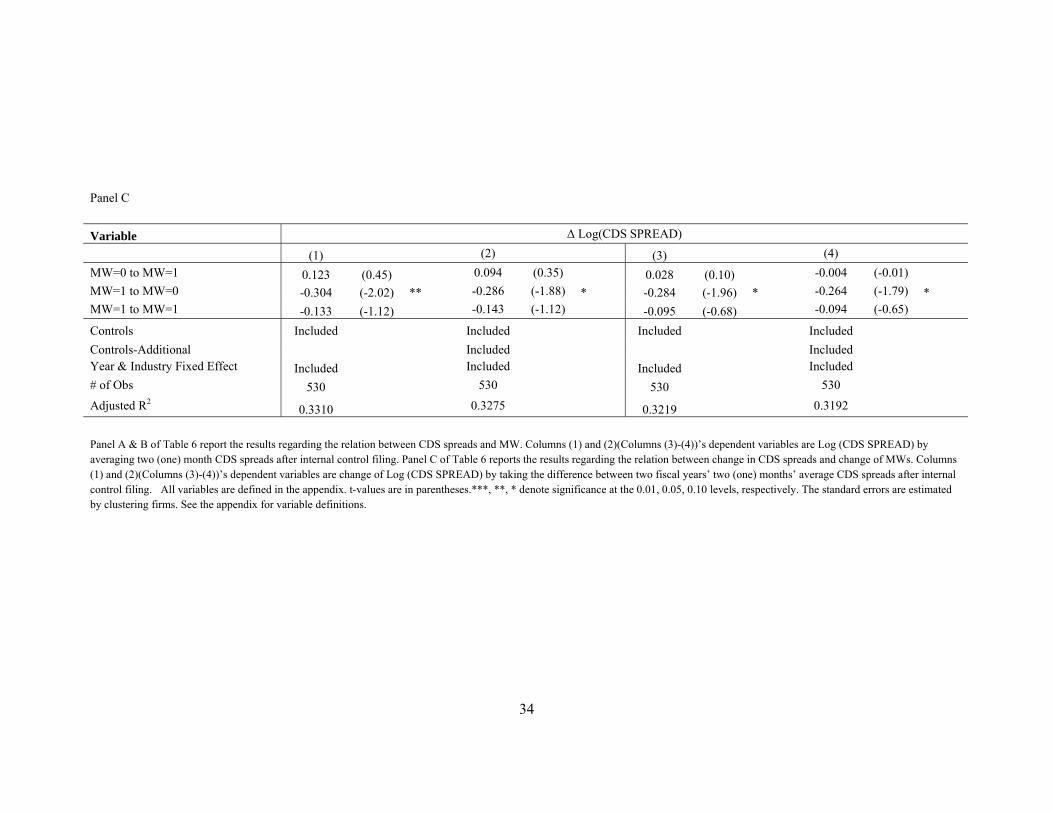
Table 5: Change in Internal Control Quality and the CDS Spread Change
The dependent variable is change of log(CDS SPREADS) of 3-month CDS spreads. The independent variables are MW (internal control material weaknesses) and the control variables, which are described in the appendix. t-values are in parentheses.***, **, * denote significance at the 0.01, 0.05, 0.10 levels, respectively. The standard errors are estimated by clustering firms. See the appendix for variable definitions.
Controls-Additional Included IncludedYear & Industry Fixed Effect Included Included Included Included
# of Obs 530 530 530 530
Adjusted R2 0.3310 0.3275 0.3219 0.3192
Panel A & B of Table 6 report the results regarding the relation between CDS spreads and MW. Columns (1) and (2)(Columns (3)-(4))’s dependent variables are Log (CDS SPREAD) by averaging two (one) month CDS spreads after internal control filing. Panel C of Table 6 reports the results regarding the relation between change in CDS spreads and change of MWs. Columns (1) and (2)(Columns (3)-(4))’s dependent variables are change of Log (CDS SPREAD) by taking the difference between two fiscal years’ two (one) months’ average CDS spreads after internal control filing. All variables are defined in the appendix. t-values are in parentheses.***, **, * denote significance at the 0.01, 0.05, 0.10 levels, respectively. The standard errors are estimated by clustering firms. See the appendix for variable definitions.