Page 1
USF AREA MULTIMODAL TRANSPORTATION DISTRICT
University of South Florida Area
Multimodal Transportation District
Study Area Evaluation & Transportation Needs
Prepared for Hillsborough County
By Jacobs Engineering Group
May 25, 2010
Page 2
USF AREA MULTIMODAL TRANSPORTATION DISTRICT
Page 1
EXECUTIVE SUMMARY ............................................................................................... 2
1.0 STUDY BACKGROUND ..................................................................................... 6
2.0 MULTIMODAL DISTRICT EVALUATION ....................................................... 8 2.1 Study Area Boundary ..................................................................................................... 8 2.2 Multimodal Mobility and Land Use Evaluation ........................................................... 10
2.2.1 Appropriate Scale of Development ......................................................................................... 10 2.2.2 Land Use Diversity ................................................................................................................. 10 2.2.3 Appropriate Density, Intensity, and Organization of Land Uses ........................................... 14 2.2.4 Interconnected Multimodal Network ..................................................................................... 18 2.2.5 Quality and Level of Service (Q/LOS) for Each Mode ............................................................ 25
2.3 MMTD Evaluation Summary ....................................................................................... 31
3.0 MULTIMODAL TRANSPORTATION NEEDS ................................................ 32 3.1 Development of Multimodal Needs ............................................................................. 32
3.1.1 Agency Stakeholders ............................................................................................................... 33 3.1.2 Public Meetings ....................................................................................................................... 33 3.1.3 Initial Input Provided ............................................................................................................. 34 3.1.4 Additional Input Provided ..................................................................................................... 35
3.2 Needed Projects for Multimodal Transportation .......................................................... 36
APPENDIX A: PUBLIC MEETING QUESTIONNAIRE RESULTS (SEPT. 9, 2009) ............................... 38
APPENDIX B: PUBLIC MEETING MAP AND CHART BOARDS (SEPT. 9, 2009) ............................... 44
APPENDIX C: PUBLIC MEETING MAP AND CHART BOARDS (DEC. 7, 2009) ................................ 46
APPENDIX D: PUBLIC MEETING GENERAL COMMENTS (DEC. 7, 2009) ........................................ 59
APPENDIX E: IMPROVEMENTS SUMMARY LIST WITH COST BY CORRIDOR WITH MAPS ..... 60
APPENDIX F: PRIORITIZED IMPROVEMENTS SUMMARY LIST WITH COST BY CORRIDOR .. 66
APPENDIX G: IMPROVEMENTS LIST DETAILED BY CORRIDOR SEGMENT ............................... 72
Page 3
USF AREA MULTIMODAL TRANSPORTATION DISTRICT
Page 2
EXECUTIVE SUMMARY
The Hillsborough County Metropolitan Planning Organization (MPO) and the
Hillsborough County Planning and Growth Management Department worked in
partnership with stakeholders and local residents to plan for a Multimodal
Transportation District (MMTD) in the University of South Florida (USF) area of
Hillsborough County. The goals of this effort are to facilitate the use of multiple modes
of transportation that will lead to a reduction in automobile use and vehicle miles
traveled, to create opportunities for long‐term funding of multimodal improvements,
and to help meet community objectives for encouraging infill and redevelopment. The
designation of such districts recognizes the inherent integral relationship between
transportation, land use, and urban design, and the degree to which these elements
affect each other.
The USF Area was selected for many reasons. First, because it is a growing regional
activity center with a diverse and dense mix of residents, students and employees, with
access to a variety of places including the university campus, other schools, hospitals,
parks, public services, and commercial centers. Second, some multimodal
improvements are already in the works. These include the Fletcher Avenue Pedestrian
Safety Study and related improvements, 22nd Street enhancement project recently
completed that provides a model for other corridors in the area, and the new
“MetroRapid” Bus Rapid Transit (BRT) service scheduled to begin soon along Fletcher
and Nebraska Avenues. Third, roads are congested with vehicles, and redevelopment
is hindered by costly mitigation requirements for roadway Level of Service (LOS). Last,
there are transit riders, bicyclists, and pedestrians in this area, indicating that
improvements of these modes will be used if provided.
Creation of an MMTD requires a review of the area to ensure that it meets certain
criteria, analysis of existing and proposed pedestrian, bicycle, and transit LOS,
identification of needed pedestrian, bicycle, transit, and roadway improvements that
will improve inadequate LOS in the MMTD, and development of a plan to implement
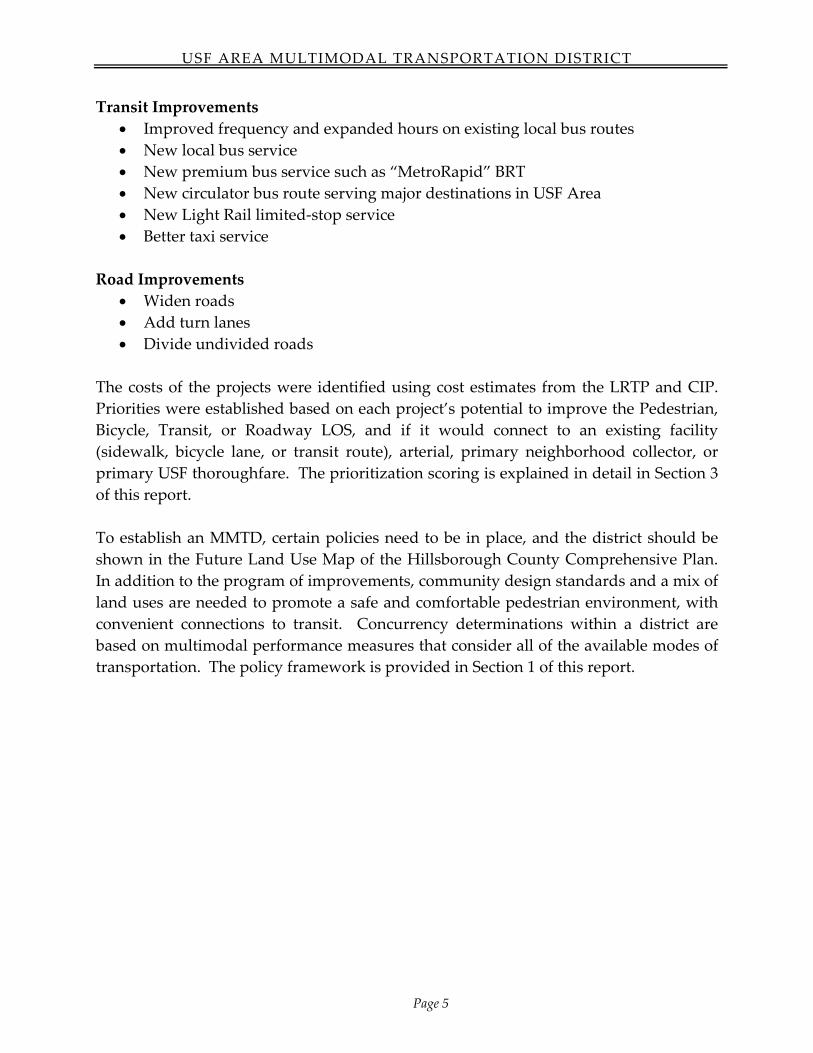
the improvements. The proposed boundaries of the USF Area MMTD are Sinclair Hills
Road and Bearss Avenue to the north, Interstate 275 to the west, Fowler Avenue to the
south, and 56th Street to the east. A map of this 8‐square mile area is shown in Figure
2.1: USF Area MMTD Study Area Location Map.
Using the Florida Department of Transportation’s Multimodal Transportation Districts
and Area‐wide Quality of Service Handbook (November 2003), the existing conditions
analysis was completed. It was determined that the USF Area qualifies as a Regional
Center type of MMTD. As shown in detail in Section 2 of this report, the USF Area has
Page 4
USF AREA MULTIMODAL TRANSPORTATION DISTRICT
Page 3
many assets relating to land use and transportation, and also has conditions in need of
improvement, as follows.
Land Use and Transportation Assets
Diverse mix of land uses
Dense residential uses
Primary and supporting uses within walking distance
Appropriate organization of land uses along corridors
Walking is significant mode of travel
Multiple bus services available
Bus hub is located within the proposed District
Adequate LOS and Quality of Service (QOS) for bicycle use
Conditions Needing Improvement
Employment intensity areawide
Connectivity of street network
LOS and QOS for pedestrian and transit uses
Central Core and relation of supporting uses.
These conditions were reviewed by the study team, agency stakeholders, and members
of the public, in order to determine the needed improvements. Stakeholders included
representatives from USF, University Area Community Development Council, Tampa
Homeowners Association of Neighborhoods, Hillsborough County School District,
Hillsborough County City‐County Planning Commission, FDOT, Tampa Bay Area
Regional Transportation Authority (TBARTA), Hillsborough Area Regional Transit
(HART), City of Temple Terrace, City of Tampa, Senator Victor Crist’s Office, and Bay
Area Commuter Services. The stakeholder group met at the USF Center for Urban
Transportation Research (CUTR) on June 30, 2009 and October 1, 2009. Members of the
group provided comments on report drafts at each meeting. The Hillsborough County
Transportation Task Force also provided review and guidance.
Two public meetings were held to discuss existing conditions and needed
improvements in the USF Area. These public meetings were held on September 9, 2009
and December 7, 2009, at 6:30 p.m., at the University Area Community Center at 14013
N. 22nd Street in Tampa. At these meetings, the Hillsborough County Public Works
Department also discussed the Fletcher Avenue Pedestrian Safety being conducted
because the area surrounding Fletcher Ave. from 15th Street to 46th Street has been
identified as having one of the highest pedestrian crash rates in unincorporated
Hillsborough County. The study considers new road and traffic safety features and
Page 5
USF AREA MULTIMODAL TRANSPORTATION DISTRICT
Page 4
includes a street lighting analysis, traffic conditions analysis, and pedestrian safety
education campaign.
Needed multimodal improvements are shown in detail in Section 3 of this report. The
program of improvements is based on public comments and approved plans.
The approved plans reviewed for developing the list of projects were:
Hillsborough County MPO 2035 Long‐Range Transportation Plan (LRTP) Needs
Assessment, 2009.
Adopted Hillsborough County Capital Improvements Plan (CIP) for Fiscal Years
2011‐2015, November 2009.
Hillsborough County Comprehensive Plan, August 2008.
The University Area Community and North 22nd Street Master Plans, October
2007.
2005 Tampa Campus Master Plan Update, October 2006.
HART Transit Emphasis Corridor Improvement Planning and Design Services
Study, March 2008.
North South Corridor BRT Project Development and Environment (PD&E) Study
Preliminary Engineering Report, October 2009.
Types of improvements include the following, in various locations through the USF
Area. Pedestrian Improvements
Sidewalks
Intersection improvements such as ADA curb‐cuts, crosswalks and pedestrian
signals
Pedestrian enhancements such as landscaping and lighting
Drainage improvements
New multi‐use trails
Bicycle Improvements
Bicycle lanes
Wider and more clearly defined bicycle lanes
Bicycle signals
Motorist and bicycle safety and education
Bicyclist amenities such as secure bike storage boxes
New multi‐use trails
Page 6
USF AREA MULTIMODAL TRANSPORTATION DISTRICT
Page 5
Transit Improvements
Improved frequency and expanded hours on existing local bus routes
New local bus service
New premium bus service such as “MetroRapid” BRT
New circulator bus route serving major destinations in USF Area
New Light Rail limited‐stop service
Better taxi service
Road Improvements
Widen roads
Add turn lanes
Divide undivided roads
The costs of the projects were identified using cost estimates from the LRTP and CIP.
Priorities were established based on each project’s potential to improve the Pedestrian,
Bicycle, Transit, or Roadway LOS, and if it would connect to an existing facility
(sidewalk, bicycle lane, or transit route), arterial, primary neighborhood collector, or
primary USF thoroughfare. The prioritization scoring is explained in detail in Section 3
of this report.
To establish an MMTD, certain policies need to be in place, and the district should be
shown in the Future Land Use Map of the Hillsborough County Comprehensive Plan.
In addition to the program of improvements, community design standards and a mix of
land uses are needed to promote a safe and comfortable pedestrian environment, with
convenient connections to transit. Concurrency determinations within a district are
based on multimodal performance measures that consider all of the available modes of
transportation. The policy framework is provided in Section 1 of this report.
Page 7
USF AREA MULTIMODAL TRANSPORTATION DISTRICT
Page 6
1.0 STUDY BACKGROUND
In 1999, the MMTD option was introduced into the Florida Growth Management Act as
an alternative method to manage the traffic impacts of growth in areas where the
provision of alternate modes of travel, supported by appropriate land uses, could
reasonably enable a local government to consider a multimodal LOS standard in lieu of
typical roadway LOS criteria. Section 163.3180(15)(a), Florida Statutes (F.S.), provides
guidance to local jurisdictions for use in developing community improvements that
support walking, bicycling, and transit use by establishing MMTDs. It also enables
jurisdictions to develop transportation concurrency policies that encourage the
development of a high quality multimodal environment.
Further, the development of an MMTD strategy is defined below by Florida
Department of Transportation (FDOT) Model Regulations and Plan Amendments for
Multimodal Transportation Districts (CUTR, April 2004):
A multimodal transportation district is an area where primary priority is placed on
assuring a safe, comfortable, and attractive pedestrian environment, with convenient
interconnection to transit. Communities must incorporate community design features
that reduce vehicular usage while supporting an integrated multimodal transportation
system. Common elements include the presence of mixed‐use activity centers,
connectivity of streets and land uses, transit‐friendly design features, and accessibility to
alternative modes of transportation. The Florida Department of Transportation has
developed a Multimodal Transportation Districts and Area‐wide Quality of Service
Handbook (FDOT, November 2003) to provide guidance on the designation and
planning of multimodal transportation districts as provided in Florida’s growth
management legislation. The handbook provides for multimodal transportation district
designation in a downtown or urban core area, regional activity center, or traditional
town or village, in accordance with certain criteria. In these areas, planning efforts would
focus on enhancing multimodal elements, guiding redevelopment, and encouraging
appropriate infill.
A multimodal transportation district could also be applied to a new or emerging area,
where adopted plans and regulations would need to ensure the internal and external
connectivity, a mix of uses, densities, and urban design features necessary to support
alternative modes of transportation.
Implementation of multimodal LOS standards may provide a framework for
establishing multimodal mitigation requirements as part of the municipality’s land
development code and concurrency management system. Additional requirements
were established by the Florida Legislature on July 8, 2009 by Senate Bill 360, the
Page 8
USF AREA MULTIMODAL TRANSPORTATION DISTRICT
Page 7
Community Renewal Act. Specifically, amendments to Section 163.3180(5)(b), F.S.
designate Transportation Concurrency Exception Areas (TCEAs) in local governments
qualifying as Dense Urban Land Areas (DULAs). Because Hillsborough County
qualifies as a DULA, it is designated as a TCEA. Within two years of the TCEA
becoming effective (July 8, 2011), Hillsborough County must amend its local
comprehensive plan to include ʺland use and transportation strategies to support and
fund mobility within the exception area, including alternative modes of transportation.ʺ
This study takes the first step to developing these land use and transportation
strategies, and to set up the policy framework for mobility. For the USF Area MMTD in
Hillsborough County, the study identifies improvements to promote quality
multimodal service if minimum automobile LOS standards are exceeded by proposed
developments. This long‐term management strategy would look beyond the five‐year
Capital Improvements Element of the Comprehensive Plan and would evaluate the
total potential for development within the proposed MMTD during a predetermined
planning horizon. Comprehensive Plan policy language can be tailored for MMTDs in
Hillsborough County as they are defined in Florida law.
Page 9
USF AREA MULTIMODAL TRANSPORTATION DISTRICT
Page 8
2.0 MULTIMODAL DISTRICT EVALUATION
Since Senate Bill 360 effectively designated Hillsborough County as a TCEA on July 8,
2009, the County and the USF Area is technically not required to meet the specific
Multimodal Transportation District (MMTD) requirements set by FDOT, the criteria
remain an effective way to evaluate the study area as a proposed MMTD. As explained
in the previous Section 1, Hillsborough County must amend its local comprehensive
plan to include ʺland use and transportation strategies to support and fund mobility
within the exception area, including alternative modes of transportationʺ by July 8,
2011. Therefore, the MMTD evaluation is relevant to developing the strategies.
Evaluating the existing conditions present within the University of South Florida (USF)
Area will assist in identifying the feasibility of implementing an MMTD. The criteria
used are from the Multimodal Transportation Districts and Areawide Quality of Service
Handbook (MMTD Handbook), published by the Florida Department of Transportation
in 2003. Using the MMTD Handbook as a guide, the following evaluation will
determine whether multimodal infrastructure planning is a feasible response to an
area’s mobility needs.
The data used for this MMTD evaluation comes from the Hillsborough County MPO,
Planning Commission, Property Appraiser, the Tampa Bay Regional Planning Model
(TBRPM), the Cities of Tampa and Temple Terrace, the Florida Geographic Data
Library, and Hillsborough Area Regional Transit. The jobs and population forecasts
used in this evaluation are based on data from the TBRPM Transportation Analysis
Zones (TAZs) for 2006. Although the USF Area MMTD Study Area boundary does not
exactly match the TAZ boundaries, the limits match closely enough to provide an
appropriate level of analysis for the following evaluation.
2.1 Study Area Boundary
The USF Area MMTD study area is located northeast and adjacent to the City of Tampa
including the USF campus and the area northeast of campus to I‐275 and Sinclair Hills
Road, as shown in Figure 2.1.
Page 10
USF AREA MULTIMODAL TRANSPORTATION DISTRICT
Page 9
Figure 2.1: USF Area MMTD Study Area Location Map
Source: Hillsborough County MPO.
Page 11
USF AREA MULTIMODAL TRANSPORTATION DISTRICT
Page 10
2.2 Multimodal Mobility and Land Use Evaluation
The MMTD Handbook is a guide for evaluating the land use and transportation
features necessary to establish a successful MMTD. Based on the direction provided by
the MMTD Handbook, the following criteria have been evaluated for the USF Area:
Appropriate Scale of Development;
Complementary Mix of Land Uses;
Appropriate Density, Intensity and Organization of Land Uses;
Connectivity;
Level of Service for Each Mode; and,
Areawide Quality of Service for Each Mode.
2.2.1 Appropriate Scale of Development
An MMTD should be a sufficient size, in population and jobs, to support various uses
and transportation alternatives, contain a variety of land uses including residential and
employment, and provide scheduled transit service. The MMTD Handbook identifies a
minimum of 5,000 residents and a minimum of 2 to 1 population to jobs ratio. The
Tampa Bay Regional Planning Model (TBRPM) Traffic Analysis Zone (TAZ) data for
2006 was used for this analysis. Within the eight square mile study area, there are over
40,000 residents and 40,000 jobs. The population to job ratio is approximately 1 persons
per job. As shown in Table 2.1, the USF Area meets and exceeds the minimum
requirements for both criteria.
Table 2.1: USF Area Population and Employees
Population Jobs Population:
Jobs Ratio
44,599 44,577 1
Source: Hillsborough County MPO and Tampa Bay Regional Planning Model (TAZ data), 2006.
2.2.2 Land Use Diversity
The effective organization and mix of land uses can help reduce the number of
automobile trips and promote pedestrian, bicycle and transit trips. The MMTD should
have three or more land uses that are mutually supporting. Due to its size, population,
number of jobs, and character of development, the USF Area qualifies as a “Regional
Center” type of MMTD, according to the MMTD Handbook.
Page 12
USF AREA MULTIMODAL TRANSPORTATION DISTRICT
Page 11
The MMTD Handbook identifies significant (or highly desirable) land uses, and
supporting (or contributing) land uses. The significant uses are: Center Office, Regional
Shopping Centers, Hospitals, Recreational, Cultural, Schools and Colleges,
Governmental/Institutional, and Residential 8 to 24 units per acre. All of these uses are
found within the USF Area, with the exception of Center Office. The supporting uses in
the MMTD Handbook located in the USF Area are: Medical Office, Hotels, Theaters,
Restaurants, Retail, Day Care, and Light Industrial.
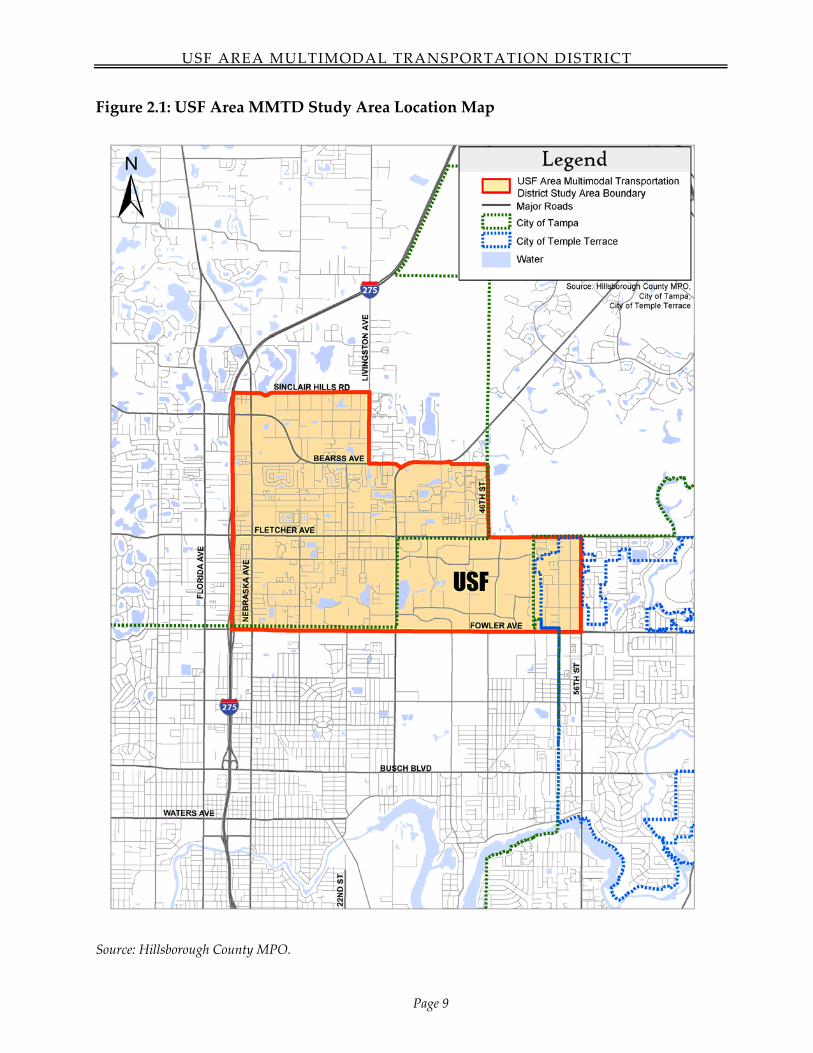
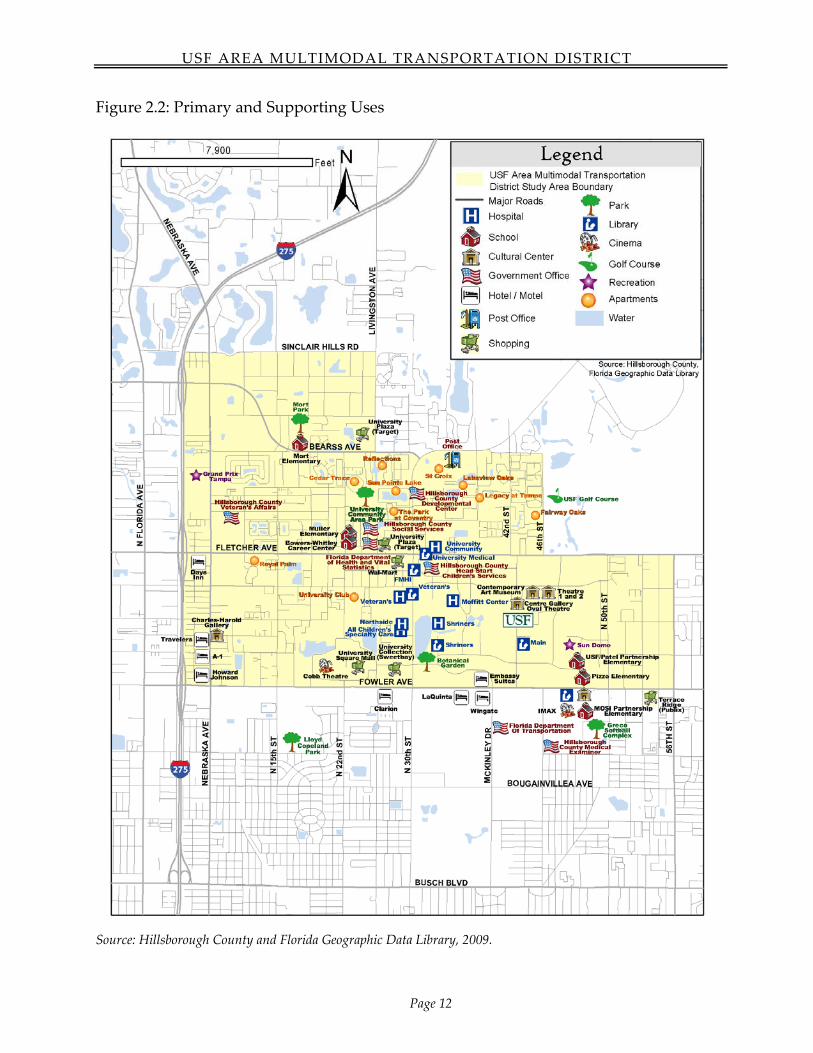
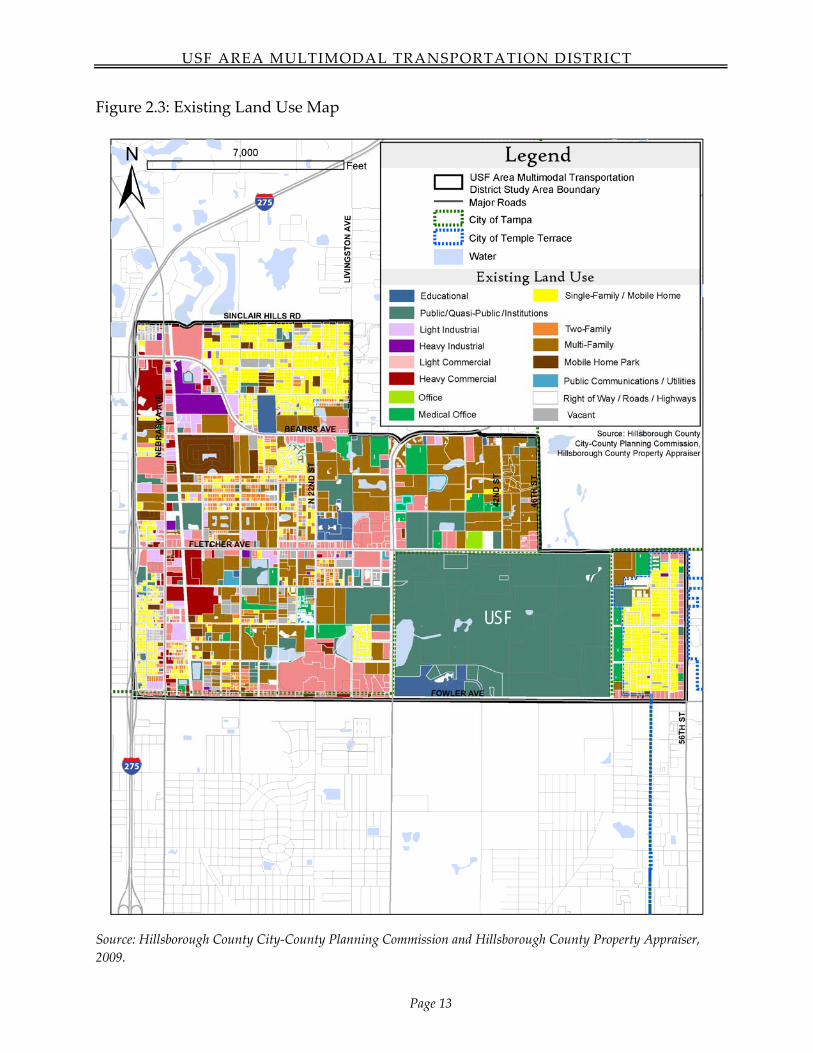
The primary land uses in the USF Area are Public/Institutions (25%), multi‐family
residential (20%), light commercial (11%), and single‐family residential (11%). The
locations of existing land uses are shown in Figure 2.2 and Figure 2.3. Figure 2.4 shows
a chart of existing land use composition. The significant uses in the USF Area and
surrounding area are listed below.
Recreational (Mort Park, University Community Area Park, and USF Botanical
Garden);
Governmental (Hillsborough County Veteran’s Affairs, Developmental Center,
Social Services Neighborhood Center and Head Start Division of Children’s
Services; Florida Department of Health and Vital Statistics; and U.S. Post Office);
Regional Shopping Centers (University Square Mall);
Schools/Colleges (USF, Mort and Muller Elementary Schools, and Bowers
Whitley Career Center/High School);
Hospitals (University Community Hospital, James A. Haley Veteran’s Hospital,
Moffitt Cancer Center and Research Institute, Shriners Hospital for Children, and
Northside All Children’s Specialty Care);
Libraries (USF Main Library, University Medical Library, Louis de La Parte
Research Library, Veteran’s Library, and Shriners Library);
Cultural (USF Theater, USF Contemporary Art Museum, art galleries, Cobb
Cinema, Museum of Science and Industry, IMAX Theater, etc.); and
Multi‐Family Residential (USF dormitories, St. Croix, Fairway Oaks, Reflections,
Cedar Trace, Sun Pointe Lake, etc.).
Page 13
USF AREA MULTIMODAL TRANSPORTATION DISTRICT
Page 12
Figure 2.2: Primary and Supporting Uses
Source: Hillsborough County and Florida Geographic Data Library, 2009.
Page 14
USF AREA MULTIMODAL TRANSPORTATION DISTRICT
Page 13
Figure 2.3: Existing Land Use Map
Source: Hillsborough County City‐County Planning Commission and Hillsborough County Property Appraiser,
2009.
USF
Page 15
USF AREA MULTIMODAL TRANSPORTATION DISTRICT
Page 14
Figure 2.4: Existing Land Use Composition
Source: Hillsborough County City‐County Planning Commission and Hillsborough County Property Appraiser,
2009.
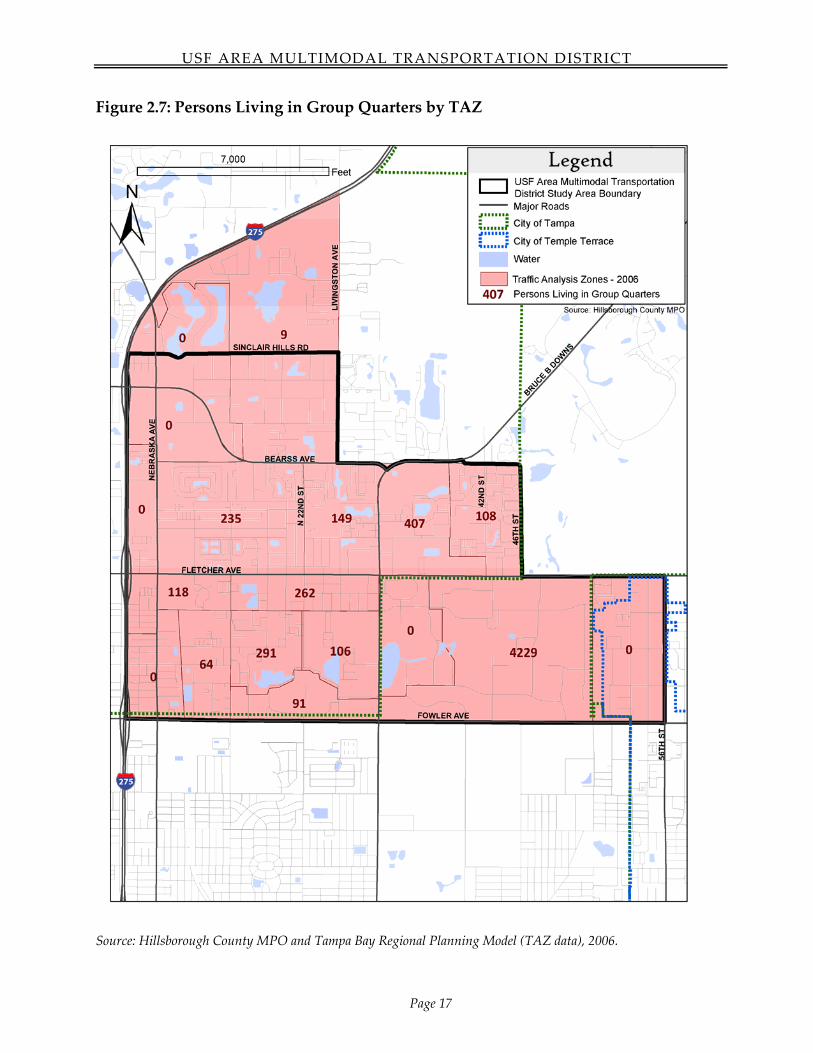
2.2.3 Appropriate Density, Intensity, and Organization of Land Uses
The MMTD Handbook indicates that marginal transit supportive densities may be
realized with residential densities of 4 dwelling units per acre and employment
intensities of 40 employees per acre. The USF Area far exceeds the minimum residential
density, at approximately 13 units per acre areawide. However, there are only
approximately 21 employees per acre areawide. There are high concentrations of
employees at 60 or more per acre along the 30th Street corridor, as shown in Figure 2.5.
The highest concentrations of dwelling units at 15 or more units per acre occur along
Fletcher Avenue, as shown in Figure 2.6. Since USF has several dormitories, it is
important to also show the number of persons living in group quarters, since these are
not accounted for as dwelling units. There are 6,575 people living in group quarters in
the USF Area, or 939 people per acre, in addition to the 13 units per acre, as shown in
Figure 2.7.
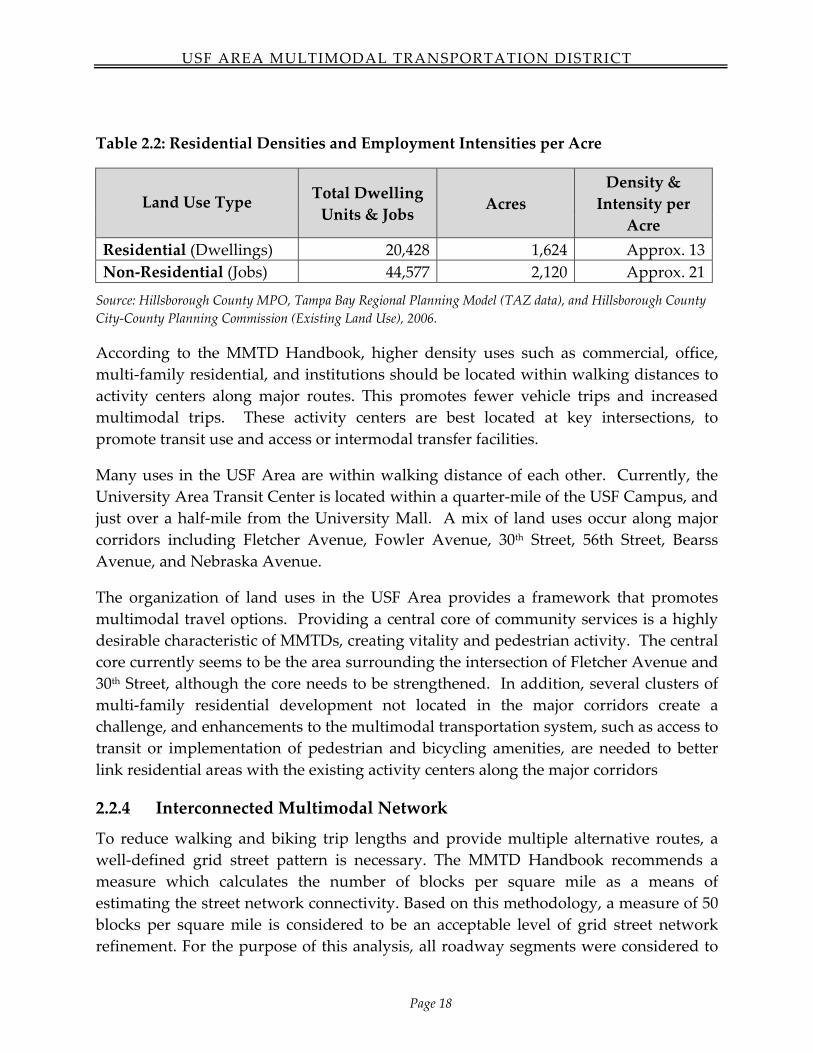
Table 2.2 shows the density and intensity of residential and non‐residential land uses in
the USF Area. Non‐residential uses include Commercial, Industrial, Office,
Educational, and Public/Institutional. Not included in the density and intensity
calculations are Public Communications, Right‐of‐Way/Roads, Vacant, and Water.
Page 16
USF AREA MULTIMODAL TRANSPORTATION DISTRICT
Page 15
Figure 2.5: Employment Intensity by TAZ
Source: Hillsborough County MPO and Tampa Bay Regional Planning Model (TAZ data), 2006.
USF
Page 17
USF AREA MULTIMODAL TRANSPORTATION DISTRICT
Page 16
Figure 2.6: Dwelling Unit Density by TAZ
Source: Hillsborough County MPO and Tampa Bay Regional Planning Model (TAZ data), 2006.
USF
Page 18
USF AREA MULTIMODAL TRANSPORTATION DISTRICT
Page 17
Figure 2.7: Persons Living in Group Quarters by TAZ
Source: Hillsborough County MPO and Tampa Bay Regional Planning Model (TAZ data), 2006.
Page 19
USF AREA MULTIMODAL TRANSPORTATION DISTRICT
Page 18
Table 2.2: Residential Densities and Employment Intensities per Acre
Land Use Type Total Dwelling
Units & Jobs Acres
Density &
Intensity per
Acre
Residential (Dwellings) 20,428 1,624 Approx. 13
Non‐Residential (Jobs) 44,577 2,120 Approx. 21
Source: Hillsborough County MPO, Tampa Bay Regional Planning Model (TAZ data), and Hillsborough County
City‐County Planning Commission (Existing Land Use), 2006.
According to the MMTD Handbook, higher density uses such as commercial, office,
multi‐family residential, and institutions should be located within walking distances to
activity centers along major routes. This promotes fewer vehicle trips and increased
multimodal trips. These activity centers are best located at key intersections, to
promote transit use and access or intermodal transfer facilities.
Many uses in the USF Area are within walking distance of each other. Currently, the
University Area Transit Center is located within a quarter‐mile of the USF Campus, and
just over a half‐mile from the University Mall. A mix of land uses occur along major
corridors including Fletcher Avenue, Fowler Avenue, 30th Street, 56th Street, Bearss
Avenue, and Nebraska Avenue.
The organization of land uses in the USF Area provides a framework that promotes
multimodal travel options. Providing a central core of community services is a highly
desirable characteristic of MMTDs, creating vitality and pedestrian activity. The central
core currently seems to be the area surrounding the intersection of Fletcher Avenue and
30th Street, although the core needs to be strengthened. In addition, several clusters of
multi‐family residential development not located in the major corridors create a
challenge, and enhancements to the multimodal transportation system, such as access to
transit or implementation of pedestrian and bicycling amenities, are needed to better
link residential areas with the existing activity centers along the major corridors
2.2.4 Interconnected Multimodal Network
To reduce walking and biking trip lengths and provide multiple alternative routes, a
well‐defined grid street pattern is necessary. The MMTD Handbook recommends a
measure which calculates the number of blocks per square mile as a means of
estimating the street network connectivity. Based on this methodology, a measure of 50
blocks per square mile is considered to be an acceptable level of grid street network
refinement. For the purpose of this analysis, all roadway segments were considered to
Page 20
USF AREA MULTIMODAL TRANSPORTATION DISTRICT
Page 19
be elements of the bicycle and pedestrian network, therefore one map is used to
determine the overall connectivity.
Figure 2.8 illustrates the block densities within the USF Area. Section lines from the
Public Land Survey System were used to determine the square mile grid. Since the
MMTD boundary is not a square, several square mile sections are not completely within
the MMTD boundary. In these cases, both the polygons within the MMTD and outside
of it were counted within the square mile. Only one section north of Fletcher Avenue
between Nebraska Avenue and N. 22nd Street meets the minimum criteria with 50
blocks per square mile. The other portions of the USF Area need a better organized
street pattern and improved connectivity.
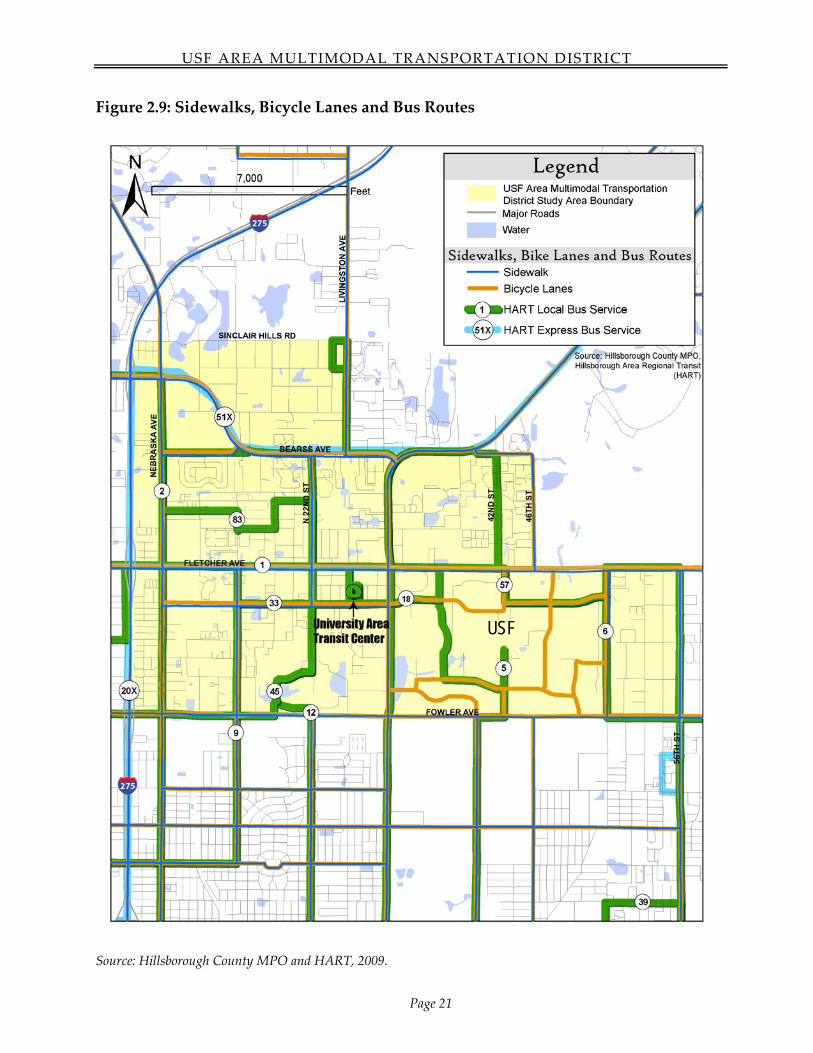
There are sidewalks and bicycle lanes along all the major roads in the USF Area. These
are shown in Figure 2.9. The University Area Transit Center (UATC), located just south
of Fletcher Avenue on Livingston Avenue, is an asset to the USF Area with access to
eleven Hillsborough Area Regional Transit (HART) bus routes that serve a large area of
the Tampa area, and beyond with bus transfers. There are sidewalks in front of UATC
on Livingston Avenue, but no bicycle lanes.
The HART bus routes that stop at the UATC and run throughout the USF Area are
Routes 1, 2, 5, 6, 9, 12, 18, 33, 45, 57, and 83. Commuter Express Routes 20X and 51X run
through the USF Area but do not stop in it. HART bus routes and the UATC are shown
on Figure 2.9.
A number of intermodal facilities can be easily accessed from the bus routes within the
USF Area. The local bus routes serving the USF Area provide access to the following
regional destinations: Union Station (Amtrak), Tampa International Airport, Garrison
Cruise Ship Terminal and Port of Tampa, and the Greyhound bus station.
Page 21
USF AREA MULTIMODAL TRANSPORTATION DISTRICT
Page 20
Figure 2.8: Street Network Connectivity, Polygons per Square Mile
Source: Public Land Survey System and Jacobs, 2009.
USF
Page 22
USF AREA MULTIMODAL TRANSPORTATION DISTRICT
Page 21
Figure 2.9: Sidewalks, Bicycle Lanes and Bus Routes
Source: Hillsborough County MPO and HART, 2009.
USF
Page 23
USF AREA MULTIMODAL TRANSPORTATION DISTRICT
Page 22
According to schedules and maps provided by HART, the following bus routes
provide service to the USF Area:
Route 1 provides service every 20 to 30 minutes from 4 a.m. to 10 p.m., and every
60 minutes from 10 p.m. to midnight on weekdays. Service stops at 11 p.m. on
Saturdays, and at 9 p.m. on Sundays. This route connects the UATC along
Florida Avenue to the Marion Transit Center in Downtown Tampa.
Route 2 provides service every 15 to 20 minutes from 4 a.m. to midnight on
weekdays. On Saturdays, service is every 15 to 30 minutes from 5 a.m. to 8 p.m.
and every 60 minutes from 8 p.m. to 10 p.m. On Sundays, service is every 30
minutes from 7 a.m. to 9 p.m., and 60 minutes from 8 p.m. to 10 p.m. This route
runs between the UATC along Nebraska Avenue to the Marion Transit Center in
Downtown Tampa.
Route 5 provides service every 30 minutes from 5 a.m. to 10 p.m. weekdays, and
hourly service on Saturdays from 6:30 a.m. to 7 p.m. This route runs from the
UATC through USF campus, south on McKinley Drive, and through Ybor City to
the Marion Transit Center in Downtown Tampa.
Route 6 provides 20 to 40 minute service from 4:30 a.m. to 7:30 p.m. and every 60
minutes on weekdays from 7:30 p.m. to 1:30 a.m. On weekends, service is every
45 to 60 minutes from 6:00 a.m. to 10 p.m. This route runs from the UATC
through USF campus and along 56th Street to Netp@rk Transfer Center to the
Marion Transit Center in Downtown Tampa via 21st Avenue.
Route 9 provides service every 30 minutes on weekdays from 5 a.m. to 9 p.m.,
and hourly on Saturdays from 7 a.m. to 9 p.m. This route runs from the UATC
south on 15th Street to the Yukon Transfer Center, and through Ybor City to the
Marion Transit Center in Downtown Tampa.
Route 12 provides 20 to 30 minute service on weekdays from 4 a.m. to 10 p.m.
and hourly from 10 p.m. to midnight. On the weekends, service is every 30
minutes from 6:30 a.m.to 7:30 p.m. and hourly from 7:30 p.m. to 10:30 p.m. This
route runs from the UATC along 22nd Street through Ybor City to the Marion
Transit Center in Downtown Tampa.
Route 18 provides service every 30 minutes on weekdays from 5 a.m. to 7 p.m.
and hourly from 7 p.m. to 10 p.m. On Saturdays, hourly service is provided from
6 a.m. to 9 p.m. This route runs from Sinclair Hills Road to the University
Community Hospital and the UATC through USF campus, and along 30th Street
to 21st Avenue to the Marion Transit Center in Downtown Tampa.
Page 24
USF AREA MULTIMODAL TRANSPORTATION DISTRICT
Page 23
Route 33 provides hourly service on weekdays from 5 a.m. to 8 p.m. and on
Saturdays hourly from 7 a.m. to 7 p.m. This route runs from the UATC to the
University Mall, along Fletcher Avenue, and Dale Mabry Highway to North
Lakeview Drive.
Route 45 provides service every 30 minutes from 4:30 a.m. to 10 p.m. on
weekdays, and hourly service on weekends from 6:30 a.m. to 9 p.m. This route
runs from the UATC to the University Mall, along North Boulevard to Lowry
Park, St. Joseph’s Hospital, the West Tampa Transfer Center, and Westshore
Plaza Transfer Center.
Route 57 provides hourly service from 4:30 a.m. to 10 p.m. on weekdays. This
route runs from the UATC to the University Community Hospital, the VA
Hospital, Morris Bridge Road, Seminole Hard Rock Hotel and Casino, and
Netp@rk Transfer Center.
Route 83, the University Area Connector, provides service every 30 minutes
from 4 a.m. to 9:30 p.m. on weekdays. On Saturdays, service is every 30 minutes
from 6:30 a.m. to 8 p.m. and every hour from 8 p.m. to 10 p.m. On Sundays,
service is hourly from 7 a.m. to 7:30 p.m. This route runs from the UATC to the
University Area Community Development Center, to Bearss Plaza west of I‐275,
along Florida Avenue to 131st Avenue.
Two Commuter Express Bus routes, 20X and 51X, run through the USF Area to
Downtown Tampa, but do not stop inside the MMTD. The closest stop for Route
20X is at Fletcher Avenue and Florida Avenue, and Route 51X stops in New
Tampa on Bruce B. Downs stopping at the Lowe’s Park‐n‐Ride at Commerce
Palms Drive. Both provide two AM and two PM trips from North Tampa at 6
a.m. and 6:30 a.m., and from Downtown Tampa between 4:30 and 5:15 p.m.
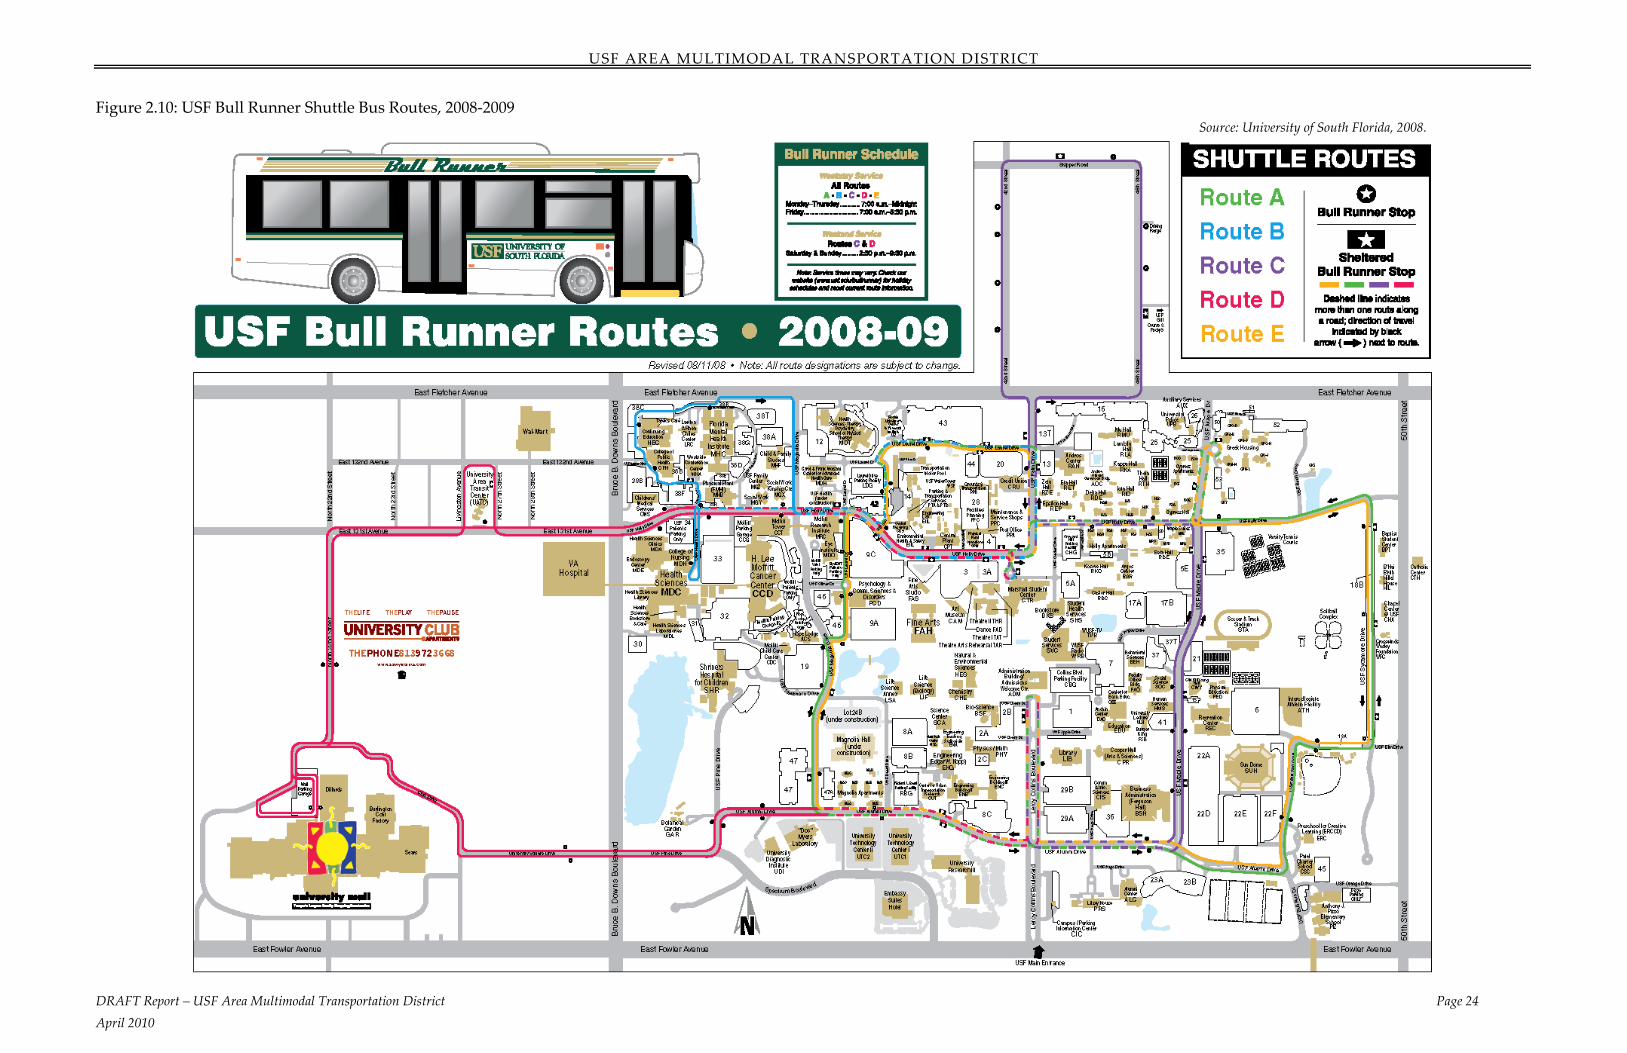
In addition to bus service provided by HART, the USF Bull Runner shuttle bus
provides service to USF students every 10 to 15 minutes with several stops on
campus, the UATC, University Club, University Mall, and University Collection
shops, as shown in Figure 2.10. Routes A, B, C, D and E are in service from 7 a.m.
to midnight on Monday through Thursday, and from 7 a.m. to 8:30 p.m. on
Friday. On Saturday and Sunday, Routes C and D are in service from 2:30 p.m.
to 9:30 p.m.
Page 25
USF AREA MULTIMODAL TRANSPORTATION DISTRICT
DRAFT Report – USF Area Multimodal Transportation District Page 24
April 2010
Figure 2.10: USF Bull Runner Shuttle Bus Routes, 2008‐2009 Source: University of South Florida, 2008.
Page 26
USF AREA MULTIMODAL TRANSPORTATION DISTRICT
Page 25
2.2.5 Quality and Level of Service (Q/LOS) for Each Mode
A successful MMTD provides convenient connections within the network and between
modes, as well as a desirable minimum Level of Service (LOS) for bicycle, pedestrian
and transit. Quality of Service (QOS) is the overall measure of perceived service
performance from the user’s point of view.
Pedestrian LOS is based on lateral separation between pedestrian and motor vehicle
traffic (presence of sidewalk, buffers, etc.), and motor vehicle traffic volume and speed.
Bicycle LOS is based on several factors including total width of pavement, traffic
volume in the outside lane, motor vehicle speeds, and designated bike lanes or paved
shoulders. Transit LOS is based on the Transit Capacity and Quality of Service Manual,
relating to service frequency and hours of service, and pedestrian access to transit stops.
LOS A is the best and LOS F is the worst.
Using the multimodal LOS grading system documented in the 2002 FDOT Q/LOS
Manual, the Hillsborough County MPO gathered bicycle and pedestrian infrastructure
and transit service data, and calculated Q/LOS grades for the major roadway network
and several minor roadways. The current bicycle, pedestrian, and transit LOS scores for
the USF Area are shown in Figures 2.11, 2.12 and 2.13.
For a non‐motorized oriented MMTD, rather than transit‐oriented MMTD, the
Areawide Q/LOS, the MMTD Handbook identifies LOS D as adequate for transit users,
and LOS C for pedestrian and bicycle users. Table 2.3 shows the number of roadway
system miles at each LOS grade for the pedestrian, bicycle, and transit modes. Table 2.4
shows the LOS for each mode as a percentage of the total.
Table 2.3: Level of Service by Mode, in Miles
Adequate LOS A B C D Subtotal
Bicycle 1.08 3.30 13.90 n/a 18.28
Pedestrian 0.00 0.32 6.65 n/a 6.97
Transit 2.31 3.36 1.53 7.03 14.23
Inadequate LOS D E F Subtotal Total Miles
Bicycle 4.64 4.19 0.00 8.83 27.11
Pedestrian 6.85 8.60 4.37 19.82 26.79
Transit n/a 6.88 4.02 10.90 25.13Source: Hillsborough County MPO and Jacobs, 2009.
Page 27
USF AREA MULTIMODAL TRANSPORTATION DISTRICT
Page 26
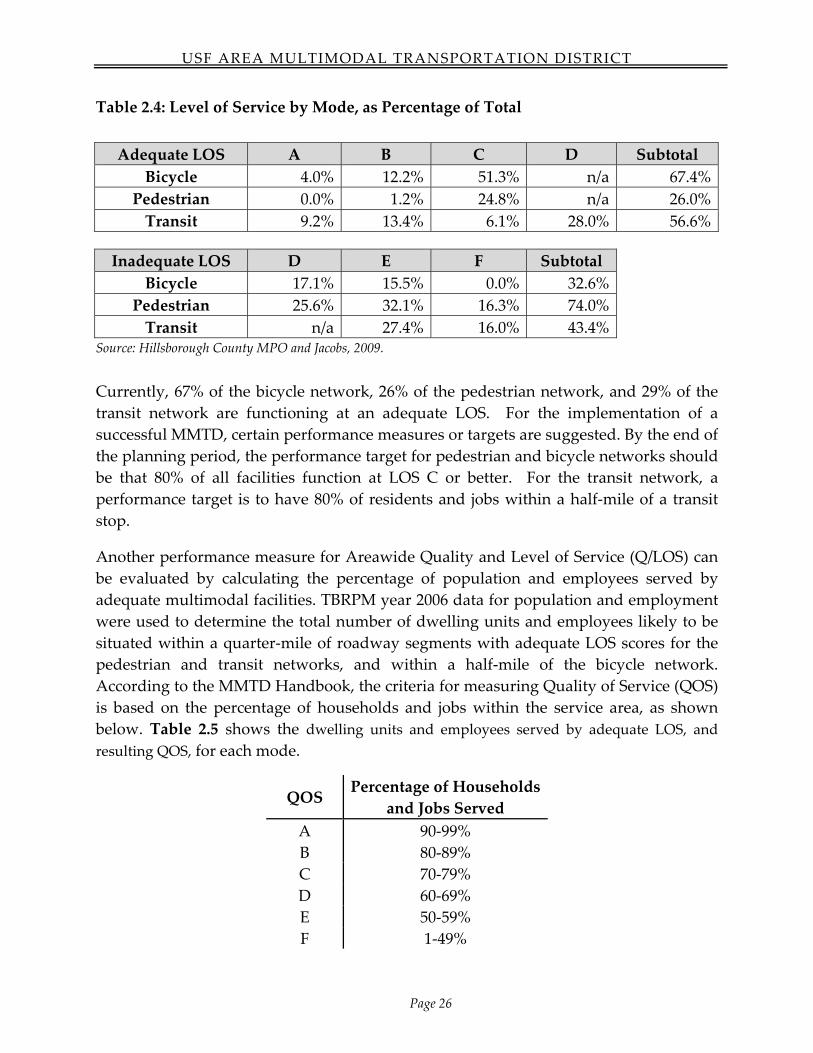
Table 2.4: Level of Service by Mode, as Percentage of Total
Adequate LOS A B C D Subtotal
Bicycle 4.0% 12.2% 51.3% n/a 67.4%
Pedestrian 0.0% 1.2% 24.8% n/a 26.0%
Transit 9.2% 13.4% 6.1% 28.0% 56.6%
Inadequate LOS D E F Subtotal
Bicycle 17.1% 15.5% 0.0% 32.6%
Pedestrian 25.6% 32.1% 16.3% 74.0%
Transit n/a 27.4% 16.0% 43.4% Source: Hillsborough County MPO and Jacobs, 2009.
Currently, 67% of the bicycle network, 26% of the pedestrian network, and 29% of the
transit network are functioning at an adequate LOS. For the implementation of a
successful MMTD, certain performance measures or targets are suggested. By the end of
the planning period, the performance target for pedestrian and bicycle networks should
be that 80% of all facilities function at LOS C or better. For the transit network, a
performance target is to have 80% of residents and jobs within a half‐mile of a transit
stop.
Another performance measure for Areawide Quality and Level of Service (Q/LOS) can
be evaluated by calculating the percentage of population and employees served by
adequate multimodal facilities. TBRPM year 2006 data for population and employment
were used to determine the total number of dwelling units and employees likely to be
situated within a quarter‐mile of roadway segments with adequate LOS scores for the
pedestrian and transit networks, and within a half‐mile of the bicycle network.
According to the MMTD Handbook, the criteria for measuring Quality of Service (QOS)
is based on the percentage of households and jobs within the service area, as shown
below. Table 2.5 shows the dwelling units and employees served by adequate LOS, and
resulting QOS, for each mode.
QOS Percentage of Households
and Jobs Served
A 90‐99%
B 80‐89%
C 70‐79%
D 60‐69%
E 50‐59%
F 1‐49%
Page 28
USF AREA MULTIMODAL TRANSPORTATION DISTRICT
Page 27
Table 2.5: Dwelling Units and Employees Served by Adequate LOS, and QOS
Mode
Miles with
Adequate
LOS
Area (Sq.
Miles)
Served
Dwelling
Units
Served
Employees
Served
% Area of
MMTD
Served
QOS
Total 34.36 6.99 20,428 44,577 n/a n/a
Bicycle 21.84 6.86 20,058 43,769 98.2% A
Pedestrian 6.97 3.53 10,307 22,492 50.5% E
Transit 5.55 3.18 9,294 20,281 45.5% F Source: Hillsborough County MPO and Jacobs, 2009.
Presently, the USF Area meets the areawide QOS criteria established in the MMTD
Handbook for bicycle, but not for pedestrian and transit. As such, improvements to the
multimodal network will be a critical part of the County’s multimodal district planning
process.
Page 29
USF AREA MULTIMODAL TRANSPORTATION DISTRICT
Page 28
Figure 2.11: Bicycle Level of Service
Source: Hillsborough County MP0.
Page 30
USF AREA MULTIMODAL TRANSPORTATION DISTRICT
Page 29
Figure 2.12: Pedestrian Level of Service
Source: Hillsborough County MP0.
Page 31
USF AREA MULTIMODAL TRANSPORTATION DISTRICT
Page 30
Figure 2.13: Transit Level of Service
Source: Hillsborough County MP0.
Page 32
USF AREA MULTIMODAL TRANSPORTATION DISTRICT
Page 31
2.3 MMTD Evaluation Summary
This evaluation provides the basis for determining what multimodal infrastructure
would be needed for an effective MMTD. The following summarizes the existing
conditions present within the USF Area and how it supports the implementation of an
MMTD, using the MMTD Handbook as a guide.
The proposed MMTD for the USF Area qualifies as a Regional Center, which the
MMTD Handbook defines as a Significant Area of Development Smaller than Urban
Center and larger than Town/Village.
General Characteristics
Regional Center
Population: 40,000
Jobs: 40,000
Population to Jobs Ratio: 1:1
Area: 8 square miles
Land Use and Transportation Assets
Diverse mix of land uses
Dense residential uses
Primary and supporting uses within walking distance
Appropriate organization of land uses along corridors
Walking is significant mode of travel
Multiple bus services available
Bus hub is located within the proposed District
Adequate LOS and Quality of Service (QOS) for bicycle use
Conditions Needing Improvement
Employment intensity areawide
Connectivity of street network
LOS and QOS for pedestrian and transit use
Central Core and relation of supporting uses.
Page 33
USF AREA MULTIMODAL TRANSPORTATION DISTRICT
Page 32
3.0 MULTIMODAL TRANSPORTATION NEEDS
3.1 Development of Multimodal Needs
The existing conditions present within the USF Area, as detailed in Section 2, were
reviewed by the study team, agency stakeholders, and members of the public, in order
to help determine the needed multimodal transportation improvements. Also reviewed
were various approved plans of needed projects. The list of improvement projects
needed for multimodal transportation, estimated costs of these projects, and any
existing commitments of funds towards multimodal improvements were identified in
coordination with agency stakeholders and members of the public.
The approved plans reviewed for developing the list of projects were:
Hillsborough County MPO 2035 Long‐Range Transportation Plan (LRTP) Needs
Assessment, 2009.
Adopted Hillsborough County Capital Improvements Plan (CIP) for Fiscal Years
2011‐2015, November 2009.
Hillsborough County Comprehensive Plan, August 2008.
The University Area Community and North 22nd Street Master Plans, October
2007.
2005 Tampa Campus Master Plan Update, October 2006.
HART Transit Emphasis Corridor Improvement Planning and Design Services
Study, March 2008.
North South Corridor BRT Project Development and Environment (PD&E) Study
Preliminary Engineering Report, October 2009.
Goals for the MMTD are to:
Plan for and implement strategies to support and fund mobility, and include
alternative modes of transportation;
Address urban design, appropriate land use mix, density and intensity; and
Address network connectivity needed to promote urban infill and
redevelopment.
The primary benefit of establishing an MMTD is the development of a framework that
allows developers to contribute to multimodal improvements which have been
identified through the use of a clear and understandable planning and prioritization
mechanism.
Page 34
USF AREA MULTIMODAL TRANSPORTATION DISTRICT
Page 33
The improvement projects should eliminate deficiencies in the multimodal
transportation network, and help achieve the proposed multimodal LOS standards over
the redevelopment timeframe for the USF Area MMTD. For the implementation of a
successful MMTD, certain performance measures or targets are suggested. By the end of
the planning period, the performance target for pedestrian and bicycle networks should
be that 80% of all facilities function at LOS C or better. For the transit network, a
performance target is to have 80% of residents and jobs within a half‐mile of a transit
stop.
3.1.1 Agency Stakeholders
Stakeholders included representatives from USF, University Area Community
Development Council, Tampa Homeowners Association of Neighborhoods,
Hillsborough County School District, Hillsborough County City‐County Planning
Commission, FDOT, Tampa Bay Area Regional Transportation Authority (TBARTA),
Hillsborough Area Regional Transit (HART), City of Temple Terrace, City of Tampa,
Senator Victor Crist’s Office, and Bay Area Commuter Services. The stakeholder group
met at the USF Center for Urban Transportation Research (CUTR) on June 30, 2009 and
October 1, 2009. Members of the group provided comments on report drafts at each
meeting. The Hillsborough County Transportation Task Force also provided review
and guidance.
3.1.2 Public Meetings
Two public meetings were held to discuss existing conditions and needed
improvements in the USF Area. These public meetings were held on September 9, 2009
and December 7, 2009, at 6:30 p.m., at the University Area Community Center at 14013
N. 22nd Street in Tampa. At these meetings, the Hillsborough Public Works
Department also discussed the Fletcher Avenue Pedestrian Safety Study that they are
conducting because the area surrounding Fletcher Avenue from 15th Street to 46th
Street has been identified as having one of the highest pedestrian crash rates in
unincorporated Hillsborough County. The study considers new road and traffic safety
features and includes a street lighting analysis, traffic conditions analysis, and
pedestrian safety education campaign. Improvements from the Fletcher Avenue Safety
Study are included in the USF Area MMTD program of improvements.
At the first public meeting, upon entering, attendees were given stickers for each mode
of transportation – walk, bike, transit, and car – and asked to place the stickers on the
map of the USF Area to show where they go and how they get there. The purpose of
this exercise was to help attendees start thinking about how they travel around the USF
Area. A formal presentation was made at the beginning of the meeting that included an
overview of the USF Area MMTD study’s purpose and goals, existing conditions
Page 35
USF AREA MULTIMODAL TRANSPORTATION DISTRICT
Page 34
analysis, and instructions for proving their input via questionnaires and map boards
set up around the room. Information on the Fletcher Avenue Safety Study was also
presented. There was a question and answer period after the presentations.
3.1.3 Initial Input Provided
The USF Area MMTD questionnaire given to each meeting attendee included a
mapping exercise and questions about each alternative mode of travel. Attendees were
asked to show in the map where they live and work, and where they regularly go
(school, grocery store, restaurants, entertainment) in the USF Area. They were asked to
show on the map the routes they take to get to those places, and to write on the map
next to the lines how they get there, whether it is “Drive,” “Walk,” “Bike,” or “Bus.”
The questionnaire then asked a series of questions relating to walking, biking and
taking transit. Several questions were asked about transit since there were no map
boards set up for transit, due to the nature of its problem areas being different than
walking and biking. Hillsborough County staff members and their consultants were
available to answer questions about this exercise.
The Questionnaire included the following questions:
What locations in the USF Area have you visited using the bus?
Where would you like to go on a bus that you can’t go now?
Which bus stops do you use, and what do you think of them?
Do you bike or walk to the bus stop?
What would make transit more attractive in the USF Area?
What would make walking more attractive in the USF Area?
What would make biking more attractive in the USF Area?
Which streets or intersections in the USF Area need the most attention overall?
What other comments do you have?
The questionnaire prompted attendees to visit the aerial maps of the USF Area set up in
the room showing pedestrian and bicycle problem areas. There was a “Walk Station”
and a “Bike Station” for attendees to visit. Some problem areas were shown on each
map, identifying potential needed improvements. A blank chart was next to each map
for attendees to identify additional needed improvements. Attendees were asked to
place stickers on the map in the location of the problem area, number the sticker to
correspond with the chart, and write the needed improvement on the chart.
Hillsborough County staff members and their consultants were stationed at the map to
assist attendees, and answer questions about the exercise. According to the sign in
sheets, 39 people attended this first meeting. Many of these attendees were agency
stakeholders. Results of the questionnaire and comments provided on charts are shown
Page 36
USF AREA MULTIMODAL TRANSPORTATION DISTRICT
Page 35
in Appendix A. Twelve questionnaires were returned. The maps and charts that were
on boards at the first meeting are shown in Appendix B.
Attendees were given a second questionnaire about the Fletcher Avenue Safety Study,
and were shown maps on boards. Staff members from Hillsborough County Public
Works and their consultants were stationed at these maps that showed the study area
and improvements under consideration. Public comments on this study are available
from the Hillsborough County Public Works Department.
3.1.4 Additional Input Provided
At the second public meeting, on December 7, 2009, lists of potential improvements
were shown with maps, in an open house meeting format. No formal presentation was
provided, but each attendee was greeted upon entering the meeting room and an
explanation of the meeting format was provided. Attendees were given a questionnaire
and sticker dots. The questionnaire explained: “Using the input provided at the public
meeting on September 9, 2009, potential projects were identified. These projects are
shown on maps and lists tonight. The projects are grouped by mode for the
Multimodal Study. Tonight, you will be asked to visit each of the 4 modes: Bicycle,
Pedestrian, Transit, and Roadways. Using the green dots attached, please indicate
which projects you feel are most important by placing a dot next to it on the list. You
may also add projects to the list. Staff will be available to assist with adding projects
and answering your questions. There are 24 green dots for your use, and 68 projects
listed in total. We appreciate your input!”
Attendees visited each map station to review the proposed projects. They talked with
Hillsborough County staff members and their consultants about the projects and
expressed concerns and ideas. Using their sticker dots, they voted for projects they felt
were most important, and added projects to the lists. The dot votes were tallied, and
the results are shown in Appendix C, including the maps displayed at the meeting.
Projects added by attendees are also shown on the maps. Attendees were given the
opportunity to provide written comments as well. General comments from nine
attendees are summarized in Appendix D. According to the sign in sheets, 33 people
attended this first meeting. Many of these attendees were agency stakeholders.
Staff members from Hillsborough County Public Works and their consultants were also
at this second public meeting to present updated maps and proposed improvements for
the Fletcher Avenue Safety Study. Attendees were given a questionnaire about this
study, and were shown maps on boards. Public comments on this study are available
from the Hillsborough County Public Works Department.
Page 37
USF AREA MULTIMODAL TRANSPORTATION DISTRICT
Page 36
3.2 Needed Projects for Multimodal Transportation
Types of improvements for the USF Area MMTD include the following, in various
locations through the USF Area.
Pedestrian Improvements
Sidewalks
Intersection improvements such as ADA curb‐cuts, crosswalks and pedestrian
signals
Pedestrian enhancements such as landscaping and lighting
Drainage improvements
New multi‐use trails
Bicycle Improvements
Bicycle lanes
Wider and more clearly defined bicycle lanes
Bicycle signals
Motorist and bicycle safety and education
Bicyclist amenities such as secure bike storage boxes
New multi‐use trails
Transit Improvements
Improved frequency and expanded hours on existing local bus routes
New local bus service
New premium bus service such as “MetroRapid” BRT
New circulator bus route serving major destinations in USF Area
New Light Rail limited‐stop service
Better taxi service
Road Improvements
Widen roads
Add turn lanes
Divide undivided roads
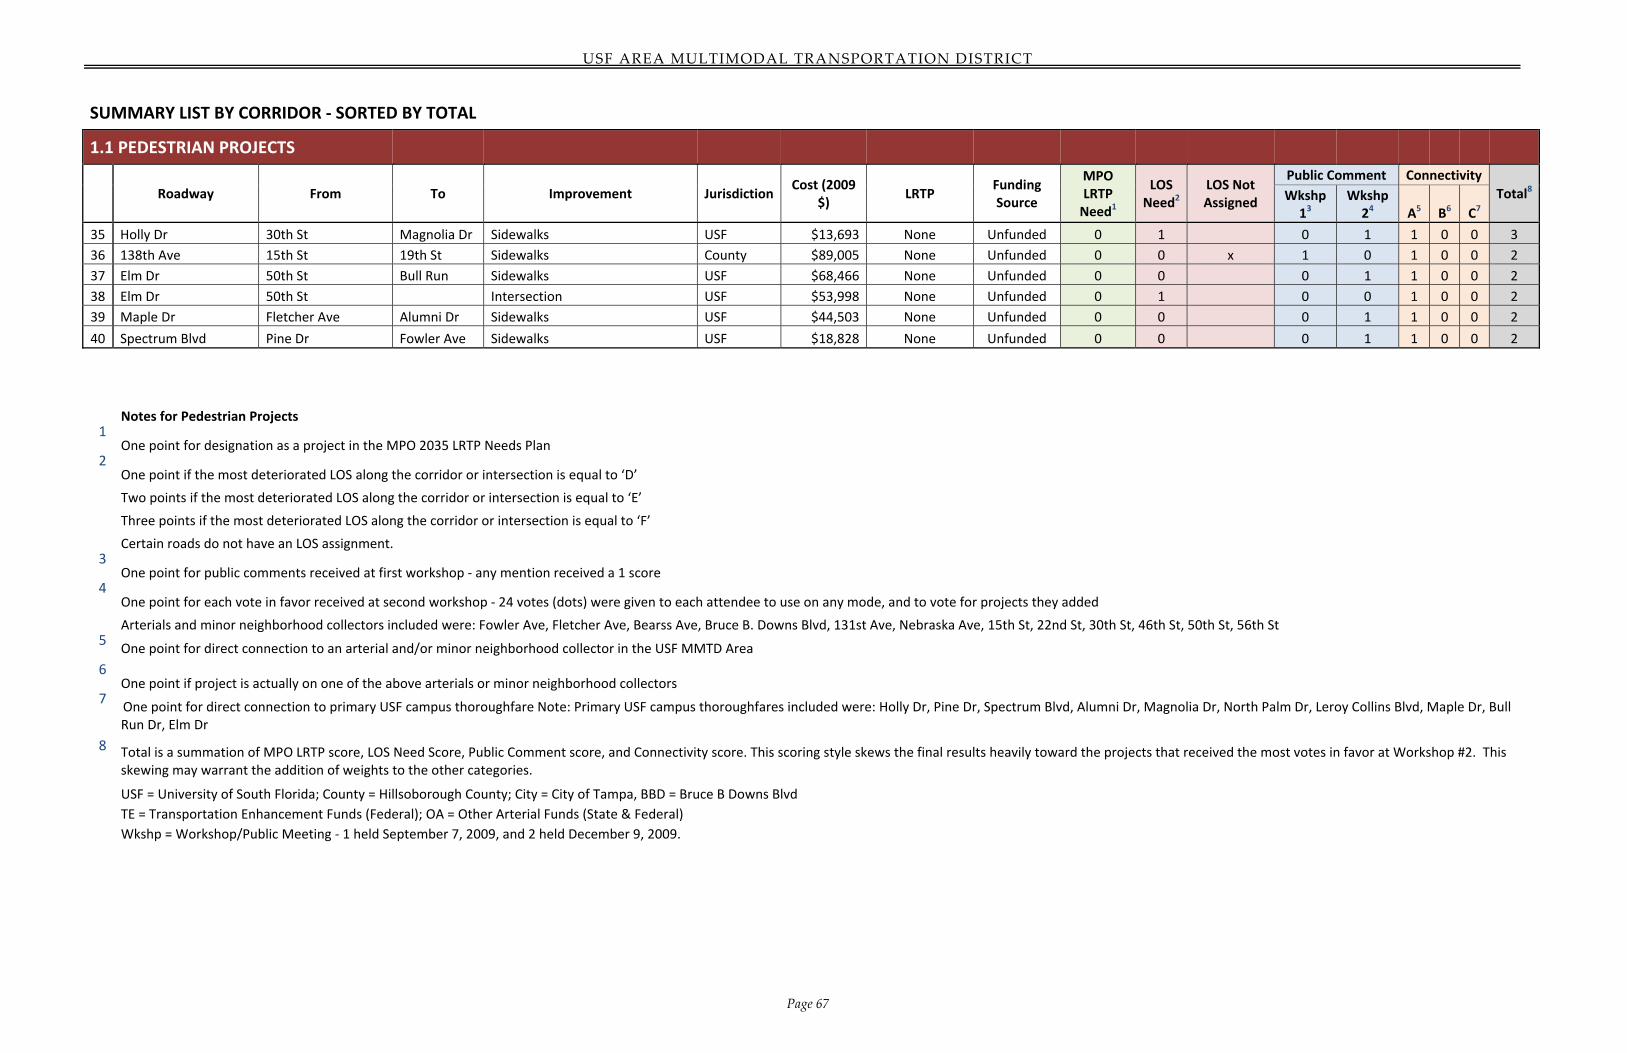
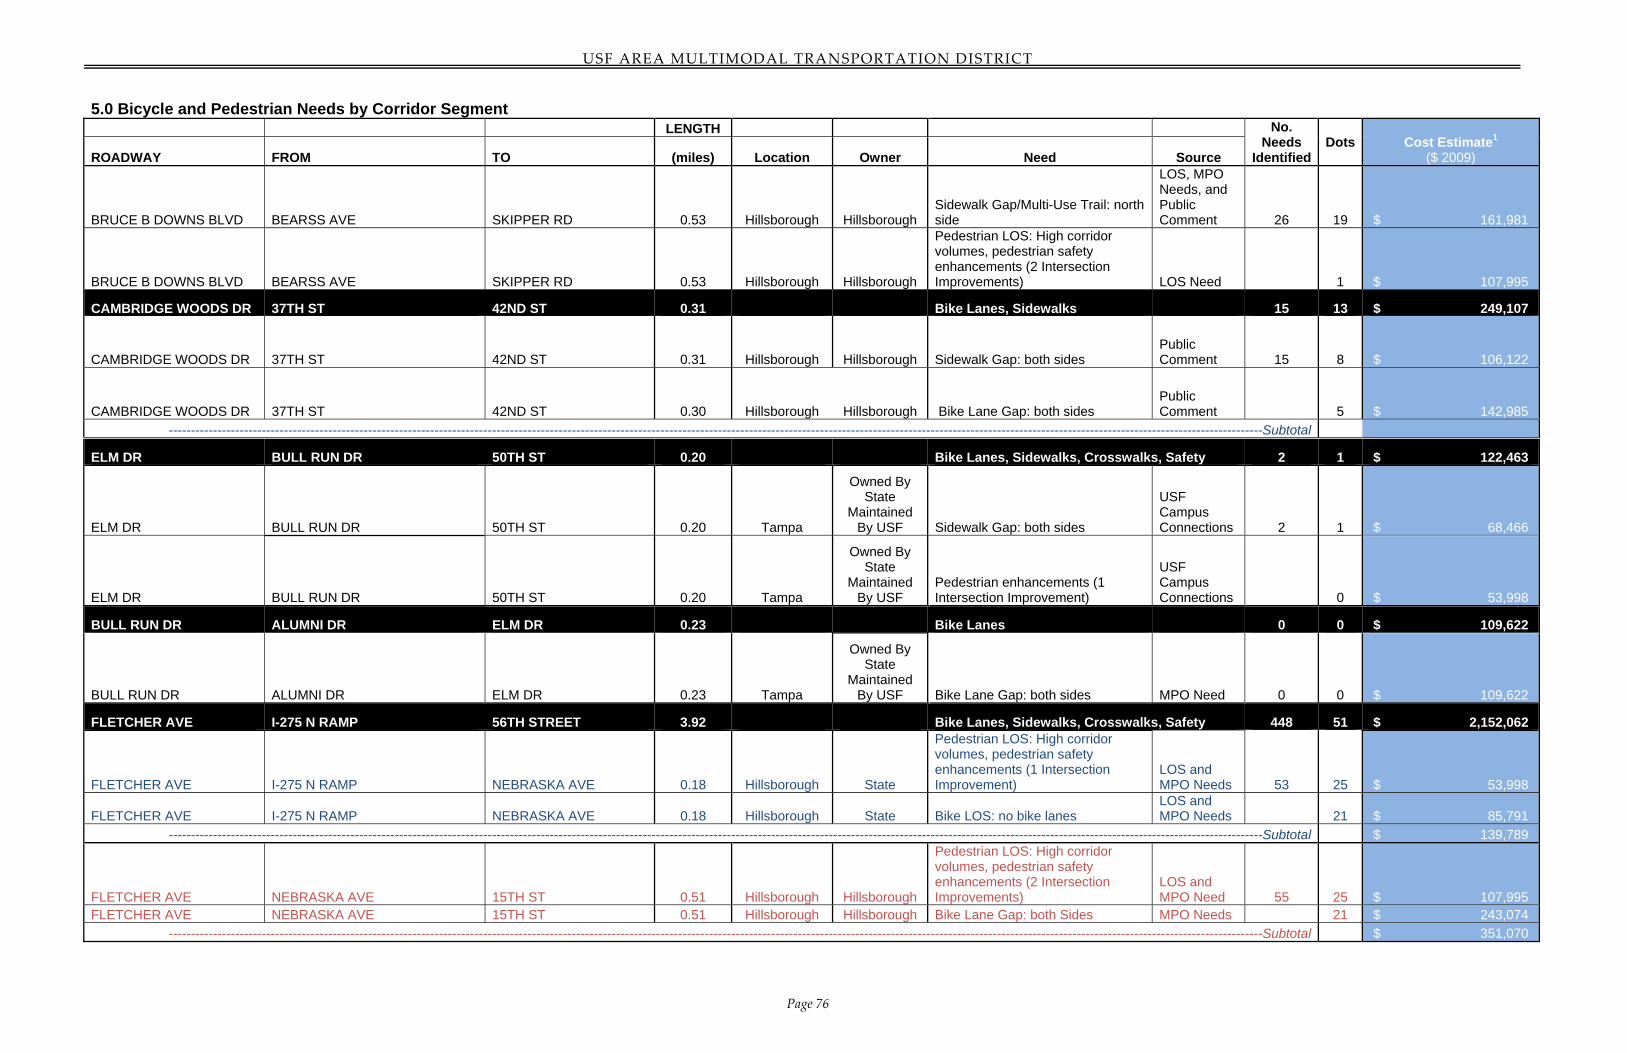
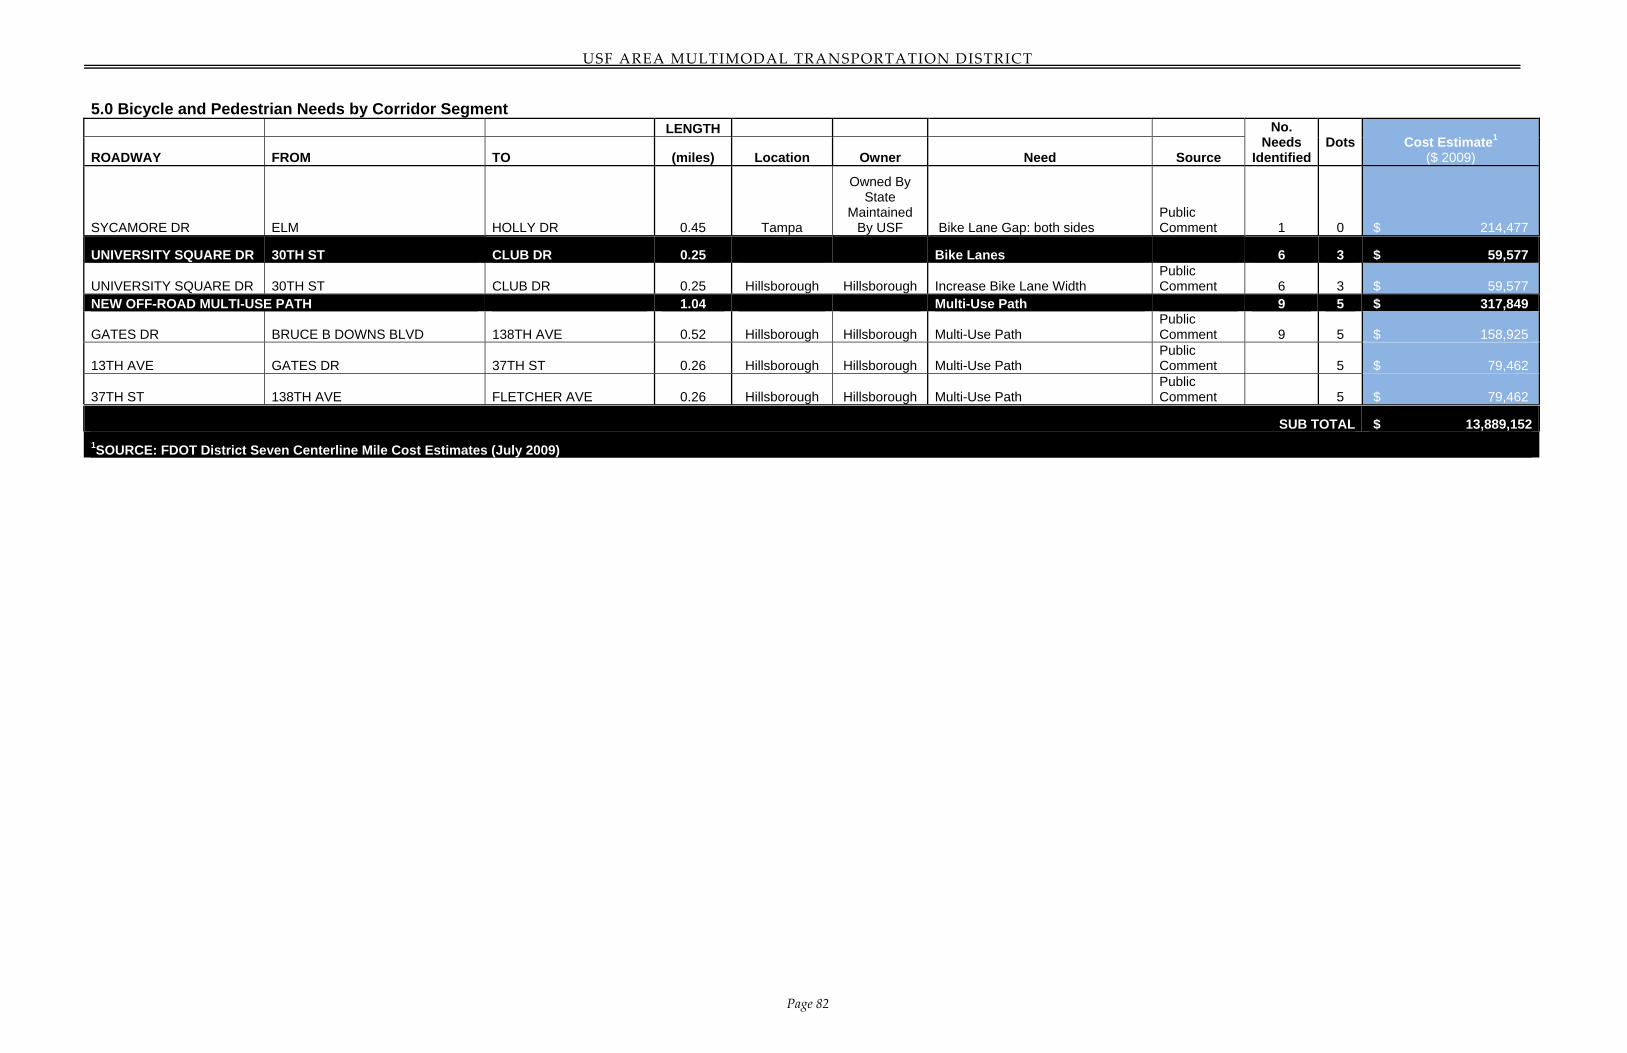
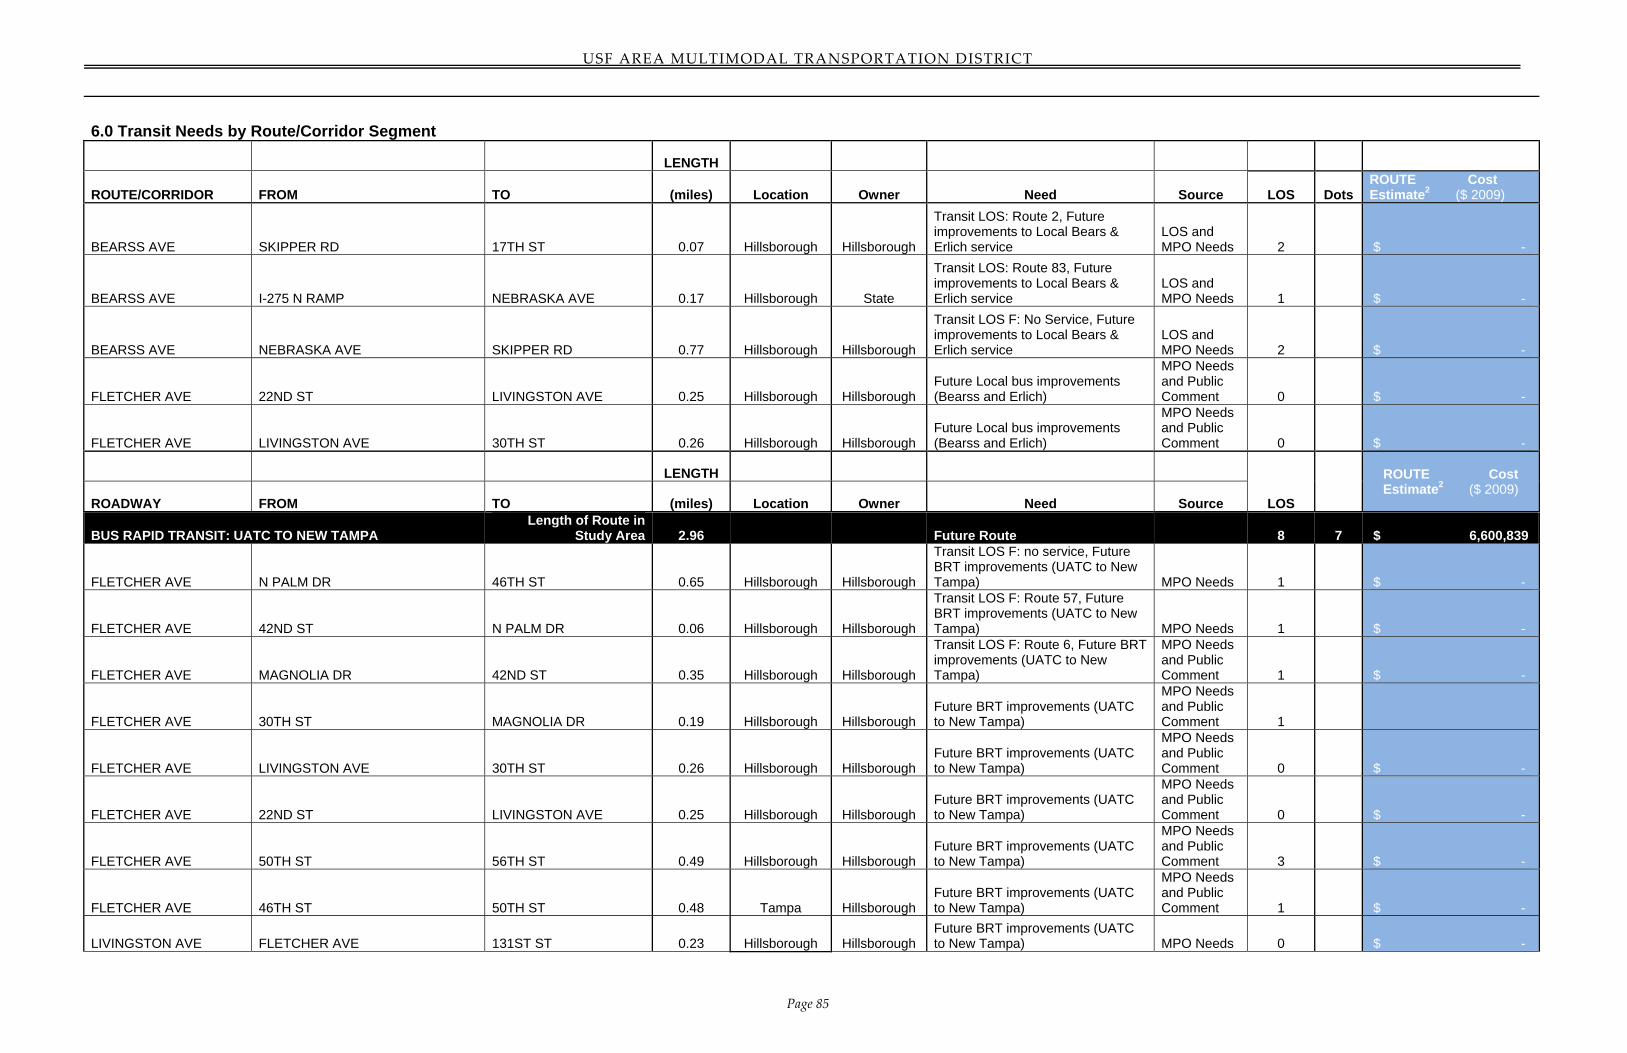
Complete improvements lists are provided in tables in this report. The costs of the
projects were identified using cost estimates from the LRTP and CIP. Priorities were
established based on the project’s potential to improve the Pedestrian Bicycle, Transit or
Roadway LOS, and if it would connect to an existing facility (sidewalk, bicycle lane, or
transit route), an arterial, primary neighborhood collector, or primary USF
thoroughfare. The prioritization scoring is explained on the tables. The summary list of
improvements with cost and maps are shown in Appendix E; the summary with
Page 38
USF AREA MULTIMODAL TRANSPORTATION DISTRICT
Page 37
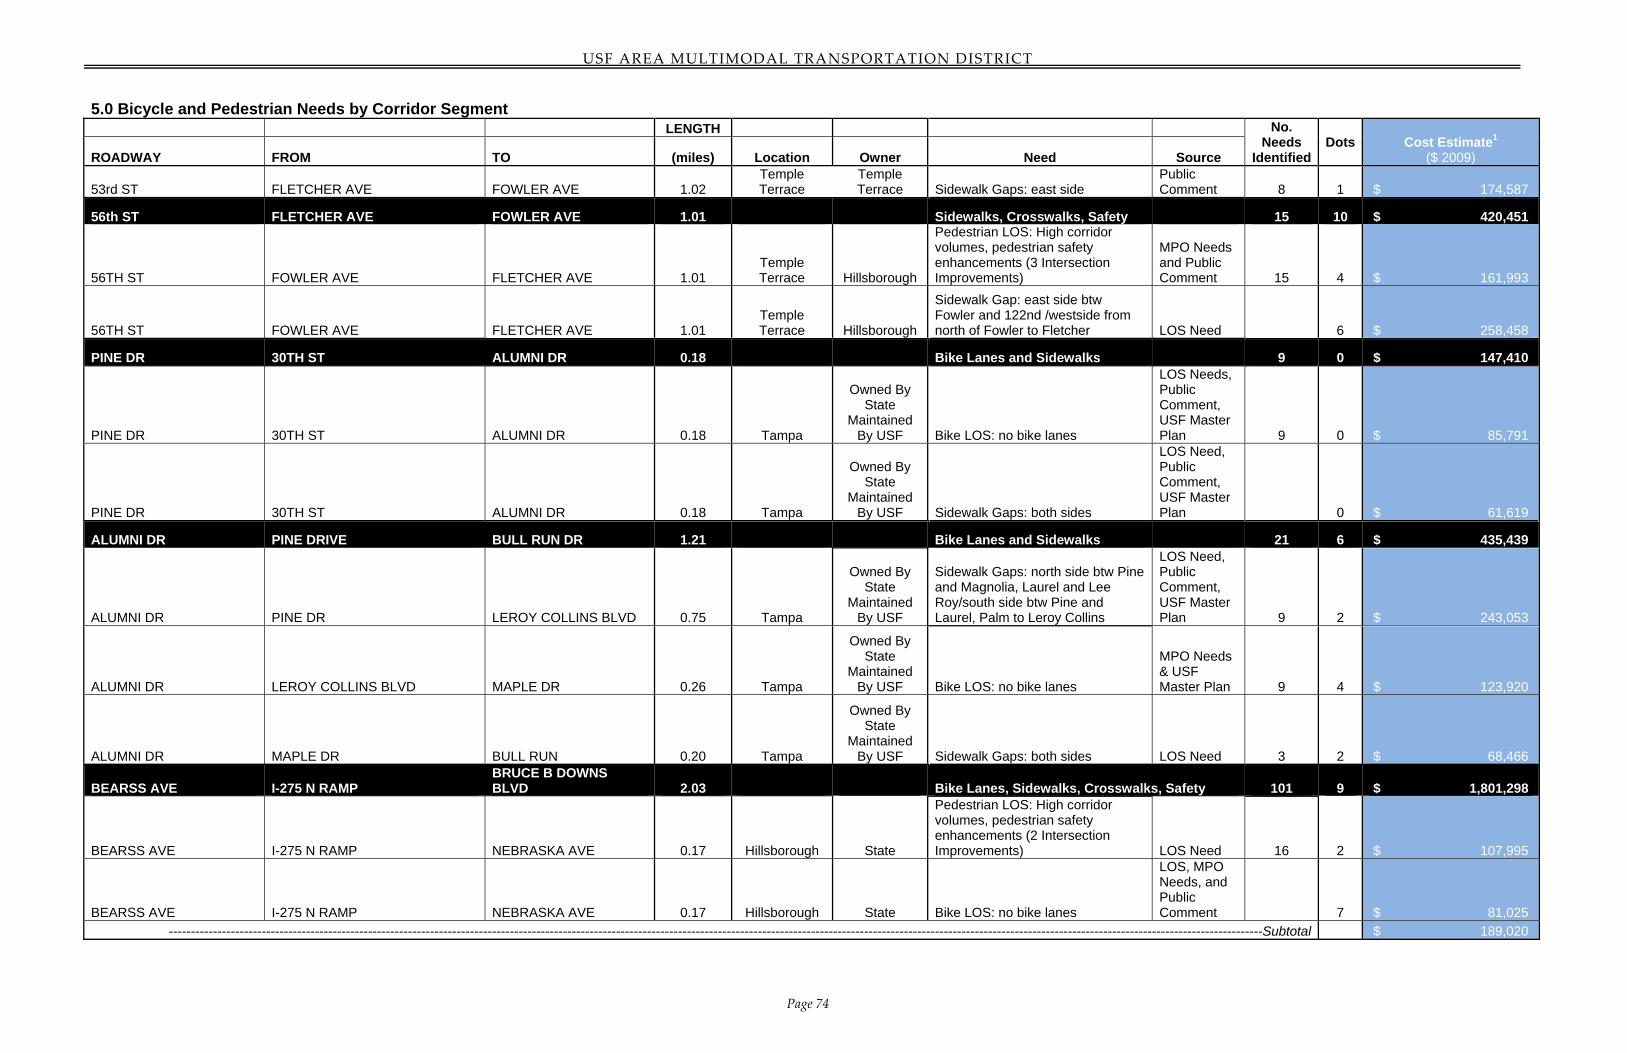
prioritization scores is shown in Appendix F; and detailed list by segment is shown in
Appendix G.
The process of developing the Multimodal Transportation Plan for the USF Area
included analysis of the area’s mobility needs, review of existing plans and programs,
and integration of comments from the public, stakeholders, and agency partners.
Consistent with the Comprehensive Plan, the MMTD Plan will encourage
redevelopment and provide mobility options for a growing population. Involving the
citizens, stakeholders, and agency partners early on and throughout the development of
the program of improvements was critical to creating a plan that will not only meet the
needs of the community, but have the full support of the community as
recommendations are implemented and promote greater awareness and understanding
of the USF Area’s multimodal transportation needs.
The summary lists of needed improvements were presented to the MPO Board and
committees in February 2010. It is anticipated that the final report will be presented to
the MPO Board in the summer of 2010, and possible amendments to the
Comprehensive Plan and Land Development would occur later.
Page 39
USF AREA MULTIMODAL TRANSPORTATION DISTRICT
Page 38
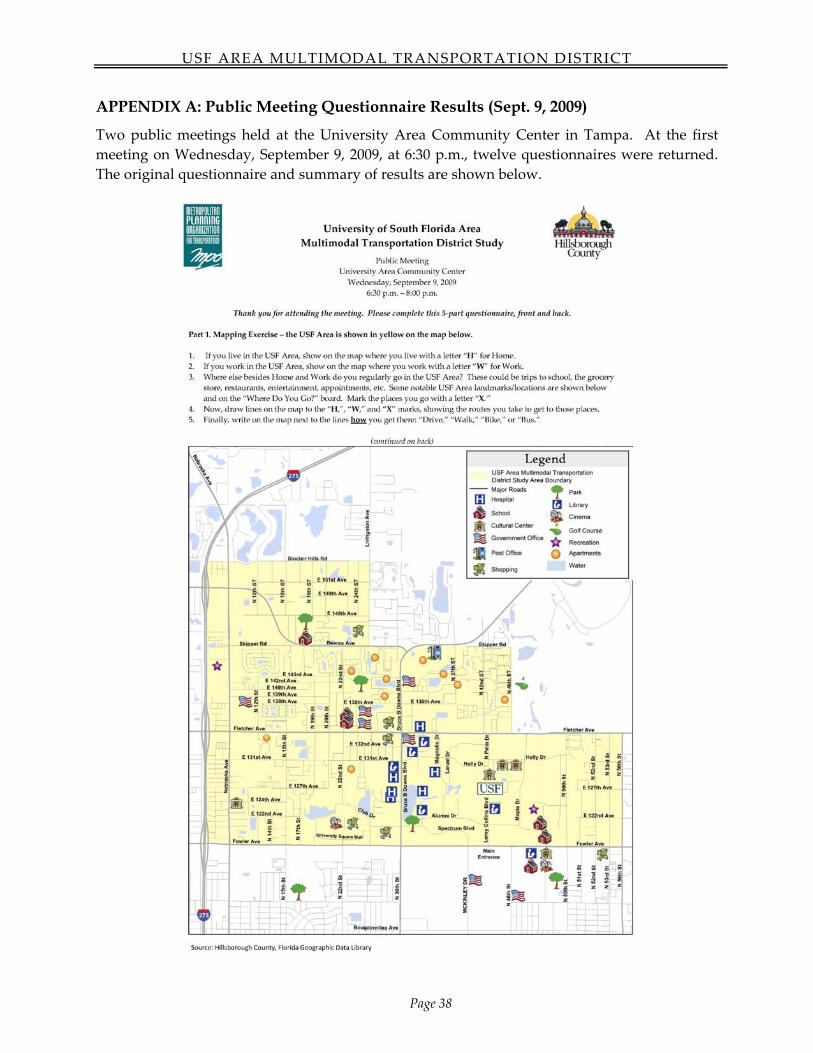
APPENDIX A: Public Meeting Questionnaire Results (Sept. 9, 2009)
Two public meetings held at the University Area Community Center in Tampa. At the first
meeting on Wednesday, September 9, 2009, at 6:30 p.m., twelve questionnaires were returned.
The original questionnaire and summary of results are shown below.
Page 40
USF AREA MULTIMODAL TRANSPORTATION DISTRICT
Page 39
Page 41
USF AREA MULTIMODAL TRANSPORTATION DISTRICT
Page 40
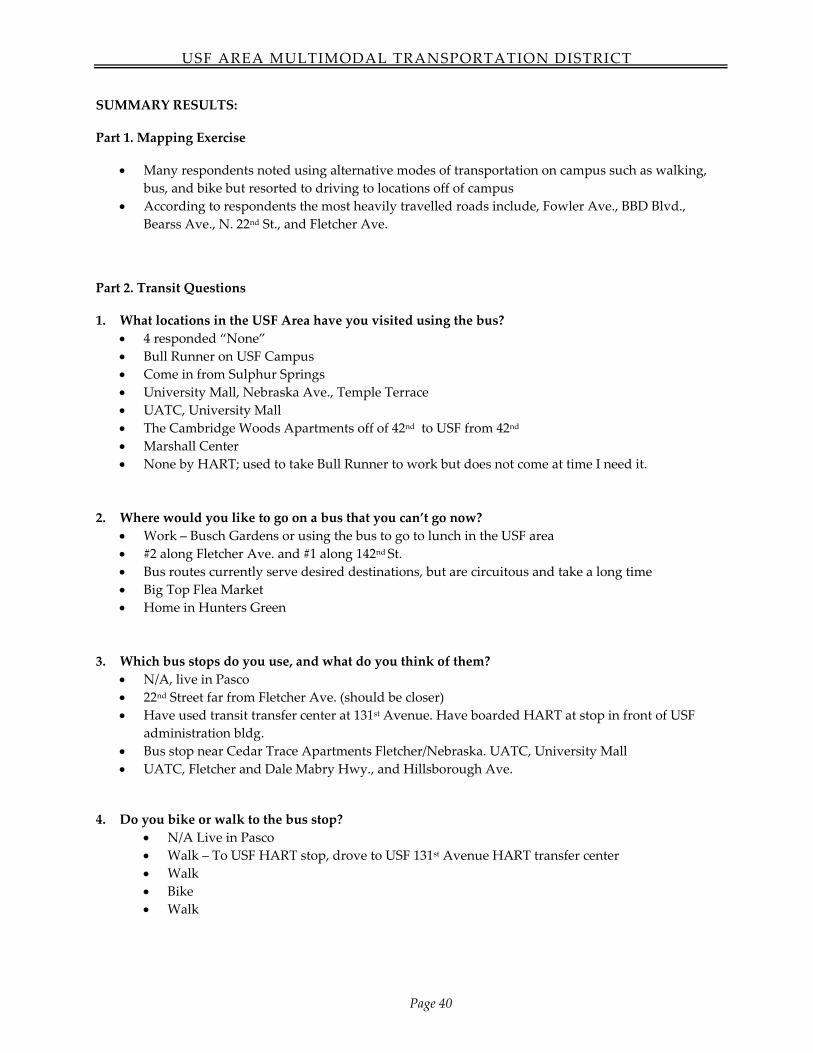
SUMMARY RESULTS:
Part 1. Mapping Exercise
Many respondents noted using alternative modes of transportation on campus such as walking,
bus, and bike but resorted to driving to locations off of campus
According to respondents the most heavily travelled roads include, Fowler Ave., BBD Blvd.,
Bearss Ave., N. 22nd St., and Fletcher Ave.
Part 2. Transit Questions
1. What locations in the USF Area have you visited using the bus?
4 responded “None”
Bull Runner on USF Campus
Come in from Sulphur Springs
University Mall, Nebraska Ave., Temple Terrace
UATC, University Mall
The Cambridge Woods Apartments off of 42nd to USF from 42nd
Marshall Center
None by HART; used to take Bull Runner to work but does not come at time I need it.
2. Where would you like to go on a bus that you can’t go now?
Work – Busch Gardens or using the bus to go to lunch in the USF area
#2 along Fletcher Ave. and #1 along 142nd St.
Bus routes currently serve desired destinations, but are circuitous and take a long time
Big Top Flea Market
Home in Hunters Green
3. Which bus stops do you use, and what do you think of them?
N/A, live in Pasco
22nd Street far from Fletcher Ave. (should be closer)
Have used transit transfer center at 131st Avenue. Have boarded HART at stop in front of USF
administration bldg.
Bus stop near Cedar Trace Apartments Fletcher/Nebraska. UATC, University Mall
UATC, Fletcher and Dale Mabry Hwy., and Hillsborough Ave.
4. Do you bike or walk to the bus stop?
N/A Live in Pasco
Walk – To USF HART stop, drove to USF 131st Avenue HART transfer center
Walk
Bike
Walk
Page 42
USF AREA MULTIMODAL TRANSPORTATION DISTRICT
Page 41
5. What would make transit more attractive in the USF Area?
Focus and emphasis on pedestrian use; being generous to encourage pedestrian activity; balance
between pedestrian and car.
More frequent, better connecting
Better sidewalk connectivity, better lit areas, less crime
Greater frequency of service
More bus service
More shaded areas and more fountains
Bus turnout lanes and stops nearer to crosswalks
Bus service along BBD Blvd. with a stop outside Hunters Green and another near USF
Bull Runner start earlier; more frequent stops for both HART and Bull Runner; better lighting;
covered stops
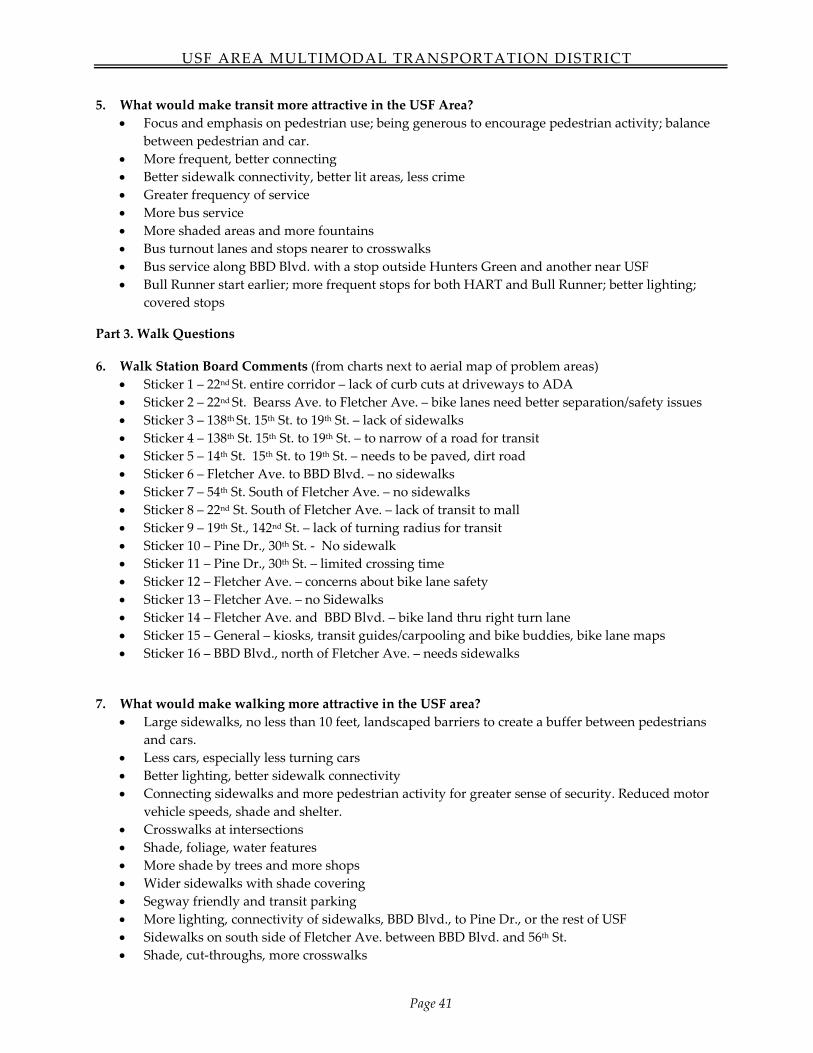
Part 3. Walk Questions
6. Walk Station Board Comments (from charts next to aerial map of problem areas)
Sticker 1 – 22nd St. entire corridor – lack of curb cuts at driveways to ADA
Sticker 2 – 22nd St. Bearss Ave. to Fletcher Ave. – bike lanes need better separation/safety issues
Sticker 3 – 138th St. 15th St. to 19th St. – lack of sidewalks
Sticker 4 – 138th St. 15th St. to 19th St. – to narrow of a road for transit
Sticker 5 – 14th St. 15th St. to 19th St. – needs to be paved, dirt road
Sticker 6 – Fletcher Ave. to BBD Blvd. – no sidewalks
Sticker 7 – 54th St. South of Fletcher Ave. – no sidewalks
Sticker 8 – 22nd St. South of Fletcher Ave. – lack of transit to mall
Sticker 9 – 19th St., 142nd St. – lack of turning radius for transit
Sticker 10 – Pine Dr., 30th St. ‐ No sidewalk
Sticker 11 – Pine Dr., 30th St. – limited crossing time
Sticker 12 – Fletcher Ave. – concerns about bike lane safety
Sticker 13 – Fletcher Ave. – no Sidewalks
Sticker 14 – Fletcher Ave. and BBD Blvd. – bike land thru right turn lane
Sticker 15 – General – kiosks, transit guides/carpooling and bike buddies, bike lane maps
Sticker 16 – BBD Blvd., north of Fletcher Ave. – needs sidewalks
7. What would make walking more attractive in the USF area?
Large sidewalks, no less than 10 feet, landscaped barriers to create a buffer between pedestrians
and cars.
Less cars, especially less turning cars
Better lighting, better sidewalk connectivity
Connecting sidewalks and more pedestrian activity for greater sense of security. Reduced motor
vehicle speeds, shade and shelter.
Crosswalks at intersections
Shade, foliage, water features
More shade by trees and more shops
Wider sidewalks with shade covering
Segway friendly and transit parking
More lighting, connectivity of sidewalks, BBD Blvd., to Pine Dr., or the rest of USF
Sidewalks on south side of Fletcher Ave. between BBD Blvd. and 56th St.
Shade, cut‐throughs, more crosswalks
Page 43
USF AREA MULTIMODAL TRANSPORTATION DISTRICT
Page 42
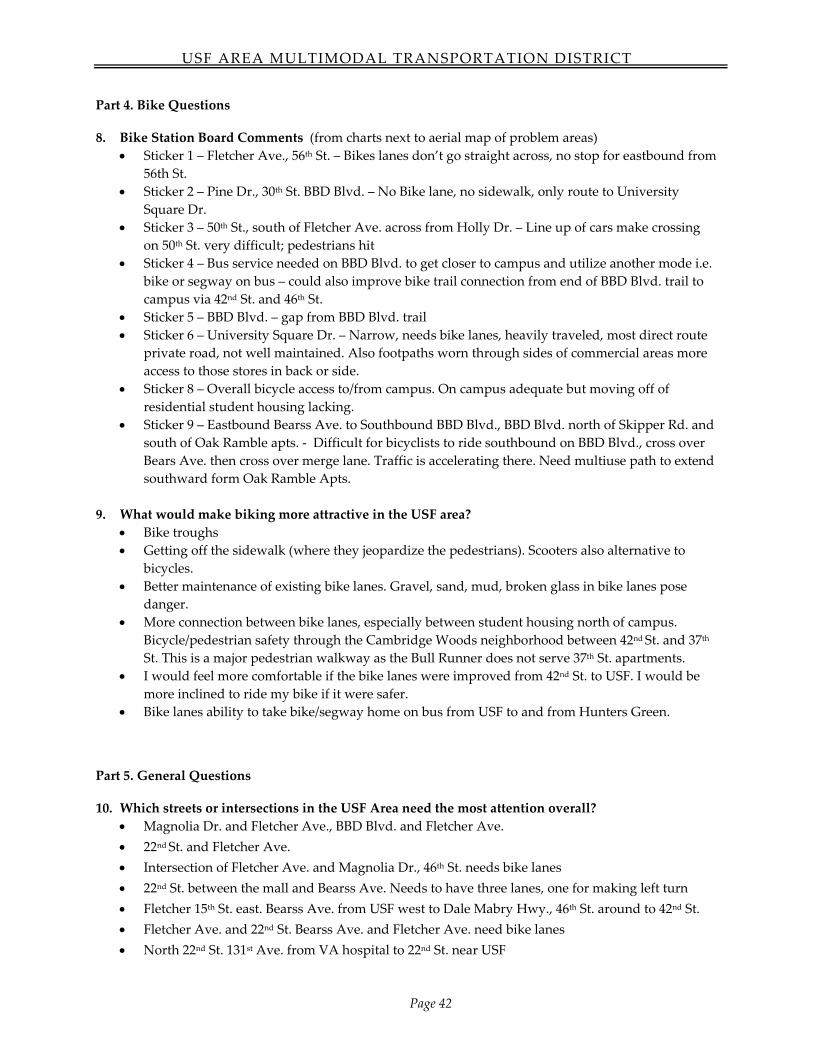
Part 4. Bike Questions
8. Bike Station Board Comments (from charts next to aerial map of problem areas)
Sticker 1 – Fletcher Ave., 56th St. – Bikes lanes don’t go straight across, no stop for eastbound from
56th St.
Sticker 2 – Pine Dr., 30th St. BBD Blvd. – No Bike lane, no sidewalk, only route to University
Square Dr.
Sticker 3 – 50th St., south of Fletcher Ave. across from Holly Dr. – Line up of cars make crossing
on 50th St. very difficult; pedestrians hit
Sticker 4 – Bus service needed on BBD Blvd. to get closer to campus and utilize another mode i.e.
bike or segway on bus – could also improve bike trail connection from end of BBD Blvd. trail to
campus via 42nd St. and 46th St.
Sticker 5 – BBD Blvd. – gap from BBD Blvd. trail
Sticker 6 – University Square Dr. – Narrow, needs bike lanes, heavily traveled, most direct route
private road, not well maintained. Also footpaths worn through sides of commercial areas more
access to those stores in back or side.
Sticker 8 – Overall bicycle access to/from campus. On campus adequate but moving off of
residential student housing lacking.
Sticker 9 – Eastbound Bearss Ave. to Southbound BBD Blvd., BBD Blvd. north of Skipper Rd. and
south of Oak Ramble apts. ‐ Difficult for bicyclists to ride southbound on BBD Blvd., cross over
Bears Ave. then cross over merge lane. Traffic is accelerating there. Need multiuse path to extend
southward form Oak Ramble Apts.
9. What would make biking more attractive in the USF area?
Bike troughs
Getting off the sidewalk (where they jeopardize the pedestrians). Scooters also alternative to
bicycles.
Better maintenance of existing bike lanes. Gravel, sand, mud, broken glass in bike lanes pose
danger.
More connection between bike lanes, especially between student housing north of campus.
Bicycle/pedestrian safety through the Cambridge Woods neighborhood between 42nd St. and 37th
St. This is a major pedestrian walkway as the Bull Runner does not serve 37th St. apartments.
I would feel more comfortable if the bike lanes were improved from 42nd St. to USF. I would be
more inclined to ride my bike if it were safer.
Bike lanes ability to take bike/segway home on bus from USF to and from Hunters Green.
Part 5. General Questions
10. Which streets or intersections in the USF Area need the most attention overall? Magnolia Dr. and Fletcher Ave., BBD Blvd. and Fletcher Ave.
22nd St. and Fletcher Ave.
Intersection of Fletcher Ave. and Magnolia Dr., 46th St. needs bike lanes
22nd St. between the mall and Bearss Ave. Needs to have three lanes, one for making left turn
Fletcher 15th St. east. Bearss Ave. from USF west to Dale Mabry Hwy., 46th St. around to 42nd St.
Fletcher Ave. and 22nd St. Bearss Ave. and Fletcher Ave. need bike lanes
North 22nd St. 131st Ave. from VA hospital to 22nd St. near USF
Page 44
USF AREA MULTIMODAL TRANSPORTATION DISTRICT
Page 43
Fletcher Ave., it is just off USF, lots of students live there and should use bikes
Fletcher Ave./BBD Blvd., Fowler Ave./BBD Blvd., Fowler Ave./53rd St., 30th St., Pine Dr.
Fletcher Ave. and USF Palm Dr. – 1,000 student cross here every day
11. What other comments do you have?
Recent roadwork on 22nd St. impairs the quick access for fire and rescue. Why do we need plants
in pedestrian median to waste water and tax payer money?
Look at bike transit in Portland and even downtown St. Pete for positive transit ideas
Thanks!
There are many veterans in the area, crosswalk lighting or lengthening the amount of time before
countdown would benefit them.
All questionnaires were returned on September 9, 2009, except for the following comments that were
received from Brian Pessaro via email on 9/11/09.
Additional Comments from FDOT District Seven
1. Include private infrastructure (roadways, bike paths, sidewalks) in LOS calculations. Also consider
that some places like parking lots and fields, though not ideal, may still provide a certain level of
pedestrian/bicycle accessibility.
2. Proposed mid‐block pedestrian crossing should be placed in strategic locations providing the
shortest path between generators and attractors.
3. Consider bus stop locations as a factor in pedestrian safety. Stops should be located as to encourage
use of pedestrian facilities (e.g. near intersections, proposed mid‐block crossings). An analysis of
pedestrian crossing patterns may show a high correlation between bus stops and
generators/attractors.
4. The special area plan and the corresponding land development regulations should include private
sector requirements for pedestrian/bicycle facilities (e.g. bicycle parking, showers, shortest path
sidewalk connections leading to building entrances, pedestrian entrances/exits in fences/walls).
5. The list of projects should be a holistic list to include both public and private projects even though the
private projects are not directly controlled by Hillsborough County.
Page 45
USF AREA MULTIMODAL TRANSPORTATION DISTRICT
Page 44
APPENDIX B: Public Meeting Map and Chart Boards (Sept. 9, 2009)
Walk Station Map and Chart
Page 46
USF AREA MULTIMODAL TRANSPORTATION DISTRICT
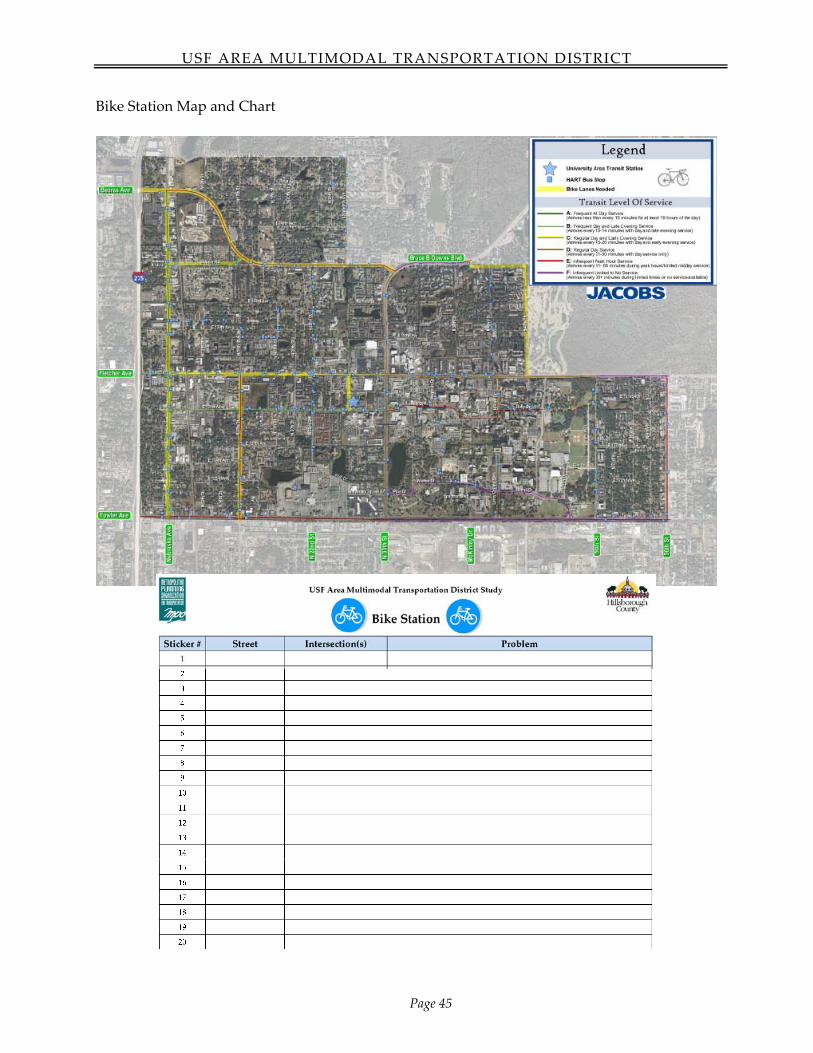
Page 45
Bike Station Map and Chart
Page 47
USF AREA MULTIMODAL TRANSPORTATION DISTRICT
Page 46
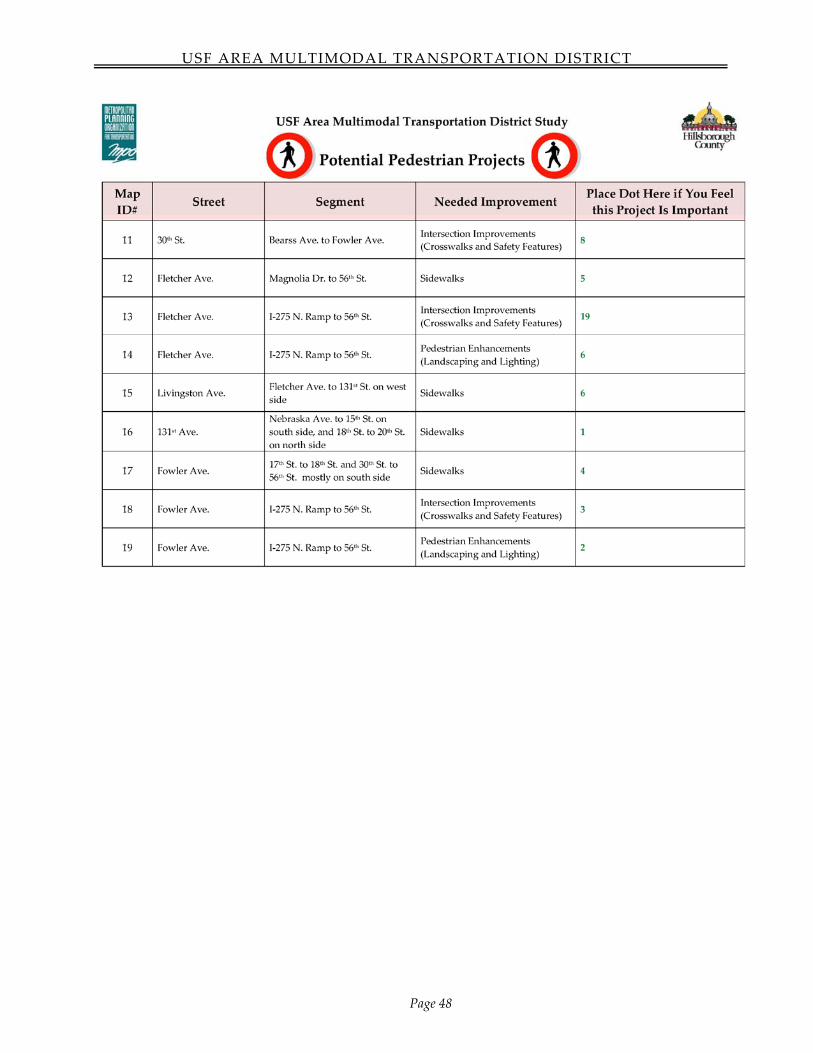
APPENDIX C: Public Meeting Map and Chart Boards (Dec. 7, 2009)
Walk Station Map and Charts
Page 48
USF AREA MULTIMODAL TRANSPORTATION DISTRICT
Page 47
Page 49
USF AREA MULTIMODAL TRANSPORTATION DISTRICT
Page 48
Page 50
USF AREA MULTIMODAL TRANSPORTATION DISTRICT
Page 49
Page 51
USF AREA MULTIMODAL TRANSPORTATION DISTRICT
Page 50
Note: Projects in green were those added by attendees at the public meeting.
Page 52
USF AREA MULTIMODAL TRANSPORTATION DISTRICT
Page 51
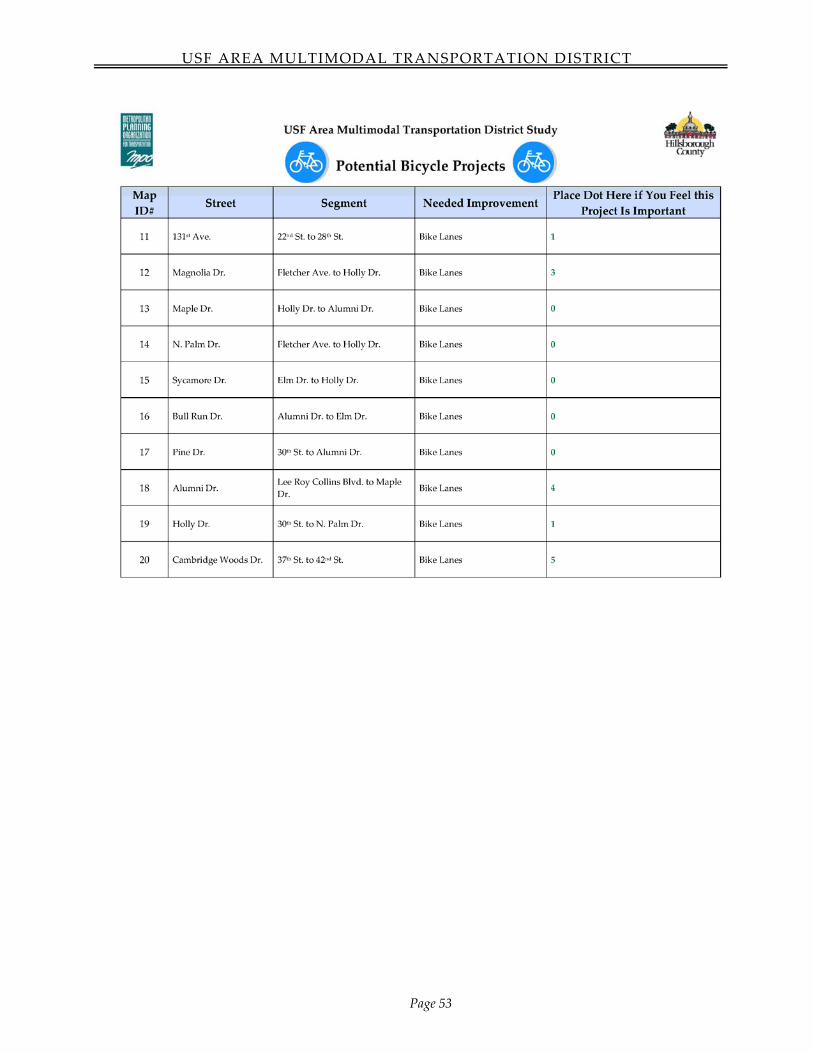
Bike Station Map and Charts
Page 53
USF AREA MULTIMODAL TRANSPORTATION DISTRICT
Page 52
Page 54
USF AREA MULTIMODAL TRANSPORTATION DISTRICT
Page 53
Page 55
USF AREA MULTIMODAL TRANSPORTATION DISTRICT
Page 54
Note: Projects in green were those added by attendees at the public meeting.
Page 56
USF AREA MULTIMODAL TRANSPORTATION DISTRICT
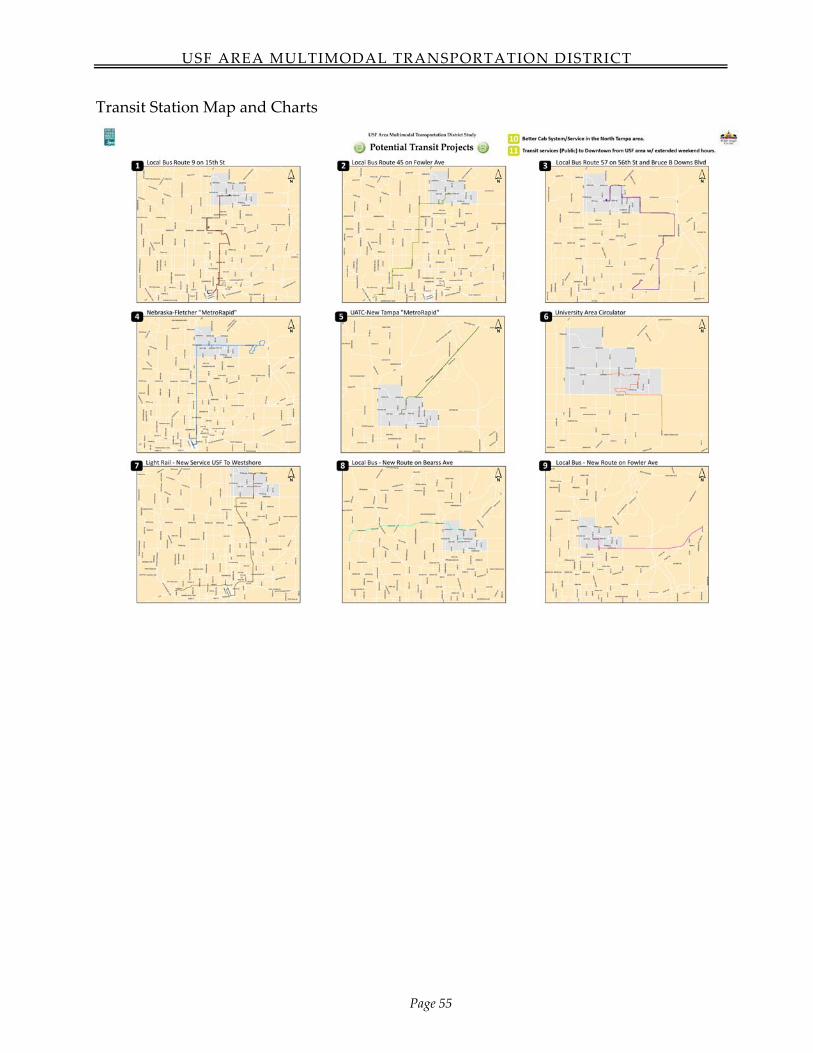
Page 55
Transit Station Map and Charts
Page 57
USF AREA MULTIMODAL TRANSPORTATION DISTRICT
Page 56
Note: Projects in green were those added by attendees at the public meeting.
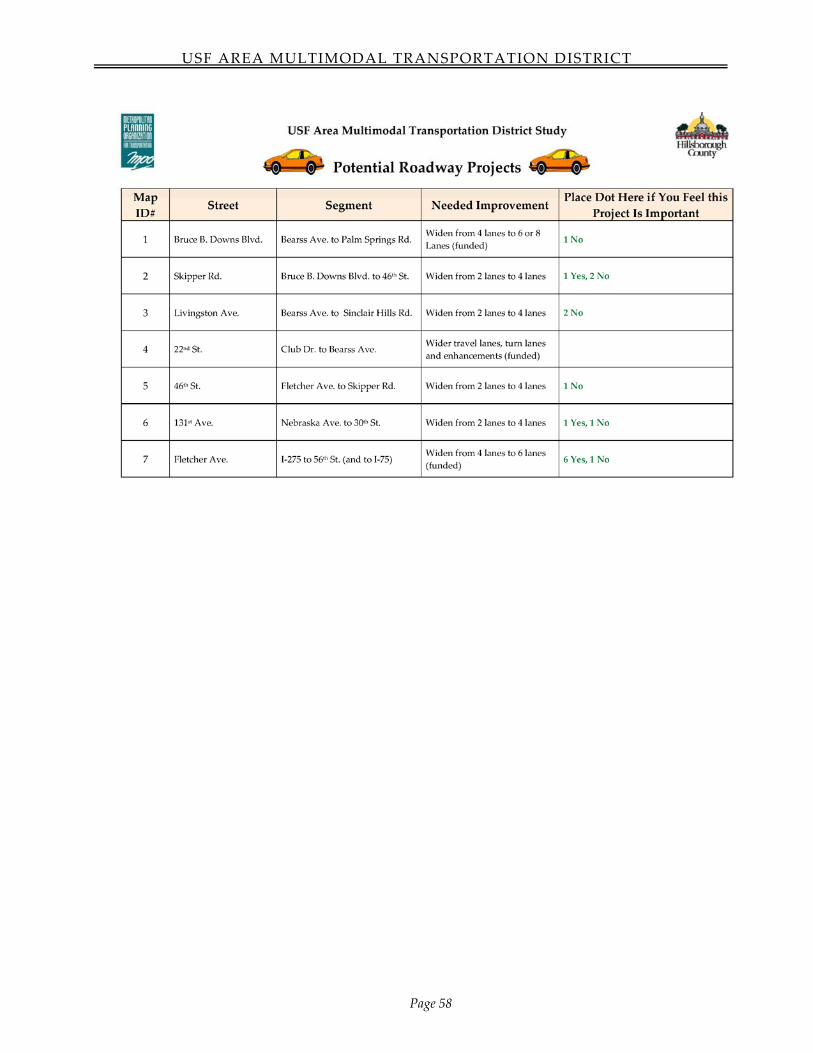
Page 58
USF AREA MULTIMODAL TRANSPORTATION DISTRICT
Page 57
Page 59
USF AREA MULTIMODAL TRANSPORTATION DISTRICT
Page 58
Page 60
USF AREA MULTIMODAL TRANSPORTATION DISTRICT
Page 59
APPENDIX D: Public Meeting General Comments (Dec. 7, 2009)
Two public meetings held at the University Area Community Center in Tampa. At the second
meeting on Monday, December 7, 2009, at 6:30 p.m., nine questionnaires were returned. A
summary of these comments are shown below.
Great Idea! Make me feel empowered as a part of my community. Did a great job of touching on key
projects relevant to transportation.
Bike lanes should be separated from roadway. Why isn’t 42nd defined as a pedestrian‐oriented
corridor? Does that term even exist? (in the county) Can the county deliberately design something
that is pedestrian‐oriented? Including landscape, lighting, separation from cars, orientation of
buildings/retail. I challenge you to have some guts!
Most of the projects look great. I would hate to see 46th Street and Skipper widened. They have a nice
neighborhood feeling. A train station at 42nd St. N and Bruce B. Downs would be a great location.
Sidewalks needed along 43rd St. (between Skipper and Bruce B. Downs).
Besides need for HART employees to get out of cars, as to consulting professionals and for HART
office staff to get out of the office and into the field, is a chronic need for a 33X that every 10 minutes
during rush hour goes between USF and Carrollwood, only stopping at UATC, both a south – such
along then crossable Fletcher and North such along Bearss Ave. Also that commuter bus to Pasco
goes into USF. No 1 cent sales tax is already too high and does discourage purchases. More money
can be raised (earmarked for transportation) by enforcement of traffic laws, especially turning cars
and bicycles on sidewalks . Rail is much cheaper if not electrified.
For pedestrian crosswalks blank out no turn signals for blinking yellow red turn signals when
pedestrians are crossing should be used. For bicycles, consider use of bike boxes at intersections,
making signal induction‐loop actuators trigger for bicycles and other facilities which make it possible
to make left turns at lights.
Please do not expand Fletcher Ave. A preservation and wildlife/recreational parks provide canoeing
and awesome outside adventures. Widening Fletcher Ave. could damage the Flatwoods please don’t
expand Fletcher.
On Bruce B. Downs, the Northern side of Fletcher Ave. there could be sidewalk improvements
especially near Grand Pavilion Drive, it is a dangerous intersection for bicyclists. More lighting can be
added because light and sidewalks are the only thing preventing me from venturing there in the
evening hours. The intersection of Fletcher Ave. and Livingston could be improved with a blank out
no turning when pedestrians in crosswalk because many accidents (including myself) have taken
place in that spot.
Excellent ideas. More interested in seeing pedestrian and bicycle lanes and safety improvements then
widening Fletcher Ave. and Fowler Ave. Opposed to widening Fletcher and Fowler Avenues.
Page 61
USF AREA MULTIMODAL TRANSPORTATION DISTRICT
Page 60
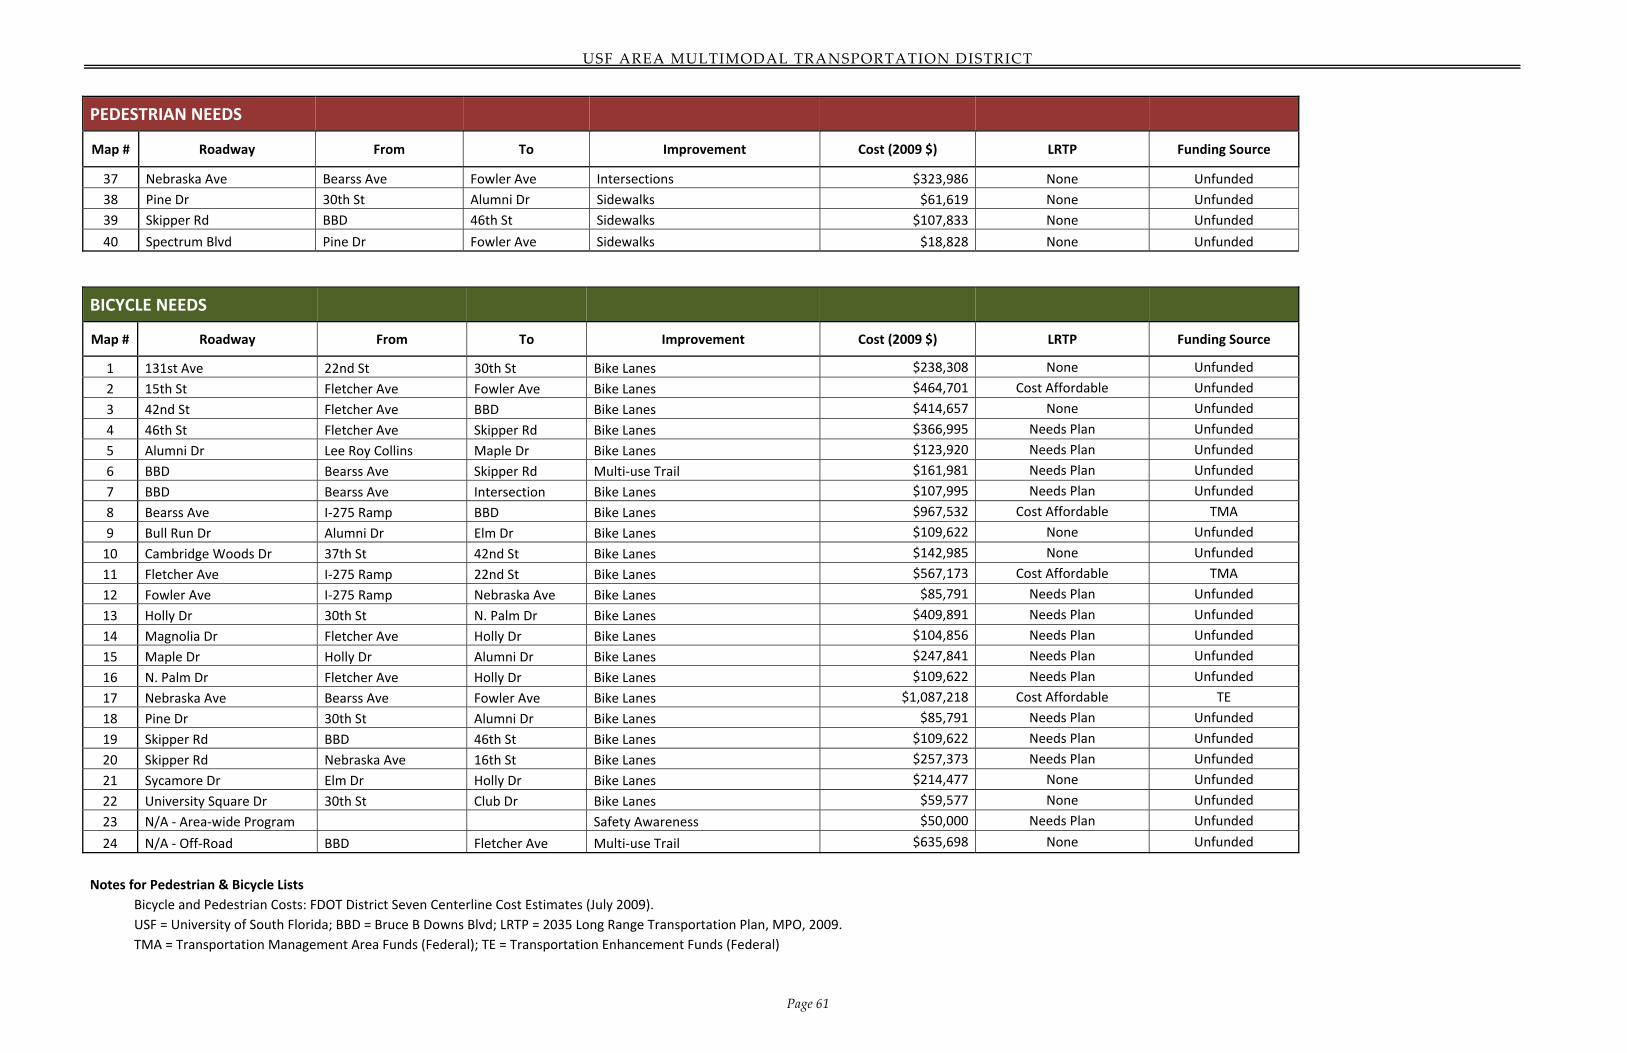
APPENDIX E: Improvements Summary List with Cost by Corridor with Maps
PEDESTRIAN NEEDS
Map # Roadway From To Improvement Cost (2009 $) LRTP Funding Source
1 131st Ave Nebraska Ave 20th St Sidewalks ‐ gaps only $104,410 Needs Plan Unfunded
2 138th Ave 15th St 19th St Sidewalks $89,005 None Unfunded
3 22nd St Fletcher Ave Bearss Ave Lighting unknown None Unfunded
4 22nd St Area‐wide Program Drainage $682,000 None Underway
5 30th St Bearss Ave Fowler Ave Sidewalks $320,077 Needs Plan Unfunded
6 30th St Bearss Ave Fowler Ave Intersections $485,979 Needs Plan Unfunded
7 30th St Grand Pavilion Intersection $53,998 None Unfunded
8 42nd St Skipper Rd Fletcher Ave Sidewalks $263,593 None Unfunded
9 42nd St Skipper Rd Fletcher Ave Drainage unknown None Unfunded
10 43rd St BBD Skipper Rd Sidewalks $47,926 None Unfunded
11 46th St Fletcher Ave Skipper Rd Sidewalks $131,796 None Unfunded
12 46th St Skipper Rd (SW corner) Drainage unknown None Unfunded
13 46th St Skipper Rd (SW corner) Safety bollards/barrier unknown None Unfunded
14 50th St Fletcher Ave Fowler Ave Sidewalks $71,889 None Unfunded
15 53rd St Fletcher Ave Fowler Ave Sidewalks $174,587 None Unfunded
16 56th St Fletcher Ave Fowler Ave Sidewalks $258,458 Cost Affordable Sales Tax
17 56th St Fletcher Ave Fowler Ave Landscaping, lighting unknown Needs Plan Unfunded
18 56th St 127th Ave Intersection $53,998 Cost Affordable Sales Tax
19 Alumni Dr Pine Dr Bull Run Sidewalks $311,519 None Unfunded
20 BBD Bearss Ave Skipper Rd Sidewalks (part of road widening) $0 Cost Affordable Sales Tax
21 BBD Bearss Ave Skipper Rd Intersections $107,995 None Unfunded
22 Bearss Ave I‐275 Ramp BBD Intersections $701,969 Needs Plan Unfunded
23 Bearss Ave Nebraska Ave Skipper Rd Sidewalks $131,796 Needs Plan Unfunded
24 Cambridge Woods Dr 37th St 42nd St Sidewalks $106,122 None Unfunded
25 Elm Dr 50th St Bull Run Sidewalks $68,466 None Unfunded
26 Elm Dr 50th St Intersection $53,998 None Unfunded
27 Fletcher Ave I‐275 Ramp 56th St Intersections $1,079,952 Cost Affordable TE
28 Fletcher Ave I‐275 Ramp 56th St Landscaping, lighting unknown Needs Plan Unfunded
29 Fletcher Ave Magnolia Dr 56th St Sidewalks $504,934 Cost Affordable TE
30 Fowler Ave I‐275 Ramp 56th St Sidewalks $333,769 Cost Affordable OA
31 Fowler Ave I‐275 Ramp 56th St Intersections $1,025,958 Cost Affordable OA
32 Fowler Ave I‐275 Ramp 56th St Landscaping, lighting unknown Needs Plan Unfunded
33 Holly Dr 30th St Magnolia Dr Sidewalks $13,693 None Unfunded
34 Livingston Ave Fletcher Ave 131st St Sidewalks $39,368 None Unfunded
35 Magnolia Dr Fletcher Ave Holly Dr Sidewalks $75,312 None Unfunded
36 Maple Dr Fletcher Ave Alumni Dr Sidewalks $44,503 None Unfunded
Page 62
USF AREA MULTIMODAL TRANSPORTATION DISTRICT
Page 61
PEDESTRIAN NEEDS
Map # Roadway From To Improvement Cost (2009 $) LRTP Funding Source
37 Nebraska Ave Bearss Ave Fowler Ave Intersections $323,986 None Unfunded
38 Pine Dr 30th St Alumni Dr Sidewalks $61,619 None Unfunded
39 Skipper Rd BBD 46th St Sidewalks $107,833 None Unfunded
40 Spectrum Blvd Pine Dr Fowler Ave Sidewalks $18,828 None Unfunded
BICYCLE NEEDS
Map # Roadway From To Improvement Cost (2009 $) LRTP Funding Source
1 131st Ave 22nd St 30th St Bike Lanes $238,308 None Unfunded
2 15th St Fletcher Ave Fowler Ave Bike Lanes $464,701 Cost Affordable Unfunded
3 42nd St Fletcher Ave BBD Bike Lanes $414,657 None Unfunded
4 46th St Fletcher Ave Skipper Rd Bike Lanes $366,995 Needs Plan Unfunded
5 Alumni Dr Lee Roy Collins Maple Dr Bike Lanes $123,920 Needs Plan Unfunded
6 BBD Bearss Ave Skipper Rd Multi‐use Trail $161,981 Needs Plan Unfunded
7 BBD Bearss Ave Intersection Bike Lanes $107,995 Needs Plan Unfunded
8 Bearss Ave I‐275 Ramp BBD Bike Lanes $967,532 Cost Affordable TMA
9 Bull Run Dr Alumni Dr Elm Dr Bike Lanes $109,622 None Unfunded
10 Cambridge Woods Dr 37th St 42nd St Bike Lanes $142,985 None Unfunded
11 Fletcher Ave I‐275 Ramp 22nd St Bike Lanes $567,173 Cost Affordable TMA
12 Fowler Ave I‐275 Ramp Nebraska Ave Bike Lanes $85,791 Needs Plan Unfunded
13 Holly Dr 30th St N. Palm Dr Bike Lanes $409,891 Needs Plan Unfunded
14 Magnolia Dr Fletcher Ave Holly Dr Bike Lanes $104,856 Needs Plan Unfunded
15 Maple Dr Holly Dr Alumni Dr Bike Lanes $247,841 Needs Plan Unfunded
16 N. Palm Dr Fletcher Ave Holly Dr Bike Lanes $109,622 Needs Plan Unfunded
17 Nebraska Ave Bearss Ave Fowler Ave Bike Lanes $1,087,218 Cost Affordable TE
18 Pine Dr 30th St Alumni Dr Bike Lanes $85,791 Needs Plan Unfunded
19 Skipper Rd BBD 46th St Bike Lanes $109,622 Needs Plan Unfunded
20 Skipper Rd Nebraska Ave 16th St Bike Lanes $257,373 Needs Plan Unfunded
21 Sycamore Dr Elm Dr Holly Dr Bike Lanes $214,477 None Unfunded
22 University Square Dr 30th St Club Dr Bike Lanes $59,577 None Unfunded
23 N/A ‐ Area‐wide Program Safety Awareness $50,000 Needs Plan Unfunded
24 N/A ‐ Off‐Road BBD Fletcher Ave Multi‐use Trail $635,698 None Unfunded
Notes for Pedestrian & Bicycle Lists Bicycle and Pedestrian Costs: FDOT District Seven Centerline Cost Estimates (July 2009).
USF = University of South Florida; BBD = Bruce B Downs Blvd; LRTP = 2035 Long Range Transportation Plan, MPO, 2009.
TMA = Transportation Management Area Funds (Federal); TE = Transportation Enhancement Funds (Federal)
Page 63
USF AREA MULTIMODAL TRANSPORTATION DISTRICT
Page 62
TRANSIT NEEDS
Map # Name of Service Type of Service Length of Service Within USF Area
Capital Cost * (2009 $)
Annual O&M Cost * (2009 $)
LRTP Funding Source
1 Bull Runner Amenities ** n/a $754,000 unknown None Unfunded
2 Nebraska‐Fletcher MetroRapid
Bus Rapid Transit 2.03 miles $4,734,182 $284,160 Cost Affordable Local Sales Tax, System Revenue, State Transit Program
3 New Route on Bearss Ave New Local Bus 3.29 miles $1,713,198 $1,014,984 Cost Affordable Local Sales Tax, System Revenue, State Transit Program
4 New Route on Fowler Ave New Local Bus 3.21 miles $1,102,500 $653,692 Cost Affordable Local Sales Tax, System Revenue, State Transit Program
5 Route 45 Improved Local Bus 2.21 miles unknown unknown Cost Affordable Local Sales Tax, System Revenue, State Transit Program
6 Route 57 Improved Local Bus 4.97 miles unknown unknown Cost Affordable Local Sales Tax, System Revenue, State Transit Program
7 Route 9 Improved Local Bus 1.58 miles unknown unknown Cost Affordable Local Sales Tax, System Revenue, State Transit Program
8 UATC‐New Tampa MetroRapid
Bus Rapid Transit 2.96 miles $6,600,839 $969,750 Cost Affordable Unfunded
9 University Area Circulator Circulator Bus 4.84 miles $1,490,133 $938,624 Cost Affordable Local Sales Tax, System Revenue, State Transit Program
10 Westshore to USF Short Distance Rail 2.50 miles $162,500,000 $3,215,408 Cost Affordable Local Sales Tax, State New Starts, New Federal Assistance
Notes for Transit List * Cost of portion of route located within the USF MMTD Study Area only, as opposed to the length of the entire route.
** New shelters with pad, bench, bike rack, trash receptacle. Currently 93 stops in system, 33 of those are sheltered. 13 new shelters needed to meet goal of half of total stops sheltered. (Cost $58,000 each, HART 2009.)
Transit Costs: 2035 MPO LRTP Needs Assessment (September 2009). Assumes per mile cost of project (total route cost/length) multiplied by length in study area.
USF = University of South Florida; UATC = University Area Transit Center; LRTP = 2035 Long Range Transportation Plan, MPO, 2009.
Page 64
USF AREA MULTIMODAL TRANSPORTATION DISTRICT
Page 63
SUMMARY LIST BY CORRIDOR
ROADWAY NEEDS
Map # Roadway From To Improvement Lane
Type Cost in CIE (2009 $)
Cost in 2035 LRTP CA (2009 $)
Funding Years Funding Source
1 131st Ave Nebraska Ave 30th St 2U to 4D ‐ $45,680,000 None Unfunded
2 22nd St Club Dr Fletcher Ave 2U to 2D ‐ $3,600,000 By 2015 Sales Tax
3 46th St Fletcher Ave Skipper Rd 2U to 4D ‐ $23,048,000 None Unfunded
4 BBD Bearss Ave Palm Springs Rd PD&E $3,800,000 ‐ 2009‐2015 CIT Phase III, Gas Taxes, General Revenues, Grants & County Match
5 BBD Bearss Ave Palm Springs Rd 4D to 6D * ‐ $43,000,000 2015‐2025 Sales Tax
6 Fletcher Ave 30th St I‐75 PD&E only $4,000,000 ‐ 2009‐2015 CIT Phase III ‐ Transportation Task Force
7 Fletcher Ave 30th St Morris Bridge Rd 4D to 6D ‐ $147,624,000 None Unfunded
8 Livingston Ave Bearss Ave Vandervort Rd 2U to 4D ‐ $59,966,000 None Unfunded
9 Skipper Rd BBD 46th St 2U to 4D ‐ $11,969,000 None Unfunded
Notes for Roadway List
* As listed in 2035 Long Range Transportation Plan, this highway project includes sidewalks.
CIE = Capital Improvements Element, Nov. 2009; CA= Cost Affordable; CIT = Community Investment Tax
U = Undivided, D = Divided, PD&E = Project Development and Environment Study BBD = Bruce B Downs Blvd; LRTP = 2035 Long Range Transportation Plan, MPO, 2009.
Notes for All Needs
All Needs: 2035 MPO LRTP Needs Assessment (September 2009), Level Of Service deficiencies, and Public Workshops 9/9/09 and 12/7/09.
Page 65
USF AREA MULTIMODAL TRANSPORTATION DISTRICT
Page 64
Page 66
USF AREA MULTIMODAL TRANSPORTATION DISTRICT
Page 65
Page 67
USF AREA MULTIMODAL TRANSPORTATION DISTRICT
Page 66
APPENDIX F: Prioritized Improvements Summary List with Cost by Corridor
SUMMARY LIST BY CORRIDOR ‐ SORTED BY TOTAL
1.1 PEDESTRIAN PROJECTS
Roadway From To Improvement Jurisdiction
Cost (2009 $)
LRTP Funding Source
MPO LRTP Need1
LOS Need2
LOS Not Assigned
Public Comment ConnectivityTotal8Wkshp
13 Wkshp 24 A5 B6 C7
1 Fletcher Ave I‐275 Ramp 56th St Intersections County $1,079,952 Cost Affordable TE 1 3 1 19 7 1 3 35
2 30th St Bearss Ave Fowler Ave Sidewalks County $320,077 Needs Plan Unfunded 1 3 1 13 4 1 2 25
3 Fletcher Ave I‐275 Ramp 56th St Landscaping, lighting County unknown Needs Plan Unfunded 1 3 1 6 7 1 3 22
4 30th St Bearss Ave Fowler Ave Intersections County $485,979 Needs Plan Unfunded 1 3 1 8 4 1 2 20
5 Fowler Ave I‐275 Ramp 56th St Sidewalks State $333,769 Cost Affordable OA 1 3 0 4 6 1 3 18
6 Fletcher Ave Magnolia Dr 56th St Sidewalks County $504,934 Cost Affordable TE 1 3 1 5 3 1 3 17
7 Fowler Ave I‐275 Ramp 56th St Intersections State $1,025,958 Cost Affordable OA 1 3 0 3 6 1 3 17
8 Fowler Ave I‐275 Ramp 56th St Landscaping, lighting State unknown Needs Plan Unfunded 1 3 0 2 6 1 3 16
9 43rd St BBD Skipper Rd Sidewalks County $47,926 None Unfunded 0 0 x 0 13 1 0 0 14
10 Skipper Rd BBD 46th St Sidewalks County $107,833 None Unfunded 0 2 0 9 2 0 0 13
11 30th St Grand Pavilion Intersection County $53,998 None Unfunded 0 3 0 7 1 1 0 12
12 56th St Fletcher Ave Fowler Ave Sidewalks County $258,458 Cost Affordable Sales Tax 1 2 0 6 2 1 0 12
13 50th St Fletcher Ave Fowler Ave Sidewalks County $71,889 None Unfunded 0 1 0 4 2 1 2 10
14 42nd St Skipper Rd Fletcher Ave Sidewalks County $263,593 None Unfunded 0 0 x 0 8 1 0 0 9
15 42nd St Skipper Rd Fletcher Ave Drainage County unknown None Unfunded 0 0 x 0 8 1 0 0 9
16 56th St Fletcher Ave Fowler Ave Landscaping, lighting County unknown Needs Plan Unfunded 1 2 0 3 2 1 0 9
17 Bearss Ave I‐275 Ramp BBD Intersections County $701,969 Needs Plan Unfunded 1 2 0 2 3 1 0 9
18 Cambridge Woods Dr 37th St 42nd St Sidewalks County $106,122 None Unfunded 0 0 x 1 8 0 0 0 9
19 Livingston Ave Fletcher Ave 131st St Sidewalks City $39,368 None Unfunded 0 0 x 0 6 2 0 0 8
20 22nd St Fletcher Ave Bearss Ave Lighting County unknown None Unfunded 0 0 1 6 0 0 0 7
21 131st Ave Nebraska Ave 20th St Sidewalks ‐ gaps only County $104,410 Needs Plan Unfunded 1 0 x 0 1 3 1 0 6
22 46th St Fletcher Ave Skipper Rd Sidewalks County $131,796 None Unfunded 0 2 0 2 1 1 0 6
23 46th St Skipper Rd (SW corner) Drainage County unknown None Unfunded 0 2 0 2 1 1 0 6
24 46th St Skipper Rd (SW corner) Safety bollards/ped barrier County unknown None Unfunded 0 2 0 2 1 1 0 6
25 Bearss Ave Nebraska Ave Skipper Rd Sidewalks County $131,796 Needs Plan Unfunded 1 3 0 0 1 1 0 6
26 Nebraska Ave Bearss Ave Fowler Ave Intersections State $323,986 None Unfunded 0 1 0 0 4 1 0 6
27 56th St 127th Ave Intersection County $53,998 Cost Affordable Sales Tax 1 2 0 1 0 1 0 5
28 BBD Bearss Ave Skipper Rd Sidewalks (part of road widening) County $0 Cost Affordable Sales Tax 0 2 0 1 1 1 0 5
29 BBD Bearss Ave Skipper Rd Intersections County $107,995 None Unfunded 0 2 0 1 1 1 0 5
30 53rd St Fletcher Ave Fowler Ave Sidewalks City $174,587 None Unfunded 0 0 x 1 1 2 0 0 4
31 Magnolia Dr Fletcher Ave Holly Dr Sidewalks USF $75,312 None Unfunded 0 2 0 1 1 0 0 4
32 Pine Dr 30th St Alumni Dr Sidewalks USF $61,619 None Unfunded 0 2 1 0 1 0 0 4
33 22nd St Area‐wide Program Drainage County $682,000 None Underway 0 0 0 1 1 1 0 3
34 Alumni Dr Pine Dr Bull Run Sidewalks USF $311,519 None Unfunded 0 1 0 2 0 0 0 3
Page 68
USF AREA MULTIMODAL TRANSPORTATION DISTRICT
Page 67
SUMMARY LIST BY CORRIDOR ‐ SORTED BY TOTAL
1.1 PEDESTRIAN PROJECTS
Roadway From To Improvement Jurisdiction
Cost (2009 $)
LRTP Funding Source
MPO LRTP Need1
LOS Need2
LOS Not Assigned
Public Comment ConnectivityTotal8Wkshp
13 Wkshp 24 A5 B6 C7
35 Holly Dr 30th St Magnolia Dr Sidewalks USF $13,693 None Unfunded 0 1 0 1 1 0 0 3
36 138th Ave 15th St 19th St Sidewalks County $89,005 None Unfunded 0 0 x 1 0 1 0 0 2
37 Elm Dr 50th St Bull Run Sidewalks USF $68,466 None Unfunded 0 0 0 1 1 0 0 2
38 Elm Dr 50th St Intersection USF $53,998 None Unfunded 0 1 0 0 1 0 0 2
39 Maple Dr Fletcher Ave Alumni Dr Sidewalks USF $44,503 None Unfunded 0 0 0 1 1 0 0 2
40 Spectrum Blvd Pine Dr Fowler Ave Sidewalks USF $18,828 None Unfunded 0 0 0 1 1 0 0 2
Notes for Pedestrian Projects 1 One point for designation as a project in the MPO 2035 LRTP Needs Plan 2 One point if the most deteriorated LOS along the corridor or intersection is equal to ‘D’
Two points if the most deteriorated LOS along the corridor or intersection is equal to ‘E’
Three points if the most deteriorated LOS along the corridor or intersection is equal to ‘F’
Certain roads do not have an LOS assignment. 3 One point for public comments received at first workshop ‐ any mention received a 1 score 4 One point for each vote in favor received at second workshop ‐ 24 votes (dots) were given to each attendee to use on any mode, and to vote for projects they added
Arterials and minor neighborhood collectors included were: Fowler Ave, Fletcher Ave, Bearss Ave, Bruce B. Downs Blvd, 131st Ave, Nebraska Ave, 15th St, 22nd St, 30th St, 46th St, 50th St, 56th St 5 One point for direct connection to an arterial and/or minor neighborhood collector in the USF MMTD Area 6 One point if project is actually on one of the above arterials or minor neighborhood collectors 7 One point for direct connection to primary USF campus thoroughfare Note: Primary USF campus thoroughfares included were: Holly Dr, Pine Dr, Spectrum Blvd, Alumni Dr, Magnolia Dr, North Palm Dr, Leroy Collins Blvd, Maple Dr, Bull
Run Dr, Elm Dr
8 Total is a summation of MPO LRTP score, LOS Need Score, Public Comment score, and Connectivity score. This scoring style skews the final results heavily toward the projects that received the most votes in favor at Workshop #2. This skewing may warrant the addition of weights to the other categories.
USF = University of South Florida; County = Hillsoborough County; City = City of Tampa, BBD = Bruce B Downs Blvd
TE = Transportation Enhancement Funds (Federal); OA = Other Arterial Funds (State & Federal)
Wkshp = Workshop/Public Meeting ‐ 1 held September 7, 2009, and 2 held December 9, 2009.
Page 69
USF AREA MULTIMODAL TRANSPORTATION DISTRICT
Page 68
SUMMARY LIST BY CORRIDOR ‐ SORTED BY TOTAL
2.1 BICYCLE PROJECTS
Roadway From To Improvement Jurisdiction Cost (2009 $) LRTP Funding Source
MPO LRTP Need1
LOS Need2
LOS Not Assigned
Public Comment Connectivity5 Total6Wkshp
13 Wkshp 24
1 Fletcher Ave I‐275 Ramp 22nd St Bike Lanes County $567,173 Cost Affordable TMA 1 2 1 21 3 28
2 BBD Bearss Ave Skipper Rd Multi‐use Trail County $161,981 Needs Plan Unfunded 1 0 1 12 1 15
3 Bearss Ave I‐275 Ramp BBD Bike Lanes County $967,532 Cost Affordable TMA 1 2 1 7 3 14
4 46th St Fletcher Ave Skipper Rd Bike Lanes County $366,995 Needs Plan Unfunded 1 2 1 7 2 13
5 Skipper Rd BBD 46th St Bike Lanes County $109,622 Needs Plan Unfunded 1 1 1 9 1 13
6 N/A ‐ Area‐wide Program Safety Awareness County $50,000 Needs Plan Unfunded 1 0 x 0 9 0 10
7 42nd St Fletcher Ave BBD Bike Lanes County $414,657 None Unfunded 0 0 x 0 9 0 9
8 BBD Bearss Ave Intersection Bike Lanes County $107,995 Needs Plan Unfunded 1 0 0 6 1 8
9 Holly Dr 30th St N. Palm Dr Bike Lanes USF $409,891 Needs Plan Unfunded 1 1 1 1 4 8
10 Nebraska Ave Bearss Ave Fowler Ave Bike Lanes State $1,087,218 Cost Affordable TE 1 1 0 4 2 8
11 15th St Fletcher Ave Fowler Ave Bike Lanes County $464,701 Cost Affordable Unfunded 1 0 0 2 4 7
12 Alumni Dr Lee Roy Collins Maple Dr Bike Lanes USF $123,920 Needs Plan Unfunded 1 0 0 4 2 7
13 Magnolia Dr Fletcher Ave Holly Dr Bike Lanes USF $104,856 Needs Plan Unfunded 1 1 0 3 2 7
14 N/A ‐ Off‐Road BBD Fletcher Ave Multi‐use Trail County $635,698 None Unfunded 0 0 x 0 5 2 7
15 Cambridge Woods Dr 37th St 42nd St Bike Lanes County $142,985 None Unfunded 0 0 x 1 5 0 6
16 131st Ave 22nd St 30th St Bike Lanes County $238,308 None Unfunded 0 0 x 1 1 3 5
17 Maple Dr Holly Dr Alumni Dr Bike Lanes USF $247,841 Needs Plan Unfunded 1 0 0 0 4 5
18 Pine Dr 30th St Alumni Dr Bike Lanes USF $85,791 Needs Plan Unfunded 1 1 1 0 2 5
19 Sycamore Dr Elm Dr Holly Dr Bike Lanes USF $214,477 None Unfunded 0 0 x 1 0 4 5
20 University Square Dr 30th St Club Dr Bike Lanes Private $59,577 None Unfunded 0 0 x 0 3 2 5
21 Fowler Ave I‐275 Ramp Nebraska Ave Bike Lanes State $85,791 Needs Plan Unfunded 1 1 0 1 1 4
22 N. Palm Dr Fletcher Ave Holly Dr Bike Lanes USF $109,622 Needs Plan Unfunded 1 1 0 0 1 3
23 Bull Run Dr Alumni Dr Elm Dr Bike Lanes USF $109,622 None Unfunded 0 0 0 0 2 2
24 Skipper Rd Nebraska Ave 16th St Bike Lanes County $257,373 Needs Plan Unfunded 1 1 0 0 0 2
Notes for Bicycle Projects 1 One point for designation as a project in the MPO 2035 LRTP Needs Plan 2 One point if the most deteriorated LOS along the corridor or intersection is equal to ‘D’
Two points if the most deteriorated LOS along the corridor or intersection is equal to ‘E’
Three points if the most deteriorated LOS along the corridor or intersection is equal to ‘F’ 3 One point for public comments received at first workshop ‐ any mention received a 1 score
Page 70
USF AREA MULTIMODAL TRANSPORTATION DISTRICT
Page 69
Notes for Bicycle Projects 4 One point for each vote in favor received at second workshop ‐ 24 votes (dots) were given to each attendee to use on any mode, and to vote for projects they added 5 One point for each direction a bicyclist can access an existing on‐road bike lane from the recommended project
MPO 2035 LRTP Cost Affordable projects are not considered as existing facilities 6 Total is a summation of MPO LRTP score, LOS Need Score, Public Comment score, and Connectivity score. This scoring style skews the final results heavily toward the projects that received the most votes in favor at Workshop #2. This
skewing may warrant the addition of weights to the other categories.
USF = University of South Florida; County = Hillsborough County; City = City of Tampa, BBD = Bruce B Downs Blvd
TMA = Transportation Management Area Funds (Federal); TE = Transportation Enhancement Funds (Federal)
Wkshp = Workshop/Public Meeting ‐ 1 held September 7, 2009, and 2 held December 9, 2009.
Page 71
USF AREA MULTIMODAL TRANSPORTATION DISTRICT
Page 70
SUMMARY LIST BY CORRIDOR ‐ SORTED BY TOTAL
3.1 TRANSIT PROJECTS
Name of Service Type of Service
Length of Service Within USF Area
Capital Cost * (2009 $)
Annual O&M Cost * (2009 $)
LRTP Funding Source MPO LRTP Need1
LOS Need2
Public Comment Connectivity5 Total6Wkshp
13 Wkshp 24
1 Westshore to USF Short Distance Rail 2.50 miles $162,500,000 $3,215,408 Cost Affordable Local Sales Tax, State New Starts, New Federal Assistance
1 2 1 26 10 40
2 University Area Circulator Circulator Bus 4.84 miles $1,490,133 $938,624 Cost Affordable Local Sales Tax, System Revenue, State Transit Program
1 2 0 12 19.36 34.36
3 Nebraska‐Fletcher MetroRapid
Bus Rapid Transit 2.03 miles $4,734,182 $284,160 Cost Affordable Local Sales Tax, System Revenue, State Transit Program
1 2 1 18 8.12 30.12
4 Route 57 Improved Local Bus 4.97 miles unknown unknown Cost Affordable Local Sales Tax, System Revenue, State Transit Program
1 2 0 4 19.88 26.88
5 UATC‐New Tampa MetroRapid
Bus Rapid Transit 2.96 miles $6,600,839 $969,750 Cost Affordable Unfunded 1 2 1 7 11.84 22.84
6 New Route on Bearss Ave New Local Bus 3.29 miles $1,713,198 $1,014,984 Cost Affordable Local Sales Tax, System Revenue, State Transit Program
1 1 0 3 13.16 18.16
7 New Route on Fowler Ave New Local Bus 3.21 miles $1,102,500 $653,692 Cost Affordable Local Sales Tax, System Revenue, State Transit Program
1 2 0 0 12.84 15.84
8 Route 45 Improved Local Bus 2.21 miles unknown unknown Cost Affordable Local Sales Tax, System Revenue, State Transit Program
1 1 0 4 8.84 14.84
9 Route 9 Improved Local Bus 1.58 miles unknown unknown Cost Affordable Local Sales Tax, System Revenue, State Transit Program
1 1 0 2 6.32 10.32
10 Bull Runner Amenities ** n/a $754,000 unknown None Unfunded 0 0 0 1 n/a 1
Notes for Transit Projects
* Cost of portion of route located within the USF MMTD Study Area only, as opposed to the length of the entire route.
** New shelters with pad, bench, bike rack, trash receptacle. Currently 93 stops in system, 33 of those are sheltered. 13 new shelters needed to meet goal of half of total stops sheltered. (Cost $58,000 each, HART 2009.)
1 One point for designation as a project in the MPO 2035 LRTP Needs Plan 2 One point if the most deteriorated LOS along the corridor or intersection is equal to ‘E’
Two points if the most deteriorated LOS along the corridor or intersection is equal to ‘F’ 3 One point for public comments received at first workshop ‐ any mention received a 1 score
4 One point for each vote in favor received at second workshop ‐ 24 votes (dots) were given to each attendee to use on any mode, and to vote for projects they added
5 One point for each 0.25 mile of transit service within the USF MMTD Study Area
Page 72
USF AREA MULTIMODAL TRANSPORTATION DISTRICT
Page 71
6 Total is a summation of MPO LRTP score, LOS Need Score, Public Comment score, and Connectivity score. This scoring style skews the final results heavily toward the projects that received the most votes in favor at Workshop #2. This skewing may warrant the addition of weights to the other categories.
USF = University of South Florida; UATC = University Area Transit Center
Wkshp = Workshop/Public Meeting ‐ 1 held September 7, 2009, and 2 held December 9, 2009.
SUMMARY LIST BY CORRIDOR ‐ SORTED BY TOTAL
4.1 ROADWAY PROJECTS
Roadway From To
Improvement Lane Type
Cost in CIE (2009 $)
Cost in 2035 LRTP CA (2009
$)
Funding Years
Funding Source MPO LRTP Need
LOS Public Comment
Wkshp 1 Wkshp 2
1 Fletcher Ave 30th St I‐75 PD&E only $4,000,000 ‐ 2009‐2015
CIT Phase III ‐ Transportation Task Force
No F n/a 5
2 Fletcher Ave 30th St Morris Bridge Rd 4D to 6D ‐ $147,624,000 None Unfunded Yes F n/a 5
3 131st Ave Nebraska Ave 30th St 2U to 4D ‐ $45,680,000 None Unfunded Yes C n/a 0
4 BBD Bearss Ave Palm Springs Rd 4D to 6D * ‐ $43,000,000 2015‐2025
Sales Tax Yes F n/a 0
5 22nd St Club Dr Fletcher Ave 2U to 2D ‐ $3,600,000 By 2015 Sales Tax Yes C n/a 0
6 46th St Fletcher Ave Skipper Rd 2U to 4D ‐ $23,048,000 None Unfunded Yes F n/a ‐1
7 BBD Bearss Ave Palm Springs Rd PD&E $3,800,000 ‐ 2009‐2015
CIT Phase III, Gas Taxes, General Revenues, Grants & County Match
No F n/a ‐1
8 Skipper Rd BBD 46th St 2U to 4D ‐ $11,969,000 None Unfunded Yes E n/a ‐1
9 Livingston Ave Bearss Ave Vandervort Rd 2U to 4D ‐ $59,966,000 None Unfunded Yes F n/a ‐2
Notes for Roadway Projects
* Includes sidewalks (received 1 Public Comment vote for sidewalks, but 1 vote "no" for widening = 0)
Negative votes indicate opposition of the project.
CIE = Capital Improvements Element, Nov. 2009; CA= Cost Affordable; CIT = Community Investment Tax
U = Undivided, D = Divided, PD&E = Project Development and Environment Study
LOS Source: Hillsborough County Roadway Level of Service (LOS) Report, Sept. 2008.
BBD = Bruce B Downs Blvd
Wkshp = Workshop/Public Meeting ‐ 1 held September 7, 2009, and 2 held December 9, 2009.
Page 73
USF AREA MULTIMODAL TRANSPORTATION DISTRICT
Page 72
APPENDIX G: Improvements List Detailed By Corridor Segment
5.0 Bicycle and Pedestrian Needs by Corridor Segment LENGTH No.
Needs Identified
Dots Cost Estimate1 ($ 2009) ROADWAY FROM TO (miles) Location Owner Need Source
131ST AVE NEBRASKA AVE BRUCE B DOWNS BLVD 1.11 Bike Lanes and Sidewalks 16 2 $ 342,718
131ST AVE NEBRASKA AVE ROBBINS LUMBER 0.14 Hillsborough Hillsborough Sidewalk Gaps: South Sidewalk btw Nebraska and Rail Corridor
LOS and MPO Needs 6 1 $ 23,963
131ST AVE ROBBINS LUMBER (Rail Corridor) 15TH ST 0.36 Hillsborough Hillsborough Sidewalk Gaps: South Sidewalk btw Rail Corridor and 15th St MPO Needs 4 1 $ 61,619
131ST AVE 15TH ST 22ND ST 0.11 Hillsborough Hillsborough Sidewalk Gaps: North Sidewalk btw 18th and 20th St MPO Needs 4 1 $ 18,828
131ST AVE 22ND ST BRUCE B DOWNS BLVD 0.50 Hillsborough Hillsborough Bike Lane from VA Hospital to 22nd St (both sides)
Public Comment 2 1 $ 238,308
131ST AVE BRUCE B DOWNS BLVD Intersection Hillsborough Hillsborough County Project: Intersection Improvements ? N/A
138TH AVE 15TH ST 19TH ST 0.26 Sidewalks 2 0 $ 89,005
138TH AVE 15TH ST 19TH ST 0.26 Hillsborough Hillsborough Sidewalk Gaps: both sides Public Comment 2 0 $ 89,005
15th ST FLETCHER AVE FOWLER AVE 1.01 Bike Lanes 9 2 $ 464,701
15TH ST 131ST AVE FLETCHER AVE 0.25 Hillsborough Hillsborough
Bike Lanes: Gaps on entire west side, gaps on east side btw La Place Circle and Fletcher MPO Needs 5 2 $ 102,473
15TH ST FOWLER AVE 131ST AVE 0.76 Hillsborough Hillsborough Bike Lanes MPO Needs 4 2 $ 362,229
22nd ST BEARSS AVE FLETCHER AVE 1.02 ADA Compliant Curb Cuts 7 ? $ 11,036
22ND ST FLETCHER AVE BEARSS AVE 0.77 Hillsborough Hillsborough Curb Cuts: 4 intersections Public Comment 4 ? $ 6,306
22ND ST FLETCHER AVE BEARSS AVE 0.77 Hillsborough Hillsborough County Project ? N/A
22ND ST 131ST AVE FLETCHER AVE 0.25 Hillsborough Hillsborough Curb Cuts: 3 intersections Public Comment 3 ? $ 4,730
30th ST BEARSS AVE FOWLER AVE 1.49 Sidewalks, Crosswalks, Safety 102 28 $ 806,056
30TH ST 138TH AVE BEARSS AVE 0.49 Hillsborough Hillsborough
Sidewalk Gaps: West side btw Azalee Cir and Americana Lane, entire east side
LOS and MPO Needs 26 13 $ 148,913
30TH ST 138TH AVE BEARSS AVE Hillsborough Hillsborough Intersection Improvement at 30th St & Grand Pavilion Dr
Public Comment 7 $ 53,998
-------------------------------------------------------------------------------------------------------------------------------------------------------------------------------------------------------------------------------------------------------Subtotal $ 202,910
30TH ST 131ST AVE FLETCHER AVE 0.25 Hillsborough Hillsborough
Pedestrian LOS: High corridor volumes, pedestrian safety enhancements (3 Intersection Improvements)
LOS and MPO Needs 26 8 $ 161,993
30TH ST 131ST AVE FLETCHER AVE 0.25 Hillsborough Hillsborough Sidewalk Gap: east side Public Comment 13 $ 42,791
-------------------------------------------------------------------------------------------------------------------------------------------------------------------------------------------------------------------------------------------------------Subtotal $ 204,784
Page 74
USF AREA MULTIMODAL TRANSPORTATION DISTRICT
Page 73
5.0 Bicycle and Pedestrian Needs by Corridor Segment LENGTH No.
Needs Identified
Dots Cost Estimate1 ($ 2009) ROADWAY FROM TO (miles) Location Owner Need Source
30TH ST PINE DR 131ST AVE 0.58 Hillsborough Hillsborough
Pedestrian LOS: High corridor volumes, pedestrian safety enhancements (3 Intersection Improvements)
LOS and MPO Needs 25 8 $ 161,993
30TH ST PINE DR 131ST AVE 0.58 Hillsborough Hillsborough Sidewalk Gap: east side LOS and MPO Needs 13 $ 99,275
-------------------------------------------------------------------------------------------------------------------------------------------------------------------------------------------------------------------------------------------------------Subtotal $ 261,268
30TH ST FOWLER AVE PINE DR 0.17 Hillsborough Hillsborough
Pedestrian LOS: High corridor volumes, pedestrian safety enhancements (2 Intersection Improvements) LOS Need 25 8 $ 107,995
30TH ST FOWLER AVE PINE DR 0.17 Hillsborough Hillsborough Sidewalk Gap: east side
MPO Needs and Public Comment 13 $ 29,098
-------------------------------------------------------------------------------------------------------------------------------------------------------------------------------------------------------------------------------------------------------Subtotal $ 137,093
42ND ST BRUCE B DOWNS BLVD FLETCHER AVE 0.87 Sidewalks 28 17 $ 678,249
42ND ST SKIPPER RD FLETCHER AVE 0.77 Hillsborough Hillsborough Sidewalk Gaps: both sides Public Comment 18 8 $ 263,593
42ND ST SKIPPER RD FLETCHER AVE 0.77 Hillsborough Hillsborough Bike Lane Public Comment 9 $ 366,995
42ND ST BRUCE B DOWNS BLVD SKIPPER RD 0.10 Hillsborough Hillsborough Bike Lane Public Comment 10 9 $ 47,662
42ND ST N PALM DR Intersection Hillsborough Hillsborough County Project: Intersection Improvements ? N/A
43RD ST BRUCE B DOWNS BLVD SKIPPER RD 0.14 Sidewalks 14 13 $ 47,926
43RD ST BRUCE B DOWNS BLVD SKIPPER RD 0.14 Sidewalk Gaps: both sides Public Comment 14 13 $ 47,926
46th ST FLETCHER AVE SKIPPER RD 0.77 Bike Lanes and Sidewalks 17 9 $ 498,791
46TH ST FLETCHER AVE SKIPPER RD 0.77 Tampa/
Hillsborough Hillsborough Bike LOS: no bike lanes
LOS, MPO Needs, and Public Comment 17 7 $ 366,995
46TH ST FLETCHER AVE SKIPPER RD 0.77 Tampa/
Hillsborough Hillsborough Sidewalk Gap: east side LOS Need 2 $ 131,796
46TH ST FLETCHER AVE Intersection Tampa/
Hillsborough Hillsborough County Project/Intersection Improvements ? N/A
LENGTH No. Needs
IdentifiedDots Cost Estimate1 ($
2009) ROADWAY FROM TO (miles) Location Owner Need Source
50th ST FLETCHER AVE FOWLER AVE 1.01 Sidewalks 7 4 $ 71,889
50TH ST FOWLER AVE FLETCHER AVE 1.01 Hillsborough Hillsborough
Sidewalk Gaps: eastside btw Fletcher and Excellence Blvd, 128th and 122nd/westside btw Fletcher and Holly Ct LOS Need 7 4 $ 71,889
53rd ST FLETCHER AVE FOWLER AVE 1.02 Sidewalks 8 1 $ 174,587
Page 75
USF AREA MULTIMODAL TRANSPORTATION DISTRICT
Page 74
5.0 Bicycle and Pedestrian Needs by Corridor Segment LENGTH No.
Needs Identified
Dots Cost Estimate1 ($ 2009) ROADWAY FROM TO (miles) Location Owner Need Source
53rd ST FLETCHER AVE FOWLER AVE 1.02 Temple Terrace
Temple Terrace Sidewalk Gaps: east side
Public Comment 8 1 $ 174,587
56th ST FLETCHER AVE FOWLER AVE 1.01 Sidewalks, Crosswalks, Safety 15 10 $ 420,451
56TH ST FOWLER AVE FLETCHER AVE 1.01 Temple Terrace Hillsborough
Pedestrian LOS: High corridor volumes, pedestrian safety enhancements (3 Intersection Improvements)
MPO Needs and Public Comment 15 4 $ 161,993
56TH ST FOWLER AVE FLETCHER AVE 1.01 Temple Terrace Hillsborough
Sidewalk Gap: east side btw Fowler and 122nd /westside from north of Fowler to Fletcher LOS Need 6 $ 258,458
PINE DR 30TH ST ALUMNI DR 0.18 Bike Lanes and Sidewalks 9 0 $ 147,410
PINE DR 30TH ST ALUMNI DR 0.18 Tampa
Owned By State
Maintained By USF Bike LOS: no bike lanes
LOS Needs, Public Comment, USF Master Plan 9 0 $ 85,791
PINE DR 30TH ST ALUMNI DR 0.18 Tampa
Owned By State
Maintained By USF Sidewalk Gaps: both sides
LOS Need, Public Comment, USF Master Plan 0 $ 61,619
ALUMNI DR PINE DRIVE BULL RUN DR 1.21 Bike Lanes and Sidewalks 21 6 $ 435,439
ALUMNI DR PINE DR LEROY COLLINS BLVD 0.75 Tampa
Owned By State
Maintained By USF
Sidewalk Gaps: north side btw Pine and Magnolia, Laurel and Lee Roy/south side btw Pine and Laurel, Palm to Leroy Collins
LOS Need, Public Comment, USF Master Plan 9 2 $ 243,053
ALUMNI DR LEROY COLLINS BLVD MAPLE DR 0.26 Tampa
Owned By State
Maintained By USF Bike LOS: no bike lanes
MPO Needs & USF Master Plan 9 4 $ 123,920
ALUMNI DR MAPLE DR BULL RUN 0.20 Tampa
Owned By State
Maintained By USF Sidewalk Gaps: both sides LOS Need 3 2 $ 68,466
BEARSS AVE I-275 N RAMP BRUCE B DOWNS BLVD 2.03 Bike Lanes, Sidewalks, Crosswalks, Safety 101 9 $ 1,801,298
BEARSS AVE I-275 N RAMP NEBRASKA AVE 0.17 Hillsborough State
Pedestrian LOS: High corridor volumes, pedestrian safety enhancements (2 Intersection Improvements) LOS Need 16 2 $ 107,995
BEARSS AVE I-275 N RAMP NEBRASKA AVE 0.17 Hillsborough State Bike LOS: no bike lanes
LOS, MPO Needs, and Public Comment 7 $ 81,025
-------------------------------------------------------------------------------------------------------------------------------------------------------------------------------------------------------------------------------------------------------Subtotal $ 189,020
Page 76
USF AREA MULTIMODAL TRANSPORTATION DISTRICT
Page 75
5.0 Bicycle and Pedestrian Needs by Corridor Segment LENGTH No.
Needs Identified
Dots Cost Estimate1 ($ 2009) ROADWAY FROM TO (miles) Location Owner Need Source
BEARSS AVE NEBRASKA AVE SKIPPER RD 0.77 Hillsborough Hillsborough
Pedestrian LOS: High corridor volumes, pedestrian safety enhancements (3 Intersection Improvements) LOS Need 17 2 $ 161,993
BEARSS AVE NEBRASKA AVE SKIPPER RD 0.77 Hillsborough Hillsborough Sidewalk Gaps: north side LOS Need 0 $ 131,796
BEARSS AVE NEBRASKA AVE SKIPPER RD 0.77 Hillsborough Hillsborough Bike LOS: no bike lanes
LOS, MPO Needs, and Public Comment 7 $ 366,995
-------------------------------------------------------------------------------------------------------------------------------------------------------------------------------------------------------------------------------------------------------Subtotal $ 660,784
BEARSS AVE SKIPPER RD 17TH ST 0.07 Hillsborough Hillsborough
Pedestrian LOS: High corridor volumes, pedestrian safety enhancements (1 Intersection Improvement) LOS Need 15 2 $ 53,998
BEARSS AVE SKIPPER RD 17TH ST 0.07 Hillsborough Hillsborough Bike LOS: no bike lanes
LOS, MPO Needs, and Public Comment 7 $ 33,363
-------------------------------------------------------------------------------------------------------------------------------------------------------------------------------------------------------------------------------------------------------Subtotal $ 87,361 LENGTH No.
Needs Identified
Dots Cost Estimate1 ($ 2009) ROADWAY FROM TO (miles) Location Owner Need Source
BEARSS AVE 17TH ST 22ND ST 0.42 Hillsborough Hillsborough
Pedestrian LOS: High corridor volumes, pedestrian safety enhancements (3 Intersection Improvements) LOS Need 17 2 $ 161,993
BEARSS AVE 17TH ST 22ND ST 0.42 Hillsborough Hillsborough Bike LOS: no bike lanes
LOS, MPO Needs, and Public Comment 7 $ 200,179
-------------------------------------------------------------------------------------------------------------------------------------------------------------------------------------------------------------------------------------------------------Subtotal $ 362,172
BEARSS AVE 22ND ST LIVINGSTON AVE 0.24 Hillsborough Hillsborough
Pedestrian LOS: High corridor volumes, pedestrian safety enhancements (2 Intersection Improvements) LOS Need 18 2 $ 107,995
BEARSS AVE 22ND ST LIVINGSTON AVE 0.24 Hillsborough Hillsborough Bike LOS: no bike lanes
LOS & MPO Needs, and Public Comment 7 $ 114,388
-------------------------------------------------------------------------------------------------------------------------------------------------------------------------------------------------------------------------------------------------------Subtotal $ 222,383
BEARSS AVE LIVINGSTON AVE BRUCE B DOWNS BLVD 0.36 Hillsborough Hillsborough
Pedestrian LOS: High corridor volumes, pedestrian safety enhancements (2 Intersection Improvements) LOS Need 18 2 $ 107,995
BEARSS AVE LIVINGSTON AVE BRUCE B DOWNS BLVD 0.36 Hillsborough Hillsborough Bike LOS: no bike lanes 7 $ 171,582
-------------------------------------------------------------------------------------------------------------------------------------------------------------------------------------------------------------------------------------------------------Subtotal $ 279,577
BRUCE B DOWNS BLVD BEARSS AVE SKIPPER RD 0.53 Bike Lanes, Sidewalks, Crosswalks, Safety 26 20 $ 269,976
Page 77
USF AREA MULTIMODAL TRANSPORTATION DISTRICT
Page 76
5.0 Bicycle and Pedestrian Needs by Corridor Segment LENGTH No.
Needs Identified
Dots Cost Estimate1 ($ 2009) ROADWAY FROM TO (miles) Location Owner Need Source
BRUCE B DOWNS BLVD BEARSS AVE SKIPPER RD 0.53 Hillsborough Hillsborough Sidewalk Gap/Multi-Use Trail: north side
LOS, MPO Needs, and Public Comment 26 19 $ 161,981
BRUCE B DOWNS BLVD BEARSS AVE SKIPPER RD 0.53 Hillsborough Hillsborough
Pedestrian LOS: High corridor volumes, pedestrian safety enhancements (2 Intersection Improvements) LOS Need 1 $ 107,995
CAMBRIDGE WOODS DR 37TH ST 42ND ST 0.31 Bike Lanes, Sidewalks 15 13 $ 249,107
CAMBRIDGE WOODS DR 37TH ST 42ND ST 0.31 Hillsborough Hillsborough Sidewalk Gap: both sides Public Comment 15 8 $ 106,122
CAMBRIDGE WOODS DR 37TH ST 42ND ST 0.30 Hillsborough Hillsborough Bike Lane Gap: both sides Public Comment 5 $ 142,985
-------------------------------------------------------------------------------------------------------------------------------------------------------------------------------------------------------------------------------------------------------Subtotal
ELM DR BULL RUN DR 50TH ST 0.20 Bike Lanes, Sidewalks, Crosswalks, Safety 2 1 $ 122,463
ELM DR BULL RUN DR 50TH ST 0.20 Tampa
Owned By State
Maintained By USF Sidewalk Gap: both sides
USF Campus Connections 2 1 $ 68,466
ELM DR BULL RUN DR 50TH ST 0.20 Tampa
Owned By State
Maintained By USF
Pedestrian enhancements (1 Intersection Improvement)
USF Campus Connections 0 $ 53,998
BULL RUN DR ALUMNI DR ELM DR 0.23 Bike Lanes 0 0 $ 109,622
BULL RUN DR ALUMNI DR ELM DR 0.23 Tampa
Owned By State
Maintained By USF Bike Lane Gap: both sides MPO Need 0 0 $ 109,622
FLETCHER AVE I-275 N RAMP 56TH STREET 3.92 Bike Lanes, Sidewalks, Crosswalks, Safety 448 51 $ 2,152,062
FLETCHER AVE I-275 N RAMP NEBRASKA AVE 0.18 Hillsborough State
Pedestrian LOS: High corridor volumes, pedestrian safety enhancements (1 Intersection Improvement)
LOS and MPO Needs 53 25 $ 53,998
FLETCHER AVE I-275 N RAMP NEBRASKA AVE 0.18 Hillsborough State Bike LOS: no bike lanes LOS and MPO Needs 21 $ 85,791
-------------------------------------------------------------------------------------------------------------------------------------------------------------------------------------------------------------------------------------------------------Subtotal $ 139,789
FLETCHER AVE NEBRASKA AVE 15TH ST 0.51 Hillsborough Hillsborough
Pedestrian LOS: High corridor volumes, pedestrian safety enhancements (2 Intersection Improvements)
LOS and MPO Need 55 25 $ 107,995
FLETCHER AVE NEBRASKA AVE 15TH ST 0.51 Hillsborough Hillsborough Bike Lane Gap: both Sides MPO Needs 21 $ 243,074
-------------------------------------------------------------------------------------------------------------------------------------------------------------------------------------------------------------------------------------------------------Subtotal $ 351,070
Page 78
USF AREA MULTIMODAL TRANSPORTATION DISTRICT
Page 77
5.0 Bicycle and Pedestrian Needs by Corridor Segment LENGTH No.
Needs Identified
Dots Cost Estimate1 ($ 2009) ROADWAY FROM TO (miles) Location Owner Need Source
FLETCHER AVE 15TH ST 22ND ST 0.50 Hillsborough Hillsborough
Pedestrian LOS: High corridor volumes, pedestrian safety enhancements (3 Intersection Improvements)
LOS and MPO Need 58 25 $ 161,993
FLETCHER AVE 15TH ST 22ND ST 0.50 Hillsborough Hillsborough Bike Lane Gap: both sides MPO Needs 21 $ 238,308
-------------------------------------------------------------------------------------------------------------------------------------------------------------------------------------------------------------------------------------------------------Subtotal $ 400,301 LENGTH No.
Needs Identified
Dots Cost Estimate1 ($ 2009) ROADWAY FROM TO (miles) Location Owner Need Source
FLETCHER AVE 22ND ST LIVINGSTON AVE 0.25 Hillsborough Hillsborough
Pedestrian LOS: High corridor volumes, pedestrian safety enhancements (2 Intersection Improvements) LOS Need 34 25 $ 107,995
FLETCHER AVE LIVINGSTON AVE 30TH ST 0.26 Hillsborough Hillsborough
Pedestrian LOS: High corridor volumes, pedestrian safety enhancements (1 Intersection Improvement) LOS Need 35 25 $ 53,998
-------------------------------------------------------------------------------------------------------------------------------------------------------------------------------------------------------------------------------------------------------Subtotal $ 161,993
FLETCHER AVE 30TH ST MAGNOLIA DR 0.19 Hillsborough Hillsborough
Pedestrian LOS: High corridor volumes, pedestrian safety enhancements (2 Intersection Improvements) LOS Need 37 25 $ 107,995
FLETCHER AVE 30TH ST MAGNOLIA DR 0.19 Hillsborough Hillsborough Sidewalk Gap: south side MPO Need 5 $ 32,521
-------------------------------------------------------------------------------------------------------------------------------------------------------------------------------------------------------------------------------------------------------Subtotal $ 140,517
FLETCHER AVE MAGNOLIA DR 42ND ST 0.35 Hillsborough Hillsborough
Pedestrian LOS: High corridor volumes, pedestrian safety enhancements (2 Intersection Improvements) LOS Need 33 25 $ 107,995
FLETCHER AVE MAGNOLIA DR 42ND ST 0.35 Hillsborough Hillsborough Sidewalk Gap: south side MPO Need 5 $ 59,907
-------------------------------------------------------------------------------------------------------------------------------------------------------------------------------------------------------------------------------------------------------Subtotal $ 167,903
FLETCHER AVE 42ND ST N PALM DR 0.06 Hillsborough Hillsborough
Pedestrian LOS: High corridor volumes, pedestrian safety enhancements (1 Intersection Improvement) LOS Need 33 25 $ 53,998
FLETCHER AVE N PALM DR Intersection Hillsborough Hillsborough County Project: Intersection Improvements LOS Need ? N/A
FLETCHER AVE N PALM DR 46TH ST 0.65 Hillsborough Hillsborough
Pedestrian LOS: High corridor volumes, pedestrian safety enhancements (2 Intersection Improvements) LOS Need 35 25 $ 107,995
FLETCHER AVE N PALM DR 46TH ST 0.65 Hillsborough Hillsborough Sidewalk Gap: south side MPO Needs 5 $ 111,257
-------------------------------------------------------------------------------------------------------------------------------------------------------------------------------------------------------------------------------------------------------Subtotal $ 219,252
FLETCHER AVE 46TH ST 50TH ST 0.48 Tampa Hillsborough
Pedestrian LOS: High corridor volumes, pedestrian safety enhancements (2 Intersection Improvements) LOS Needs 37 25 $ 107,995
FLETCHER AVE 46TH ST 50TH ST 0.48 Tampa Hillsborough Sidewalk Gap: both sides LOS, MPO Needs, and 5 $ 164,318
Page 79
USF AREA MULTIMODAL TRANSPORTATION DISTRICT
Page 78
5.0 Bicycle and Pedestrian Needs by Corridor Segment LENGTH No.
Needs Identified
Dots Cost Estimate1 ($ 2009) ROADWAY FROM TO (miles) Location Owner Need Source
Public Comment
-------------------------------------------------------------------------------------------------------------------------------------------------------------------------------------------------------------------------------------------------------Subtotal $ 272,313
FLETCHER AVE 50TH ST 56TH ST 0.49 Hillsborough Hillsborough
Pedestrian LOS: High corridor volumes, pedestrian safety enhancements (2 Intersection Improvements) LOS Need 38 25 $ 107,995
FLETCHER AVE 50TH ST 56TH ST 0.49 Hillsborough Hillsborough Sidewalk Gap: south side btwn 50th and 53rd, entire north side
LOS and MPO Needs 5 $ 136,931
-------------------------------------------------------------------------------------------------------------------------------------------------------------------------------------------------------------------------------------------------------Subtotal $ 244,927
FLETCHER AVE CORRIDOR STUDY 15TH ST 46TH ST 0.49 Hillsborough Hillsborough
Improvements associated with Corridor Study
LOS and MPO Needs 51 N/A
FOWLER AVE I-275 N RAMP 56TH ST 3.65 Bike Lanes, Sidewalks, Crosswalks, Safety 153 10 $ 1,445,517
FOWLER AVE I-275 N RAMP NEBRASKA AVE 0.18 Tampa State
Pedestrian LOS: High corridor volumes, pedestrian safety enhancements (1 Intersection Improvement)
LOS and MPO Need 12 5 $ 53,998
FOWLER AVE I-275 N RAMP NEBRASKA AVE 0.18 Tampa State Bike Lane Gap: both sides LOS and MPO Need 1 $ 85,791
-------------------------------------------------------------------------------------------------------------------------------------------------------------------------------------------------------------------------------------------------------Subtotal $ 139,789
FOWLER AVE NEBRASKA AVE 15TH ST 0.51 Tampa State
Pedestrian LOS: High corridor volumes, pedestrian safety enhancements (2 Intersection Improvements)
LOS and MPO Needs 14 5 $ 107,995
FOWLER AVE 15TH ST 22ND ST 0.50 Tampa State
Pedestrian LOS: High corridor volumes, pedestrian safety enhancements (4 Intersection Improvements)
LOS and MPO Needs 14 5 $ 215,991
FOWLER AVE 15TH ST 22ND ST 0.50 Tampa State Sidewalk Gap: north side btw 17th and 18th St LOS Need 4 $ 11,981
-------------------------------------------------------------------------------------------------------------------------------------------------------------------------------------------------------------------------------------------------------Subtotal $ 227,972
FOWLER AVE 22ND ST UNIVERSITY COLLECTION 0.24 Tampa State
Pedestrian LOS: High corridor volumes, pedestrian safety enhancements (1 Intersection Improvement)
LOS and MPO Needs 12 5 $ 53,998
FOWLER AVE UNIVERSITY COLLECTION 30TH ST 0.27 Tampa State
Pedestrian LOS: High corridor volumes, pedestrian safety enhancements (1 Intersection Improvement)
LOS and MPO Needs 12 5 $ 53,998
FOWLER AVE 30TH ST MCKINLEY BLVD 0.60 Tampa State
Pedestrian LOS: High corridor volumes, pedestrian safety enhancements (2 Intersection Improvement)
LOS and MPO Needs 13 5 $ 107,995
FOWLER AVE 30TH ST MCKINLEY BLVD 0.60 Tampa State Sidewalk Gap: south side LOS and MPO Needs 4 $ 102,698
-------------------------------------------------------------------------------------------------------------------------------------------------------------------------------------------------------------------------------------------------------Subtotal $ 210,694
Page 80
USF AREA MULTIMODAL TRANSPORTATION DISTRICT
Page 79
5.0 Bicycle and Pedestrian Needs by Corridor Segment LENGTH No.
Needs Identified
Dots Cost Estimate1 ($ 2009) ROADWAY FROM TO (miles) Location Owner Need Source
FOWLER AVE MCKINLEY DR S PALM DR 0.18 Tampa State
Pedestrian LOS: High corridor volumes, pedestrian safety enhancements (1 Intersection Improvement)
LOS and MPO Needs 12 5 $ 53,998
FOWLER AVE MCKINLEY DR S PALM DR 0.18 Tampa State Sidewalk Gap: south side LOS and MPO Needs 4 $ 30,810
-------------------------------------------------------------------------------------------------------------------------------------------------------------------------------------------------------------------------------------------------------Subtotal $ 84,807
FOWLER AVE S PALM DR 46TH ST 0.19 Tampa State
Pedestrian LOS: High corridor volumes, pedestrian safety enhancements (1 Intersection Improvement)
LOS and MPO Needs 13 5 $ 53,998
FOWLER AVE S PALM DR 46TH ST 0.19 Tampa State Sidewalk Gap: south side LOS and MPO Needs 4 $ 32,521
-------------------------------------------------------------------------------------------------------------------------------------------------------------------------------------------------------------------------------------------------------Subtotal $ 86,519
FOWLER AVE 46TH ST BULL RUN 0.31 Tampa State
Pedestrian LOS: High corridor volumes, pedestrian safety enhancements (1 Intersection Improvement)
LOS and MPO Needs 13 5 $ 53,998
FOWLER AVE 46TH ST BULL RUN 0.31 Tampa State Sidewalk Gap: south side LOS and MPO Needs 4 $ 53,061
-------------------------------------------------------------------------------------------------------------------------------------------------------------------------------------------------------------------------------------------------------Subtotal $ 107,059
FOWLER AVE BULL RUN 50TH ST 0.18 Tampa State
Pedestrian LOS: High corridor volumes, pedestrian safety enhancements (1 Intersection Improvement)
LOS and MPO Needs 12 5 $ 53,998
FOWLER AVE 50TH ST 52ND ST 0.25 Tampa State
Pedestrian LOS: High corridor volumes, pedestrian safety enhancements (1 Intersection Improvement)
LOS and MPO Needs 14 5 $ 53,998
FOWLER AVE 50TH ST 52ND ST 0.25 Tampa State Sidewalk Gap: both sides LOS and MPO Needs 4 $ 85,582
-------------------------------------------------------------------------------------------------------------------------------------------------------------------------------------------------------------------------------------------------------Subtotal $ 139,580
FOWLER AVE 52ND ST 56TH ST 0.24 Temple Terrace State
Pedestrian LOS: High corridor volumes, pedestrian safety enhancements (3 Intersection Improvements)
LOS and MPO Needs 12 5 $ 161,993
FOWLER AVE 52ND ST 56TH ST 0.24 Temple Terrace State
Sidewalk Gap: south side btw 53rd and 52nd St LOS Need 4 $ 17,116
-------------------------------------------------------------------------------------------------------------------------------------------------------------------------------------------------------------------------------------------------------Subtotal $ 179,109
HOLLY DR 30TH ST N PALM DR 0.86 Bike Lanes and Sidewalks 14 2 $ 423,583
HOLLY DR 30TH ST MAGNOLIA DR 0.34 Tampa
Owned By State
Maintained By USF Sidewalk Gaps: partial north side LOS Need 8 1 $ 13,693
Page 81
USF AREA MULTIMODAL TRANSPORTATION DISTRICT
Page 80
5.0 Bicycle and Pedestrian Needs by Corridor Segment LENGTH No.
Needs Identified
Dots Cost Estimate1 ($ 2009) ROADWAY FROM TO (miles) Location Owner Need Source
HOLLY DR 30TH ST MAGNOLIA DR 0.34 Tampa
Owned By State
Maintained By USF Bike Lane Gap: both sides LOS Need 1 $ 162,050
-------------------------------------------------------------------------------------------------------------------------------------------------------------------------------------------------------------------------------------------------------Subtotal $ 175,743
HOLLY DR MAGNOLIA DR N PALM DR 0.52 Tampa
Owned By State
Maintained By USF Bike Lane Gap: both sides LOS Need 4 1 $ 247,841
LIVINGSTON AVE FLETCHER AVE 131ST ST 0.23 Sidewalks 8 6 $ 39,368
LIVINGSTON AVE FLETCHER AVE 131ST ST 0.23 Tampa Tampa Sidewalk Gaps: west side Public Comment 8 6 $ 39,368
MAGNOLIA DR FLETCHER AVE HOLLY DR 0.22 Bike Lanes and Sidewalks 11 4 $ 180,168
MAGNOLIA DR HOLLY DR FLETCHER AVE 0.22 Tampa
Owned By State
Maintained By USF Sidewalk Gap: both sides LOS Need 11 1 $ 75,312
MAGNOLIA DR HOLLY DR FLETCHER AVE 0.22 Tampa
Owned By State
Maintained By USF Bike Lane Gap: both sides LOS Need 3 $ 104,856
MAPLE DR FLETCHER AVE ALUMNI DR 0.83 Bike Lanes and Sidewalks 8 1 $ 292,343
MAPLE DR HOLLY DR FLETCHER AVE 0.23 Tampa
Owned By State
Maintained By USF
Sidewalk Gap: partial both sides near Fletcher 2 1 $ 15,405
MAPLE DR ALUMNI DR HOLLY DR 0.60 Tampa
Owned By State
Maintained By USF
Sidewalk Gap: both sides btw Leroy Collins and Alumni Dr 6 1 $ 29,098
MAPLE DR ALUMNI DR HOLLY DR 0.60 Tampa
Owned By State
Maintained By USF Bike Lane Gap: both sides MPO Needs 0 $ 247,841
-------------------------------------------------------------------------------------------------------------------------------------------------------------------------------------------------------------------------------------------------------Subtotal $ 276,938
NEBRASKA AVE BEARSS AVE FOWLER AVE 2.30 Bike Lanes 35 4 $ 1,420,204
NEBRASKA AVE SKIPPER RD BEARSS AVE 0.51 Hillsborough State
Pedestrian LOS: High corridor volumes, pedestrian safety enhancements (1 Intersection Improvement) LOS Need 8 ? $ 53,998
NEBRASKA AVE SKIPPER RD BEARSS AVE 0.51 Hillsborough State Bike Lane Gap: both sides LOS and MPO Needs 4 $ 243,074
-------------------------------------------------------------------------------------------------------------------------------------------------------------------------------------------------------------------------------------------------------Subtotal $ 297,072
Page 82
USF AREA MULTIMODAL TRANSPORTATION DISTRICT
Page 81
5.0 Bicycle and Pedestrian Needs by Corridor Segment LENGTH No.
Needs Identified
Dots Cost Estimate1 ($ 2009) ROADWAY FROM TO (miles) Location Owner Need Source
NEBRASKA AVE FLETCHER AVE SKIPPER RD 0.77 Hillsborough State
Pedestrian LOS: High corridor volumes, pedestrian safety enhancements (2 Intersection Improvements) LOS Need 8 ? $ 107,995
NEBRASKA AVE FLETCHER AVE SKIPPER RD 0.77 Hillsborough State Bike Lane Gap: both sides LOS and MPO Needs 4 $ 366,995
-------------------------------------------------------------------------------------------------------------------------------------------------------------------------------------------------------------------------------------------------------Subtotal $ 474,990
NEBRASKA AVE 131ST AVE FLETCHER AVE 0.25 Hillsborough State
Pedestrian LOS: High corridor volumes, pedestrian safety enhancements (1 Intersection Improvement) LOS Need 9 ? $ 53,998
NEBRASKA AVE 131ST AVE FLETCHER AVE 0.25 Hillsborough State Bike Lane Gap: both sides MPO Needs 4 $ 119,154
-------------------------------------------------------------------------------------------------------------------------------------------------------------------------------------------------------------------------------------------------------Subtotal $ 173,152
NEBRASKA AVE FOWLER AVE 131ST AVE 0.77 Hillsborough State
Pedestrian LOS: High corridor volumes, pedestrian safety enhancements (2 Intersection Improvements) LOS Need 10 ? $ 107,995
NEBRASKA AVE FOWLER AVE 131ST AVE 0.77 Hillsborough State Bike Lane Gap: both sides LOS and MPO Needs 4 $ 366,995
-------------------------------------------------------------------------------------------------------------------------------------------------------------------------------------------------------------------------------------------------------Subtotal $ 474,990
LENGTH No.
Needs Identified
Dots Cost Estimate1 ($ 2009) ROADWAY FROM TO (miles) Location Owner Need Source
N PALM DR FLETCHER AVE HOLLY DRIVE 0.23 Bike Lanes 8 0 $ 109,622
N PALM DR HOLLY DR FLETCHER AVE 0.23 Tampa
Owned By State
Maintained By USF Bike Lane Gap: both sides
LOS and MPO Needs 8 0 $ 109,622
SKIPPER ROAD NEBRASKA AVENUE 46TH STREET 0.94 Bike Lanes and Sidewalks 28 18 $ 474,828
SKIPPER RD NEBRASKA AVE 16TH ST 0.54 Hillsborough Bike Lane Gap: both sides LOS and MPO Needs 3 0 $ 257,373
SKIPPER RD BRUCE B DOWNS BLVD 46TH ST 0.40 Hillsborough Hillsborough Sidewalk Gaps: entire north side south side east of 42nd LOS Need 25 9 $ 107,833
SKIPPER RD BRUCE B DOWNS BLVD 46TH ST 0.40 Hillsborough Hillsborough Bike Lane Gap: both sides LOS and MPO Needs 9 $ 109,622
-------------------------------------------------------------------------------------------------------------------------------------------------------------------------------------------------------------------------------------------------------Subtotal $ 217,455
SPECTRUM BLVD PINE DR FOWLER AVE 0.54 Sidewalks 7 1 $ 18,828
SPECTRUM BLVD PINE DR FOWLER AVE 0.54 Tampa
Owned By State
Maintained By USF Sidewalk Gaps: partial north side LOS Need 7 1 $ 18,828
SYCAMORE DR ELM HOLLY DR 0.45 Bike Lanes 1 0 $ 214,477
Page 83
USF AREA MULTIMODAL TRANSPORTATION DISTRICT
Page 82
5.0 Bicycle and Pedestrian Needs by Corridor Segment LENGTH No.
Needs Identified
Dots Cost Estimate1 ($ 2009) ROADWAY FROM TO (miles) Location Owner Need Source
SYCAMORE DR ELM HOLLY DR 0.45 Tampa
Owned By State
Maintained By USF Bike Lane Gap: both sides
Public Comment 1 0 $ 214,477
UNIVERSITY SQUARE DR 30TH ST CLUB DR 0.25 Bike Lanes 6 3 $ 59,577
UNIVERSITY SQUARE DR 30TH ST CLUB DR 0.25 Hillsborough Hillsborough Increase Bike Lane Width Public Comment 6 3 $ 59,577
NEW OFF-ROAD MULTI-USE PATH 1.04 Multi-Use Path 9 5 $ 317,849
GATES DR BRUCE B DOWNS BLVD 138TH AVE 0.52 Hillsborough Hillsborough Multi-Use Path Public Comment 9 5 $ 158,925
13TH AVE GATES DR 37TH ST 0.26 Hillsborough Hillsborough Multi-Use Path Public Comment 5 $ 79,462
37TH ST 138TH AVE FLETCHER AVE 0.26 Hillsborough Hillsborough Multi-Use Path Public Comment 5 $ 79,462
SUB TOTAL $ 13,889,152
1SOURCE: FDOT District Seven Centerline Mile Cost Estimates (July 2009)
Page 84
USF AREA MULTIMODAL TRANSPORTATION DISTRICT
Page 83
6.0 Transit Needs by Route/Corridor Segment
LENGTH
ROUTE/CORRIDOR FROM TO (miles) Location Owner Need Source LOS Dots ROUTE Cost Estimate2 ($ 2009)
LOCAL BUS: THONOTASSA Length of Route in
Study Area 3.21 Future Route 23 0 $ 1,102,500 131ST AVE 22ND ST LIVINGSTON AVE 0.25 Hillsborough Hillsborough Local Bus: Thonotosassa MPO Needs 0 $ - 131ST AVE 27TH ST 30TH ST 0.20 Hillsborough Hillsborough Local Bus: Thonotosassa MPO Needs 0 $ - 131ST AVE LIVINGSTON AVE 27TH ST 0.06 Hillsborough Hillsborough Local Bus: Thonotosassa MPO Needs 0 $ - 30TH ST FOWLER AVE PINE DR 0.17 Hillsborough Hillsborough Local Bus: Thonotosassa MPO Needs 1 $ -
30TH ST PINE DR 131ST AVE 0.58 Hillsborough Hillsborough Local Bus: Thonotosassa
LOS, MPO Needs, and Public Comment 1 $ -
FOWLER AVE 52ND ST 56TH ST 0.24 Temple Terrace State Future Local service: Thonotosassa MPO Needs 3 $ -
FOWLER AVE BULL RUN 50TH ST 0.18 Tampa State Future Local service: Thonotosassa MPO Needs 3 $ - FOWLER AVE 50TH ST 52ND ST 0.25 Tampa State Future Local service: Thonotosassa MPO Needs 3 $ - FOWLER AVE 30TH ST MCKINLEY BLVD 0.60 Tampa State Future Local service: Thonotosassa MPO Needs 3 $ - FOWLER AVE S PALM DR 46TH ST 0.19 Tampa State Future Local service: Thonotosassa MPO Needs 3 $ - FOWLER AVE MCKINLEY DR S PALM DR 0.18 Tampa State Future Local service: Thonotosassa MPO Needs 3 $ -
FOWLER AVE 46TH ST BULL RUN 0.31 Tampa State Future Local service: Thonotosassa MPO Needs 3 $ -
LOCAL BUS: USF CIRCULATOR Length of Route in
Study Area 4.84 Future Route 30 12 $ 1,490,133 131ST AVE 27TH ST 30TH ST 0.20 Hillsborough Hillsborough USF Circulator MPO Needs 0 $ - 131ST AVE LIVINGSTON AVE 27TH ST 0.06 Hillsborough Hillsborough USF Circulator MPO Needs 0 $ -
ALUMNI DR PINE DR LEROY COLLINS BLVD 0.50 Tampa
Owned By State
Maintained By USF USF Circulator MPO Needs 3 $ -
BULL RUN FOWLER AVE ALUMNI DR 0.18 Tampa Private Future USF Circulator MPO Needs 3
FOWLER AVE 52ND ST 56TH ST 0.24 Temple Terrace State
Transit LOS E: Route 6, Future USF Circulator MPO Needs 3 $ -
FOWLER AVE BULL RUN 50TH ST 0.18 Tampa State Transit LOS F: Route 6, Future USF Circulator MPO Needs 3 $ -
FOWLER AVE 50TH ST 52ND ST 0.25 Tampa State Transit LOS E: Route 6, Future USF Circulator
LOS and MPO Needs 3 $ -
FOWLER AVE BULL RUN 46TH ST 0.19 Tampa State Transit LOS F: No existing service, Future USF Circulator
LOS and MPO Need 3 $ -
FOWLER AVE MCKINLEY DR BULL RUN 0.18 Tampa State Transit LOS F: No existing service, Future USF Circulator
LOS and MPO Need 3 $ -
FOWLER AVE 46TH ST BULL RUN 0.31 Tampa State Transit LOS F: No existing service, Future USF Circulator
LOS and MPO Need 3 $ -
Page 85
USF AREA MULTIMODAL TRANSPORTATION DISTRICT
Page 84
6.0 Transit Needs by Route/Corridor Segment
LENGTH
ROUTE/CORRIDOR FROM TO (miles) Location Owner Need Source LOS Dots ROUTE Cost Estimate2 ($ 2009)
HOLLY DR N PALM DR MAPLE DR 0.32 Tampa
Owned By State
Maintained By USF Future USF Circulator MPO Needs 2 $ -
HOLLY DR MAGNOLIA DR N PALM DR 0.52 Tampa
Owned By State
Maintained By USF Future USF Circulator MPO Needs 2 $ -
HOLLY DR 30TH ST MAGNOLIA DR 0.34 Tampa
Owned By State
Maintained By USF Future USF Circulator MPO Needs 2 $ -
MAPLE DR ALUMNI DR HOLLY DR 0.60 Tampa
Owned By State
Maintained By USF Future USF Circulator MPO Needs 0 $ -
SPECTRUM BLVD PINE DR FOWLER AVE 0.54 Tampa
Owned By State
Maintained By USF
Transit LOS F: No existing service, Future USF Circulator
LOS and MPO Needs 0 $ -
LIVINGSTON AVE FLETCHER AVE 131ST AVE 0.23 Tampa Hillsborough Future USF Circulator MPO Needs 0 $ -
LENGTH ROUTE Cost Estimate2 ($ 2009)
ROADWAY FROM TO (miles) Location Owner Need Source LOS Dots
LOCAL BUS: ERLICH/BEARSS Length of Route in
Study Area 3.29 Future Route 13 3 $ 1,713,198 22ND ST 131ST AVE FLETCHER AVE 0.25 Hillsborough Hillsborough Local Bus: Erlich/Bearss MPO Needs 0 $ -
30TH ST FLETCHER AVE 138TH AVE 0.25 Hillsborough Hillsborough
Transit LOS E: Low Frequency on Route 18 & 57/Local Bus: Erlich & Bearss
LOS and MPO Needs 1 $ -
30TH ST 131ST AVE FLETCHER AVE 0.25 Hillsborough Hillsborough
Transit LOS E: Low Frequency on Route 18 & 57/Local Bus: Erlich & Bearss
LOS and MPO Needs 1 $ -
BEARSS AVE LIVINGSTON AVE BRUCE B DOWNS BLVD 0.36 Hillsborough Hillsborough
Transit LOS: Route 18, Future improvements to Local Bears & Erlich service
LOS and MPO Needs 2 $ -
BEARSS AVE 22ND ST LIVINGSTON AVE 0.24 Hillsborough Hillsborough
Transit LOS: Route 18, Future improvements to Local Bears & Erlich service
LOS and MPO Needs 2 $ -
BEARSS AVE 17TH ST 22ND ST 0.42 Hillsborough Hillsborough
Transit LOS: Route 2, Future improvements to Local Bears & Erlich service
LOS and MPO Needs 2 $ -
Page 86
USF AREA MULTIMODAL TRANSPORTATION DISTRICT
Page 85
6.0 Transit Needs by Route/Corridor Segment
LENGTH
ROUTE/CORRIDOR FROM TO (miles) Location Owner Need Source LOS Dots ROUTE Cost Estimate2 ($ 2009)
BEARSS AVE SKIPPER RD 17TH ST 0.07 Hillsborough Hillsborough
Transit LOS: Route 2, Future improvements to Local Bears & Erlich service
LOS and MPO Needs 2 $ -
BEARSS AVE I-275 N RAMP NEBRASKA AVE 0.17 Hillsborough State
Transit LOS: Route 83, Future improvements to Local Bears & Erlich service
LOS and MPO Needs 1 $ -
BEARSS AVE NEBRASKA AVE SKIPPER RD 0.77 Hillsborough Hillsborough
Transit LOS F: No Service, Future improvements to Local Bears & Erlich service
LOS and MPO Needs 2 $ -
FLETCHER AVE 22ND ST LIVINGSTON AVE 0.25 Hillsborough Hillsborough Future Local bus improvements (Bearss and Erlich)
MPO Needs and Public Comment 0 $ -
FLETCHER AVE LIVINGSTON AVE 30TH ST 0.26 Hillsborough Hillsborough Future Local bus improvements (Bearss and Erlich)
MPO Needs and Public Comment 0 $ -
LENGTH
LOS
ROUTE Cost Estimate2 ($ 2009)
ROADWAY FROM TO (miles) Location Owner Need Source
BUS RAPID TRANSIT: UATC TO NEW TAMPA Length of Route in
Study Area 2.96 Future Route 8 7 $ 6,600,839
FLETCHER AVE N PALM DR 46TH ST 0.65 Hillsborough Hillsborough
Transit LOS F: no service, Future BRT improvements (UATC to New Tampa) MPO Needs 1 $ -
FLETCHER AVE 42ND ST N PALM DR 0.06 Hillsborough Hillsborough
Transit LOS F: Route 57, Future BRT improvements (UATC to New Tampa) MPO Needs 1 $ -
FLETCHER AVE MAGNOLIA DR 42ND ST 0.35 Hillsborough Hillsborough
Transit LOS F: Route 6, Future BRT improvements (UATC to New Tampa)
MPO Needs and Public Comment 1 $ -
FLETCHER AVE 30TH ST MAGNOLIA DR 0.19 Hillsborough Hillsborough Future BRT improvements (UATC to New Tampa)
MPO Needs and Public Comment 1
FLETCHER AVE LIVINGSTON AVE 30TH ST 0.26 Hillsborough Hillsborough Future BRT improvements (UATC to New Tampa)
MPO Needs and Public Comment 0 $ -
FLETCHER AVE 22ND ST LIVINGSTON AVE 0.25 Hillsborough Hillsborough Future BRT improvements (UATC to New Tampa)
MPO Needs and Public Comment 0 $ -
FLETCHER AVE 50TH ST 56TH ST 0.49 Hillsborough Hillsborough Future BRT improvements (UATC to New Tampa)
MPO Needs and Public Comment 3 $ -
FLETCHER AVE 46TH ST 50TH ST 0.48 Tampa Hillsborough Future BRT improvements (UATC to New Tampa)
MPO Needs and Public Comment 1 $ -
LIVINGSTON AVE FLETCHER AVE 131ST ST 0.23 Hillsborough Hillsborough Future BRT improvements (UATC to New Tampa) MPO Needs 0 $ -
Page 87
USF AREA MULTIMODAL TRANSPORTATION DISTRICT
Page 86
6.0 Transit Needs by Route/Corridor Segment
LENGTH
ROUTE/CORRIDOR FROM TO (miles) Location Owner Need Source LOS Dots ROUTE Cost Estimate2 ($ 2009)
BUS RAPID TRANSIT: NEBRASKA/FLETCHER Length of Route in
Study Area 2.03 Future Route 0 18 $ 4,734,182
FLETCHER AVE 15TH ST 22ND ST 0.50 Hillsborough Hillsborough
Transit LOS F: Route 1 & 33, Future BRT improvements (Nebraska Fletcher)
MPO Needs and Public Comment 0 $ -
FLETCHER AVE NEBRASKA AVE 15TH ST 0.51 Hillsborough Hillsborough
Transit LOS E: Route 1 & 33, Future BRT improvements (Nebraska Fletcher)
MPO Needs and Public Comment 0 $ -
NEBRASKA AVE 131ST AVE FLETCHER AVE 0.25 Hillsborough State Future Nebraska/Fletcher BRT MPO Needs 0 $ -
NEBRASKA AVE FOWLER AVE 131ST AVE 0.77 Hillsborough State Future Nebraska/Fletcher BRT MPO Needs 0 $ -
RAIL SERVICE: USF TO WESTSHORE Length of Route in
Study Area 2.30 Future Route 4 26 149,500,000 30TH ST BRUCE B DOWNS BLVD FOWLER AVE 1.75 1 $ 113,750,000 BRUCE B DOWNS BLVD 30TH ST SKIPPER RD 0.55 3 $ 35,750,000 $ -
$ -
SUB TOTAL $ 165,140,851
2SOURCE: 2035 MPO LRTP NEEDS ASSESSMENT (SEPTEMBER 2009)
*Assumes per mile cost of project (total route cost/length) multiplied by length in study area