6.2 Laser parameters for different configurations of cw ML fibre lasers. *Powerscaling of FSFL forms new pulses with the same characteristics of the fun-damental pulse. These new pulses travel in compact groups close to eachother at the fundamental round-trip frequency. . . . . . . . . . . . . . . . 81
xv
Nomenclature
αk Fibre absorption in dB/m
αloss Fibre loss coeffficient in dB/m
β2 Group velocity dispersion parameter
β3 Third order dispersion
∆λ Laser signal bandwidth measured at FWHM
∆λBPF Band-pass filter bandwidth measured at FWHM
E Electric field
Es Soliton pulse energy
Eg Gaussian pulse energy
efl Effective focal length
Er3+ Erbium ions
fAOM Driving frequency of the acousto-optic modulator
γ Nonlinear coefficient
gk Fibre gain coefficient in dB/m
LEDF Erbium-doped fibre length
Lsmf Single mode fibre length
λc Filter central wavelength
λp Pump wavelength
νBPF Band-pass filter bandwidth measured at FWHM
νc Filter central frequency
Pin Intracavity power
Pout Output power
Ppump Pump power
φNL Nonlinear phase
φs Soliton phase
sech2 Hyperbolic-secant-squared pulse shape
xvii
List of Abbreviations
AOM Acousto-Optic Modulator
ASE Amplified Spontaneous Emission
CPA Chirped Pulse Amplification
cw Continuous-Wave
DCA Digital Communication Analyzer
DCF Double-Clad Fibre
DC-PCF Double Clad-Photonic Crystal Fibre
DFB Distributed Feedback
EDFA Erbium Doped Fibre Amplifier
EFL Effective Focal Length
FP Fabry-Perot
FSF Frequency-Shifted Feedback
FBG Fibre Bragg Grating
FRIP Fibre Refractive Index Profile
FWHM Full Width Half Maximum
GVD Group Velocity Dispersion
LMA Large Mode Area
MCVD Modified Chemical Vapor Deposition
ML Mode-Locked or Mode-Locking
NA Numerical Aperture
NALM Nonlinear Amplifying-Loop Mirror
NLSE Nonlinear Schrodinger Equation
OCR Output Coupling Ratio
PCF Photonic Crystal Fibre
PD Photodetector
PM Polarisation Maintaining
RE Rare-Earth
RIP Refractive Index Profile
DBR Distributed Bragg Reflector
SESAM Semiconductor Saturable Absorber Mirror
SHG Second Harmonic Generation
SPM Self-Phase Modulation
xix
xx LIST OF ABBREVIATIONS
TBP Time Bandwidth Product
Acknowledgements
I would like to take this opportunity to thank my supervisor Professor Johan Nilsson
and co-supervisor Dr. Yoonchan Jeong for their constant support and guidance during
the course of my research work. I am particularly indebted to Dr. Yoonchan Jeong for
introducing me to the field of fibre lasers and for his useful advices in the preparation
of this thesis.
My special thanks go to Dr. Christophe Codemard for getting me started in the labo-
ratory and for his valuable support and suggestions for my experiments. I am grateful
to Dr. Shaif-ul-Alam, and Dr. Trevor Newson for sharing a vast amount of equipment
with me (erbium-doped fibres, acousto-optic modulators, Raman laser, and the list goes
on). I am also thankful to Dr. Morten Ibsen for providing the fibre Bragg gratings used
in different experiments and for useful discussions on optoelectronics. My expression
of gratitude also goes to Dr. Periklis Petropoulos and Dr. Francesca Parmigiani for
sharing their autocorrelator and fast-photodetectors for my experiments. I would also
like to extend my gratitude to my co-workers in the high power fibre laser group: Carl
Farrell, Junhua Ji, and Gysbert van der Westhuizen, for their help, and support.
I would like to give a very special thanks to my friends and co-workers Dr. Mohammed
Bilal, Dr. Ananth Subramanian, and Dr. Jedrzej Szelc for sharing with me the good
and bad days of a postgraduate student life and providing me many enjoyable times.
I want to express my gratitude to my sponsor, CONACyT (National Council for Science
and Technology of Mexico) for providing me with a scholarship to pursue this degree at
the Optoelectronics Research Centre.
A big thanks to all my friends in the UK and specially the ones in Southampton for
providing me homely atmosphere and support.
A very special thanks to my family Beatriz, Jose Luis and Yuriria for their love, support,
and encouragement.
Finally, my sincere thank you to my habibi Lucy, for sharing with me her pure and
endless happiness.
xxi
To my grandmother Elvira, and
my parents Beatriz and Jose Luis.
xxiii
Chapter 1
Introduction
In this thesis I report experimental studies toward developing versatile, compact, low
cost, and reliable ultrafast sources in the 1.5 micron region and their power scalability. In
addition I also report on the study of a stable operating regime found on passive mode-
locked lasers called noise-like pulses, which can generate broadband spectra directly from
the main oscillator.
1.1 Motivations
Over the last decade tremendous progress in generating picosecond and femtosecond
pulses using solid state lasers has been done. These pulsed laser systems have revolu-
tionized many areas of science and technology, finding widespread use in applications
such as micromachining, optical sampling, metrology, biological imaging, nonlinear fre-
quency conversion, terahertz generation, etc. However, the inherent problems associated
with solid state laser systems such as long-term stability, thermal management, beam
quality and compactness have forced the search of alternative laser systems. One such
alternative rely on Rare-Earth (RE) doped fibre systems. Optical fibres offer practi-
cal advantages such as high single pass gain, power independent beam quality (when
using single mode fibres), excellent heat dissipation and high optical efficiencies. Fur-
thermore, with the introduction of cladding pumping technology, and the development
of high power and low brightness pump laser diodes, nowadays, it is possible to scale
the average powers of these systems to the kW level [10], [11]. All these features have
motivated substantial research in the area of ultrafast fibre-based lasers and amplifiers,
especially for Ytterbium (Yb3+)-based fibre technology. However, despite the important
progress done in this area, fibre sources are still behind their solid state counterparts in
In the following subsections I give a summary of the basic physics and principles of
operation of EDF technology which forms the base of my research in this Thesis.
Chapter 2 Erbium-doped fibre technology and nonlinear effects in optical fibres 7
2.2.1 Spectroscopy of Erbium-doped silica fibres
Figure 2.1: (a) Energy level diagram of Er3+:glass. Upward arrows show the pumpabsorptions bands, while downward arrows show the radiative and nonradiative tran-sitions. (b) Absorption and emission cross section spectra for an aluminosilicate fibre
for the transition 4I15/2 → 4I13/2 [1].
Er3+ is a rare-earth ion that belongs to the lanthanides group, which are characterised
by the filling of the 4f electronic shell. In the lanthanides group, the 4f shell is shielded
from the host lattice by the optically passive outer electronic shells [1]. Therefore, in-
teractions between energy levels are relatively insensitive to the host lattice. Electron
transitions between the 4f states are responsible for the observed infrared (IR) and
visible optical spectra of Er3+. Fig. 2.1 (a) shows the energy level structure of Er3+
with the optical transitions of the 4f shell. The most common laser transition used for
EDFA is the 4I13/2 → 4I15/2, which correspond to the wavelength region around 1530
nm to 1600 nm. This transition is 100% radiative and has a fluorescence lifetime of
approximately 10 ms. For pumping the active medium, two laser transitions are com-
monly used. The first one is the 4I15/2 → 4I11/2 transition with a wavelength ∼ 980 nm.
The second one is the in-band pumping transition 4I15/2 → 4I13/2 with wavelength ∼1480 nm. The relaxation process between the 2H11/2 and 4I13/2 energy levels presents
fast (microseconds) nonradiative decay. Therefore, EDFAs can be described as a quasi-
8 Chapter 2 Erbium-doped fibre technology and nonlinear effects in optical fibres
three-level level system.
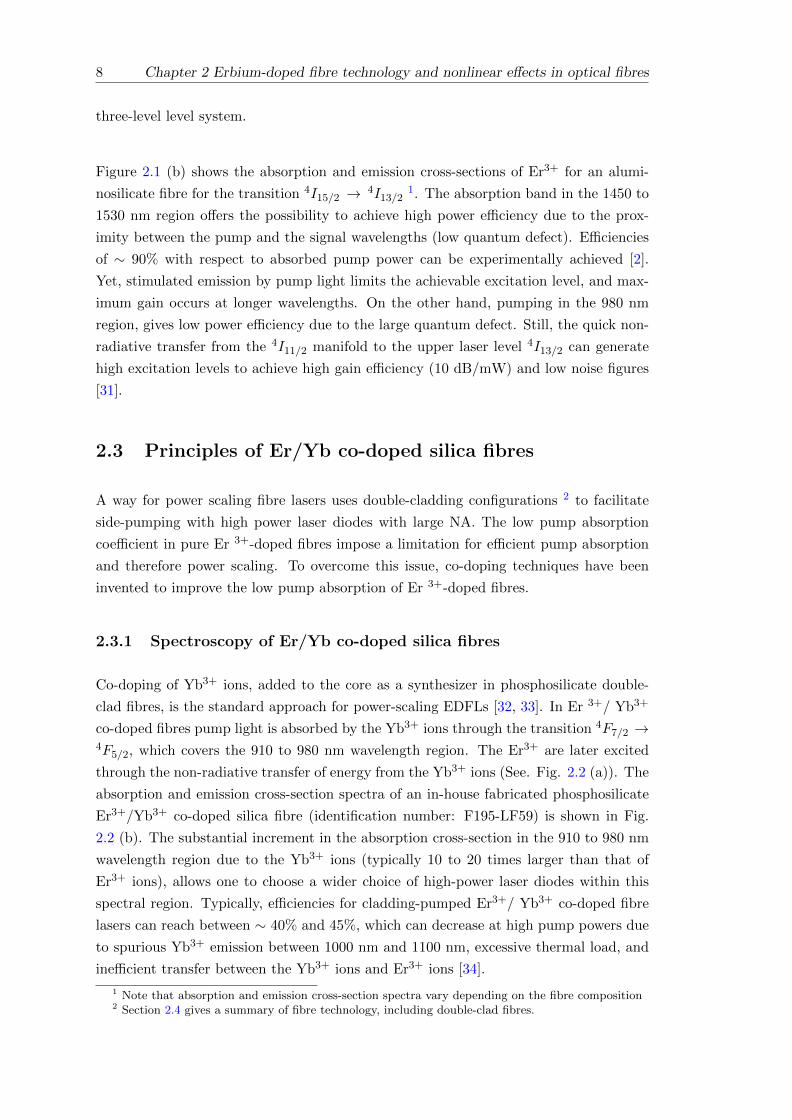
Figure 2.1 (b) shows the absorption and emission cross-sections of Er3+ for an alumi-
nosilicate fibre for the transition 4I15/2 → 4I13/21. The absorption band in the 1450 to
1530 nm region offers the possibility to achieve high power efficiency due to the prox-
imity between the pump and the signal wavelengths (low quantum defect). Efficiencies
of ∼ 90% with respect to absorbed pump power can be experimentally achieved [2].
Yet, stimulated emission by pump light limits the achievable excitation level, and max-
imum gain occurs at longer wavelengths. On the other hand, pumping in the 980 nm
region, gives low power efficiency due to the large quantum defect. Still, the quick non-
radiative transfer from the 4I11/2 manifold to the upper laser level 4I13/2 can generate
high excitation levels to achieve high gain efficiency (10 dB/mW) and low noise figures
[31].
2.3 Principles of Er/Yb co-doped silica fibres
A way for power scaling fibre lasers uses double-cladding configurations 2 to facilitate
side-pumping with high power laser diodes with large NA. The low pump absorption
coefficient in pure Er 3+-doped fibres impose a limitation for efficient pump absorption
and therefore power scaling. To overcome this issue, co-doping techniques have been
invented to improve the low pump absorption of Er 3+-doped fibres.
2.3.1 Spectroscopy of Er/Yb co-doped silica fibres
Co-doping of Yb3+ ions, added to the core as a synthesizer in phosphosilicate double-
clad fibres, is the standard approach for power-scaling EDFLs [32, 33]. In Er 3+/ Yb3+
co-doped fibres pump light is absorbed by the Yb3+ ions through the transition 4F7/2 →4F5/2, which covers the 910 to 980 nm wavelength region. The Er3+ are later excited
through the non-radiative transfer of energy from the Yb3+ ions (See. Fig. 2.2 (a)). The
absorption and emission cross-section spectra of an in-house fabricated phosphosilicate
Er3+/Yb3+ co-doped silica fibre (identification number: F195-LF59) is shown in Fig.
2.2 (b). The substantial increment in the absorption cross-section in the 910 to 980 nm
wavelength region due to the Yb3+ ions (typically 10 to 20 times larger than that of
Er3+ ions), allows one to choose a wider choice of high-power laser diodes within this
spectral region. Typically, efficiencies for cladding-pumped Er3+/ Yb3+ co-doped fibre
lasers can reach between ∼ 40% and 45%, which can decrease at high pump powers due
to spurious Yb3+ emission between 1000 nm and 1100 nm, excessive thermal load, and
inefficient transfer between the Yb3+ ions and Er3+ ions [34].
1 Note that absorption and emission cross-section spectra vary depending on the fibre composition2 Section 2.4 gives a summary of fibre technology, including double-clad fibres.
Chapter 2 Erbium-doped fibre technology and nonlinear effects in optical fibres 9
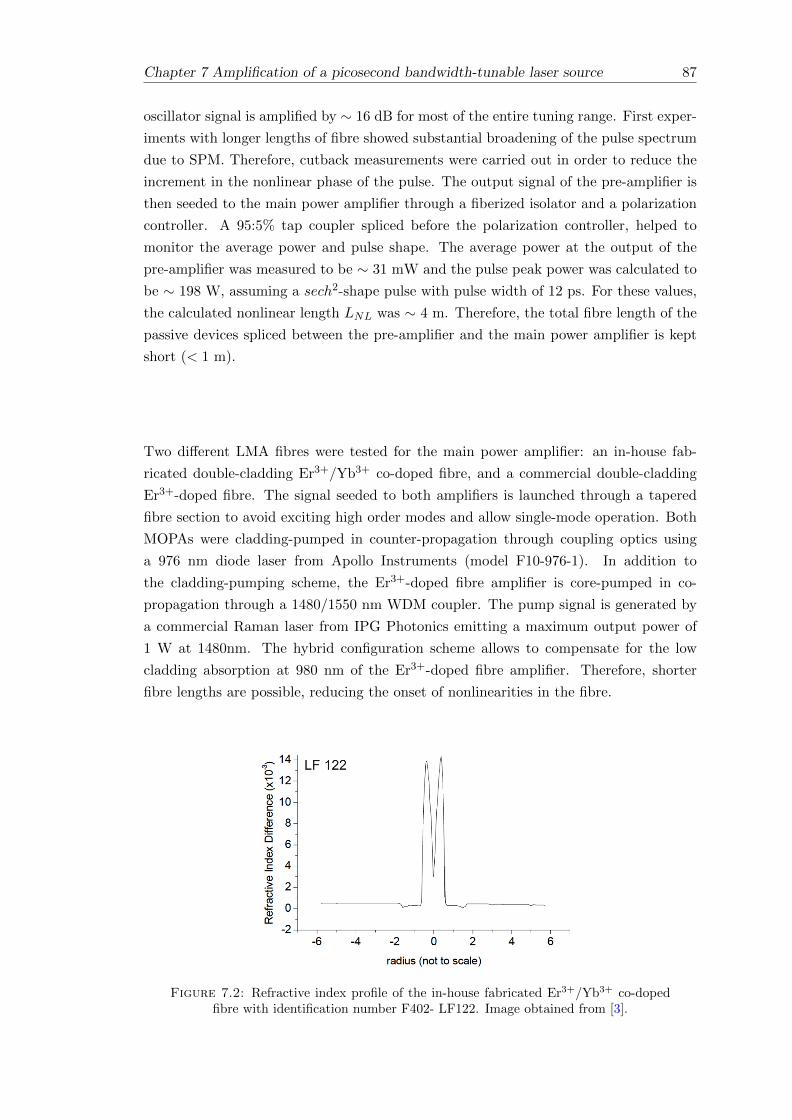
Figure 2.2: (a) Energy level diagram of Er3+/Yb3+ co-doped silica [2]. (b) Absorptionand emission cross section spectra for a phosphosilicate Er3+/Yb3+ co-doped silica fibre
[3].
2.4 Fibre technology
In this thesis, there are two types of pumping configurations used in the experiments:
core and cladding pumping. In the next subsections I will describe briefly the properties
and applications of each configuration.
2.4.1 Core-pumped single-mode fibre amplifier
Core-pumped fibre amplifiers are formed of active single-mode fibres that can generate
diffraction-limited beam outputs. In these configurations, pump and signal light are
guided in the core of the fibre. Therefore, pump sources are restricted to those with
single mode output, which mainly are low power (hundreds of miliwatt). Core-pumped
amplifiers present several advantages such as low-noise operation, high stability, and
robustness. For this reason, they are often used as pre-amplifiers in fibre-based master
oscillation power amplifier (MOPA) configurations. The amplification system described
10 Chapter 2 Erbium-doped fibre technology and nonlinear effects in optical fibres
in Chapter 7 includes a core-pump amplifier in its first amplification stage. The fibre
used for this pre-amplifier has an NA of 0.23, with a mode field diameter MFD = 5.5
µm and a peak absorption of 37.5 dB/m at 1530 nm. The high absorption coefficient
of the fibre is useful for pulse amplification (in this case, picosecond pulses) because it
allows for shorter fibres that avoid excessive growth of nonlinear effects.
2.4.2 Cladding-pumped fibre amplifiers
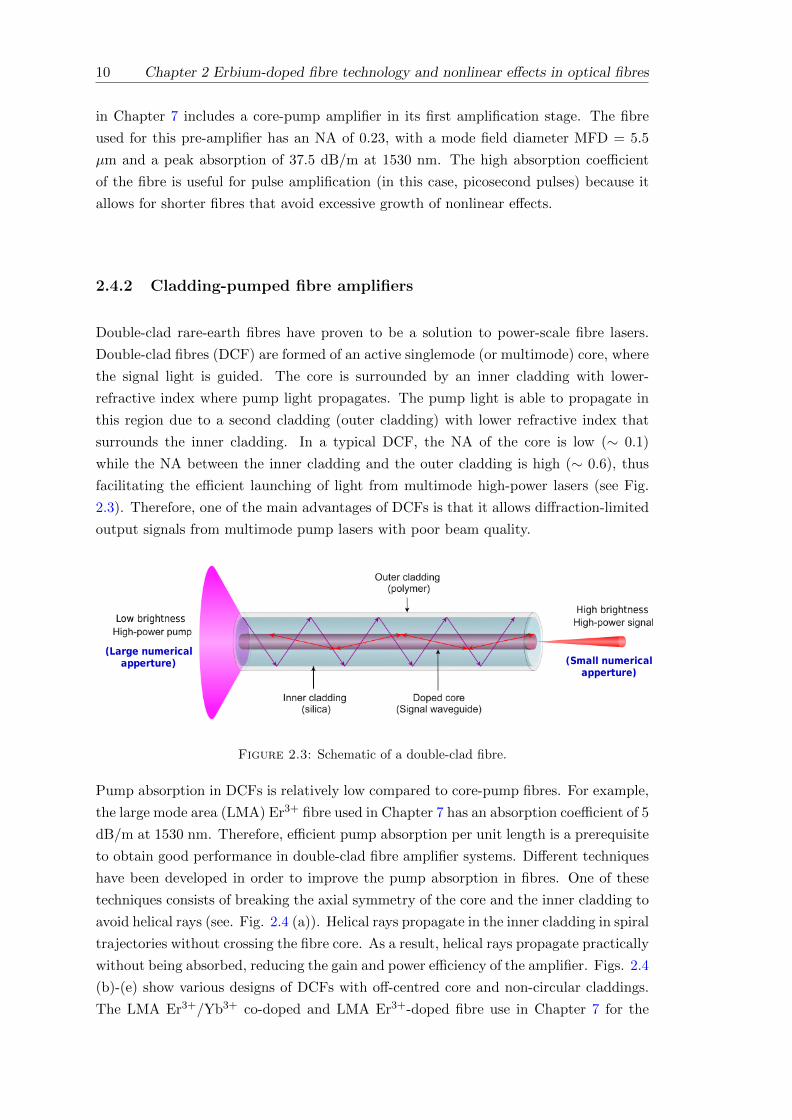
Double-clad rare-earth fibres have proven to be a solution to power-scale fibre lasers.
Double-clad fibres (DCF) are formed of an active singlemode (or multimode) core, where
the signal light is guided. The core is surrounded by an inner cladding with lower-
refractive index where pump light propagates. The pump light is able to propagate in
this region due to a second cladding (outer cladding) with lower refractive index that
surrounds the inner cladding. In a typical DCF, the NA of the core is low (∼ 0.1)
while the NA between the inner cladding and the outer cladding is high (∼ 0.6), thus
facilitating the efficient launching of light from multimode high-power lasers (see Fig.
2.3). Therefore, one of the main advantages of DCFs is that it allows diffraction-limited
output signals from multimode pump lasers with poor beam quality.
Figure 2.3: Schematic of a double-clad fibre.
Pump absorption in DCFs is relatively low compared to core-pump fibres. For example,
the large mode area (LMA) Er3+ fibre used in Chapter 7 has an absorption coefficient of 5
dB/m at 1530 nm. Therefore, efficient pump absorption per unit length is a prerequisite
to obtain good performance in double-clad fibre amplifier systems. Different techniques
have been developed in order to improve the pump absorption in fibres. One of these
techniques consists of breaking the axial symmetry of the core and the inner cladding to
avoid helical rays (see. Fig. 2.4 (a)). Helical rays propagate in the inner cladding in spiral
trajectories without crossing the fibre core. As a result, helical rays propagate practically
without being absorbed, reducing the gain and power efficiency of the amplifier. Figs. 2.4
(b)-(e) show various designs of DCFs with off-centred core and non-circular claddings.
The LMA Er3+/Yb3+ co-doped and LMA Er3+-doped fibre use in Chapter 7 for the
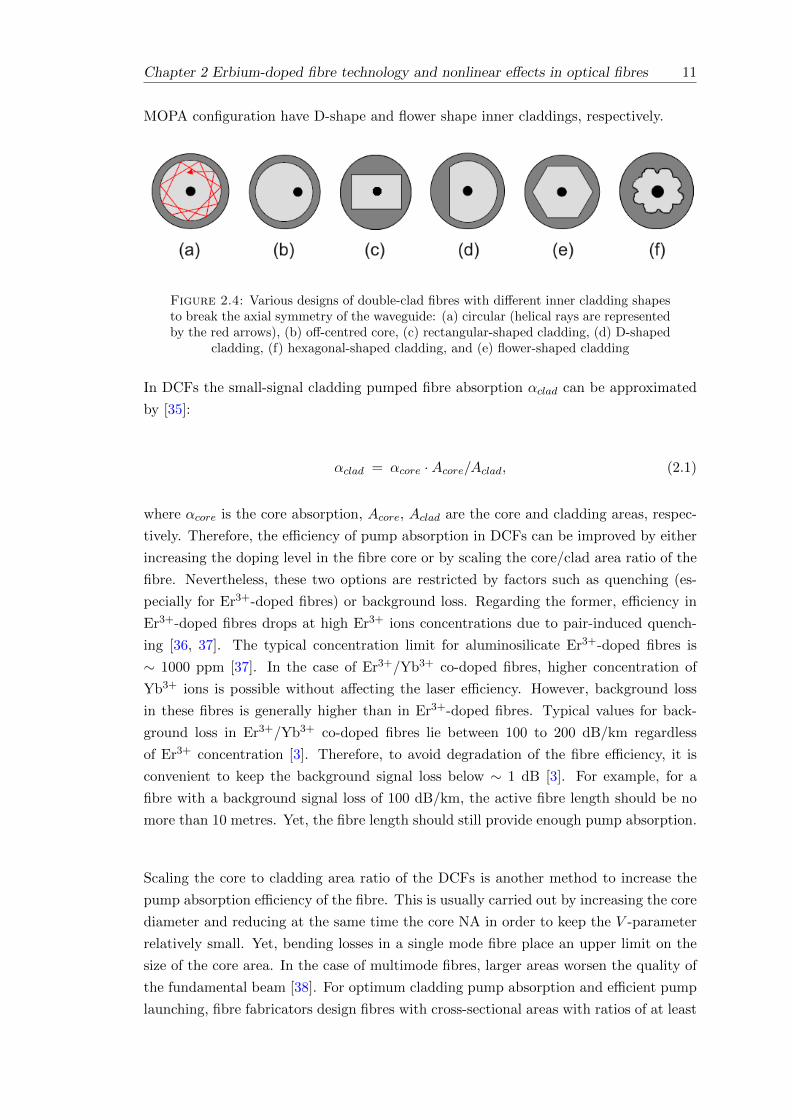
Chapter 2 Erbium-doped fibre technology and nonlinear effects in optical fibres 11
MOPA configuration have D-shape and flower shape inner claddings, respectively.
Figure 2.4: Various designs of double-clad fibres with different inner cladding shapesto break the axial symmetry of the waveguide: (a) circular (helical rays are representedby the red arrows), (b) off-centred core, (c) rectangular-shaped cladding, (d) D-shaped
cladding, (f) hexagonal-shaped cladding, and (e) flower-shaped cladding
In DCFs the small-signal cladding pumped fibre absorption αclad can be approximated
by [35]:
αclad = αcore ·Acore/Aclad, (2.1)
where αcore is the core absorption, Acore, Aclad are the core and cladding areas, respec-
tively. Therefore, the efficiency of pump absorption in DCFs can be improved by either
increasing the doping level in the fibre core or by scaling the core/clad area ratio of the
fibre. Nevertheless, these two options are restricted by factors such as quenching (es-
pecially for Er3+-doped fibres) or background loss. Regarding the former, efficiency in
Er3+-doped fibres drops at high Er3+ ions concentrations due to pair-induced quench-
ing [36, 37]. The typical concentration limit for aluminosilicate Er3+-doped fibres is
∼ 1000 ppm [37]. In the case of Er3+/Yb3+ co-doped fibres, higher concentration of
Yb3+ ions is possible without affecting the laser efficiency. However, background loss
in these fibres is generally higher than in Er3+-doped fibres. Typical values for back-
ground loss in Er3+/Yb3+ co-doped fibres lie between 100 to 200 dB/km regardless
of Er3+ concentration [3]. Therefore, to avoid degradation of the fibre efficiency, it is
convenient to keep the background signal loss below ∼ 1 dB [3]. For example, for a
fibre with a background signal loss of 100 dB/km, the active fibre length should be no
more than 10 metres. Yet, the fibre length should still provide enough pump absorption.
Scaling the core to cladding area ratio of the DCFs is another method to increase the
pump absorption efficiency of the fibre. This is usually carried out by increasing the core
diameter and reducing at the same time the core NA in order to keep the V -parameter
relatively small. Yet, bending losses in a single mode fibre place an upper limit on the
size of the core area. In the case of multimode fibres, larger areas worsen the quality of
the fundamental beam [38]. For optimum cladding pump absorption and efficient pump
launching, fibre fabricators design fibres with cross-sectional areas with ratios of at least
12 Chapter 2 Erbium-doped fibre technology and nonlinear effects in optical fibres
ten. The Er3+/Yb3+ co-doped and Er3+-doped fibres used in Chapter 6 have area ratios
of 44 and 12, respectively.
A good launching efficiency into the inner cladding of the DCF will also determine the
performance of the DCF laser or amplifier. Different techniques have been proposed to
maximize the launching efficiency of the pump signal, and are divided in two categories
depending on the position of the launching point along the DCF: end-pumping and side-
pumping. In end-pumping techniques, pump light is injected along the laser beam, while
in side-pumping techniques, light is pumped into the inner cladding without access to
the fibre ends. This can be done with V-shaped grooves located at different locations
along the active fibre or with GT-wave fibres [39] where the pump light is launched into
passive multimode pump fibres which are closely bundled to a signal fibre with an active
core. The fibres have similar refractive indices and are surrounded with a low index
coating, allowing the pump light to couple in the active fibre. For end-pumping, tapered
fibre bundles (TFP) [40] and free-space end-pumping are the most common techniques
for injecting light into DCFs. The MOPA configuration described in Chapter 7 uses a
free-space end-pumping technique to inject light into the active DCFs. This technique
was chosen due to its simplicity and high efficiency. Furthermore, the fibre pigtailed
output of the pump diode contributed to avoid complicated optics for coupling light
into the DCFs.
2.5 Nonlinear effects in optical fibres
The advantages offered by the waveguide geometry of fibre lasers, in terms of power-
scalability (tight beam confinement and long interaction lengths with the gain media)
enhance at the same time nonlinear effects. Nonlinear effects in optical fibres originate
from the third-order susceptibility χ(3) [41] and can be classified in two groups. The
first one includes effects related to the intensity dependence of the refractive index (Kerr
nonlinearity). Phenomena such as self-phase modulation (SPM), cross-phase modulation
(XPM) and four-wave-mixing (FWM) belong to this group. The second group includes
effects resulting from stimulated inelastic scattering (transfer of energy to the nonlin-
ear medium). Phenomena such as stimulated Raman scattering (SRS), and stimulated
Brillouin scattering (SBS) belong to this second group. All nonlinearities commented
above scale with intensity and interaction length. Therefore, they impose important
limitations to pulse propagation and amplification in optical fibres. In this section I give
a brief summary of such nonlinearities in the presence of pulse propagation in dispersive
media.
Chapter 2 Erbium-doped fibre technology and nonlinear effects in optical fibres 13
2.5.1 Pulse-propagation equation
The basic equation describing the propagation of pulses in optical fibres is the nonlinear
Schrodinger equation (NLSE) and it is given by [5]:
∂A
∂z= −αloss
2A− β1
∂A
∂t− i
2β2∂2A
∂t2+
1
6β3∂3A
∂t3+ iγ |A|2A (2.2)
where A denotes the slowly-varying complex-envelope of the optical field propagating in
the z direction at a time t, β1 is the inverse group velocity υg (rate of change of time
with respect to distance), β2 is the group-velocity dispersion (GVD) coefficient, β3 is the
third order dispersion coefficient, αloss is the fiber loss, and γ is the nonlinear parameter
of the fibre at the carrier angular frequency ω0.
Equation 2.2 can be simplified by using a frame of reference moving with the pulse at the
group velocity υg = 1/β1. Furthermore, for picosecond pulses, dispersive effects higher
than second order can be neglected. Assigning T = t− β1z, Eq. 2.2 takes the form:
∂A
∂z= −αloss
2A− i
2β2∂2A
∂T 2+ iγ |A|2A. (2.3)
The nonlinear parameter in Eq. 2.2 and 2.3 is defined as
γ =ω0n2(ω0)
cAeff(2.4)
where n2 is the nonlinear-index coefficient, c the speed of light and Aeff is the effective
mode area defined as:
Aeff =
[∫ ∫|F (x, y, ω0)|2 dxdy
]2∫ ∫|F (x, y, ω0)|4 dxdy
(2.5)
where F (x, y, ω0) is the spatial distribution of the fibre mode.
Equation 2.3 is mainly governed by the dispersion parameter β2 and the nonlinear effects
represented by γ. For analysis of pulse propagation, it is always useful to identify which
of the two parameters governs pulse evolution in an optical fibre. For an input pulse
with peak power P0 and pulse width T0, it is possible to define two length scale param-
eters: the dispersion length LD = T 20 / |β2|, and the nonlinear length LNL = (γP0)
−1.
A dispersion-dominant regime occurs whenever LD/LNL << 1, and a nonlinearity-
dominant regime is applicable whenever LD/LNL >> 1.
14 Chapter 2 Erbium-doped fibre technology and nonlinear effects in optical fibres
2.5.2 Group-velocity dispersion
In the dispersion-dominant regime it is possible to neglect the nonlinear parameter by
setting γ = 0 in Eq.2.3. If fibre loss is also neglected Eq. 2.3 takes the form:
∂A
∂z= − i
2β2∂2A
∂T 2. (2.6)
Eq. 2.6 can be solved in the frequency domain and its general solution is:
U(z, ω) = U(0, ω)e−iβ2ω2z/2 (2.7)
where U is the normalized amplitude given by U = A/P1/20 . The form of the general
solution shows that the dispersive term does not add new frequency components but just
rearranges the phase relations among existing frequency components [41]. Considering
an unchirped Gaussian pulse with amplitude
U(0, T ) = exp(− T 2
2T 20
) (2.8)
where T0 is related to the full width at half maximum (FWHM) of the pulse by TFWHM =
2(ln2)1/2T0. The amplitude evolution of the pulse along the fibre is given by [41]
U(z, T ) =T0√
T 20 − iβ2z
exp
(− T 2
2(T 20 − iβ2z)
)(2.9)
Eq. 2.9 shows that the Gaussian pulse maintains its shape but its width changes with
distance. Furthermore, the transmitted pulse acquires a chirp as it propagates along the
fibre. For the Gaussian pulse, the phase evolution at any point in the fibre is given by
φ(z, T ) = −sgn(β2)(z/LD)T 2
1 + (z/LD)2T 20
+1
2tan−1
(z
LD
)(2.10)
Equation 2.10 shows a time dependence of the pulse phase, whose time derivative imposes
a linear chirp across the pulse and is given by
δω(T ) = − ∂φ∂T
=sgn(β2)(2z/LD)T
1 + (z/LD)2T 20
(2.11)
The chirp δω(T ) depends on the sign of β2. In the normal dispersion regime (β2 > 0),
the pulse will be upchirped, which means that the leading edge of the pulse is red-shifted
Chapter 2 Erbium-doped fibre technology and nonlinear effects in optical fibres 15
while the trailing edge of the pulse is blue-shifted. The opposite occurs in the anomalous
dispersion regime (β2 < 0).
2.5.3 Self-phase modulation
In the nonlinearity dominated regime, the dispersion term in Eq. 2.3 is set to β2 = 0:
∂U
∂z=
ie−αlossz
LNL|U |2 U, (2.12)
The general solution for Eq.2.12 is given by
U(L, T ) = U(0, T )exp [iφNL(L, T )] (2.13)
where U(0, T ) is the slowly-varying field amplitude at position z = 0 and φNL(L, T ) is the
nonlinear phase shift defined as: φNL(L, T ) = |U(0, T )|2 (Leffn2kP0/Aeff ), where Aeff
is the effective area defined in Eq. 2.5, k = 2π/λ, and Leff is the effective length defined
as Leff =[1− exp(−αloss/gainL)
]/αloss/gain; the subscripts represent loss or gain of the
fibre of length L. Equation 2.13 shows that SPM induces an intensity dependent phase
change across the pulse that increases with the length of the fibre and pulse intensity.
The time dependence of φNL(L, T ) leads to a broadening of the pulse spectrum and to
a frequency chirp given by:
δω(T ) = −∂φNL∂T
= −Leffn2kP0
Aeff
∂
∂T|U(0, T )|2 (2.14)
2.5.4 Stimulated Raman scattering
Stimulated Raman scattering (SRS) is related to the transfer of a small fraction of
power from an optical field to another field with a frequency downshift determined by
the vibrational mode of the medium [41]. SRS occurs when a pump beam is sufficiently
intense (Raman threshold) to generate a frequency-shifted radiation called the Stokes
wave. Although SRS can be useful to design Raman based fibre amplifiers and lasers,
it can also impose limitations in pulse amplification at high peak powers. Therefore, it
is important to understand and calculate the Raman threshold with the parameters of
the amplification systems used in Chapter 6, in order to avoid the onset of SRS.
An important parameter to understand the behaviour of SRS is the Raman gain coeffi-
cient gR, whose spectrum is shown in Fig. 2.5. The graphic shows the measurement of
gR as a function of the frequency shift between the Stokes wave and the pump light for
16 Chapter 2 Erbium-doped fibre technology and nonlinear effects in optical fibres
fused silica with a pump light at 1 µm. The maximum gain of the Raman spectrum is
gR ∼ 1x10⁻¹³ m/W and is located at a frequency shift of ∼ 13.3 THz. In the 1550 nm
wavelength, this shift corresponds to a wavelength shift of ∼ 105 nm.
Figure 2.5: Raman gain spectrum of silica fibres [4].
The input power at which the Stokes power becomes equal to the pump power at the
fibre output is known as the Raman threshold or critical power. It can be calculated by
analysing the interaction between the pump and the Stokes signals represented by a set
of two coupled equations:
∂Is∂z
= gRIpIs − αsIs, (2.15)
∂Ip∂z
= −ωpωsgRIpIs − αpIp, (2.16)
where Is and Ip are the Stokes and the pump intensities, respectively, gr is the Raman
gain coefficient, and αs and αp are the fibre losses at the Stokes and pump frequency,
respectively. Solving the above equations and without considering pump depletion, the
critical input pump power to reach the Raman threshold is given by [41]
gRPcr0 LeffAeff
≈ 16. (2.17)
Equation 2.17 shows that SRS is proportional to the effective length of the active fibre
and inversely proportionally to the fibre effective area. Therefore, a way of reducing the
onset of SRS is by reducing the fibre length or increasing the core area of the fibre.
2.6 Conclusions
In this Chapter, I presented the background theory to understand the performance of
Er3+-doped and Er3+/Yb3+ co-doped fibre technology. The concepts of core-pumped
Chapter 2 Erbium-doped fibre technology and nonlinear effects in optical fibres 17
and cladding-pumped optical fibre amplifiers were also discussed. In particular, the
advantages and disadvantages of DCF technology for power-scalability are highlighted.
The advantages offered by the waveguide geometry of fibre lasers in terms of power-
scalability, enhance at the same time nonlinear effects, which are detrimental for the laser
signal. Accounting for these nonlinear effects is more important in pulsed regime due to
the high peak intensities that can be reached. Therefore, this Chapter also presented a
brief review of the most relevant nonlinear effects observed in the experiments carried
out in the Thesis. For example, in Chapter 4 and 6 GVD parameter β2 and SPM play
a fundamental role for picosecond pulse formation. In Chapter 7 pulse amplification
of picosecond pulses in DCF amplifiers leads to pulse spectral broadening due to SPM.
Controlling excessive SPM in pulse amplification is foremost to avoid pulse distortions
that can lead to pulse break-up. In Chapter 8 SRS is exploited with help of a highly
nonlinear fibre (HNLF) to generate a broadband source of ∼ 135 nm in the 1550 nm
region.
Chapter 3
Mode-locked fibre lasers
Ultrafast lasers have become important tools for a variety of industrial and scientific
applications [42, 43]. In particular, fibre-based ultrafast sources can benefit from the
major advantages offered by fibre laser technology in terms of power scalability, large
spectral bandwidth, and good spatial mode quality. Furthermore, the flexibility of fi-
bre laser technology has generated ultrafast fibre lasers covering a broad range of pulse
widths (ns to fs) and pulse repetition frequencies (kHz to GHz). In particular, for the
fs to tens of ps, passive mode-locking (ML) techniques have proved useful with pulse
repetition frequencies ranging from hundreds of kHz to GHz [2].
In this thesis, two different passive ML techniques are used to generate picosecond
pulses with pulse repetition rates in the MHz regime. Therefore, in order to provide
some background in this field, this Chapter gives a brief summary of the passive ML
techniques most commonly used to generate ultrashort pulses. In addition, the second
part of the chapter is focused on discussing the different pulse-shaping mechanism in
the fibre cavity to obtain higher pulse energies straight from the oscillator.
3.1 Passive mode-locking techniques
The output spectrum of a fibre laser is formed of discrete components generated by con-
structive interference at specific wavelengths, also known as longitudinal modes. Such
modes are determined by the length of the cavity and, in the case of cw lasers, are
independent and random in phase among them [44]. ML ocurrs when the phases of
the longitudinal modes of a laser are locked to a constant value φ and the laser out-
put is formed of a pulse train spaced by the fundamental frequency retition rate. ML
techniques for fibre lasers can be divided in two groups: active ML and passive ML.
Regarding the former, the technique is based on active modulation of the intracavity
19
20 Chapter 3 Mode-locked fibre lasers
losses or of the round-trip phase change. This is usually carried out through electro-
optic devices. Pulse formation occurs whenever the modulation is synchronized with the
intracavity round trip. Passive ML, on the other hand, is an all-optical technique that
relies on the interaction of intensity fluctuations and fibre nonlinearities to modulate
the cavity loss without an external signal or control [5]. Passive ML fibre lasers have
been achieved using different methods such as: nonlinear polarization rotation [45, 46],
[49, 50] , carbon nanotubes [51, 52], frequency-shifted feedback lasers [8, 53], etc. The
first two methods rely on artificial saturable absorbers generated by the interaction of a
Kerr effect in an optical fibre and a polarizer. One of the main advantages of these tech-
niques is that its artificial saturable absorber provides a fast recovery time allowing the
formation of sub-100 femtosecond pulses [42]. Nevertheless, a constant problem shown
with these techniques is that ML most of the times is not self-starting. A solution for
this problem is the inclusion of “bulk” saturable absorbers into the cavity to enhance
the self-starting ML operation of the laser.
3.1.1 Nonlinear amplifying loop mirror
The nonlinear amplifying-loop mirror (NALM) is a technique that consists of a fibre
Sagnac interferometer with a gain medium located asymmetrically in the loop [54]. Due
to the asymmetry in the position of the amplifier, the two signals propagating in opposite
direction in the loop acquire different nonlinear phase shifts. With a proper phase bias
the NALM can transmit higher intensities (pulse peak) and reflect lower intensities
(pulse wings). The structure can be integrated into figure-8 lasers (see Fig. 3.1) where
a pulse exiting the NALM section is narrower than to the same pulse before entering
the NALM.
Figure 3.1: Schematic of a figure-8 cavity. The ring cavity on the right acts asa nonlinear amplifying-loop mirror, whose basic structure (Sagnac interferometer) is
represented by the diagram on the bottom right of the figure. [5].
Chapter 3 Mode-locked fibre lasers 21
3.1.2 Nonlinear polarization evolution
This technique was first used in 1992 for passive ML of fibre lasers [55, 56]. Nonlinear
polarization evolution is related to the intensity dependent changes of an elliptical polar-
ized pulse propagating in an optical fibre. This phenomenon can be better understood
by referring to Fig. 3.2. Here, an optical fibre is located between two polarization con-
trollers (quarter-wave plate and half-wave plate), and two linear polarizers. Considering
an initial linearly polarized pulse, its polarization changes to elliptical after leaving the
quarter-wave plate. The polarization state evolves nonlinearly during propagation of
the pulse in the optical fibre (represented in the figure by the Kerr medium) due to
SPM- and XPM- induced phase shifts [6]. At the output of the fibre, the pulse has a
non-uniform state of polarization due to the intensity dependence of the nonlinear phase
shift. The half-wave plate placed at the output of the fibre orients the polarization state
of the pulse peak to pass through the second polarizer, while the wings are blocked due
to the different polarization state. The net result is that the pulse is shortened after
one round trip through these optical devices. This is similar to the action produced by
a fast saturable absorber.
Figure 3.2: Representation of nonlinear polarization evolution. [6].
3.1.3 Semiconductor Saturable absorbers
SESAMs have become essential intracavity components for passively ML lasers, due to
their optical properties that can be engineered over a broad range, thus allowing their
use in wider cavity laser designs [57]. A SESAM is a mirror structure, typically formed
of a semiconductor Bragg reflector (DBR), and additional top layers producing saturable
absorption (usually a quantum well absorber) [58]. The basic mechanism of these devices
can be understood as follows. When an optical pulse propagates through the SESAM,
the absorption of the device will change accordingly to the pulse intensity. In this
regard, the central part of the pulse, with higher intensities, will saturate the absorber
and consequently the net losses of the device will be reduced. On the contrary, the
wings of the pulse, with lower intensity, cannot saturate the device and will experience
more losses. The net result is a shortening of the pulse during its passage through the
22 Chapter 3 Mode-locked fibre lasers
absorber and the removal of cw radiation that could built up in the laser and make it
unstable.
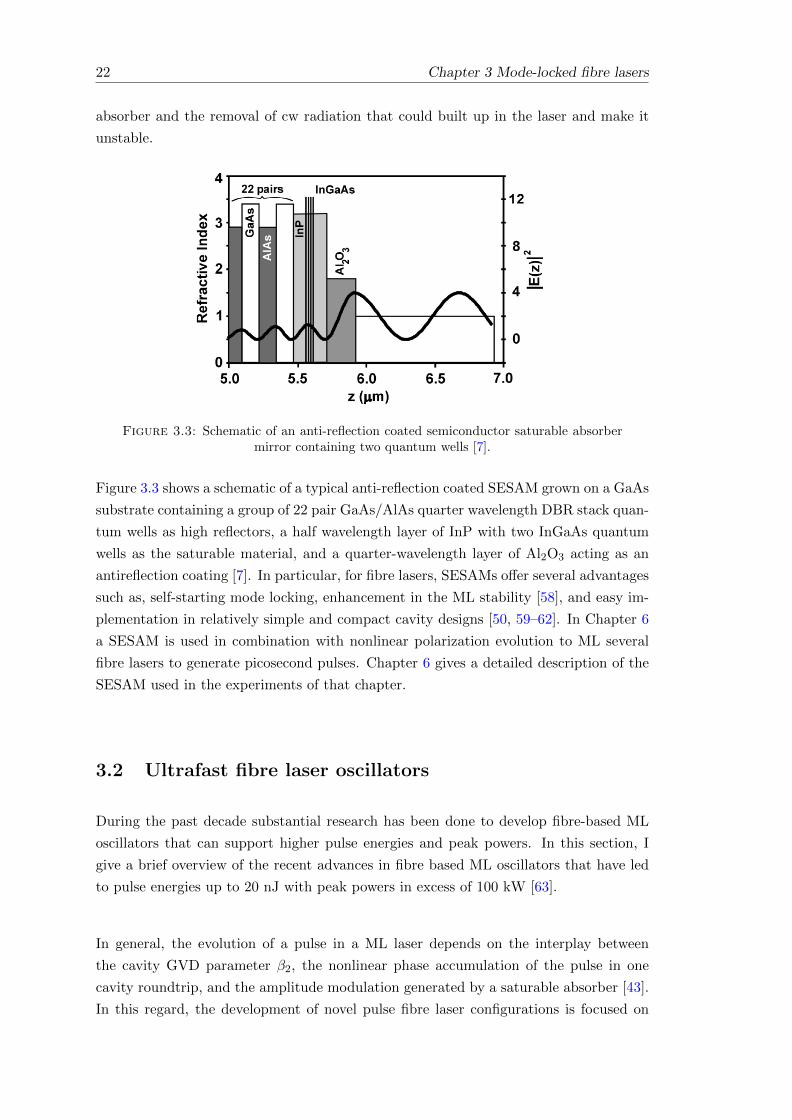
Figure 3.3: Schematic of an anti-reflection coated semiconductor saturable absorbermirror containing two quantum wells [7].
Figure 3.3 shows a schematic of a typical anti-reflection coated SESAM grown on a GaAs
substrate containing a group of 22 pair GaAs/AlAs quarter wavelength DBR stack quan-
tum wells as high reflectors, a half wavelength layer of InP with two InGaAs quantum
wells as the saturable material, and a quarter-wavelength layer of Al2O3 acting as an
antireflection coating [7]. In particular, for fibre lasers, SESAMs offer several advantages
such as, self-starting mode locking, enhancement in the ML stability [58], and easy im-
plementation in relatively simple and compact cavity designs [50, 59–62]. In Chapter 6
a SESAM is used in combination with nonlinear polarization evolution to ML several
fibre lasers to generate picosecond pulses. Chapter 6 gives a detailed description of the
SESAM used in the experiments of that chapter.
3.2 Ultrafast fibre laser oscillators
During the past decade substantial research has been done to develop fibre-based ML
oscillators that can support higher pulse energies and peak powers. In this section, I
give a brief overview of the recent advances in fibre based ML oscillators that have led
to pulse energies up to 20 nJ with peak powers in excess of 100 kW [63].
In general, the evolution of a pulse in a ML laser depends on the interplay between
the cavity GVD parameter β2, the nonlinear phase accumulation of the pulse in one
cavity roundtrip, and the amplitude modulation generated by a saturable absorber [43].
In this regard, the development of novel pulse fibre laser configurations is focused on
Chapter 3 Mode-locked fibre lasers 23
avoiding excessive nonlinear phase shifts that can significantly distort the pulse profile
evolution, and lead to its eventual break up (wave-breaking). Fig. 3.4 shows a qualitative
description of the interplay between pulse duration, cavity dispersion map and pulse
chirp for four stable pulse solutions in ML fibre lasers: soliton, stretched-pulse, self-
similar pulse, and all-normal pulse.
Figure 3.4: Description of different pulse evolutions as functions of the cavity disper-sion map (solid red line) of a fibre laser: (a) soliton, (b) stretched-pulse, (c) self-similarpulse, and (d) all-normal pulse. The blue solid line represents the pulse duration,while the dotted green line represents pulse chirp. The maximum nonlinear phase shiftthat each pulse can tolerate before wave-breaking is indicated on the right side of each
diagram.
3.2.1 Soliton fibre lasers
Soliton fibre lasers (see Fig. 3.4 (a)) are cavities formed with anomalous-dispersion that
can support pulse solutions of the form:
A(t) = A0sech(t/τ)exp(iφs), (3.1)
where τ sFWHM = 1.763τ is the FWHM pulsewidth and φs = |β2| /2τ2 , is the soliton
phase. Here β2 represents the group velocity dispersion (GVD) parameter. Solitons are
chirp-free solutions (bandwidth-limited) formed by the cancelation of negative dispersive
and positive nonlinear phase shifts. Their sech2 pulse-shape is always characterized by
24 Chapter 3 Mode-locked fibre lasers
long extended temporal wings and spectral side bands, called Kelly bands [64]. In
terms of the amount of extractable energy that one can get from these lasers, the main
drawback comes from the soliton area theorem which fixes the product of the peak
amplitude A0 and pulse width τ sFWHM to the average intracavity dispersion D2 and the
nonlinearity γ of the laser cavity [65]. D2 is defined as D2 = β2z, where z is the length
of the laser cavity. The pulse energy Es and τ sFWHM in a soliton laser can be calculated
by [42]:
Es =3.53
√|D2|
γL(3.2)
where τ sFWHM =√|D2| and γ is the nonlinear coeffiecient of the fibre L is the intra-
cavity fibre length. As a result of the energy limitation per pulse, the total energy per
pulse becomes quantized. Energies achievable in such laser systems are often between
tens of picojoules and a few nanojoules [66].
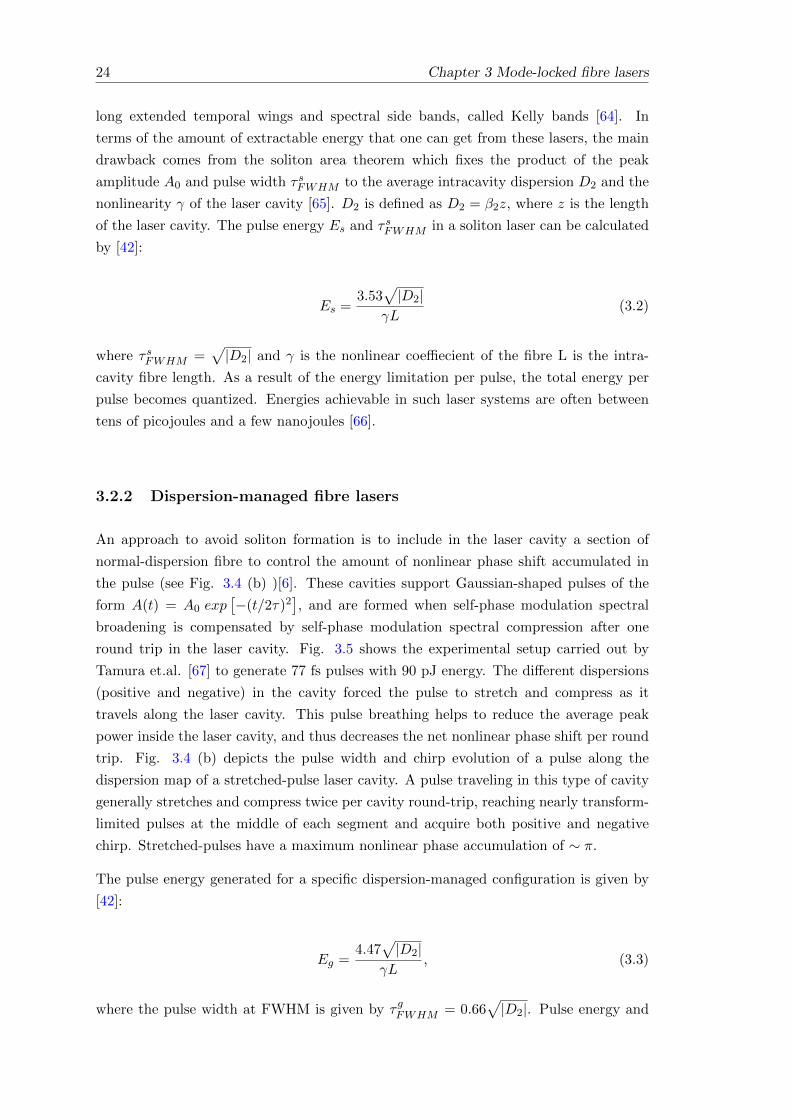
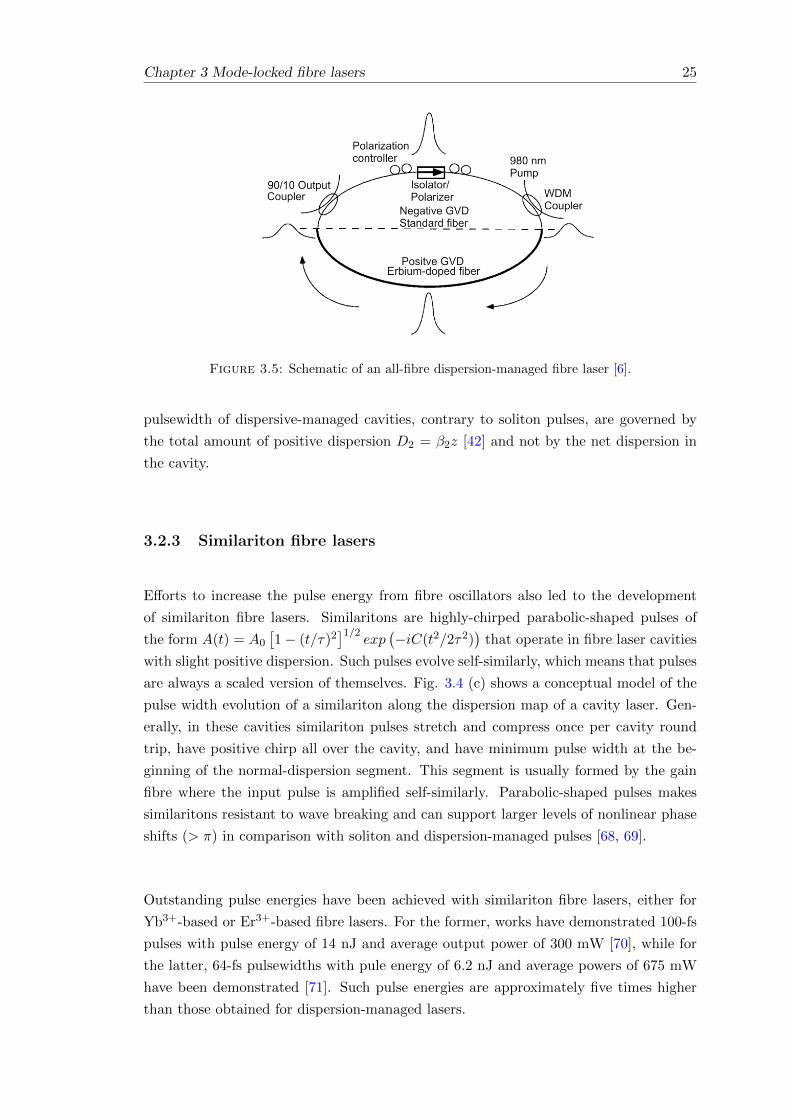
3.2.2 Dispersion-managed fibre lasers
An approach to avoid soliton formation is to include in the laser cavity a section of
normal-dispersion fibre to control the amount of nonlinear phase shift accumulated in
the pulse (see Fig. 3.4 (b) )[6]. These cavities support Gaussian-shaped pulses of the
form A(t) = A0 exp[−(t/2τ)2
], and are formed when self-phase modulation spectral
broadening is compensated by self-phase modulation spectral compression after one
round trip in the laser cavity. Fig. 3.5 shows the experimental setup carried out by
Tamura et.al. [67] to generate 77 fs pulses with 90 pJ energy. The different dispersions
(positive and negative) in the cavity forced the pulse to stretch and compress as it
travels along the laser cavity. This pulse breathing helps to reduce the average peak
power inside the laser cavity, and thus decreases the net nonlinear phase shift per round
trip. Fig. 3.4 (b) depicts the pulse width and chirp evolution of a pulse along the
dispersion map of a stretched-pulse laser cavity. A pulse traveling in this type of cavity
generally stretches and compress twice per cavity round-trip, reaching nearly transform-
limited pulses at the middle of each segment and acquire both positive and negative
chirp. Stretched-pulses have a maximum nonlinear phase accumulation of ∼ π.
The pulse energy generated for a specific dispersion-managed configuration is given by
[42]:
Eg =4.47
√|D2|
γL, (3.3)
where the pulse width at FWHM is given by τ gFWHM = 0.66√|D2|. Pulse energy and
Chapter 3 Mode-locked fibre lasers 25
Figure 3.5: Schematic of an all-fibre dispersion-managed fibre laser [6].
pulsewidth of dispersive-managed cavities, contrary to soliton pulses, are governed by
the total amount of positive dispersion D2 = β2z [42] and not by the net dispersion in
the cavity.
3.2.3 Similariton fibre lasers
Efforts to increase the pulse energy from fibre oscillators also led to the development
of similariton fibre lasers. Similaritons are highly-chirped parabolic-shaped pulses of
the form A(t) = A0
[1− (t/τ)2
]1/2exp
(−iC(t2/2τ2)
)that operate in fibre laser cavities
with slight positive dispersion. Such pulses evolve self-similarly, which means that pulses
are always a scaled version of themselves. Fig. 3.4 (c) shows a conceptual model of the
pulse width evolution of a similariton along the dispersion map of a cavity laser. Gen-
erally, in these cavities similariton pulses stretch and compress once per cavity round
trip, have positive chirp all over the cavity, and have minimum pulse width at the be-
ginning of the normal-dispersion segment. This segment is usually formed by the gain
fibre where the input pulse is amplified self-similarly. Parabolic-shaped pulses makes
similaritons resistant to wave breaking and can support larger levels of nonlinear phase
shifts (> π) in comparison with soliton and dispersion-managed pulses [68, 69].
Outstanding pulse energies have been achieved with similariton fibre lasers, either for
Yb3+-based or Er3+-based fibre lasers. For the former, works have demonstrated 100-fs
pulses with pulse energy of 14 nJ and average output power of 300 mW [70], while for
the latter, 64-fs pulsewidths with pule energy of 6.2 nJ and average powers of 675 mW
have been demonstrated [71]. Such pulse energies are approximately five times higher
than those obtained for dispersion-managed lasers.
26 Chapter 3 Mode-locked fibre lasers
3.2.4 All-normal fibre lasers
Recent works have shown that laser cavities with large normal dispersion support highly-
chirped pulses (see Fig. 3.4 (d))with high energies and peak powers without pulse-
breaking. The pulses in these cavities are formed by the interaction of nonlinear chirp-
ing and filtering which eventually produces strong self-amplitude modulation that can
dominate the pulse-shaping. Pulses obtained with these configurations can also have
pulse energies of ∼ 10 nJ.
3.3 Conclusions
In this Chapter, I presented a summary of the mechanism to generate passive ML
lasers. In particular, the nonlinear polarization evolution technique and the semicon-
ductor saturable absorber, are the techniques used for the development of the pulsed
lasers described in Chapter 4 and 5. In this chapter I also discussed the different pulse-
shaping mechanism in fibre cavities to obtain higher pulse energies straight from the
oscillator. Two configurations are developed for this thesis: a soliton source, and a
dispersion-managed source. Both configurations will be described in detail in the next
Chapters.
Chapter 4
Mode-locked laser based on
frequency-shifted feedback
technique
In this Chapter I give an introduction to the operating principles of frequency-shifted
feedback (FSF) lasers in the mode-locking (ML) regime. In addition, I give a brief
summary of former theoretical and experimental work carried out with FSF lasers. I
present the experimental results of two all-fibre Er3+-doped laser configurations using
an acousto-optic modulator (AOM) as a frequency shifter inside the cavity. The first
configuration presents a simple ring cavity (gain medium, polarization controller, optical
filter, output coupler, and frequency shifter) which facilitates the study of different
operating regimes of the laser for different pump powers. The second configuration
includes a fiberized polarizer which stimulates the nonlinear polarization evolution in
the cavity. This hybrid FSF laser configuration enhances the stability in the ML regime
allowing pulse analysis as function of different parameters of the laser cavity (frequency
shift, coupling ratio, filter bandwidth). Experimental results obtained in this chapter,
in addition to the numerical simulations of Chapter 5, provide a better understanding
of the dynamics of FSF lasers in the ML regime, which have not been addressed in
previous work. The study of the characteristics of the signal allows enumerating the
advantages and disadvantages of this technique for ML pulses and its possible application
for dynamic pulse sources.
4.1 Operating principles of frequency-shifted feedback lasers
The signal of a conventional laser is determined by four main elements: gain medium,
feedback system, frequency-selection mechanism, and output coupling. The interaction
of these elements generate a well-defined signal formed by the constructive interference
27
28 Chapter 4 Mode-locked laser based on frequency-shifted feedback technique
and constant amplification of specific frequencies which match a resonant condition in
the laser cavity (resonant frequencies). Over many round-trips, the signal reaches a
steady-state regime and the gain of the amplifier equals the losses in the cavity leading
to a round-trip gain close to unity. For a laser cavity comprising a frequency filter,
this unity gain region is localized near the filter central frequency νc. See for example,
Fig. 4.1 (a). However, in a laser with a frequency-shifted feedback (FSF) mechanism,
the spectral components of the electric field travelling inside the cavity are shifted by
“fAOM” each time they pass through an intracavity frequency shifter. In this way, the
energy localized close to νc is displaced to the higher-loss regions of the filter, generating
an excess loss at νc. In order to overcome this excess loss, the net round-trip gain
will acquire a value larger than unity around νc. Moreover, if the spectral components
that are constantly shifted in the cavity are not somehow replaced as they leave the
filter bandwidth, they will die out. In this sense, the laser acts as a broadband optical
amplifier rather than a laser because the frequency-shifting effect does not allow the
laser modes to be fixed at one specific wavelength. Therefore, at low pump powers,
the spectral shape of the FSF laser shows a broader bandwidth and an asymmetry in
comparison to the spectral shape of a conventional laser (see Fig.4.1(b)).
Figure 4.1: Schematic of the steady-state spectrum (blue solid line) of a laser (a)without and (b) with a frequency shifter inside the laser cavity. The black solid line
represents the net round-trip gain g(νc) of the laser cavity.
Further studies in FSF lasers showed that under certain parameter conditions, these
lasers could operate in different regimes such as broadband cw [72, 73] or pulsed mode
[8, 53, 74, 75]. Regarding the latter, this regime appears with the introduction of a Kerr
nonlinearity (e.g., SPM) in the resonator [8]. SPM acts as a phase seed mechanism that
can establish a phase distribution along the spectrum of the bandpass filter, enhancing
pulse formation. Once a pulse is formed, it can remain trapped in the cavity by the
interaction of the continuous frequency shifting mechanism and the frequency dependent
gain/loss properties of the cavity (optical filter). The explanation given beforehand is
summarized in Fig.4.2. In this schematic, it is assumed that a feedback loop is stablished
in the cavity and a pulse has been formed from stochastic noise (see Fig.4.2(1)). In this
case, the continuos shift of the spectral components carried out by the frequency shifter
pushes the pulse spectrum to the higher loss wings of the filter 4.2(2). However, the
spectral components are then reshaped to its original state by the frequency dependent
Chapter 4 Mode-locked laser based on frequency-shifted feedback technique 29
gain and loss of the laser cavity Fig.4.2(3). The new spectral components that will
act as a phase seed mechanism are generated by means of SPM when the pulse travels
through the nonlinear medium. These new spectral components are uniquely related
to the phase spectrum of the generated pulse and feedback energy from the center of
the pulse spectrum into its wings Fig.4.2(4). This process of spectral broadening of the
generated pulse continues until a steady-state is reached.
Figure 4.2: Evolution of the optical spectrum of a pulse in a FSF laser cavity with anet roundtrip gain g(ν): (1) Initial spectrum of the seeded pulse, (2) spectrum after thefrequency shifting process, (3), reshaped spectrum by frequency dependent gain or lossprocess, and (4) generation of new spectral components by the cavity nonlinear gain.Processes (1) to (4) are iterated until a steady state is reached when the pulse spectral
width becomes comparable to the filter bandwidth [8].
FSF lasers have been widely studied since their first mention in the literature, by Streifer
et al. [76]. Their distinctive performance which allow them to operate in either broad-
band cw or pulsed regimes has made them attractive as light sources for applications
such as broadband cw lasers [72, 73] to laser cooling [77], distance metrology [78, 79],
multi-wavelength lasers [80–84], and pulse sources [8, 53, 75, 85–93]. Regarding the gen-
eration of ultrashort pulses with FSF lasers, the first report published dates from 1988
[73]. Since then, different work has been carried out in order to achieve shorter and
higher-energy pulses from this type of lasers. The next section provides a brief review of
the experimental work carried out up to date to generate ultrashort pulses with the FSF
30 Chapter 4 Mode-locked laser based on frequency-shifted feedback technique
techniques. Theoretical investigations of FSF lasers will be further discussed in Chapter
5 where analytical and numerical simulation results are presented and compared with
previous work.
4.2 Literature review of frequency-shifted feedback lasers
Pulse formation in FSF lasers was first reported by Kowalski et al. in 1988 [73]. In this
work pulse widths between 29 ps and 9.6 ps with random pulse repetition rates were
generated in a ring dye laser. Years later, Hale et.al [94] and Cutler [95] published theo-
retical models to calculate the shape of the output laser intensity in time and frequency
domains. Both models showed that a FSF cavity could generate periodic pulses with a
repetition rate equal to the inverse cavity round-trip time. Yet, these models did not
consider noise or nonlinear effects. The role of nonlinear effects in pulse formation was
studied by Sabert et. al [8]. The work suggested that Kerr-type nonlinearity of the
optical fibre was responsible for pulse formation in the laser cavity. In this work the au-
thors also demonstrated numerically and experimentally that shorter pulses and broader
linewidths could be achieved by increasing the frequency shift in the cavity. These ex-
periments were carried out in Er3+ and Nd3+ fibre lasers. A different analysis of pulse
formation in FSF lasers was given by Fontana et al. [53]. In this work the authors
presented an analogy of the sliding filter technique, used in long distance transmission
systems, with the performance of a FSF fibre ring laser [96]. The authors demonstrated
self-starting soliton generation with pulse widths between 20 and 16 ps with an Er3+
doped fibre FSF ring laser. The role of group velocity dispersion GVD in FSF laser
was studied by Romagnoli et al. [86]. The authors concluded that pulse formation was
possible in either anomalous or normal dispersion regimes. Therefore, FSF laser have
also been demonstrated with Yb3+ fibres. For instance, Porta et al. demonstrated a
tunable ML FSF laser operating in the region between 1010 nm and 1064 nm [89]. The
laser generated 5 ps pulses and it operated in simultaneous Q-switched and ML regimes
enabling the generation of 1.2 kW peak powers.
The first all-fibre FSF laser was published in [75]. This novel design was based on a
fiberized acousto-optic frequency shifter which also worked as a band-pass filter. Okhot-
nikov et al. demonstrated in [80] that pulse formation in FSF lasers was also possible
without using a tight spectral filtering mechanism (band-pass filter), which could even-
tually limit pulse shortening. Subpicosecond pulses in FSF laser have been achieved by
inserting polarizing elements, i.e. a polarization beam splitter, inside the cavity [90, 91].
Ultrashort pulses were generated in this way by exploiting the nonlinear polarization
evolution inside the ring cavity. For instance, in [91], an Yb3+-doped FSF fibre laser
generated stable 4-ps chirped pulses that were compressed outside the cavity to 68 fs
Chapter 4 Mode-locked laser based on frequency-shifted feedback technique 31
pulses with energies of ∼ 100 pJ. Subpicosecond pulses were also achieved with hybrid
cavity configurations like the one presented in [87]. In this work, slightly chirped <
2-ps pulses were obtained with a laser cavity that included a nonlinear amplifying loop
mirror (NALM). Pulses were compressed to the subpicosecond regime by compensating
the linear chirp on the pulses by means of a piece of SMF-28 fiber.
Tunable FSF lasers have also been realised through different means [75, 85, 93]. For
instance, in [75] wavelength tuning was achieved by controlling the acoustic driving
frequency of a home made acousto-optic fiber frequency shifter. In more recent work,
Nikodem et al. showed that adjustments of the AOM RF power could also lead to wave-
length tuning [93].
Work has also been carried out to increase the peak power of the pulses in FSF fibre
lasers. For instance, Broderick et al. increased the output energy of an Er3+-doped FSF
fibre laser by using a large mode area (LMA) fibre [88]. Pulse energies of ∼ 1.6 nJ and
peak powers of 1.7 kW were demonstrated with this design. Heidt et al. demonstrated
pulse energies up to 120 nJ and peak powers exceeding 40 kW with a Yb3+-doped fiber
laser with a linear cavity design [92]. Furthermore, the energies of the pulses were
significantly increased by inducing a Q-switched ML. The energies achieved with this
technique reached 1 µJ with average output powers as high as 870 mW.
Pulses generated with FSF lasers present an asymmetry in the optical spectrum, which
is a consequence of the quadratic frequency chirp imposed by the frequency shifter [97]
and the filter dispersion [96] in the cavity. Although this is a well-known characteristic
of FSF lasers, there is little work that has linked experimental results [8, 86, 98] with
analytical models describing the ML regime in FSF lasers [96, 97]. Furthermore, most
of the experimental work carried out with ML Er3+-doped FSF lasers have been focused
on achieving shorter pulses through different cavity configurations without paying much
attention to the pulse spectral shape and its relation with the pulse behavior in the time
domain. For example, in work like [86, 90, 93] the experimental results show a strong
asymmetry in the pulse spectrum; however, it is not clear how the different parameters
in the laser cavity (filter bandwidth, frequency shift, gain)determine or modify the shape
of the pulse in the frequency and time domains.
In the next section, I present experimental studies analysing the behaviour of the pulse
shape and pulse spectra for different parameters of a ML Er3+-doped FSF fiber laser in
a ring cavity configuration. The experimental results are compared with the numerical
simulations presented in Chapter 5. These novel experimental results allow a better
understanding of the dynamics of FSF lasers and its advantages and limitations as a
32 Chapter 4 Mode-locked laser based on frequency-shifted feedback technique
technique to generate ML sources.
4.3 Experimental Results
This section presents experimental results obtained from a tunable all-fibre ring cavity
FSF laser. Modifications to the main cavity were carried out in order to increase the
stability of the ML pulses. Self-starting ML and stable pulses were achieved by including
a polarization beam splitter (PBS) to enhance non-linear polarization evolution (NLPE)
inside the cavity. The stability achieved in this configuration allowed me to study the
behavior of the ML signal as a function of different parameters of the laser cavity.
4.3.1 All-fibre ring cavity frequency-shifted feedback laser
Figure 4.3 shows the first scheme built to generate a tunable pico-second source based
on FSF. The laser was formed of a 2.5 m long polarization maintaining Er3+-doped
cut-off wavelength λcf = 980 nm) pumped by two pig-tailed laser diodes through a
WDM coupler (1480/1550 nm). The laser diodes provided a maximum of 270 mW of
pump power at 1480 nm (Fitel FOL 1402P). A second WDM coupler (1480 nm/1550
nm) was spliced after the gain fiber to eliminate the unabsorbed power inside the cav-
ity. Unidirectional operation in the cavity was achieved by splicing an optical isolator
after the second WDM. A polarization controller (PC: 1) formed of a quarter-waveplate
λ/4, half-waveplate λ/2, and quarter-waveplate λ/4, helped to stabilize the ML opera-
tion of the laser. The tunability of the laser was achieved with a 30 nm tunable filter
(SANTEC OTF-30M) with an optical bandwidth of ∆λBPF = 1.3 nm. The frequency
shifting mechanism was generated with two fiberized AOMs (NEOS 26035-2-1.55-LTD)
with a frequency shift of fAOM = 35 MHz each. Therefore, the total frequency shift in
the cavity was fAOM = 70 MHz 1. The output of the laser cavity consisted of a 50:50
output coupler spliced before the AOM. The laser output power was detected with a
power meter (HP 81531B), while pulse measurements in the time domain were carried
out with a 20 GHz fast photodetector (HP-83440C) and a digital communication anal-
yser (DCA) (HP 83480A) with a 20 GHz electrical bandwidth. The DCA bandwidth
gave the possibility to measure pulses as short as 22 ps. Finally, the signal spectrum
was recorded with an optical spectrum analyser (OSA) (Ando AQ6315).
1First experiments were carried out with only one AOM. The additional AOM was proposed in orderto reduce the pulse width (See Chapter 5). However, the pulse width measurements carried out afterthe implementation of the second AOM, did not show any clear reduction in the pulse width. Yet, thesecond AOM helped to mode-lock the laser more easily.
Chapter 4 Mode-locked laser based on frequency-shifted feedback technique 33
Figure 4.3: Experimental setup of the all-fibre FSF, Er3+-doped fibre laser.
The cavity length was ∼ 20.8 m which corresponds to a cavity round trip time τrt =
100.5 ns. The average group velocity dispersion parameter of the cavity at 1550 nm was
calculated as β2 = −16 ps2/km (anomalous dispersion). The GVD parameter β2 of the
PM-Er+3 doped fibre was calculated from its refractive index profile (FRIP) with the
help of commercial software (FiberCad). The value calculated was β2 = 17.8 ps2/km
at 1550 nm, for the fast axis. The rest of the cavity was formed of SMF-28 with a
dispersion value of β2 = −20 ps2/km at 1550 nm.
Figure 4.4: Output power versus pumped power of an all-fiber, ring cavity, FSF laserwith a 1.3 nm optical bandwidth filter.
The output power performance of the laser operating at λ0= 1555 nm is shown in Fig.
4.4. The laser threshold was measured at 20 mW of pump power. Different operating
34 Chapter 4 Mode-locked laser based on frequency-shifted feedback technique
regimes were found as a function of pump power. Fig. 4.4 shows three different operat-
ing regimes, identified by significant changes in the output signal. Region I, is delimited
from the laser threshold (20 mW) up to a pump power of ∼ 27 mW. In this region, the
laser presented a cw operation with a maximum output power of 0.2 mW. For pump
powers ≥ 27 mW, the laser stopped operating in cw mode and showed pulsation. Noisy
pulses were generated in this regime, and its repetition rate increased linearly (∼ 12.74
kHz to 18.02 kHz) with pump power. Fig. 4.5 shows the pulses generated in this regime.
The pulse traces were taken with a fast photo-detector, and a digital oscilloscope with 2
GHz bandwidth (Tektronix DPO7254). In this regime, pulse formation was polarization
insensitive.
Figure 4.5: Train of pulses obtained at the output of the FSF laser for a pump power(a) Pp = 28 mW and (b) Pp = 39 mW.
The signal behaviour in the frequency domain was monitored with an RF spectrum
analyser (Model HP 8562A). In addition to the signal peaks observed in the kHz region,
a low-intensity beating was found at the cavity round-trip frequency frt = 9.95 MHz.
The kHz pulsation can be explained in terms of the relaxation oscillation response of
a laser to a sudden change of its operation conditions [98]. However, contrary to what
happens in conventional lasers where relaxation oscillations eventually damp down to a
steady state (cw emission), in FSF lasers the continuous shifting of spectral components
leads to the emission of a train of independent pulses whose repetition rate depends on
the pump power Pp.
For Pp ∼ 40 mW, the system showed self-starting pulsing behaviour. The laser output
emitted random sharp < 60-ps pulses with random amplitudes (see Fig. 4.6 (a)), and the
quasi-symmetry of the optical spectrum observed in Regime II breaks (see the dashed
blue trace in Fig. 4.6(c)). In this operating regime, the spectral maximum is shifted
Chapter 4 Mode-locked laser based on frequency-shifted feedback technique 35
to longer wavelengths and the shorter wavelength side shows a hump. By adjusting the
PCs in the cavity, it was possible to stabilize the train of pulses to either the cavity
fundamental frequency frt= 9.95 MHz or to higher harmonics of frt. In both cases,
the optical spectrum of the laser presented specific characteristics. For ML at frt, the
optical spectrum presented a noisy quasi-symmetric shape; see for example the black
solid trace in Fig. 4.6 (c). However, for higher repetition rates the spectrum presented
a small hump on the shorter wavelength side similar to the dashed blue trace shown in
Fig. 4.6(c).
Figure 4.6: Laser intensity and optical spectrum of a FSF laser operating in the MLregime (Region III). (a) depicts the laser intensity just after the laser shifts into MLregime, while (b) shows the laser intensity after adjusting the PCs to mode-lock thesignal to frt. (c) shows the spectrum of the optical field for three different modes ofoperation. Before ML regime (red solid line), ML regime (blue dashed line), ML fixed
to frt (black solid line).
This particular configuration had a stronger tendency to operate in harmonic ML rather
than fundamental ML. In addition, the laser operating in fundamental ML showed clus-
tering of pulses with tens-of-ps separation between them; no single pulse could be made
to circulate in the cavity. Therefore, pulse width measurements were carried out only
for harmonic ML. Measurements yielded values between 57 ps and 53 ps for different
repetition rates and pump powers Pp (see table 4.1). A main issue encountered in this
configuration was the pulse repetition rate dependence on polarization and pump power
Pp. Furthermore, the RF spectrum of the signal showed strong longitudinal mode com-
petition for pulses at fundamental and harmonic ML. Therefore, it was proposed to
include in the cavity a stronger saturable absorber mechanism in order to give more
36 Chapter 4 Mode-locked laser based on frequency-shifted feedback technique
stability to the ML signal. A second configuration was built which included a fiberized
polarizer to enhance a saturable absorption mechanism through non-linear polarization
evolution.
Table 4.1: Pulsewidth measurements for different output powers. Pp: pump power,Pout: output power, fML: ML frequency, ∆λ: laser bandwidth @ 3 dB, τFWHM : pulse
by two laser diodes delivering a total power of ∼ 270 mW @ 1480 nm through a WDM
coupler (1480/1550 nm). A second WDM coupler was spliced to the other end of the
active fiber in order to remove the unabsorbed pump power from the cavity. Two sets of
polarization controllers - PC 1, and PC 2-, were spliced between a fiberized polarization
beam splitter PBS to introduce the necessary phase bias to lock the longitudinal modes
of the ring cavity and to adjust the output coupling in the cavity. PC 1 was formed of
three wave plates (a quarter-wave plate, a half-wave plate, and a quarter-wave plate),
while PC 2 was formed of only two wave plates (a quarter-wave plate, and a half-wave
plate). A 95:5 % coupler was spliced after PC 2 to monitor the intracavity signal. For
this configuration, the frequency-shifting mechanism inside the cavity was carried out
through four different fibre-coupled AOMs from Gooch & Housego, driven by an RF
signal generator. The downshift frequencies of three of the AOMs were fAOM = -80
MHz, -110 MHz, and -200 MHz. The fourth AOM had an upshift frequency of fAOM =
+110 MHz. All AOMs showed similar characteristics except for the -200 MHz AOM,
which had higher insertion loss compared to the rest of the AOMs 2. Two types of
band-pass filter (BPF) were used in the cavity. The first one was the same fiberized
optical tunable filter described in Section 4.3.1, while the second one was a fiber Bragg
grating (FBG) with 0.45 nm bandwidth. Finally, the unidirectionality of the ring cavity
was ensured by splicing a fiberized isolator. The cavity configuration shown in 4.7 (a),
had a total length of ∼ 14.5 m with an average GVD parameter of β2 = -15 ps2/km.
2 The advantage of using the Gooch & Housego AOMs rather than the NEOS AOMs was the possibil-ity to tune the frequency driving signal of the former ones. Therefore, it allowed to study the behaviourof the laser in resonant (fAOM = 1/τrt) and non-resonant regimes (fAOM 6= 1/τrt)
Chapter 4 Mode-locked laser based on frequency-shifted feedback technique 37
Figure 4.7: Schematic of the Er3+-doped fiber ring laser with a frequency shifterspliced to the cavity for (a) a tunable filter with an optical bandwidth of ∆λBPF = 1.3nm, and (b) a FBG with an optical bandwidth of ∆λBPF = 0.45 nm. EDF: Er3+-dopedfiber, PC: polarization controller, PBS: polarization beam splitter, AOM: acousto-optic
modulator.
4.3.2.1 Characterization of the laser cavity
The cavity in Fig. 4.7 was first tested without an AOM. In this configuration, it was
not possible to mode-lock the laser at any pump power level. Therefore, the saturable
absorption effect generated by the nonlinear polarization evolution, and the PBS in
the cavity was not strong enough to generate ML behavior. The output signal for this
configuration was formed of noisy random pulses in time and amplitude. ML of the
cavity was only achieved by adding any of the AOMs described in Section 4.3.2. Self-
starting fundamental ML behaviour was generated easier when the laser operated in a
non-resonant regime rather than in the resonant regime. In addition, the former regime
provided longer stability to the ML signal. Therefore, in all the experiments carried
out, the laser operated in a non-resonant regime. Self-starting ML behavior was always
achieved for high pump power levels Pp ≥ 150 mW. However, at these pump power levels,
the laser output presented clustering of pulses with, tens of ps separation between them,
circulating at the fundamental repetition rate frt = 13.7 MHz of the cavity. See for
example the inset of Fig. 4.9 (a). By decreasing the amount of pump power in the
cavity, the group of pulses was reduced to a single pulse circulating in the cavity (see
Fig. 4.9 (a)). Pulses formed in the cavity keep its shape and width while reducing the
pump power. It is only by adjusting the polarization controllers in the cavity that the
shape and width of the pulses are modified. Furthermore, once the ML regime stops for
Pp ≤ 30 mW, the laser cannot be ML again until the pump power increases above Pp
≥ 150 mW. This behavior is a common feature observed in soliton ML lasers [85, 99],
and it is related to the pump power hysteresis presented in these systems [100].
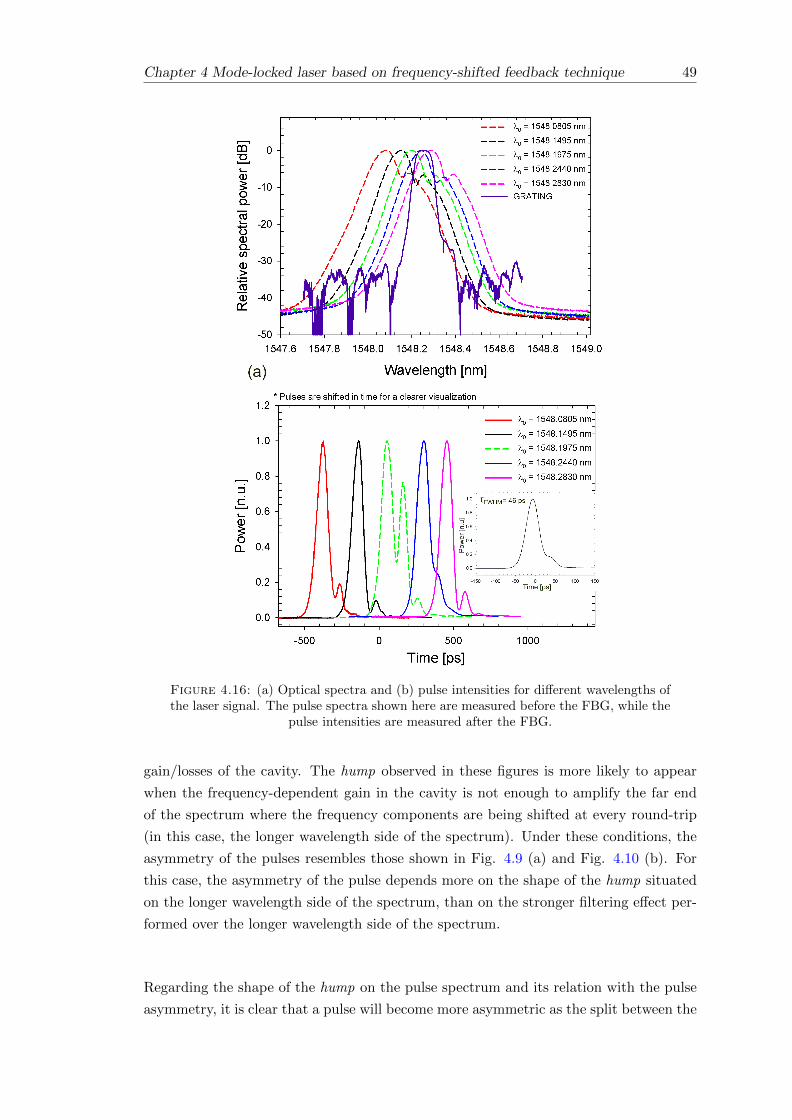
The optical spectrum shape shown in Fig. 4.8 (a) and (b) was characteristic of the ML
regime of the laser cavity. The spectra shown in these figures were obtained for a 110
MHz downshifted and upshifted AOM, respectively. The hump observed on either the
longer (downshifted frequencies) or shorter (upshifted frequencies) wavelength side of the
38 Chapter 4 Mode-locked laser based on frequency-shifted feedback technique
Figure 4.8: (a) Optical spectrum of a FSF laser in ML regime with a 110 MHzdownshifted AOM, and (b) a 100 MHz upshifted AOM. The arrows in the plots representthe direction where the spectral frequencies of the laser are being shifted at every cavity
round-trip.
spectrum is related to the transfer of the spectral energy carried out by the frequency
shifting process of the AOM, to the higher loss region of the spectrum. A more detailed
explanation of the formation of the hump in the spectrum will be described with the
numerical simulations in Chapter 5.
Figure 4.9 (a) and (b) show the time trace and RF spectrum of the output signal for the
cavity configuration shown in Fig. 4.7 (a), respectively. The laser, in this case, operated
with a 110 MHz downshift frequency AOM (fAOM = -100 MHz). The time trace of the
output pulses was measured with the optical channel of a digital communication analyzer
DCA (20 GHz bandwidth), the RF spectrum with a 5 GHz photodetector, and a RF
spectrum analyzer (22 GHz bandwidth). The pulse trace, for this configuration, showed
Chapter 4 Mode-locked laser based on frequency-shifted feedback technique 39
a longer trailing edge compared to the leading edge of the pulses. The inset of Fig. 4.9
(a) shows the compact group of pulses (traveling at the round-trip frequency), that are
formed in the cavity for pump powers Pp ≥ 30 mW. The inset correspond to a pump
power of Pp ∼ 150 mW, while the single pulse per round-trip is obtained at Pp ∼ 30
mW. The pulse width measured at FWHM was τFWHM = 37 ps. It is worth mentioning
that the autocorrelation measurement of the signal did not show any sub-pulse structure
and matched the pulse width measurement of the DCA. The optical spectrum of the ML
signal is shown in Fig.4.8 (a). The pulse spectral bandwidth measured at FWHM was
∆λ = 0.12 nm, and yields a time-bandwidth product (TBP) of 0.57. Fig.4.9 (b) shows
the RF spectrum at the cavity’s fundamental frequency with a resolution bandwidth of
1 kHz.
Figure 4.9: (a) Time trace, and (b) rf spectrum of the output signal of an all-fiberizedFSF laser using an AOM with 110 MHz downshift frequency. The inset in (a) showsthe stable train of pulses gathered in the form of square-shape pulses circulating in the
cavity at the fundamental repetition rate for Ppump ≥ 33 mW.
40 Chapter 4 Mode-locked laser based on frequency-shifted feedback technique
4.3.2.2 Pulse and spectral shape as a function of the output power coupling
ratio
The stability of the laser, in the ML regime, allowed me to study in more detail the de-
pendence of the pulse shape and its optical spectrum for different parameters of the laser
cavity. At this point, it is worth mentioning that all measurements shown in this section
and onwards were carried out with a single pulse circulating in the cavity (Pp ∼ 30 mW).
The pulse shape behavior as a function of the output coupling ratio in the cavity was
first monitored. The coupling ratio was adjusted by finely tuning the quarter-waveplate
of PC 1 located before the fiberized polarization beam splitter (see Fig. 4.7). In addition
to the monitoring of the pulse shapes, the spectral maximum of the pulses and the ratio
between the intracavity and output power of the system were also traced. Fig. 4.10 (a)
and (b), show the shape of three optical spectra and their corresponding time traces.
The optical spectrum was measured with an optical spectrum analyzer OSA with a res-
olution of 0.01 nm, while the time trace signal was measured with the optical channel of
the DCA described in the former section. The experimental results showed that pulse
shapes become more asymmetric as the split between the spectral maximum and the
hump of the spectrum is more prominent. See for example, the differences between the
red and the blue solid traces in Fig. 4.10 (a), and (b). Yet, if we plot the pulse intensity
in logarithmic scale (see inset of Fig. 4.10 (b)), we can see the presence of a long tail on
the trailing edge of every pulse. The difference between the shapes of the optical spectra
shown in Fig. 4.10 (a) is attributed to the polarization dependent losses in the cavity
which change as the coupling ratio is adjusted. Although the pulse asymmetry seen in
the experimental results agrees with previous analytical models [86, 97], I consider that
in our specific case, the pulse asymmetry is not necessarily related with the stronger
filtering condition that the longer wavelength side of the spectrum suffers due to the fre-
quency shifting mechanism [97], but to the hump formation on the pulse spectra. The
latter does not mean that these results disagree with previous models, but as it will be
explained in Chapter 5, the spectral asymmetry observed in these figures is a consequence
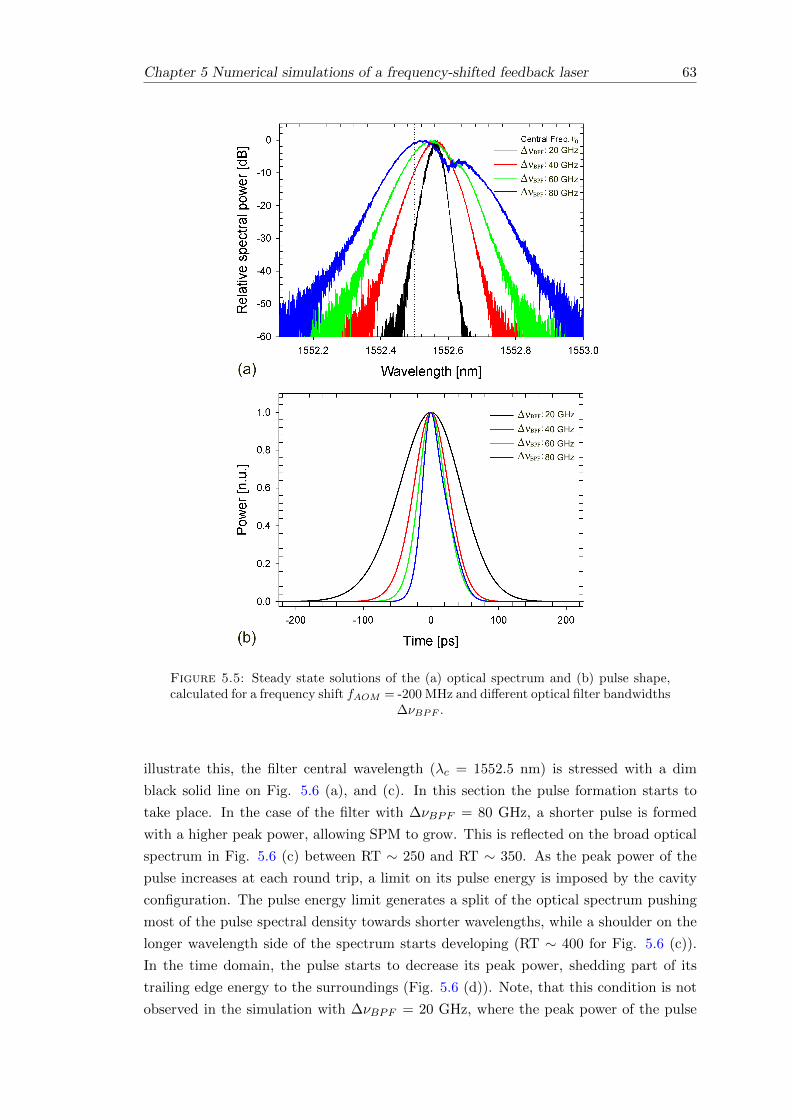
of the broad bandwidth of the intracavity filter and the SPM generated inside the cavity.
Figure 4.11 (a) and (b) show the dependence of the pulse width and spectral maximum
as a function of the output power for two different polarization states of the laser cavity.
It was observed that for specific positions of the PC spools, the laser showed better
ML stability. Therefore, the selection of the two polarization states was determined by
the ML stability of the laser as the output power coupling ratio of the laser cavity was
adjusted. Adjustment of the output power coupling ratio was carried out in the same
way as in the previous experiment (slight tuning of PC 1). Results showed that for both
polarization states, minimum pulse widths were achieved for coupling ratios close to
Chapter 4 Mode-locked laser based on frequency-shifted feedback technique 41
Figure 4.10: (a) Optical spectrum and (b) pulse intensity for different polarizationstates in the cavity. The spectra shown in (a) are plotted relative to the spectralmaximum λ0 of the pulse in order to compare the spectral shape. The inset in (b)
shows the pulse intensity of the same pulses on logarithmic scale.
1. In addition, for both polarization states the pulse width τFWHM and ratio between
the intracavity and output power Pin/Pout, were inversely proportional to the output
power. However, the pulling direction of the spectral maximum was different in each
polarization state. For Fig. 4.11 (a), a shift towards longer wavelength was observed
at higher output powers, while in Fig. 4.11 (b) the spectral shift was in the opposite
direction. This behaviour, I believe, is due to the relative position of the lasing signal
inside the filter bandwidth ∆λBPF . The reader has to bear in mind that the bandwidth
of the laser signal (≤ 0.15 nm) is much narrower than the filter bandwidth ∆λBPF = 1.3
nm. Therefore, different polarization states can place the lasing peak of the laser in a
broad range of places within the filter bandwidth which do not correspond to the exact
central part of the filter. The TBP of the pulses in Fig. 4.11 (a) and (b) did not change
42 Chapter 4 Mode-locked laser based on frequency-shifted feedback technique
significantly for different pulse widths and had values of ∼ 0.60 and ∼ 0.57, respectively.
Figure 4.11: Pulse width FWHM, spectral maximum position and coupling ratioPin/Pout as a function of the output power Pout for two different polarization states inthe cavity. (a) Polarization state (1) and (b) polarization state (2). Pin: Intracavity
power.
4.3.2.3 Pulse width and optical bandwidth as a function of the driving
frequency
In order to study the dependence of the pulse width as a function of the frequency shift,
two more fiberized AOMs with different driving frequencies (fAOM = + 80 MHz and +
200 MHz) were spliced into the cavity shown in Fig. 4.7 (a). The different laser cavities
showed identical behavior as the cavity described in Section 4.3.2.1. In all the cases, self-
starting fundamental ML was achieved at high pump powers, and therefore reduction of
pump power was necessary in order to reduce the number of pulses in the cavity. Fig.
4.12 (a) shows the pulse width and spectral bandwidth of the output signal as a function
Chapter 4 Mode-locked laser based on frequency-shifted feedback technique 43
of the AOM driving frequency. The graphic shows a decrease in the pulse width and a
broadening of the optical bandwidth for higher frequency shifts. Pulse widths of τFWHM
∼ 58 ps with TBP ∼ 0.56, and τFWHM ∼ 35 ps with TBP ∼ 0.63 for the fAOM = -80
MHz and fAOM = -200 MHz AOMs were obtained, respectively. Fig. 4.12 (b) shows
the shape of the optical spectrum measured for the three AOMs. The figure shows that
the hump on the longer wavelength side of the spectra is always present regardless of
the AOM spliced in the cavity. In addition, the distance between the spectral maximum
and the hump grows as the frequency shift mechanism in the cavity increases. Fig. 4.12
(a) also shows the results for a cavity without an intracavity BPF. These results will be
further explained in the next section. Pulse width measurements for these configurations
presented a higher TBP ∼ 0.69 compared to the results obtained with the fiberized BPF.
Figure 4.12: (a) Pulse width FWHM and optical bandwidth as a function of the AOMdriving frequency of a FSF ring laser cavity with and without optical filter. (b) Pulsespectra for three AOMs with different downshifting frequency mechanism (fAOM = −80
MHz, fAOM = −110 MHz, and fAOM = −200 MHz).
44 Chapter 4 Mode-locked laser based on frequency-shifted feedback technique
4.3.2.4 Multi-wavelength regime
The cavity shown in Fig. 4.7 (a) was also tested without a BPF. For all three AOMs, the
laser presented multi-wavelength behavior which was attributed to the partly inhomo-
geneous line broadening of the erbium-doped medium [81]. ML behavior was achieved
at all times for the fundamental repetition rate of the cavity. Fig. 4.13 (a) shows the
optical spectrum obtained with a 200 MHz downshifted frequency AOM spliced in the
cavity. The spectrum corresponds to the ML signal generated by the laser. Although
the optical spectrum shown in Fig. 4.13 (a) presents different lasing peaks the only peak
that is ML is the highest peak with an asymmetric shape. This is clearly seen in Fig.
4.13 (b), where the central peak of the multi-wavelength spectrum is shown. For this
graph, the AOM used had an 80 MHz downshifting mechanism and the pulses gener-
ated in the cavity yield pulse widths of FWHM ∼ 65 ps. The pulse width and optical
bandwidth measurements for these configurations are summarized in Fig. 4.13 (a).
4.3.2.5 Tunable laser
Tunability of the laser signal, over a range of 30 nm, was possible with help of the filter
spliced in the cavity (see Fig. 4.7). Pulse width measurements were carried out for every
5 nm. For this configuration, the AOM used had a driving frequency of fAOM = −110
MHz. Fig. 4.14 shows the pulse width measurements carried out over the entire tuning
range of the laser (1535 - 1565 nm). The scatter data represents the average pulse
width, while the “error bars” show the minimum and maximum pulse width obtained
at a specific wavelength by adjusting the polarization state of the cavity. The inset of
the figure shows a broader view of the tunable laser. It is worth mentioning that the
pulse width behaviour shown in Fig. 4.14 follows the small-signal gain spectral shape
obtained for a ∼ 60% of population excitation of the Er-ions.
4.3.2.6 Frequency-shifted feedback laser with narrow band-pass filter
The dependence of the pulse width and pulse spectra for narrower BPFs was also inves-
tigated. Therefore, the fiberized BPF was replaced by a FBG with a spectral bandwidth
of ∆λBPF = 0.45 nm and reflectivity R = 99%. In order to use the FBG reflection spec-
trum, the laser ring cavity was modified into a sigma cavity configuration with help of a
three port circulator (see Fig. 4.7 (b)). The behavior of the laser signal was studied for
three different AOMs with downshift mechanisms of fAOM = -80 MHz, -110 MHz and
-200 MHz, and its signal was monitored with help of an OSA, and DCA. ML behavior
in all three cases appeared for pump powers Pp ≥ 200 mW. Once the laser was ML, it
was possible to decrease the pump power to Pp ∼ 140 mW. However, below this value,
ML was no longer supported in the cavity. The narrower filter bandwidth of the FBG
allowed for a better monitoring of the relative position of the spectral maximum within
Chapter 4 Mode-locked laser based on frequency-shifted feedback technique 45
Figure 4.13: Optical spectra of a FSF ML fiber laser without an intracavity filterfor (a) 200 MHz downshift AOM and (b) 80 MHz downshift AOM. Upper inset in (b)shows a broader span of the central lasing peak of the signal. Lower inset in (b) shows
the optical pulse generated by the laser.
the filter bandwidth, and therefore provided a better understanding of the effects of the
spectral shifting mechanism in the cavity. Fig. 4.15 (a) shows the FBG reflection spec-
trum (black solid line) together with the pulse spectra of the laser cavity operating in
ML regime for the three different AOMs described previously. The spectra observed for
the downshifts fAOM = -80 MHz and fAOM = -110 MHz differ from the results shown
in the former sections. Here, although the spectral maximum is localized on the shorter
wavelength side (see inset of Fig. 4.15 (a)), there is no clear evidence of a hump forma-
tion on the longer wavelength side of the spectrum. Instead, a single peak in the lasing
spectrum was observed with a slightly higher intensity level on the shorter wavelength
side. The time traces observed on the DCA were also different from the previous results.
Compare for example, the blue dashed trace and the red solid trace on Fig. 4.15 (b)
46 Chapter 4 Mode-locked laser based on frequency-shifted feedback technique
Figure 4.14: Pulse width measurements along the entire tuning range of the FSFlaser. The inset shows the optical spectra of the laser plotted over the same tuning
range.
with the traces on Fig. 4.10 (b). The pulse spectral bandwidths measured at FWHM
were ∆λ = 0.076 nm and ∆λ = 0.102 nm for frequency shifts of fAOM = -80 MHz and
and τFWHM > 34 ps were expected in the time trace. However, pulses τFWHM > 430 ps
were emitted in these configurations (see for example, Fig. 4.15 (b)). An autocorrelator
was not available at the moment these experiments were carried out; hence, it was not
possible to analyze the substructure of the ML pulses observed on the DCA. However,
based on the measurements of the pulse bandwidths and the fact that the laser is oper-
ating at high pump powers, it is assumed that the broad pulse measured with the DCA
is formed by a group of clustered pulses with almost no separation between them.
Although this operation regime is different from the one observed with broader filter
bandwidths,it is possible to link both regimes by looking at the performance of the laser
operating with the fAOM = -200 MHz AOM. In this configuration, the pulse spectrum
formed a main peak with a spectral bandwidth of ∆λ = 0.04 nm and a broad shoulder
on the longer wavelength side 10 dB below the level of the spectral maximum. The
time trace observed on the DCA showed a similar behavior as the results observed for
broader filter bandwidths (see Fig. 4.9 (a)). However, in this configuration the distance
between pulses is much shorter, causing an overlap between the pulses -see for example,
the green dash-dotted line in Fig. 4.15 (b). The individual pulse widths measured at
FWHM were τFWHM ∼ 93 ps, yielding a TBP of ∼ 0.46.
As mentioned in Section 4.3.2.1, the fAOM = -200 MHz AOM presented higher insertion
loss than the rest of the AOMs. Hence, it is possible to consider that the AOM excess
Chapter 4 Mode-locked laser based on frequency-shifted feedback technique 47
Figure 4.15: (a) Optical spectrum and (b) time trace of ML pulses formed in a FSFlaser using AOMs with different frequency shifts. Blue dashed trace: fAOM = -80 MHz,red solid line: fAOM = -110 MHz, and green dash-dotted line: fAOM = -200 MHz. Theblack solid line in (a) shows the reflection spectrum of the band-pass filter of the cavity,while the inset shows a close up of the pulse spectra of the lasers using the -80 MHz
and -110 MHz AOMs
loss, together with the increment in the frequency shift mechanism, imposed a restriction
in the amplification of the spectral components located on the longer wavelength side
of the spectrum. Therefore, the shoulder formed on this side of the pulse spectrum
remained at a lower level with respect to the spectral maximum. This effect is not seen
for the two other AOMs, where it is clear that the longer wavelength side is amplified
almost to the same level as the spectral maximum. This performance can be better
observed in the inset of Fig. 4.15(a). Hence, the formation of the broader pulses observed
for the configurations with the fAOM = -80 MHz and fAOM= -110 MHz AOMs are
a clear consequence of the amplification of the spectral components situated at the
48 Chapter 4 Mode-locked laser based on frequency-shifted feedback technique
longer wavelength side of the spectrum, where the spectral components are constantly
transferred by the AOM.
4.3.3 Optical filtering of the laser spectrum
In order to study in more detail the structure of the pulses formed in Section 4.3.2.1,
the pulse spectrum was spectrally filtered by splicing a fixed high reflective FBG with
∆λBPF = 0.08 nm bandwidth at the output of the FSF laser. An optical circulator
helped to obtain the reflection of the filtered spectrum from the laser output. The
tunable band-pass filter spliced in the cavity allowed to tune the laser signal through
the FBG spectrum. A tuning of ∼ 0.3nm was enough to cover the entire pulse spectrum
and to monitor the behaviour of the pulse in the time domain. The filtered signal had
not enough power to be monitored in the DCA, therefore the filtered spectrum had to
be amplified with an EDFA. Fig. 4.16 (a) shows the pulse spectrum for different lasing
wavelengths (colour dashed lines) before being filtered by the FBG (blue solid line). The
figure helps to visualise the position of the pulse spectrum within the bandwidth of the
FBG. The corresponding time trace for each filtered section of the pulse spectrum is
shown in Fig. 4.16 (b). Pulses are arbitrarily shifted in time in this figure to have a
clearer view of each pulse. Filtered pulses presented at all time a small satellite pulse
at the trailing edge. I believe, this pulse is a result of the 3rd-order spectral phase
and its manifestation is more prominent in these traces due to the EDFA action. The
pulse width of the filtered pulses is τFWHM ∼ 90 ps, and has a TBP of ∼ 0.45; a value
quite close to a transform limited Gaussian pulse. One interesting feature of the spectral
filtering is the one observed for the spectral maximum λ0 = 1548.1975 nm (green dashed
line in Fig. 4.16 (a) and (b)). For this wavelength, the optical filter is centred at the
split between the main peak and the hump of the pulse spectrum. Time traces for
this spectral position show two pulses with different intensities and pulse width slightly
separated from each other. The time trace obtained for this portion of the spectrum
shows its complex spectral phase caused by the interaction of the frequency shifting
mechanism, the pulling effect of the filter bandwidth and the SPM inside the cavity.
4.4 Discussion
The design and implementation of a stable picosecond source with a FSF technique
allowed studying its dynamics in the ML regime and to monitor the behaviour of the
pulse asymmetry in the optical and temporal domain as functions of different cavity pa-
rameters. Based on the numerical simulations presented in Chapter 5; the asymmetric
shape of the spectra shown in Fig. 4.8 (a) and (b), are a consequence of the equilib-
rium reached by the frequency shifting mechanism applied to the optical field in every
round-trip and the shift of the spectral maximum acquired by the frequency-dependent
Chapter 4 Mode-locked laser based on frequency-shifted feedback technique 49
Figure 4.16: (a) Optical spectra and (b) pulse intensities for different wavelengths ofthe laser signal. The pulse spectra shown here are measured before the FBG, while the
pulse intensities are measured after the FBG.
gain/losses of the cavity. The hump observed in these figures is more likely to appear
when the frequency-dependent gain in the cavity is not enough to amplify the far end
of the spectrum where the frequency components are being shifted at every round-trip
(in this case, the longer wavelength side of the spectrum). Under these conditions, the
asymmetry of the pulses resembles those shown in Fig. 4.9 (a) and Fig. 4.10 (b). For
this case, the asymmetry of the pulse depends more on the shape of the hump situated
on the longer wavelength side of the spectrum, than on the stronger filtering effect per-
formed over the longer wavelength side of the spectrum.
Regarding the shape of the hump on the pulse spectrum and its relation with the pulse
asymmetry, it is clear that a pulse will become more asymmetric as the split between the
50 Chapter 4 Mode-locked laser based on frequency-shifted feedback technique
hump and the spectral maximum increases. Adjustments in the polarization state of the
cavity (polarization-dependent losses) modify the shape of the hump, and therefore con-
trol the asymmetry and width of the pulse. Shorter pulses present broader bandwidths
in the central part of the pulse spectrum and on the hump. This same effect is observed
in the numerical simulations presented in Chapter 5 and it is attributed principally to
SPM. Numerical simulations show that shifts of the spectral maximum to the shorter
wavelength side is mainly caused by the broadening of the hump. This means that the
hump pushes the section of the spectrum, where the spectral maximum is localized,
towards the opposite direction of the frequency shifting process. Still, we have to bear
in mind that frequency and polarization-dependent losses in the cavity play a major role
in shifting the spectral maximum. This might explain the different behaviour of the
spectral maximum shift in Fig. 4.11 (a) and (b).
Different behaviour of the optical spectrum and pulse shape was observed for narrower
filter bandwidths. For these configurations the cavity frequency-dependent gain was able
to amplify the far end of the spectrum, avoiding the formation of a hump. Therefore,
broad pulses observed in Fig. 4.15 (b) are a consequence of the excess gain generated
inside the cavity and of the strong filter dispersion applied over the pulse spectrum. In
order to understand why we observe pulses with pulse-width in the range of hundreds-
of-ps, (see Fig. 4.15 (b)) we have to consider two things. Firstly, fundamental ML
was only possible at Pp ≥ 200 mW, which is 50 mW above the pump power required
to mode-lock the laser configurations with broader BPFs. At this high pump power,
cavities with broadband filters always showed groups of clustered pulses separated by a
short distance between them. Therefore, it is likely that the broader pulses are indeed
formed by compact groups of pulses with pulse distances reduced due to the strong
filter dispersion applied over the pulse spectrum. In addition, the pump power Pp =
150 mW at which fundamental ML stops, is still too high to observe a single pulse
circulating in the cavity. Therefore, the broad pulse observed cannot be considered as
a single entity. Regarding the shape of the pulses generated in these configurations, in
Chapter 5 a simple numerical simulation proposes an answer to the shape behaviour of
the broader pulse as a function of the distance between the compact groups of pulses of
which the broader pulse is formed. The results obtained with the 200 MHz downshifted
frequency AOM give further evidence of the effects of the spectrum amplification and
filter bandwidth over the pulse shape. In this configuration, the frequency-dependent
losses of the AOM and cavity do not allow the amplification of the far end of the
spectrum. In this situation, the pulses follow the same behaviour as in the cavities with
broad BPF. However, in this case, the distance between the clustered pulses is shorter,
but still wide enough to avoid a complete pulse overlap. Therefore, it is possible to think
that as the longer wavelength side of the spectrum is amplified and the pulse spectral
maximum pushed in the opposite direction of the frequency shifting mechanism, the
clustered pulses in the group are pulled closer to each other forming what appears in
Chapter 4 Mode-locked laser based on frequency-shifted feedback technique 51
the DCA as a single pulse.
4.5 Conclusions
In this Chapter, a stable tunable Er3+-doped FSF laser delivering picosecond pulses was
proposed and built. The stability of the source allowed a much insightful analysis of
the shape of the pulse spectra and pulse intensity as functions of different parameters
of the laser cavity (filter bandwidth, frequency shift, and coupling ratio), compared to
previous experimental works [8, 53, 86]. Results show that not only broader filter band-
widths and higher frequency shifts lead to shorter pulses (in agreement with [8, 53]), but
also shorter pulses can be achieved by keeping the coupling ratio of the cavity close to
unity. In addition to this, the results presented in this Chapter show a more graphical
and therefore intuitive analysis of the optical pulse shape and its relation with the pulse
intensity that has not been addressed in the literature before. For example, results show
that for broad intracavity filter bandwidths the shape of the spectrum tends to split
and form a hump on the longer (shorter) wavelength side due to the downshift (upshift)
frequency mechanism of the AOM. In this regime, the hump is mainly responsible of the
strong asymmetry on the trailing (leading) edge of the pulse in the time domain. The
fact that the spectrum seems to split in two is due to the frequency dependent losses of
the cavity which do not allow this section of the spectrum to be amplified while the laser
is mode-locked. In contrast, for narrow filter bandwidths results showed that the pulse
spectrum does not split and the side of the spectrum where the spectral components are
constantly shifted can be amplified to a level close to the spectral maximum. Identifica-
tion of these characteristics in the optical spectrum (which have not been addressed in
the literature before) is important because of its inherent relation with the pulse inten-
sity. Therefore, while in the first regime (broadband filters), a clustered train of coherent
optical pulses with a clear separation between them was achieved, in the second regime
(narrowband filters) the separation between pulses was almost canceled forming a single
broad pulse of hundreds of picoseconds. This shows for the first time (in an experiment)
how the filter-induced dispersion and filter-induced losses in a FSF lasers play a fun-
damental role in determining the minimum separation between clustered adjacent pulses.
The results obtained in this Chapter provide novel insights in the behaviour of FSF
lasers and are useful to explain former published results regarding these lasers. Further-
more, these results show the possibility to generate multi-functional stable sources by
choosing the appropriate parameters in the cavity. For example, ML multi-wavelength
sources by means of a Fabry-Perot filter, or use the benefits of the AOM to amplitude
modulate the cavity and generate Q-switched ML laser.
Chapter 5
Numerical simulations of a
frequency-shifted feedback laser
In this Chapter I present numerical simulation studies on pulse formation in an Er3+-
doped frequency-shifted feedback (FSF) fibre ring laser. In particular, I focus on the
development and behaviour of the pulse spectrum and its relation to the pulse shape
in the time domain for different parameters of the laser cavity. The numerical results
shown here are compared with the experimental data of Chapter 4 allowing a better
understanding of the formation and asymmetry of the optical pulses generated in FSF
lasers. In the first part of this Chapter, I give a brief summary of previous theoretical
work and numerical models for FSF lasers. I also describe the numerical model used
for the simulations and the values given to the different parameter of the simulation.
The numerical results are discussed in terms of the asymmetry of the optical spectrum
and pulse shape as functions of the frequency shift and filter bandwidth of the cavity.
The results are also compared to previous analytical models and it is shown that the
numerical model is able to describe properly the behaviour of FSF lasers using broad
filter bandwidths.
5.1 Review of theoretical work for frequency-shifted feed-
back lasers
Theoretical investigations of FSF lasers have used different models to describe the out-
put characteristics of such lasers in their different operating regimes [8, 74, 98, 101–103].
For example, at low pump power, where FSF lasers present broadband cw output, the
rate-equation models of Bonnet et al. [98], and Stellpflug et al.[74], offer a good descrip-
tion of the dynamics. However, as the rate equation model lacked phase information, it
could not describe the mode-locked regime of these lasers. The work of Nakamura et al.
53
54 Chapter 5 Numerical simulations of a frequency-shifted feedback laser
(Moving comb model) [103], and Yatsenko et al. (discrete-frequency model) [102] con-
sidered phase information of the electric field, and were able to show steady-state pulse
formations for specific parameter conditions; still both models did not consider phase
shifts generated by nonlinear elements in the laser cavity. A first approach to analyse
the behaviour of FSF lasers in the mode-locked regime was carried out by Kodama et
al., [101]. In this work the authors compared the behaviour of mode-locked FSF lasers
with that of solitons in sliding-frequency guiding filters for long haul telecommunication
systems [96]. In these papers, pulses were analysed using soliton perturbation theory
yielding analytical solutions for stable pulse formation. Because the analysis was based
on soliton theory, it was relevant for the anomalous dispersion regime. However further
work [8, 86, 97] showed that FSF lasers could operate in both dispersion regimes (normal
and anomalous). The Kerr nonlinearity (SPM) as a key element to the pulse behaviour
in the laser cavity was first studied in detail in [8]. In this work the authors also pre-
sented numerical and experimental results regarding the behaviour of the output signal
of a Nd3+ fibre laser for different parameters of the laser cavity. Pulses generated in FSF
lasers present an asymmetry observed in the optical spectrum, which is a consequence
of the quadratic frequency chirp imposed by the frequency shifter [97] and the filter
dispersion [96] in the cavity. Although this is a well-known characteristic of FSF lasers,
there is little work that has linked experimental results [8, 86, 98] with analytical models
describing the asymmetries observed in the pulse spectrum. In addition, pulse behaviour
observed in the experimental results did not match analytical solutions or asymmetries
observed in previous work. Therefore, it was necessary to implement numerical simu-
lations with the experimental parameters presented in Chapter 4, and corroborate our
results with previous analytical work. In the next section I briefly disccus the model of
Kodama et al. [101] based on soliton perturbation theory and explain why this model
cannot be applied to predict the evolution of the soliton amplitude and frequency. The
results presented in this Chapter are also compared with those of de Sterke et al. [97],
where pulse formation was studied without any reference to cavity dispersion.
5.2 Theoretical analysis of FSF lasers using soliton pertur-
bation theory
A mode-locked all-fiber ring laser with large net anomalous dispersion in its cavity is
more likely to generate soliton type pulses. Optical solitons are formed due to the in-
terplay between the dispersive and nonlinear properties of the laser cavity, and their
interaction is well described by the non-linear Schrodinger equation (NLSE). In a FSF
laser, the effects of frequency shifting, and gain bandwidth can be considered as pertur-
bations to the soliton solution of the NLSE, allowing to obtain an analytical solution for
pulse behavior in FSF lasers.
Pulse propagation in a fibre laser ring cavity with a continous frequency-shifting mech-
Chapter 5 Numerical simulations of a frequency-shifted feedback laser 55
anism, and a bandpass filter, can be described in dimensionless units by the averaged
NLSE [104]:
∂u
∂Z− i
2
∂2u
∂T 2− i |u|2 u − iα T u = δ u + β
∂2 u
∂T 2+ γ |u|2 u. (5.1)
where u(Z, T ) is the average amplitude of a guiding-center soliton normalized to the
soliton amplitude [104, 105], Z is a distance scale normalized to the dispersion length
LD = τ20 / |β2|, T = (t− z/vg) /τ0 is the retarded time frame moving with the pulse at
the group velocity vg normalized to a time unit τ0, α is the frequency shifting rate, δ is
the cavity gain, β is the filter-induced losses, and γ is related to the physical value of
the cavity nonlinear gain. The dimensionless parameters α, β and γ in equation 5.1, are
defined as:
α =(2 π 10−6) fAOM τ30
Lc β2,
β =2
β2 ∆ν2BPF Lc,
γ =γ1 P0 τ
20
β2.
(5.2)
where, fAOM is the net AOM frequency shift(MHz), τ0 is related to the soliton FWHM
pulse width by τ0 = τFWHM/1.763 (ps), Lc is the length of the ring cavity (km), β2 is
the fibre GVD parameter (ps2/km), ∆νBPF is the angular filter bandwidth (2 π THz),
γ1 is the nonlinear gain coefficient( W−1km−1), and P0 is the soliton peak power (W).
The left-hand side of Eq. 5.1 represents the NLSE with a linear potential given by α,
and its solution without considering any perturbation (δ = β = γ = 0) yields the
following soliton equation [101]:
u(Z, T ) = η sech {η[t− ξ(Z)]} exp[iκ(Z)T + iψ(Z)], (5.3)
where ξ = αZ2/2 represents the soliton position, κ = ∂ξ/∂Z is the soliton frequency and
ψ is related with the amplitude and frequency of the soliton by ∂ψ/∂Z = (η2 − κ2)/2.
However, in the presence of small perturbations caused by a bandwidth-limited gain
and nonlinear medium, perturbation theory can be used to analyse the evolution of the
amplitude η and frequency κ of the soliton. The evolution equations for η and κ in the
Z coordinate are given by [106]:
56 Chapter 5 Numerical simulations of a frequency-shifted feedback laser
dη
dZ= 2δ η − 2β η
(η2
3+ κ2
)+
4
3γ η3,
dκ
dZ= α − 4
3β η2 κ.
(5.4)
Analysis of FSF laser with perturbation theory is limited to small values (< 1) of α, β
and γ. The values of these parameters, as shown in Eq. 5.2, are determined mainly by
cavity parameters. Therefore, one should be aware that if the experimental parameters
of the system under investigation yield large values of α, β, or γ, perturbation theory
may no longer be useful to predict the evolution of the soliton in such system. Equation
5.2 shows that smaller values of β can be achieved by increasing the filter bandwidth.
For example, increasing ∆λBPF > 4nm while keeping the other parameters constant,
yields values of β < 1; values which are acceptable for calculations with perturbation
theory. Nevertheless, calculation of the parameter α, using the experimental data for
pulse width τFWHM = 35 ps and AOM frequency shift fAOM = -200 MHz, yields a
value of α ∼ 41. Therefore, for the system under investigation shown in Chapter 4
perturbation theory is not an appropiate tool for analysing the pulse evolution of such
system.
In order to have a better understanding of the dynamics of the laser behaviour, and to
predict more accurately the experimental results obtained in Section 4.3.2; a numerical
model was implemented matching the experimental conditions of the laser cavity. The
numerical model is performed using a co-simulation between Matlab and commercial
software VPI Transmission Maker. The latter is used to generate the optical signal and
to simulate the optical fibre amplifier in the cavity.
5.3 Numerical model
The numerical model is based on independently simulating every element of a FSF
laser cavity like the one shown in Fig. 4.7. Although the numerical model does not
allow to obtain an analytical solution of the steady-state of the laser system, it allows
to track the behavior of the electric field as it passes through every elements in the
cavity. Under specific operation conditions, the numerical model can generate stable
(steady-state) optical pulses circulating at the fundamental repetition rate of the ring
cavity. The parameters of the numerical model correspond to a great extent to the
experimental setup described in Chapter 4. However, at this point, the numerical model
takes into account only a single polarization component traveling in the ring cavity.
Hence, the saturable absorption effect generated by the NLPE is not considered in this
first model. The numerical model starts from an initial arbitrary complex optical field
(e.g. transformed limited sech2 pulse or white noise process). After a cavity round-trip,
Chapter 5 Numerical simulations of a frequency-shifted feedback laser 57
the resulting signal is then used as input for the next cavity-round trip calculation until
the signal reaches a steady-state. VPI Transmission Maker software uses the analytic
signal approximation to represent optical processes. This yield a complex optical field
that is given by:
E(t) =√P (t) · exp(−j2π∆νt) (5.5)
where ∆ν is the offset between the emission frequency and an optical reference frequency
νref (defined by the user), and P (t) is the optical power of the waveform. VPI Trans-
mission Maker software normalizes the optical fields such that their modulus-square
represents optical power P (t) = |E(t)|2.
Figure 5.1: Schematic of the FSF laser elements used for the numerical simulations.
The description of each of the elements in the cavity is as follow: the active fiber is formed
of a piece of 2-m long (LEDF ) Er3+-doped fibre which is described by a stationary model
based on a unidirectional propagation equation for signals and a two-level rate equation
for ion populations. The emission and absorption spectra are specified in terms of the
Giles parameters [107] of the Er3+ fiber used in the experiment shown in Chapter 4.
The model for the Er3+-doped fibre can simulate the effect of Kerr nonlinearity on the
signal propagating throughout the gain fibre. The model takes into account the effect
of self-phase modulation (SPM) according to the following equation:
∂E(z, t)
∂z= iγ |E(z, t)|2E(z, t) (5.6)
where E(z, t) denotes the slowly-varying complex-envelope of the optical field and γ is
the nonlinear coefficient of the fibre at the carrier frequency. γ is calculated as
γ =2πnnlν
cAeff(5.7)
58 Chapter 5 Numerical simulations of a frequency-shifted feedback laser
where nnl is the nonlinear refractive index of the active fibre and Aeff is the effective
core area of the fibre. In addition, the model for the Er3+-doped fibre also accounts for
spontaneous emission. For this specific amplifier model it was assumed that the overlap
integral between the optical mode and inversion ions were independent of the signal
power. In such case, the excitation level is given by [108]:
n2Nt
=
∑kP ∗k (z)αk
hνkζ
1 +∑
kP ∗k (z)(αk+gk)
hνkζ
(5.8)
where n2/Nt is the excited Er3+ inversion level ratio, P ∗k is the total power P ∗k =
P sk + P pk + P+asek + P−asek , including the co-propagating signals, pump and amplified
spontaneous emission (ASE), and the counter propagating ASE at frequency νk, gk and
αk are the fiber wavelength dependence gain and absorption of the Er3+ fiber (Giles
parameters), h is the Planck’s constant and ζ is the saturation factor of the fiber defined
as ζ = πb2eff Nt/τ , where beff is the effective radius of the dopant distribution, τ is
the lifetime of the metastable level, and Nt is the total Er3+ ion concentration. The
spatial evolution of the optical field along the active fiber is described by the following
propagation equations [108]:
u±k∂P p,sk∂z
= [gk + αk]n2NtP p,sk − (αkP
p,sk ) (5.9)
u±k∂P ase±k
∂z= [gk + αk]
n2NtP ase±k − (αkP
ase±k ) +
gkn2P0ASE,k
Nt(5.10)
where P sk is the co-propagating power of the optical pump/signal at frequency νk, Pase±k
is the co-counter propagating power of the amplified spontaneous emission (ASE) cen-
tered around the frequency νk, with bandwidth ∆νk, P0ASE,k = 2hνk∆νk is the noise
power propagating in a given direction, spontaneously emitted at any given point along
the fibre. The total ASE power at a point z along the fibre, given by Eq. 5.10, is the sum
of the ASE power from previous fibre sections and the added local noise power P 0ASE,k.
The ASE power centered at frequency νk is propagated as one signal with an input
power of 0 at z = 0 for co-propagating ASE and another signal with an input power of
0 at z = LEDF for the backward-propagating ASE (LEDF is the length of the active
fibre). Finally, u±k is the constant equal to 1 for forward-propagating waves, and -1 for
backward-propagating waves. The ordinary differential equations (ODEs) shown in Eq.
5.9 and Eq. 5.10 are solved by the commercial software. Although the user manual for
this software does not specify the method used to solve the ODEs, such systems can be
solved numerically with a typical fourth-order Runge-Kutta method [109].
Chapter 5 Numerical simulations of a frequency-shifted feedback laser 59
A segment of SMF-28 fiber follows the gain fiber. Pulse propagation within this segment
is modeled with the nonlinear Schrodinger equation (NLSE) for linearly polarized optical
waves, using the split-step Fourier method described in Chapter 2 of [41]. The NLSE
for the model takes the form [41]:
∂E(z, t)
∂z= −αloss
2E(z, t)− i
2β2∂2E(z, t)
∂t2+
1
6β3∂3E(z, t)
∂t3+ iγ |E(z, t)|2E(z, t) (5.11)
where E(z, t) denotes the slowly-varying complex-envelope of the optical field, β2 is
the group-velocity dispersion (GVD) coefficient, β3 is the GVD slope, αloss is the fiber
loss, and γ is the nonlinear parameter of the fiber at the carrier frequency νref . The
pulse amplitude is reduced by a 5% after the fiber section in order to account for
the optical coupler (95:05) spliced in the experimental setup. The frequency shift in-
duced by the AOM (fAOM ) is modeled by shifting each of the frequency components of
the optical signal by “n” times the space between two adjacent frequency components
νstep = νk − νk−1 = 19.53125 MHz. Finally, the optical filter is modeled by a bandpass
Gaussian filter centered at νc and with bandwidth ∆νBPF measured at FWHM. The
Gaussian filter is modeled in the frequency domain as an analog filter with the transfer
function H(2πνk) = e−ln√2|2νk|2 and a zero phase response.
The following parameters were considered for the simulations in order to match the
experimental conditions in Chapter 4: LEDF = 2 m, Er3+ fiber Giles parameters (αk
and gk) are taken from the specifications of a commercial Fibercore I-25 fiber with peak
absorption of α1530 = 37.2 dB/m at 1530 nm, NA of 0.24, cut-off wavelength λoff = 946
nm, and mode field diameter (MFD) of 5.6 µm. The calculated saturation factor was
ζ = 2.6x10¹⁶ (ms)−1 assuming a value of Nt = 3.776x1025 ions/m3, and τLT = 10 ms.
Calculation of Nt considered an Er3+ dopant radius equal to the fiber core radius. The
pump signal wavelength was λp = 1480 nm and its power Pp was optimized to give a
small-signal gain of G ∼ 22 dB. This parameter was later on modified in order to obtain
a single pulse circulating inside the cavity. The parameters for the fiber are: Lsmf =
distributed white noise source- were used for a given set of cavity parameters. The
model converged to the same “steady-state” (stationary) solution for both initial condi-
tions for a specific range of cavity parameters. Fig. 5.2 shows the spectral bandwidth of
the optical signal plotted as a function of the pulse width after each cavity round-trip,
for a frequency shift fAOM = -10νstep ∼ −200 MHz and a filter bandwidth ∆νBPF =
80 GHz. The letter C on the graphic indicates the convergence zone for the two initial
conditions. Traces shown in Fig. 5.2 provides an image of the chirping behavior of the
pulse as it evolves into a steady-state solution. For example, the solid blue line shows
the evolution of a time-bandwidth limited sech2 pulse with initial duration of τFWHM
= 25 ps, while the red dashed line shows the evolution of a Gaussian-distribute noise
source as initial condition.
Figure 5.2: Numerical results of the spectral bandwidth as a function of the pulsewidth. Data is measured at each round-trip at the output of the 95:05 coupler (see Fig.5.1). Two initial conditions are plotted: 1) Time-bandwidth limited sech2 pulse (solid
blue trace), and 2) Gaussian-distributed noise source (red dashed trace).
5.4.2 Pulse behavior for different cavity parameters
Numerical simulations were carried out to monitor the behavior of the pulse width and
optical spectrum as a function of three different parameters of the laser cavity (frequency
shift fAOM , optical filter bandwidth ∆νBPF , and output coupling ratio Pin/Pout, where
Chapter 5 Numerical simulations of a frequency-shifted feedback laser 61
Pin is the intracavity power and Pout the laser output power). Fig. 5.3(a) shows the
results for the pulse width FWHM and optical bandwidth at 3 dB as functions of the filter
bandwidth ∆νBPF for different values of AOM frequency shifts fAOM . These results are
compared with the experimental data obtained in Chapter 4 (see the star symbols on
the same figure). Numerical results obtained with the numerical model agree with the
behaviour shown with perturbation theory and with former work [8, 101]. Furthermore,
pulse shortening was also obtained for output coupling ratios close to 1. For example,
for an optical filter bandwidth ∆νBPF = 80 GHz, and frequency shift fAOM ∼ -200
MHz, pulse widths of τFWHM = 40 ps and τFWHM = 37.5 ps were obtained for coupling
ratios of Pin/Pout = 19, and Pin/Pout = 1, respectively (see Fig. 5.4). These results
agree as well with the experimental results obtained in Chapter 4, see for example Fig.
4.11.
Figure 5.3: Numerical (circles) and experimental (stars) results of the pulse widthτFWHM and pulse bandwidth ∆λ as functions of the optical filter bandwidth ∆λBPF
for different frequency shifts fAOM . ED stands for experimental data.
Pulse asymmetry and optical spectra were also monitored as functions of the frequency
shift fAOM and filter bandwidth ∆νBPF . Fig. 5.5 (a) and (b) show the “steady-state”
solutions of the pulse spectrum and pulse trace in the time domain, for different filter
bandwidths ∆νBPF and a AOM frequency shift of fAOM = -200 MHz, respectively.
Numerical results showed an increment in the asymmetry of the optical spectrum and
in the pulse shape for broader filter bandwidths. However, as it can be seen in Fig.
5.5, pulse asymmetry follows two trends for different filter bandwidth. The first one is
observed for filter bandwidths below ∆νBPF < 40 GHz. Here, the spectral maximum
moves away from the filter central frequency νc and the pulse trace in the time domain
shows a slightly steeper decay time on the trailing edge compared to the leading edge.
See for example the solid black traces in Fig. 5.5 (a) and (b). For filter bandwidths above
∆νBPF > 40 GHz, the tendency in the position of the pulse spectral maximum reverses.
This change is largely generated by the development of a hump on the longer wavelength
side of the spectrum, which pushes the spectral maximum to shorter wavelengths. In
62 Chapter 5 Numerical simulations of a frequency-shifted feedback laser
Figure 5.4: Pulse width (left axis), spectral maximum position (right axis), and powerratio between the intracavity power and the output power (offset left axis) as a function
of the normalized output power.
the time domain, the hump formation is reflected on the longer decay time of the trailing
edge of the pulse (see solid blue traces on Fig. 5.5 (a) and (b)). The numerical results
for this operating regime agree well with the experimental data obtained in Chapter 4
for broad filter bandwidths.
The same performance regarding the position of the spectral maximum was observed in
the numerical simulations of Sabert, et al., [8]. The authors explained this behavior in
terms of the increasing contribution of SPM to the pulse spectrum. However in their
work (and in any other work regarding ML-FSF lasers), there is no mention regarding
the strong asymmetry observed on the pulse spectrum for broad filter bandwidths and
its effect on the pulse shape. Therefore, in order to have a better understanding of
the dynamics of the laser, the evolution of the optical spectrum and pulse intensity at
each round-trip (RT) of the simulated laser cavity was tracked. For these calculations, a
Gaussian-distributed white noise process as initial condition to simulate the spontaneous
emission was used. Fig. 5.6 (a), and (c) show the intensity contour (in dB) of the pulse
spectra at each round-trip for a filter bandwidth of ∆νBPF = 20 GHz, and ∆νBPF = 80
GHz, respectively, while Fig. 5.6 (b), and (d), show the evolution of the pulse intensity
in normalized units for filter bandwidths, ∆νBPF = 20 GHz, and ∆νBPF = 80 GHz,
respectively. Fig. 5.6 (a), and (c) show a rather systematic evolution of the optical
spectrum that can be divided in two sections. The first one encompasses the shifting
of most of the spectral density towards the longer wavelength side of the filter. This
can be observed within the first round-trips RT ≤ 100 and RT ≤ 200 for Fig. 5.6 (a)
and (c), respectively; while in the time domain, there is no evidence of pulse formation
yet. A second section can be defined at the point where the spectral components reach a
maximum deviation from the filter central wavelength and the optical spectrum becomes
broad enough to pull the spectral maximum closer to the filter central wavelength. To
Chapter 5 Numerical simulations of a frequency-shifted feedback laser 63
Figure 5.5: Steady state solutions of the (a) optical spectrum and (b) pulse shape,calculated for a frequency shift fAOM = -200 MHz and different optical filter bandwidths
∆νBPF .
illustrate this, the filter central wavelength (λc = 1552.5 nm) is stressed with a dim
black solid line on Fig. 5.6 (a), and (c). In this section the pulse formation starts to
take place. In the case of the filter with ∆νBPF = 80 GHz, a shorter pulse is formed
with a higher peak power, allowing SPM to grow. This is reflected on the broad optical
spectrum in Fig. 5.6 (c) between RT ∼ 250 and RT ∼ 350. As the peak power of the
pulse increases at each round trip, a limit on its pulse energy is imposed by the cavity
configuration. The pulse energy limit generates a split of the optical spectrum pushing
most of the pulse spectral density towards shorter wavelengths, while a shoulder on the
longer wavelength side of the spectrum starts developing (RT ∼ 400 for Fig. 5.6 (c)).
In the time domain, the pulse starts to decrease its peak power, shedding part of its
trailing edge energy to the surroundings (Fig. 5.6 (d)). Note, that this condition is not
observed in the simulation with ∆νBPF = 20 GHz, where the peak power of the pulse
64 Chapter 5 Numerical simulations of a frequency-shifted feedback laser
Figure 5.6: Evolution of the optical spectrum (left figures) and pulse (right figures)width for two different filter bandwidth ∆νBPF = 20 GHz (upper figures) and ∆νBPF
= 80 GHz (bottom figures). The scale for the optical spectrum intensity is normalizedin dBs to maximum at each roundtrip, while the intensity of the pulse in the time
domain is normalized in a linear scale.
grows uniformly, until it reaches a steady state. Therefore, the pulling effect towards
the central wavelength of the filter bandwidth is cause, in addition to the broadening of
the spectrum, by the formation of the hump on the longer wavelength side of the pulse
spectrum. In the time domain, the pulse shows a longer decay time on its trailing edge.
This asymmetry is different from the one formed in the simulation for ∆νBPF = 20 GHz,
where the steady-state pulse presents a slightly steeper trailing edge. The positions of
the spectral maximum once the simulations reached a steady state were νmax ∼ 7.8 GHz
and νmax ∼ 4.2 GHz, for Fig. 5.6 (a) and Fig. 5.6 (c), respectively.
Results of pulse asymmetry as a function of the AOM frequency shift parameter are
shown in Fig. 5.7. Results show that pulse asymmetry is not only dependent on the
optical bandwidth, but rather on the ratio between the optical filter bandwidth and the
AOM frequency shift. Fig. 5.7 (a) shows the “steady-state” spectra for three different
Chapter 5 Numerical simulations of a frequency-shifted feedback laser 65
AOM frequency shifts (fAOM = −110,−200, and− 400 MHz) while keeping the optical
filter bandwidth constant. A significant asymmetry is observed for fAOM = −110 MHz,
and it decreases as the AOM frequency shift increases. Results also show that in this
case, the pulse spectral maximum locates further away from the filter central frequency
νref for larger frequency shift. The former results can be explained in terms of the pulse
energy Ep obtained for each simulation. For the case of fAOM = −110 MHz, the pulse
energy is higher than in the other two cases fAOM = −200, and − 400 MHz. This is
due to the fact that the spectral maximum is located closer to νref , and therefore the
spectral components see more gain. This situation creates a pulse evolution similar to
the one observed in Fig. 5.6 (c). However, as the pulse spectral maximum shifts away
from the central part of the filter, the filter gain reduces and therefore the pulse gain.
A decrease of pulse energy prevents the optical spectrum from breaking and forming
a hump on the longer wavelength side. Therefore, reduction of pulse asymmetry will
depend on the ratio between the optical filter bandwidth and the AOM frequency shift
and the optical filter gain.
In [97], the asymmetry of the pulses is described in terms of pulse chirping as a conse-
quence of the interaction between the nonlinearity of the medium, the frequency shift of
the AOM, and the filter bandwidth. For example, if a constant downshifting frequency
mechanism is applied to the optical spectrum, it is expected that the longer wavelength
side of the spectrum is strongly filtered compared to the shorter wavelength side; in ad-
dition, SPM will contribute to increase or decrease the frequency shifting process of the
signal. Therefore, according to [97], a pulse will show a steeper leading/trailing edge if
the spectral components located in it are filtered more strongly than the opposite edge
of the pulse. The numerical results obtained show that this description is correct as
long as the SPM generated in the cavity is not predominant. Fig. 5.8(a) and (b) show
the asymmetric intensities (solid lines) and phases (dashed lines) for two steady-state
pulses simulated with a filter bandwidth of ∆νBPF = 20 GHz and ∆νBPF = 80 GHz,
respectively. Fig. 5.8 (a) shows a steeper trailing edge and almost a linear phase across
the pulse width, while in Fig. 5.8 (b) the steeper edge is formed on the leading edge of
the pulse and the optical phase becomes non-linear. This increment in the non-linearity
of the phase will be reflected in a stronger asymmetry of the pulse.
5.5 Conclusions
In this Chapter, I presented numerical simulation studies on the behavior of the optical
spectrum and pulse shape as functions of different parameters of the laser cavity (fre-
quency shift and optical bandwidth). The numerical model simulated an Er-doped FSF
fiber laser in a ring cavity configuration including the following elements: gain medium,
nonlinear element, bandpass filter and a frequency shifter. Results showed that for
specific parameters of the laser cavity, stable pulses circulating at the fundamental rep-
66 Chapter 5 Numerical simulations of a frequency-shifted feedback laser
Figure 5.7: Steady state solutions of the (a) optical spectrum and (b) pulse shape,calculated for a optical filter bandwidth ∆νBPF = 60 GHz and different AOM frequencyshifts: fAOM = −110MHz (solid red line), fAOM = −200MHz (solid gren line), and
fAOM = −400 MHz (solid blue line).
etition rate of the cavity could be formed. Numerical results shown in this Chapter are
in agreement with previous work [8, 97, 101], where it was shown that shorter pulse
widths are achieved either by increasing the bandwidth of the optical filter or increasing
the frequency shift in the laser cavity. The novelty of the results shown in this Chap-
ter compared to previous work is that the numerical model can properly simulate the
output spectral shape of a FSF laser for a broad range of optical filter bandwidths and
frequency shifts. Previous work had only focused on analyzing analytically [101] and
numerically [8, 97] the pulse evolution in FSF lasers with narrow optical bandwidths
and small frequency shifts where soliton perturbation theory can be used. That being
said the results shown here offer a better graphical study of the pulse spectral evolution
in a FSF laser, particularly for the relation between the filter bandwidth and frequency
Chapter 5 Numerical simulations of a frequency-shifted feedback laser 67
Figure 5.8: Intensity (solid line) and phase (dashed line) of steady state solutions fortwo filter bandwidths: (a) ∆νBPF = 20 GHz and (b) ∆νBPF = 80 GHz.
shift parameters. It is shown for the first time that as the ratio between the filter
bandwidth and the frequency shift increases, the asymmetry of the pulse spectra also
increases. The strong asymmetry is attributed to the increment in SPM leading to a
split of the main pulse spectrum. This split is seen as a hump on the wavelength side
of the spectrum where the pulse spectral components are being constantly shifted by
the frequency shifter mechanism in the cavity. In the time domain, pulse asymmetry is
strongly related to the hump formation on the pulse spectrum. For this particular case,
these novel results show a clearer picture of the evolution of the optical spectrum from
cw noise towards pulse formation in a FSF laser, allowing me to identify the reasons for
the shifting of the spectral maximum of the pulse towards the opposite direction of the
frequency shift mechanism. The numerical results shown in this Chapter, in addition
to the experimental results shown in Chapter 4, can help to understand better a few of
the complex interactions effects happening in these lasers that were not clarified in the
literature so far.
Chapter 6
Mode-locked lasers based on a
semiconductor saturable absorber
mirror
In this Chapter I present the characterization of three mode-locked fibre lasers based
on a semiconductor saturable absorber mirror (SESAM), operating at 1.5 µm. The
simple, compact and stable design of the cavity allowed me, by simply changing the in-
tracavity filter, to generate either femtosecond or wavelength-tunable picosecond pulses.
Results obtained with these lasers are compared with the ones shown in Chapter 3 for
a mode-locked FSF laser. The laser cavities presented in this chapter show a better
performance in terms of self-start operation and reduction of amplitude and timing jit-
ter noise compared to the FSF laser. Furthermore, the laser cavity proposed here show
reliable self-starting continuous-wave (cw) mode-locking operation with no Q-switching
instabilities 1. The stability of the source allowed me to use it as a seed source for the
master optical power amplifier (MOPA) system described in Chapter 7.
6.1 Introduction
Since their first mention in the literature in 1992 [110], SESAMs have become essential
intracavity components for passive mode-locked (ML) lasers. One of the reasons for their
commercial grow relies on the fact that their optical properties can be engineered over a
broad range, thus allowing their use in wider cavity laser designs [57]. In particular, for
fibre lasers, SESAMs offer several advantages such as, repeatability of self-starting ML,
1In a cw mode-locking laser, the resonator modes are excited with constant power. Therefore, pulsesemitted in this operating regime have constant pulse energy. This is not the case for Q-switched mode-locking lasers where the intra-cavity pulse energy experiences strong fluctuations, related to a dynamicinstability [44, 58]
69
70 Chapter 6 Mode-locked lasers based on a semiconductor saturable absorber mirror
enhancement in the stability for cw mode locking [58], and implementation in relative
simple and compact cavity designs [50, 59–62].
Nowadays advances in semiconductor grow technology and bandgap engineering have
extended the common GaAs-based technology used at 800 nm to wavelengths in the
near infrared region [59, 111–113]. In particular, for wavelengths around 1.5 µm InP-
based [59, 114], and GaAs-based diluted nitride [115, 116] SESAMs are commonly used;
the latter ones presenting lower nonsaturable losses due to the lower lattice mismatch
between the absorber (GaInNAs) and GaAs substrates.
Previous work in the 1.5 µm wavelength region has demonstrated compact and self-
starting picosecond and femtosecond sources using various saturable absorbers, and
cavity configurations. For example, in [59] self-starting transform-limited 320 fs pulses
with 40 pJ energy were obtained in a linear cavity with an InGaAsP saturable absorber,
while in [50], self-starting picosecond pulses with 2.3-nJ/pulse energy were generated
by introducing a saturable absorber, and a linear loss element in the cavity to avoid
multiple-pulse formation at high pump powers. As pointed out in Chapter 2, stretched-
pulse ML fibre lasers are attractive configurations for superior pulse-energy extraction
compared to soliton ML lasers. In these cavities, where pulse shaping by soliton for-
mation in not presented, it is always desirable to carry out pulse shaping through a
fast saturable absorber. Nevertheless, a fast saturable absorber presents problems for
self-starting from a continuous-wave. In this case, slow saturable absorbers show better
self-starting behaviour, with the inconvenience that pulses can develop a trailing wing
due to their slow recovery response [117]. In [62] a stretched-pulse ML fibre laser was
proposed combining a slow and a fast SESAM in the cavity. While the former provided
a self-starting ML mechanism, the latter preserved the pulse shaping. Picosecond pulses
with 250-pJ/pulse energy without multiple-pulse breakup at high pump powers were
generated with this configuration. SESAMs have also been used for pulse shaping in
fibre lasers with fundamental repetition rates above 2 GHz [118]. In this work, the high
gain per unit length was provided by a 4.8-cm piece of commercial co-doped Er3+/Yb3+
fibre pumped with a semiconductor laser at 975 nm. Short pulses and reliable self-
starting cw ML was achieved by means of a commercial saturable absorber mirror with
a resonant design and relatively high modulation depth.
In this chapter, a sigma cavity laser including a polarization beam splitter, to enhance
NLPE, and a commercial SESAM is proposed and characterized. The laser cavity was
later on modified in order to study the pulse duration limits and to achieve a robust
self-start operation and low noise laser. The similarity in the design of this laser with
the FSF laser, described in Section 4.3.2, allowed me to compare the overall performance
(e.g. self-starting operation, stability, amplitude and timing jitter) of both lasers.
Chapter 6 Mode-locked lasers based on a semiconductor saturable absorber mirror 71
6.2 SESAM characteristics
In Section 6.1 it was mentioned that SESAM parameters can be selected depending
on a particular laser configuration. Therefore, choosing the correct SESAM design is
foremost to achieve a good laser performance and to avoid Q-switching instabilities (the
latter being a common issue for long upper-state lifetime lasers) [58]. Usually, when
soliton-pulse shaping is not present in the laser cavity (i.e. stretched-pulse laser cavi-
ties), a SESAM with high modulation depth ∆R is desirable to enhance the mechanism
of pulse narrowing and to provide enough perturbation for self-starting ML behaviour.
Yet, a high modulation depth leads to an increment of the non-saturable losses Ans
which eventually can lead to Q-switching instabilities [117]. Therefore, a SESAM with
low modulation depth is also desirable to suppress Q-switching behaviour and enhance
cw ML stability.
In addition to the correct selection of SESAM parameters for a good laser performance,
different groups have carried out investigations to determine a stability criterion against
Q-switching behaviour in passively ML lasers [117, 119]. According to Honninger et al.
[119], if the absorber recovery time is much shorter than the cavity round-trip time, then
the minimum intracavity pulse energy to achieve stable cw ML is given by [119]:
EP,c = [Fsat,L Aeff,L Fsat,A Aeff,A ∆R]1/2 (6.1)
Where Fsat,L = hν/ [2 (σem + σabs)] is the gain saturation fluence, hν is the lasing
photon energy, σem and σabs are the emission and absorption cross-section of the lasing
wavelength, Fsat,A is the SESAM saturation fluence, Aeff,L and Aeff,A are the effective
laser mode areas of the gain medium and on the SESAM, respectively.
From Eq. 6.1 it can be seen that the effective laser mode area on the SESAM is propor-
tional to the critical intracavity pulse energy, therefore, a way to improve the stability
of cw ML can be done by adjusting the effective laser mode area on the SESAM. Tak-
ing into account the above information, it was decided to buy a SESAM from BATOP
Optoelectronics [120] with a resonant design, average modulation depth ∆R = 14%
and a relaxation time constant τsam = 2 ps. A summary of the characteristics of the
SESAM is shown in Table 6.1, and the graphics for the spectral reflectance, dispersion,
and saturation fluence are shown in Appendix B. The SESAM was centre mounted on a
gold plated cylinder and fixed to a translation stage. This mounted scheme allowed me
72 Chapter 6 Mode-locked lasers based on a semiconductor saturable absorber mirror
to adjust the laser effective mode area on the SESAM (e.g. to adjust the pulse energy
incident on the semiconductor).
6.3 Experimental Results
The proposed configuration for the ML laser with a SESAM is similar to the one pro-
posed in Chapter 4 for the FSF laser. However, in this case, a sigma configuration had
to be implemented in order to use the reflected signal from the saturable absorber. It
was found that the output of the laser had a tendency to lase in Q-switching ML regime
or in a noisy harmonic ML regime when the SESAM was placed close to the gain fibre
(i.e. before the polarization beam splitter). These operating regimes were observed for
different pump powers and combinations of lenses used to adjust the effective laser mode
area on the SESAM. The cavity in Fig. 6.1 (a) showed the most stable configuration
for a self-starting cw ML signal. The position of the SESAM for the configurations
involving optical filters (i.e. the position of the SESAM before or after the optical filter)
did not make a difference in the laser performance. Therefore, in order to have a better
comparison with the FSF laser configuration described in Chapter 4, it was decided to
place the SESAM before the optical filters, as shown in Fig. 6.1 (b) and (c). In this con-
figuration, the self-starting behaviour was carried out by the SESAM while the NLPE
acted as an additional pulse shaper.
The setup for the femtosecond ML laser is shown in Fig. 6.1 (a). The laser cavity consists
of the same optical devices described in Section 4.3.2. However, for this configuration,
a 3 port circulator was spliced into the cavity after the 95:5% coupler. The fibre end
of port 2 of the circulator was angle cleaved and the light coming out of this port was
launched onto the SESAM (described in Section 6.2), through a pair of aspheric lenses.
The pair of aspheric lenses helped to adjust the incident pulse fluence by varying the
illuminated area on the SESAM. I found that the laser presented a better performance
Chapter 6 Mode-locked lasers based on a semiconductor saturable absorber mirror 73
by focusing the light beam more tightly onto the saturable absorber. This action was
achieved by combining a lens of effective focal length EFL = 18.40 mm (Thorlabs C280
TME-C) closer to the fibre and a lens of EFL = 15.29 mm (Thorlabs C260 TME-C)
closer to the SESAM. Finally, to close the cavity, the port 3 of the circulator was spliced
to the signal port of the 1480/1550 WDM. The total cavity length was ∼ 11 m, and had
an average GVD parameter β2 = -0.2 ps2.
Figure 6.1: Schematic of the mode-locked fibre sigma laser with a semiconductorsaturable absorber. The configuration was tested without an (a) optical filter, witha (b) tunable filter with ∆λBPF = 1.3 nm and (c) bandwidth-variable tunable filter.EDF, Er-doped fiber; PC, polarization controller; PBS, polarization beam splitter; P1,
port 1; P2, port 2.
6.3.1 Femtosecond laser performance
The laser was characterized in the time domain with a background-free (noncollinear)
second harmonic generation autocorrelator, and in the frequency domain by an optical
and RF spectrum analyzer. The laser presented stable self-starting fundamental ML
behaviour for pump powers as low as Ppump ∼ 37 mW. ML operation remained stable in
the cavity up to Ppump ∼ 48 mW. Above this power level, the laser output presented noisy
multiple-pulse behaviour, which is characteristic of soliton systems with excessive gain
[121]. For Ppump ∼ 43 mW, the output signal monitored at P1 generated femtosecond
pulses with 105-pJ pulse energy and average output power Pout = 1.9 mW. Fig. 6.2 (a)
and (b) show the measured output pulse autocorrelation and pulse spectrum from P1 and
P2, respectively. The measured pulse width at FWHM from P1 was ∼ 310 fs (assuming
a sech2 profile), while the 3 dB spectral bandwidth was ∼ 9.72 nm centred at 1556 nm.
The corresponding time-bandwidth product (TBP) was calculated to be ∼ 0.372. The
peak power Ppeak calculated with the 310 fs pulse was ∼ 298 W. Formation of Kelly
sidebands on the optical spectrum are related to the soliton-like nature of the pulses
generated in the laser cavity [122]. Fig. 6.2 (c) shows the RF spectrum at the cavity
fundamental frequency (18.3 MHz) with a span of 1 MHz and a resolution bandwidth
74 Chapter 6 Mode-locked lasers based on a semiconductor saturable absorber mirror
of 100 kHz. The low broad band noise observed on the RF spectrum highlights the low
amplitude fluctuations (∆E/E ∼ 0.091%) of the laser cavity. Appendix A explains the
method for characterizing the laser noise.
Figure 6.2: (a) Autocorrelation measurement of port P1, (b) optical spectra of portP1 and port P2, and (c) RF spectrum of the output signal in port P1, for a cavity with
net GVD parameter β2 = - 0.19 ps2.
In soliton ML lasers pulse duration can be controlled by adjusting the dispersion in the
cavity. This condition is given by the soliton area theorem which relates the product of
the pulse width and its energy to the average GVD dispersion and nonlinearity of the
cavity (see Section 3.2.1) [121]. Considering this, the laser cavity was further character-
ized as a function of the cavity dispersion β2 by reducing the length of the single mode
fibre (SMF-28) in the cavity. Fig. 6.3 (a) shows the pulse width (circles) and TBPs
(triangles) as a function of the cavity dispersion. Pulse widths of ∼ 244 fs (assuming
a sech2 pulse shape) with TBP ∼ 0.526 were obtained for a β2 = -0.0799 ps2. Further
reduction of the cavity dispersion was limited by the amount of fibre used in the two
manual polarization controllers and the length of fibre (∼ 10 cm) required to splice the
different cavity components. Fig. 6.3 (b) shows the measured pulse spectrum at port
P1 (blue trace) and port P2 (red trace) for a cavity dispersion β2 = -0.0799 ps2. Exper-
imental results show a shortening in the pulse width and an increment in the TBP of
the pulses as β2 is reduced in the cavity. Reduction of the anomalous dispersion in the
Chapter 6 Mode-locked lasers based on a semiconductor saturable absorber mirror 75
cavity is reflected in the dynamics of the pulse circulating in the cavity, where the spec-
tral shapes between port P1 and port P2 become less similar. See for comparison Fig.
6.2 (b) and Fig. 6.3 (b). Spectral side bands (Kelly bands) amplitudes were weakened
substantially for β2 ≤ -0.1.
Figure 6.3: (a) Pulse width measured at FWHM and TBPs as a function of theaverage cavity dispersion β2 . (b) pulse spectrum from port P1 (blue trace) and P2
(red trace) for a β2 = -0.078.
6.3.2 Wavelength-tunable picosecond fibre laser
Tunability of the laser source was achieved by insertion of a bandpass filter with 1.3
nm bandwidth measured at FWHM. The tuning range of the fibre laser was limited by
the fiberized filter to ∼ 30 nm. Self-starting fundamental ML behaviour was achieved
for pump powers as low as Ppump ∼ 23 mW. The robust stability of the laser allowed
it to remain ML through the whole tuning range of the filter. Addition of the filter
in the cavity broadened the pulse width to ∼ 11 ps. Pulse width adjustment was also
possible by slightly tuning the position of the polarization controllers PC1 and PC2
in the cavity. For this experiment, pulse width measurements were carried out with a
commercial frequency resolved optical gating (FROG) system from Southern Photonics
76 Chapter 6 Mode-locked lasers based on a semiconductor saturable absorber mirror
(model: HR150 Optical Pulse Analyser). The temporal and optical resolution of the
system is 26.66 fs, and ≤ 0.05 nm, respectively. Fig. 6.4 (a) shows the recovered
spectrogram of the laser signal at 1552 nm for a specific polarization state (PS1) in
the cavity. The polarization states PS1 and PS2, shown in Fig. 6.4, define the shortest
and broadest stable pulses achieved, respectively. Further adjustment of the polarization
controllers beyond these points led to an unstable signal. Fig. 6.4 (b) shows the retrieved
intensity (solid line) and phase (dashed line) as a function of time, for the polarization
states PS1 and PS2, while Fig. 6.4 (c) shows the retrieved pulse spectra for the same
polarization states. For PS1 the calculated pulse width and optical bandwidth was ∼9.46 ps and ∼ 0.47 nm, respectively; while for PS2 the same parameters were ∼ 11.55
ps, and ∼ 0.35 nm. Retrieval of the pulse phase showed that both pulses are linearly
up-chirped (i.e. the leading edge of the pulse is red-shifted while the trailing edge is
blue-shifted), with calculated TBPs of 0.56 and 0.50, for PS1 and PS2, respectively.
Figure 6.4: (a) Measured FROG trace of the polarization state PS1. Retrieved in-tensity (solid) and phase (dashed) as a function of time for two polarization states inthe cavity: PS1 (red) and PS2 (blue). (c) Retrieved spectrum for PS1 (red) and PS2
(blue).
Figure 6.5 (a) shows the pulse width measurements over the entire tuning range of the
laser (1535 - 1565 nm). The scatter data on Fig. 6.5 (a) represents the average pulse
width, while the “error bars” show the minimum and maximum pulse width obtained
by adjusting the polarization state in the cavity. The laser emitted pulse trains with an
average pulse width of ∼ 11 ps over most of the tuning range, with a slight increment
Chapter 6 Mode-locked lasers based on a semiconductor saturable absorber mirror 77
in the pulse duration for wavelengths shorter than 1538 nm.
As mentioned above, self-starting fundamental ML behaviour was achieved for pump
power thresholds as low as 23 mW for wavelengths longer than 1553 nm. However, for
shorter wavelengths this threshold increased to ∼ 30 mW. Fig. 6.5 (b) shows the mea-
sured average output power and calculated peak power over the entire tuning range of
the laser. Inclusion of the optical filter reduced the average output power to ∼ 1 mW for
wavelengths shorter than 1553 nm. For longer wavelengths (λ0 ≥ 1553 nm), the pump
power in the cavity was decreased in order to sustain a stable cw ML signal. Reduction
of pump power and adjustments of the position of the polarization controllers decreased
the average output power to ∼ 0.4 mW. The calculated peak power changed from 5.5
W at 1530 nm to 8.6 W at 1550 nm. For longer wavelengths, it decreased to ∼ 2.5 W.
Figure 6.5: (a) Pulse width measurements along the entire tuning range of the opticalfilter. Inset shows the optical spectra of the laser plotted over the same tuning range.(b) Output power (circles) and peak power (triangles) as a function of wavelength. Thecoloured zone represents the wavelength region where the pump power is adjusted in
order to keep ML in the laser.
The laser was further characterized by measuring the amplitude noise and timing jitter
with the Von der Linde method [9] described in Appendix A. Fig. 6.6 (a) and (b) show
the broadband and narrowband RF spectrum of the ML laser centred at the cavity
round-trip frequency (13.28 MHz), respectively. The calculated amplitude fluctuations
of the laser was small (∆E/E ∼ 0.47 %). Therefore, it was possible to ignore it for
estimating the time jitter [9]. The calculated contribution of time jitter of the pulses
was ∼ 6.09 ps, measured at the 10th harmonic narrow band spectrum of the RF signal
(see inset of Fig. 6.6 (a)).
6.3.3 Wavelength- and bandwidth-tunable picosecond fibre laser
To test whether the laser cavity had the same performance for a different type of filter,
I replaced the 1.3 nm bandwidth filter for a wavelength- and bandwidth-tunable filter
78 Chapter 6 Mode-locked lasers based on a semiconductor saturable absorber mirror
Figure 6.6: (a) RF spectrum of the picosecond fibre laser centered at the cavity roundtrip frequency. (b) High-resolution version of (a), showing the low amplitude noise ofthe laser. Insets show the same information described in (a) and (b), but for for thetenth harmonic, respectively. The information in the tenth harmonic is used to calculate
the timing jitter.
from Alnair Labs (see Fig. 6.1(c)). The laser has a tuning range of 80 nm (1530
nm - 1610 nm) and a tuning bandwidth at 3 dB from 0.1 nm to 13 nm with filter-
edge roll-off (∼ 200 dB/nm). The laser was firstly characterized by tuning the filter
bandwidth (7 nm ≥ ∆λBPF ≤ 1.3 nm) while keeping the filter wavelength fixed at 1550
nm. Starting from the broadest bandwidth (∆λBPF = 7 nm), the laser showed stable
self-starting fundamental ML operation (frt = 12.87 MHz) at 30 mW of pump power
and it remained locked as the bandwidth of the filter was narrowed. Fig. 6.7 (a) and (b)
shows the recovered spectrogram (upper figures) and the retrieved pulse intensity and
phase (lower figures) for a filter bandwidth (∆λBPF = 7 nm) and (∆λBPF = 1.3 nm),
respectively. For ∆λBPF = 7 nm the calculated pulses duration was ∼ 2.76 ps with a
TBP ∼ 0.64, while for ∆λBPF = 1.3 nm the calculated pulse duration was ∼ 11.3 ps
with a TBP ∼ 0.62. The sinc shaped pulses observed on the retrival pulse intensity
are believed to be formed by the band limited rectangular spectrum of the optical filter.
Chapter 6 Mode-locked lasers based on a semiconductor saturable absorber mirror 79
Finally, retrieval of the pulse phase showed that the pulses were also linearly-up chirped.
Figure 6.7: Measured FROG trace (UPPER figures) and retrieved intensity (solid)and phase (dashed) as a function of time (LOWER figures) for an optical filter band-width (a) and (c) ∆λBPF = 7 nm, and (b) and (d) ∆λBPF = 1.3 nm. INSETS: Optical
spectrum of the measured pulse.
A summary of the average output power (triangles) and peak power (circles) measured
at different lasing wavelengths and bandwidths are shown in Fig. 6.8 (a) and (b),
respectively. In general, average output powers of ∼ 0.4 mW were measured for different
filter bandwidths and through the entire tuning range of the fibre laser. The calculated
peak powers for different filter bandwidths yielded values from 11.5 W for ∆λBPF =
7 nm to 2.3 W for ∆λBPF = 1.3 nm. It is worth mentioning that shorter pulses with
durations of ∼ 1.3 ps were also achieved for the maximum filter bandwidth (∆λBPF
= 13 nm). However, for this filter bandwidth continuous wavelength tuning was not
possible.
Table 6.2 shows a summary with the specifications of each source described in this
Chapter. For comparison purposes, the table also shows the specifications of the FSF
laser (@ 110 MHz) described in Chapter 4.
80 Chapter 6 Mode-locked lasers based on a semiconductor saturable absorber mirror
Figure 6.8: (a) Output power (triangles) and peak power (circles) measurements alongthe entire tuning range of the optical filter with filter bandwidth ∆λBPF = 7 nm. Insetshows the optical spectra of the laser plotted over the same tuning range. (b) Output
power (triangles) and peak power (circles) as a function of pulse width.
6.4 Conclusions
In conclusion, I presented three compact and stable ML Er3+-doped fibre laser operating
in the 1.5 µm region. Self-starting ML behaviour in all three cavities is achieved by
enhancing NLPE and by incorporation of a commercial SESAM. The proposed sigma
cavity configuration works in a fundamental ML regime with and without optical filter
for pump powers as low as ≤ 23 mW. The laser can deliver (without an optical filter)
femtosecond pulses ( ≤ 380 ps) with a maximum average output power of ∼ 1.9 mW,
at repetition rates of ∼ 13 MHz (Ep ∼ 105 pJ). Incorporation of an optical filter in the
cavity, allows for picosecond pulse (≤ 12 ps) generation with maximum average powers
of Ppump ∼ 1 mW, at repetition rates of ∼ 13 MHz, corresponding to pulse energies ≤102 pJ. The robust ML stability of the laser cavity allows a continuous wavelength (1533
nm to 1558 nm) and bandwidth (7 nm to 1.3 nm) tuning, making the laser a versatile
tool for different applications (seeding of Erbium amplifiers or highly non-linear fibres,
second harmonic generation, medical applications, etc).
Comparison between the lasers presented in this Chapter and the FSF laser described
in Chapter 4 shows a better performance in terms of noise (e.g. see table 6.2), and
stability for the former ones. ML lasers with SESAM showed to be more resilient to
environmental fluctuations (e.g. vibrations or changes in temperature), although both
kind of laser could remain ML for hours. Another advantage observed with the lasers
using SESAM is the lack of hysteresis presented in FSF lasers to achieve self-starting
fundamental ML behaviour (i.e. there is no need to pump at high powers to start the
ML mechanism in the cavity).
Chapter 6 Mode-locked lasers based on a semiconductor saturable absorber mirror 81
Table6.2:
Las
erp
aram
eter
sfo
rd
iffer
ent
con
figu
rati
on
sofcw
ML
fib
rela
sers
.*P
ower
scali
ng
ofF
SF
Lfo
rms
new
pu
lses
wit
hth
esa
me
chara
cter
isti
csof
the
fund
amen
tal
pu
lse.
Th
ese
new
pu
lses
trav
elin
com
pact
gro
up
scl
ose
toea
choth
erat
the
fun
dam
enta
lro
un
d-t
rip
freq
uen
cy.
Lase
rP
uls
ew
idth
Wavele
ngth
PR
RPout
Pu
lse
en
erg
yA
mp
litu
de
nois
eT
ime
jitt
er
Pow
er
con
figu
rati
on
(ps)
(nm
)(M
Hz)
(mW
)(p
J)
∆E/E
∆τ/Trt
Scali
ng
SE
SA
M24
4-
386
fs15
56n
m13
MH
z1.9
mW
105
pJ
∼0.0
91
%—
—N
O
Fem
tose
con
d
SE
SA
M2.
7-
11.3
ps
1535
-15
58n
m12.8
7M
Hz
0.4
mW
∼40
pJ
——
——
NO
Aln
air
filt
er
SE
SA
M∼
10.5
ps
1535
-15
60n
m13.2
8M
Hz
0.4
-1
mW
40
-102
pJ
∼0.4
7%
∼6.0
9p
sN
O
Sante
cfi
lter
FS
FL
(110
MH
z)
∼39
ps
1533
-156
5n
m13.7
MH
z∼
1m
W72
pJ
∼1.3
3%
∼20
ps
YE
S*
Sante
cfi
lter
Chapter 7
Amplification of a picosecond
bandwidth-tunable laser source
In this Chapter I describe the implementation and characterization of two master os-
cillator power amplifiers MOPAs used in the direct amplification of the 10 picosecond
bandwidth-tunable laser source described in Section 6.3.2. Two large mode area (LMA)
fibres were tested for the high power amplifier stage and their performance was com-
pared in terms of efficiency and beam quality. The first tested fibre was an in-house
fabricated double-cladding Er3+/Yb3+ co-doped LMA fibre (LF122) with core diameter
of 27 µm, while the second one was a commercial double-cladding Er3+-doped LMA
fibre (Er-HPA) with core diameter of 35 µm. The maximum extracted average and
peak power for each fibre was 1.01 W and 5.7 kW for the LF122 fibre, and 1.5 W and
11 kW for the Er-HPA fibre at a wavelength of 1535 nm and 1558 nm, respectively. In
this chapter I proposed in order to compensate for the low cladding absorption at 980
nm of the Er-HPA a hybrid configuration where a high power commercial Raman laser
is used to core-pumped the amplifier in a co-propagating scheme and a 980 nm laser
diode in cladding-pumped in counter-propagation. The results show that the Er3+ fibre
managed to handle higher average powers while keeping a good pulse shape.
7.1 Introduction
Mode-locked (ML) fibre lasers are feasible compact light sources that can emit pulses
in the femtosecond and picosecond regime. However due to high nonlinearities expe-
rienced in the oscillator, pulse peak powers and pulse energies are limited to ∼ 1 kW
[42] and ∼ 1 nJ [2], respectively. Yet, some applications such as material processing,
frequency conversion, supercontinuum generation, or spectroscopy require higher peak
powers or pulse energies. Therefore, pulses from these oscillators must be amplified.
Fibre amplifiers have demonstrated great potential in power scalability reaching aver-
83
84 Chapter 7 Amplification of a picosecond bandwidth-tunable laser source
age powers in the kW regime and peak powers in the GW regime for cw [10, 27, 28]
and pulse mode operation [123–125], respectively. In addition, the geometry of the ac-
tive waveguide offers on the one hand good heat-dissipation, high single pass gain, high
beam quality, and compactness [2]. However, on the other hand it also brings unwanted
nonlinear effects such as SPM, stimulated Raman scattering (SRS) and/or stimulated
Brillouin scattering (SBS). In particular, for ultrashort pulse amplification, SPM im-
poses most of the limitations for pulse amplification. As explained in Chapter 2, SPM
gives rise to an intensity-dependent phase shift that leads to spectral broadening of the
pulses. Although small shifts in the pulse phase do not affect its shape, excessive spec-
tral broadening degrades the pulse quality and limits its utility for different applications.
Eq. 2.13, in Chapter 2, shows that the nonlinear phase shift φNL can be reduced either
by decreasing the fibre length L or the pulse peak power P0, or by increasing the fibre
effective area Aeff . Hence, current research in high power amplifiers has focused in
designing novel amplifier configurations [126, 127], and fibres with large effective mode
areas [17, 128–131] in order to achieve higher pulse energies and peak powers.
The most common system for pulse amplification is the so called master oscillator power
amplifier (MOPA). Generally, systems using MOPA configurations require a chain of
stages, each one with specific characteristics to avoid pulse shape degradation while
amplifying the pulse energy. In addition, depending on the pulse duration regime, and
pulse central wavelength, additional external pulse amplification techniques are used to
avoid the onset of pulse breaking. For example, in the femtosecond regime fibre-based
chirped pulse amplification (CPA) can amplify pulses above hundreds of µJ [125], [124],
while with the parabolic pulse amplification technique more moderate pulse energies,
but still in the µJ regime, can be obtained [127, 132]. For picosecond pulses, it is more
useful to do direct amplification of pulses with MOPAs using LMA fibres. This tech-
nique allows for pulse amplification with relatively high peak powers (∼ kW), and small
pulse energies (∼ nJ), which can be useful in applications like nonlinear microscopy
[133], supercontinuum generation [134], or frequency conversion [132].
For applications which require to work in the so called eye-safe wavelengths around 1.5
µm, Er3+-doped and Er3+/Yb3+ co-doped fibres offer a way for pulse amplification in
this region. Nevertheless, one of the drawbacks of Er3+-doped fibres, for high power am-
plification, is that the efficiency drops at high Er3+ concentrations due to pair-induced
quenching [36, 37]. Therefore, for high power amplifiers it is common to use Er3+/Yb3+
co-doped fibres, where the light absorbed by the Yb3+ ions is transferred to the Er3+
ions. On the one hand, this co-doping technique gives the advantage of broadening the
absorption band of the fibre in the 910 to 980 nm region, which is of great importance
for cladding-pump fibre amplifier configurations. However, on the other hand, control of
the fibre refractive index profile (RIP) during the fabrication process is more challeng-
Chapter 7 Amplification of a picosecond bandwidth-tunable laser source 85
ing than in Er3+. Such difficulties arise from the addition of phosphorus to the MCVD
fibre fabrication process to enhance the energy transfer of Yb3+ to Er3+. Phosphorus
presents a highly volatile behaviour during the collapse phase of the MCVD process,
reducing its presence in the fibre core. This reduction of phosphorus causes a change
in the refractive index, which is commonly observed as a central dip in the fibre core.
See, for example, Fig. 7.2 which shows the RIP of an in-house fabricated Er3+/Yb3+
co-doped fibre (LF122) used in one of the experiments presented in this Chapter. A
main consequence of this central dip in the refractive index is that it limits the forma-
tion of diffracted-limited beams with LMA fibres. Furthermore, Er3+/Yb3+ co-doped
fibres can decrease their efficiency at high pump power, due to spurious emissions in
the Yb3+-band and to excessive thermal load due to the quantum defect [15, 16]. Fab-
rication of Er3+ fibres does not present such difficulties. Therefore, step index profiles
are possible to fabricate with these fibres, allowing diffraction-limited beams even with
very large mode area (VLMA) fibres [17]. However, as mentioned above, due to the
low pump absorption, it is necessary to increase the fibre length to compensate for the
low cladding absorption. For pulse amplification such increment in the fibre length is
detrimental because it reduce the onset of nonlinearities. On way to compensate for the
low cladding absorption is to core-pump the active fibre. In this regard, the develop-
ment of Raman lasers at 1480 nm with output powers up to 10 W delivered in single
mode fibres [18], have facilitated to core-pump LMA Er3+ fibres, hence reducing the
problem of large quantum defect and thermal loading observed in Er3+/Yb3+ co-doped
fibres [2], and allowing shorter lengths of fibre to reduce nonlinearities. Still, one of the
main challenges for pulse amplification at 1.5 µm relies on the anomalous dispersion of
LMA fibres. Therefore, direct pulse amplification at high gains does not follow an adi-
abatic amplification, causing a pulse break-up and limiting the attainable peak-power
[135, 136]. In the 1.5 µm wavelength region, different groups have focused in overcoming
these limitations by designing VLMA (Aeff ≥ 1000µm2) fibres with diffraction-limited
operation with record peak power of ∼ 127 kW and pulse energies of ∼ 56 nJ.
In this chapter, I examine the direct amplification of picosecond pulses covering a wave-
length range from 1535 nm to 1560 nm, with an in-house fabricated Er3+/Yb3+ co-doped
LMA fibre (LF122) and a commercial Yb3+ free Er3+-doped LMA fibre (Er-HPA). The
chapter also reports on the techniques used to reduce nonlinearities, suppression of higher
order modes, and improving the amplifiers efficiencies. Although the configurations pre-
sented here have on the last amplification stage a free-space launching scheme for the
980 nm multi-mode diode laser, this type of amplifiers can be turned into compact
alignment-free systems which can deliver high peak power and relatively low average
power for realisation of efficient harmonic generation or supercontinuum generation.
86 Chapter 7 Amplification of a picosecond bandwidth-tunable laser source
7.2 Picosecond MOPA set-up
In order to have a better comparison of the pulse amplification at different wavelength,
it was necessary to keep the oscillator signal, described in Section 6.3.2, as stable as pos-
sible. This means that the output signal seeded to the amplification stages should keep
approximately the same properties in terms of output power and spectral bandwidth
over the entire wavelength tuning-range. Changes in the output signal of the oscillator
are due to the uneven gain profile of the active medium for a specific pump power.
Hence, to keep a reasonably similar output signal, slight adjustments in the polarization
state of the cavity and pump power were carried out on the oscillator while amplifying
the pulses at different wavelengths.
Figure 7.1: Schematic for the high power fibre MOPA with a (a) LMA Er3+/Yb3+-doped fibre and (b) LMA Er3+-doped fibre. DM: dichroic mirror.
Pulse amplification of the tunable-picosecond source is carried out firstly with a pre-
amplifier and then with a main power fibre amplifier. Fig. 7.1 (a) and (b) show the
schematics of the Er3+/Yb3+ co-doped fibre, and Er3+-doped fibre MOPA configura-
tions, respectively. The pre-amplifier comprises a core-pumped Er3+-doped fibre with
a length LEDF = 1.3 m, and a mode field diameter MFD = 6 µm. In this stage the
Chapter 7 Amplification of a picosecond bandwidth-tunable laser source 87
oscillator signal is amplified by ∼ 16 dB for most of the entire tuning range. First exper-
iments with longer lengths of fibre showed substantial broadening of the pulse spectrum
due to SPM. Therefore, cutback measurements were carried out in order to reduce the
increment in the nonlinear phase of the pulse. The output signal of the pre-amplifier is
then seeded to the main power amplifier through a fiberized isolator and a polarization
controller. A 95:5% tap coupler spliced before the polarization controller, helped to
monitor the average power and pulse shape. The average power at the output of the
pre-amplifier was measured to be ∼ 31 mW and the pulse peak power was calculated to
be ∼ 198 W, assuming a sech2-shape pulse with pulse width of 12 ps. For these values,
the calculated nonlinear length LNL was ∼ 4 m. Therefore, the total fibre length of the
passive devices spliced between the pre-amplifier and the main power amplifier is kept
short (< 1 m).
Two different LMA fibres were tested for the main power amplifier: an in-house fab-
ricated double-cladding Er3+/Yb3+ co-doped fibre, and a commercial double-cladding
Er3+-doped fibre. The signal seeded to both amplifiers is launched through a tapered
fibre section to avoid exciting high order modes and allow single-mode operation. Both
MOPAs were cladding-pumped in counter-propagation through coupling optics using
a 976 nm diode laser from Apollo Instruments (model F10-976-1). In addition to
the cladding-pumping scheme, the Er3+-doped fibre amplifier is core-pumped in co-
propagation through a 1480/1550 nm WDM coupler. The pump signal is generated by
a commercial Raman laser from IPG Photonics emitting a maximum output power of
1 W at 1480nm. The hybrid configuration scheme allows to compensate for the low
cladding absorption at 980 nm of the Er3+-doped fibre amplifier. Therefore, shorter
fibre lengths are possible, reducing the onset of nonlinearities in the fibre.
Figure 7.2: Refractive index profile of the in-house fabricated Er3+/Yb3+ co-dopedfibre with identification number F402- LF122. Image obtained from [3].
88 Chapter 7 Amplification of a picosecond bandwidth-tunable laser source
7.2.1 Power scaling with a large core Er/Yb co-doped fibre
The first pulse amplification tests were carried out with an in-home fabricated Er3+/Yb3+
co-doped fibre, previously used in experiments for nanosecond pulse amplification by Dr.
Codemard [3]. The advantage of using this fibre, apart from its LMA characteristics and
high pump cladding absorption, was that one of its ends was already tapered and spliced
to a standard single mode fibre (smf-28), facilitating its inclusion into the amplification
system.
Figure 7.3: (a) Output power variation of the laser over the entire tuning range fordifferent pump powers, and (b) Output power as a function of launched pump power
for three different wavelengths.
7.2.1.1 Large core Er/Yb co-doped fibre characteristics
Figure 7.2 shows the fibre RIP of the Er3+/Yb3+ co-doped fibre used in the MOPA
system. The central dip observed in the refractive index facilitates the formation of
ring-shaped modes (including the fundamental mode), hence imposing limitations to
obtain diffraction-limited beams. The fibre has a core and inner-cladding diameter of 27
µm and 180 µm, respectively. The shape of the inner-cladding is D-shaped and has an
NA of 0.2. It has a cladding absorption of ∼ 25.7 dB/m at 976 nm and core absorption
of ∼ 5.7 dB/m at 1535 nm. The length of the fibre is 2.5 m and its core area is calculated
to be ∼ 572 µm2.
7.2.1.2 Amplification results
Output pulses are characterized with a thermal power meter, optical spectrum analyser,
and non-collinear background free SHG autocorrelator. Fig. 7.3 (a) shows the output
power of the MOPA as a function of wavelength. For the maximum launched pump
power of 5.12 W, the maximum extracted power was 1.03 W at 1535 nm, and decreased
to 564 mW at 1560 nm. The signal power (power without ASE) is calculated by inte-
grating in linear scale the optical spectrum of the amplifier (see for example the solid
Chapter 7 Amplification of a picosecond bandwidth-tunable laser source 89
Figure 7.4: Normalized optical spectra at different stages of amplification for twodifferent lasing wavelengths (a) 1535 nm and (b) 1550 nm. The spectra of the inputsignal and first amplification stage are measured with a resolution of 0.01 nm, while
the spectrum of the second amplification stage have a resolution of 0.1 nm.
blue trace in Fig. 7.4 (a) or (b)) within a narrow wavelength band which only contains
the lasing peak of the spectrum. This value is then divided by the total output power
of the laser obtained by integrating in linear scale the whole optical spectrum. The
resulting factor is then multiplied by the output power of the MOPA that was measured
with the thermal power meter. This procedure is followed for each wavelength shown
in Fig. 7.3 (a). Fig. 7.3 (b) shows the nonlinear behaviour of the output power as a
function of the launched pump power. Above 4.5 W of launched pump power, slope effi-
ciencies of ∼ 36 % and ∼ 26 % are achieved at 1535 nm and 1560 nm, respectively. The
nonlinear behaviour of the laser output power observed in Fig. 7.3 (b) is a consequence
of the pump lasing peak shifting towards the 976 nm absorption peak of the Er3+/Yb3+
co-doped fibre.
Figure 7.4 (a) and (b) show the evolution of the optical spectrum through the two
amplification stages for a lasing wavelength of 1535 nm and 1550 nm, respectively. The
spectrum of the core-pumped amplification stage shows an excitation level of ∼ 65% for
the EDFA. For this excitation level it is possible to achieve the same gain for different
wavelengths within the entire tuning-range of the laser while keeping a signal to ASE
extinction ratio > 30 dB. For 2.5 m of fibre the main MOPA presents two dominant
ASE peaks: one at 1535 nm and the other at 1542 nm. Higher gain saturation of the
signal at shorter wavelengths reduces the ASE extinction ratio to ∼ 30 dB at 1535 nm,
compared to the ratio of ∼ 27.5 dB at 1550 nm. An increment in the fibre length can
generate more gain at longer wavelengths due to Er3+ re-absoprtion [16]. However, this
will reduce the onset of nonlinearities and limit the pulse peak power.
Adjustments in the polarization controller of the ML laser modify the pulse width be-
tween 11.5 ps and 8.7 ps. Fig. 7.5 (a) and (b) shows the autocorrelation measurement
before (red trace) and after (blue trace) amplification for the largest and shortest pulse
90 Chapter 7 Amplification of a picosecond bandwidth-tunable laser source
Figure 7.5: Autocorrelation measurement for a pulse width of (a) 11.5 ps and (b) 8.5ps. Insets: spectra measured before (red trace) and after (blue trace) amplification.
generated in the oscillator, respectively. The inset shows the corresponding pulse spec-
tra. For an input pulse width τFWHM ∼ 11.5 ps, the pulse shortens by approximately 4
% after amplification. However, if the input pulse is τFWHM ∼ 8.7 ps, the pulse suffers
temporal compression after amplification. This behaviour is observed in the autocorre-
lation measurement where the pulse width decreases to ∼ 6.9 ps, and the pulse energy is
spread to the pulse wings forming a pedestal at the bottom of the autocorrelation trace.
The pedestal indicates the onset of pulse break-up [38]. For the largest pulse width and
maximum output power, a pulse energy Ep ∼ 74 nJ was calculated assuming a sech2
pulse shape and a peak power of Pp ∼ 5.7 kW.
The beam quality factor (M2) of the laser is characterized with a scanning-slit beam-
profiler (model: NS-PYRO 9/5) from Photon Inc, see Fig. 7.6. For a maximum output
power Pout = 1.03 W at 1535 nm the laser has an M2x ∼ 2.0 and M2
y ∼ 1.8. The difference
in the M2 factors, for the two orthogonal directions to the beam axis, shows that the
Chapter 7 Amplification of a picosecond bandwidth-tunable laser source 91
Figure 7.6: Beam quality measurement at the output of the LMA Er3+/Yb3+ co-doped fibre for a maximum output power Pout = 1.03 W at 1535 nm.
laser beam is not circularly symmetric.
7.2.2 Power scaling with a large core Er-doped fibre
The availability of a commercial 1 W single mode Raman laser operating at 1480 nm 1,
allowed me to replace the Er3+/Yb3+ co-doped fibre with a LMA Yb3+-free Er3+-doped
fibre in the main MOPA configuration. The advantage of this fibre relied on its larger
core size, which helps minimizing the pulse spectral broadening while increasing the
pulse peak power. In addition, the more uniform index profile of this fibre compared to
that of the Er3+/Yb3+ co-doped fibre can provide better beam quality. Nevertheless, as
explained in Section 7.1, the low cladding absorption of LMA Er3+-doped fibres cannot
generate enough gain for short lengths of fibre. Thus, the Raman laser was useful for
core-pumping the fibre, allowing enough gain for pulse amplification while keeping the
fibre length relatively short.
7.2.2.1 Large core Er-doped fibre characteristics
The LMA Er3+-doped fibre is a commercial fibre from CorActive (model: HPA Er-35-0).
The fibre has a core and cladding diameter of 33 µm and 135 µm, respectively. The
NA of the inner cladding is 0.37. It has a cladding absorption of 0.5-1.5 dB/m and 3-5
dB/m at 980 nm and 1530 nm, respectively. Figure 7.7 shows the fibre RIP measured
with a refractive index profiler from Photon Kinetics. The RIP of this fibre compared
1 The commercial Raman laser from IPG Photonics was borrowed from Dr. Trevor Newson’s labo-ratory, who kindly agreed to lend me the device for a couple of weeks to carry out these experiments.
92 Chapter 7 Amplification of a picosecond bandwidth-tunable laser source
Figure 7.7: Refractive index profile of the CorActive LMA Er3+-doped fibre withproduct identification number HPA Er-35-0.
to that one of Fig. 7.2 (Er3+/Yb3+ co-doped fibre), do not present a central deep.
Nevertheless, it shows a core asymmetry which can deteriorate the beam quality of the
laser. The V -number of the fibre is calculated to be ∼ 6.3 at 1550 nm, considering a
core NA value of 0.09. A rough estimate of the number of modes Nmodes propagating in
the fibre core yielded a value of ∼ 20. As in the previous section, a tapering technique
was used to reduce the number of modes in the fibre. Tapering of one of the fibre ends
was carried out with a commercial glass processing platform from Vytram technologies
(model GPX-3000). The core radius rcore of the LMA fibre was tapered to reach a final
core radius rfinal ∼ 6.37 µm needed for single mode operation.
Figure 7.8: Laser output spectrum for different fibre lengths.
The pump (1480 nm) and signal wavelengths are launched into the tapered end of the
LMA Er3+-doped fibre through a standard single mode fibre (see picture in Fig. 7.1
Chapter 7 Amplification of a picosecond bandwidth-tunable laser source 93
(b)). The splice loss between the single mode and Er3+-doped fibre was measured to
be ∼ 0.3 dB. The other fibre end is cladding-pumped with the multimode diode laser,
described in the previous section, through coupling optics. The fibre was angle cleaved
to avoid any back reflection and 85% of coupling efficiency was achieved for a pair of
aspheric lenses with NA = 0.5 and effective focal length efl = 8 mm. The temperature
of the laser diode was also adjusted from 27 ◦C to 22 C ◦. The temperature adjustment
modified the maximum output power delivered by the laser diode and shifted the lasing
peak to shorter wavelengths. In this regards, the laser diode output power increased by
∼ 20% and delivered a maximum output power of 7.77 W.
7.2.2.2 Amplification results
Based on the cladding absorption parameters of the fibre at 980 nm, it was decided to
have at least 7 metres of fibre to allow a cladding-pump absorption ≥ 10 dB. Nonetheless,
based on experimental results the fibre core absorption limited the length of the fibre.
Fig. 7.8 shows the output spectrum of the MOPA system while core-pumping the LMA
fibre with a single mode laser diode operating at 1480 nm and with a seeding signal
formed by the output pulses of the pre-amplifier described in Section 7.2. Measurements
taken while cutting back the fibre showed that for 4 metres of fibre length (solid blue
trace), the input signal is not completely absorbed by the active ions of the fibre core.
Although a higher signal to ASE ratio is achieved for a fibre length of 3 metres, shorter
fibre lengths also mean a reduction of the fibre absorption, therefore it was decided to
work with a fibre length close to 4 metres in order to maximize the cladding absorption.
Figure 7.9: (a) Output power as a function of launched pump power for three differentwavelengths, and (b) Total output power (blue dots) and calculated signal power (red
triangles) over the entire tuning range.
The MOPA was seeded with 8.4 ps pulses with repetition rate of 13 MHz and average
power of ∼ 33 mW. A maximum of 1 W and 6.6 W was core and cladding-pumped into
the LMA fibre, respectively. For LEDF = 3.7 m, the 1 W core-pumped light launched
into the fibre does not generate enough gain to amplify the seed signal. A maximum
94 Chapter 7 Amplification of a picosecond bandwidth-tunable laser source
average output power of ∼ 20 mW is measured while core-pumping the amplifier with
the maximum pump power (1 W) of the Raman laser. Fig. 7.9 (a) shows the amplifier
average output power as a function of 980 nm pump power for three different wave-
As explained in the previous section, the nonlinear evolution of the output power as a
function of the launched power is a consequence of the pump lasing peak shifting to-
wards the 980 nm wavelength. In this configuration, longer wavelengths present a better
efficiency compared to shorter wavelengths. Fig. 7.9 (b) shows the average output power
(blue dots) and the calculated signal power (red triangles) of the LMA Er3+-doped fibre
amplifier over the entire tuning range. A maximum average output power of 1.67 W and
1.15 W is measured at 1559 nm and 1535 nm, respectively. This corresponds to a drop
in the output power of ∼ 1.6 dB along the entire tuning range. The signal power (power
without ASE) is calculated from the optical spectra measurements in Fig. 7.10. For the
1559 nm and 1535 nm lasing wavelengths the signal power was calculated to be 1.39 W,
and 0.4 W, respectively. This represents a drop in the signal power of more than 5 dB.
Therefore, pulse amplification at shorter wavelengths is limited by the growth of ASE at
1560 nm. The spectral signal to ASE extinction ratio at longer wavelengths is measured
to be ≥ 27 dB while for shorter wavelengths decreases to ∼ 10 dB.
Figure 7.10: Output spectrum over the entire tuning-range of the ML laser. Thespectrum is measured with a resolution of 0.1 nm.
For low average output powers Pout ≤ 700 mW, the beam quality factor of the MOPA
for the x and y- axis were measured to be M2x ∼ 1.2 and M2
y ∼ 1.1, respectively.
Nevertheless, it increased to M2x ∼ 2.45 and M2
y ∼ 2.41 for the maximum output power
(see Fig. 7.11). This result means that even though both the signal and pump (1480 nm)
beams propagates in the fundamental mode through the tapering splice technique, at
higher cladding-pump powers, the preferential gain for the fundamental mode competes
with higher order ASE modes.
Chapter 7 Amplification of a picosecond bandwidth-tunable laser source 95
Figure 7.11: Beam quality measurement at the output of the LMA Er3+-doped fibrefor a maximum output power Pout = 1.03 W at 1535 nm.
Figure 7.12 (a) and (b) show the autocorrelation and output spectra measurement at
different stages of the amplification system, respectively. The input pulse width of
τFWHM = 8.5 ps does not suffer temporal variations after amplification. However,
the pulse spectrum broadens in each amplification stage due to SPM. The initial pulse
bandwidth of ∆λ = 0.26 nm is broadened to ∆λ = 0.57 nm for the maximum average
output power. The maximum pulse energy and peak power at 1559 nm is calculated to
be 11 kW and 106 nJ, respectively.
7.3 Conclusions
In this Chapter, two different MOPA systems are proposed for amplification of picosec-
ond pulses at different wavelengths. The first configuration comprises a LMA cladding-
pumped Er3+/ Yb3+ co-doped fibre amplifier delivering pulses with peak powers and
pulse energies of ∼ 5.7 kW and 74 nJ, respectively. Higher peak powers are limited
by the onset of pulse-breaking. The second configuration comprises a LMA Yb3+-free
Er3+-doped fibre, delivering pulses with peak powers and pulse energies of ∼ 11 kW
and 106 nJ, respectively. Higher peak powers can be achieve but are limited by pump
power at longer wavelengths, and by ASE at shorter wavelength. The novelty of the
second configuration is that it includes a hybrid pumping configuration to tackle the low
absorption of the Er3+-doped fibre, enabling to reduce the active fibre length. Thus, it is
possible to delay the onset of pulse-breaking, due to excessive nonlinearities. Although
the configuration was designed to ensure preferential gain for the fundamental mode by
exciting it through the tapered section of the fibre, the cladding-pumped scheme deteri-
orates the quality beam factor by exciting higher order modes in the fibre. A M2 factor
of 2.4 was achieved for maximum output power. High peak powers with relatively high
96 Chapter 7 Amplification of a picosecond bandwidth-tunable laser source
Figure 7.12: (a) Autocorrelation traces and (b) pulse spectra measurements at dif-ferent stages of the Er3+ amplification system.
average output power suggest that this compact source can be suitable for applications
such as supercontinuum generation or tunable sources by second-harmonic generation.
Regarding the latter, in the Future Work section, I will describe in more detail the
requirements to achieve a high-efficient second-harmonic generation.
Chapter 8
Broadband Noise-Like Pulse
Erbium-Doped Fiber Ring Laser
In this Chapter I propose and implement an all-fiberized Er3+-doped fibre ring laser
generating linearly polarized picosecond pulses with 135-nm bandwidth and excellent
spectral flatness. The pulse energy and width are readily reconfigurable from 0.7 nJ to
1.1 nJ and from 6.5 ps to 220 ps, respectively, via controlling the cavity finesse and/or
pumping power. The relative intensity noise (RIN) characteristics of the source are also
investigated and compared to a commercial passively generated super-continuum source.
The overall performance of the source is much superior to ASE-based broadband sources
in terms of spectral bandwidth as well as power. Such optical source should be useful
for many applications, such as optical fiber sensing, or optical coherence tomography
that require broadband outputs with relatively high average power.
8.1 Overview of the noise-like pulse regime
Over the past decades fibre-based ultrashort pulse optical sources have received a lot
of research attention and a variety of cavity configurations and pulse-generating tech-
niques have been introduced [6, 42, 121]. As explained in Chapter 3 different types of
optical pulses can be generated from fiber-based sources depending on the dispersion
property of the cavity (solitons, Gaussian pulses, similaritons, etc.). Noise-like pulses
(NLP) [137–142], unlike such fixed pulse forms, are another interesting type of pulses
that can be extracted from a fiber laser. NLPs may be regarded as a bunch of ultrashort
pulses with random pulse widths and peak powers that circulate in the cavity at the
fundamental roundtrip frequency [139]. Such pulses eventually form a stable and very
broad spectral emission, which is sometimes even broader than the gain bandwidth [140]
of the laser medium.
97
98 Chapter 8 Broadband Noise-Like Pulse Erbium-Doped Fiber Ring Laser
The early extensive study on NLPs was carried out by Horowitz et al. [137]. The
authors explained the formation of the pulses in terms of a combination of strong bire-
fringence in the laser cavity and the transmissivity of the nonlinear medium. Later on,
the role of the cavity dispersion and cavity length in the NLP duration and spectral
bandwidth was also investigated by Horowitz et al. [138] and Kang et al. [139]. In
Ref. [138] shorter cavities, with low dispersion, yielded shorter pulses while in Ref. [139]
dispersion-mapped cavities with large net cavity dispersion enhanced the spectral band-
width of the NLPs. More recent studies explained the formation of NLPs in terms of
soliton collapse and positive cavity feedback in the laser and showed that NLPs could be
generated independently of the dispersion configuration [140, 141]. While there may be
better or alternative explanations for the formation of the NLPs in a fibre laser cavity,
it is noteworthy that the NLP regime has a unique feature that it can generate broad
and smooth optical spectra in a relatively simple and compact configuration. In terms
of bandwidth, such fiber-based broadband light sources should be very useful in areas
such as optical metrology or optical coherent tomography (OCT), where short coherence
lengths are ultimately required. However, it is also necessary to justify the detailed noise
characteristics of the NLP-based optical sources because the stability and noise charac-
teristics are crucially linked to the sensitivity and practicality of the optical sources.
Recently, an increasing number of reports on the broadband operation of NLP-based
fiber sources have been published [142–144]. Within those, the work of Zhao et al. [142]
has a record result in terms of broad bandwidth operation with 120 nm bandwidth
with an average power of ∼ 2 mW when pumped at 700 mW. However, its conversion
efficiency was limited to below 0.3% and it supported rather long temporal pulses of ∼ 50
ps. In this Chapter I propose and investigate a linearly polarized, all-fiber Er3+-doped
fibre ring laser that generates picosecond NLPs at 1570 nm with 135-nm bandwidth,
excellent temporal/spectral stability, and improved conversion efficiency of ∼ 3%. The
broadband NLPs are obtained by exploiting fiber birefringence and nonlinearity in the
cavity combined with a highly nonlinear fibre (HNLF) for Raman gain enhancement.
This is to the best of my knowledge, the broadest spectral bandwidth directly generated
from an Er3+-doped fibre ring laser. The pulse width and spectral bandwidth of the
laser is adjustable with the pump power and/or the internal polarization controller
(PC) which determines the cavity birefringence and the output coupling ratio (OCR).
The experimental results show that the laser cavity can operates in two clearly different
types of regimes apart from a continuous-wave (CW) regime: a self-phase-modulation
(SPM)-dominant NLP regime and a Raman-extended NLP regime, which are to be
discussed in details in the following section.
Chapter 8 Broadband Noise-Like Pulse Erbium-Doped Fiber Ring Laser 99
8.2 Experimental setup
Figure 8.1 shows the experimental arrangement for the laser source. The cavity consists
of∼ 2.5 m polarization maintaining (PM) Er3+-doped fibre with an absorption coefficient
of 8.4 dB/m at 1480 nm and a birefringence of 2.2 × 10⁻⁴. The PM Er3+-doped fibre
is pumped through a wavelength-division-multiplexed (WDM) coupler (1480/1550 nm)
with two laser diodes (LDs) delivering a maximum total power of 270 mW at 1480 nm.
The other components in the cavity include a 12-m HNLF with nonlinear coefficient
γ = 10 W−1km−1, a fiberized isolator to ensure unidirectional lasing, a 99/1 coupler
to monitor the intra-cavity signal, a polarization controller to adjust the polarization
state inside the cavity and also to control the output-coupling ratio of the laser, and a
fiberized polarization beam splitter (PBS) to obtain linearly polarized output pulses and
to excite only one of the polarization modes in the PM-Er3+-doped fibre. Excitation of
only one polarization mode in the gain fibre was the main reason to counter-pump the
laser cavity 1. The total length of the cavity is ∼ 22 m with an overall dispersion value
of β2 = 0.23 ps2 at 1550 nm. The GVD parameter of the PM-Er3+-doped fibre and the
HNLF are numerically calculated, via analyzing its refractive index profiles (FRIPs), to
be βEDF2 = 17.85 ps2/km and βHNLF2 = 29.3 ps2/km at 1550 nm, respectively. The rest
of the cavity is formed of a standard single-mode fiber (Corning SMF-28) with a GVD
parameter value of -20 ps2/km.
Figure 8.1: Schematic diagram of the Er3+-doped fiber ring laser. LD: laser diode,PM-EDF: polarization maintaining Er3+-doped fibre, PBS: polarization beam splitter,
PC: polarization controller.
1The reader should notice that the only polarization maintaining (PM) components in the cavity arethe PM- Er3+-doped fibre and the output ports of the fiberized PBS. Therefore, it was decided to alignand fusion splice the fast axes of the active fibre and PBS output port. In such configuration, a counter-propagating signal is strictly launched into the fast-axis of the active fibre and its power controlled withhelp of the PC located before the PBS. These two benefits could not be achieved in a co-propagatingconfiguration because the WDM coupler spliced to the active fibre is not a PM component and thereforecontrol of the polarization state in this component is not possible.
100 Chapter 8 Broadband Noise-Like Pulse Erbium-Doped Fiber Ring Laser
8.3 Experimental results
The laser could operate in two main, clearly different regimes which were controlled by
the pump power and the OCR (via adjusting the PC). In the first regime, the laser
generated a train of “square-shape” NLPs with a fundamental repetition rate of 9.1
MHz. This regime appeared for pump powers above 120 mW. The average width of
the envelope of the NLPs was around 90 ps, measured with a fast photodetector (20
GHz bandwidth) and a digital comunication analyzer (DCA) (20 GHz bandwidth), and
could be varied with both, the pump power and the output coupling ratio (see Fig.
8.2). The autocorrelation traces of these pulses are depicted in the inset of Fig. 8.2.
The traces show a narrow spike with sub-picosecond width located on top of a broad
asymmetric pedestal that covered the maximum scan range of around 110 ps of the
autocorrelator. The shape of the autocorrelation indeed represents a “noise-like” feature
of the complicated intensity pattern resulting from the bunch of pulses circulating in the
cavity at the fundamental roundtrip frequency [140].
Figure 8.2: Time traces of the “square-shape” NLPs generated by the Er3+-dopedfibre ring laser. Pulse width is varied with either pump power or output coupling ratio.
Inset shows their respective autocorrelation traces.
Figures 8.3 (a) and 8.3 (c) show the behavior of the NLPs in terms of pulse width or
peak power as a function of the output power, respectively. It should be noted that for
these figures I consider the bunch of pulses as a single entity. For Fig. 8.3 (a) the PC
in the cavity remains fixed at the OCR of ∼ 25% as the pump power changes, while
for Fig. 8.3(c) the pump power remains constant at ∼ 180 mW as the PC is adjusted,
thus modifying the OCR of the cavity. In Fig. 8.3 (a) one can see that both the pulse
width and the average output power of the laser increase with the pump power, resulting
in an approximately constant peak power. For this case, the optical bandwidth of the
laser does not show any noticeable changes (see Fig. 8.3 (b)), which agrees with previous
results reported in [137] and [141]. However, a slightly different behavior can be observed
Chapter 8 Broadband Noise-Like Pulse Erbium-Doped Fiber Ring Laser 101
in Fig. 8.3 (c), where the pulse width decreases at higher output powers, allowing the
peak power to increase. Consequently, the increase in the peak power gives rise to an
increase in the spectral bandwidth of the laser (see Fig. 8.3 (d)). For instance, one
can see that the spectral bandwidth is noticeably increased from 13 nm to 17.2 nm as
the pulse width changes from ∼ 220 ps to ∼ 90 ps. This spectral broadening is mainly
attributed to the increase of SPM due to the excessive peak power of the individual
pulses within the NLP envelope. Therefore, from hereafter I will refere to this regime
as the SPM-dominant NLP regime. It should also be noted that the actual peak power
of the individual pulse is significantly higher than the peak power of the envelope pulse.
In Fig. 8.3 (a), and 8.3 (c), the difference between the maximum output power right
before the SPM-regime collapses is related to the polarization state of the cavity. It
was observed that slight adjustments in the polarization state of the cavity had more
influence on the pulse width and pulse spectrum than adjustments on the pump power.
In this sense, pulses were more likely to remain stable by adjusting the pump power
(within a range of ∼ 110 mW) rather than the polarization controller.
Figure 8.3: Pulse width and peak power as a function of the output power of a bunchof noise-like pulses for a (a) constant polarization state and (c) constant pump power.Behaviour of the optical spectrum of NLPs for (b) constant pump power and (d) aconstant polarization state. OCR: Optical coupling ratio, and Ppump: Pump power.
A second operating regime was obtained by pumping the laser at its maximum pump
power of around 270 mW and by adjusting the polarization state of the cavity to max-
imize the internal power density. In this regime, a smooth and nearly flat spectral
emission with an optical bandwidth of ∼ 135 nm is generated (see Fig. 8.4 (a) black
trace). The average output power of the laser in this regime is 6.9 mW and has an OCR
∼ 11%. Fig. 8.4 (b) shows the autocorrelation trace of the output pulses (solid black
trace), where a narrow sub-picosecond coherent spike is observed still sitting on the top
102 Chapter 8 Broadband Noise-Like Pulse Erbium-Doped Fiber Ring Laser
of a pedestal of ∼ 6.5 ps width. The inset of Fig. 8.4 (a) shows the RF spectrum at
the fundamental frequency of the laser, measured with a fast photodetector (22 GHz
bandwidth) and a spectrum analyzer (22 GHz bandwidth). In this regime, it is only
observed a clean and sharp, fundamental frequency component with no significant noise
bands at each side of the spectrum (even for higher frequency resolutions), indicating the
non-existence of intermodal noise. It is worth saying that the formation of this regime
is formed from cw and not from SPM-dominant regime, where pulse formation collapses
before reaching a broad flat spectrum. The initial formation of the broader spectrum
appears as a series of sharp spikes covering what then becomes the broad bandwidth
of the laser output. Slight adjustment of the polarization controller can help to maxi-
mize the bandwidth or stabilize the laser. Unstable spectra were usually characterized
by a low power level on the longer wavelength side of the spectrum, and for a broader
pedestal on the autocorrelation trace. See for example the solid red trace in Fig. 8.4 (a)
and (b), respectively. Nevertheless, it should be noted that the direction of the spec-
tral broadening is only towards the longer wavelengths, which clearly indicates that the
broadening is due mainly to successive Raman scatterings in the cavity fiber [142]. Thus,
this regime is called within this work the Raman-extended NLP regime. In comparison
with the SPM-dominant regime, one can clearly see that the spectrum is less noisy in
this regime. This improvement is attributed to the fact that the excessive peak powers
of the irregular, spiky pulses must be regulated via transferring their excessive energy
to the longer wavelengths spectral bands. Consequently, once the peak powers of the
NLPs are high enough to break into Raman scatterings, NLPs form a Raman-extended,
broad spectral output with relatively improved noise characteristics.
Since the formation of irregular bunches of NLPs results in intensity fluctuation in time,
the relative intensity noise (RIN) analysis must be a good measure for quantifying the
noise characteristics of NLPs. The RIN is a common quantification of the amplitude
noise of a laser system and it is one of the major causes of deterioration of the sensi-
tivity of optical systems. In addition, the RIN of the NLPs was compared to the RIN
characteristics of a commercial supercontinuum (SC) source (∆λ > 1800 nm) that is in
principle based on the combination of a stable mode-locked fiber laser and a nonlinear
optical fibre. The model of the supercontinuum source is a FemtoPower1060 SC400
from Fianium delivering a total output power of 4 W (average spectral power density
> 2mW/nm) with a fundamental repetition rate of 40 MHz, and spectral flatness < 6
dB. In general, the intensity noise varies as a function of the optical intensity, optical
bandwidth, and spectral shape of the optical input that is incident to the photodetector
[145]. Therefore, to carry out a fair comparison of the RIN values of both sources, the
optical signal from each of the sources was filtered with a 12 nm bandwidth optical filter
centred at a wavelength λc = 1550 nm (see dotted lines in Fig. 8.6 (a)). The exper-
imental setup to measure the RIN of both sources is shown in Fig. 8.5. The filtered
light of the broadband source is split in two with help of a 50:50 coupler. The light
from one port of the coupler is then launched into a photodetector (5 GHz bandwidth).
Chapter 8 Broadband Noise-Like Pulse Erbium-Doped Fiber Ring Laser 103
Figure 8.4: (a) Optical spectrum and (b) autocorrelation trace of the Raman-extendedNLP regime for three intermediate states: stable (black solid trace), noisy-stable (bluesolid trace) and quasi-stable (red solid trace), respectively. Inset shows the RF spectrumof the fundamental roundtrip frequency fo= 9.1 MHz with a resolution bandwidth of300 Hz. The optical spectrum is measured with a resolution of 0.1 nm. Pin: Intracavity
power, Pout: Output power
The DC component of the electrical signal generated by the photodetector is removed
with help of a bias-T and monitored with an oscilloscope, while the AC component is
launched into an RF-spectrum analyser with 22 GHz bandwidth. The other output port
of the optical coupler is used to monitor the optical power and to measure the optical
spectrum of the source. During the measurements, light launched into the photodetector
was kept at the same optical power. The RIN spectra of the NLP source and SC source
were measured at their carrier frequencies (fNLPc = 9.1 MHz and fSc C = 40 MHz) and
normalized to the peak level of the carrier frequency.
Fig. 8.6 (a) shows the normalized optical spectrum of the two broadband sources used
104 Chapter 8 Broadband Noise-Like Pulse Erbium-Doped Fiber Ring Laser
Figure 8.5: Experimental setup to measure the RIN of a NLPs source and commericalsupercontinuum source. PD: photodetector, OSA: Optical spectrum analyzer, PM:
power meter, ESA: Electrical spectrum analyzer.
in the experiment before (solid traces) and after (short-dashed traces) being filtered.
Fig. 8.6 (b) shows the RIN of the NLPs source and the SC normalized to their carrier
frequencies. The graphic is plotted relative to the fundamental carrier frequency of the
source. Fig. 8.6 (b) shows that the noise level of the SC and NLPs sources is roughly
the same (-104 dBc/Hz) for a frequency range from 10 kHz to tens of MHz. However,
the noise level of the NLPs is higher at low frequencies ≤ 1 kHz. The peak at 50
Hz is presumed to be an electrical interference caused by AC power lines. Although
there may be many contribution factors to the excessive noise level at low frequencies,
including pump power fluctuation, the discrepancy of the noise levels at low frequencies
between the SC and NLP sources must be due to the slow fluctuation of the amplitudes
of NLPs circulating in the cavity. The high noise level in both sources is expected due
to spontaneous Raman emission during the generation of the broad band spectrum for
both the SC and the NLPs [146]. However, it is clearly noted that the RIN of the
NLP source can substantially improved to a level of a commercial SC source based on a
conventional mode-locked laser oscillator if it operates in the Raman-extended regime.
In addition, if the NLP source operates at higher power and/or at repetition rate, the
RIN can further be improved [147].
8.4 Conclusions
In this Chapter I have presented in detail the design and characterization of a linearly
polarized ultra-broadband fiber laser source via exploiting the birefringence and nonlin-
earity of the fiber in a ring cavity configuration. I showed that not only the adjustment
of the pump power but also the laser cavity finesse affects the pulse width of the envelope
of the NLPs, where the latter has a bigger impact in the optical bandwidth of the laser.
The developed laser could operate in two different regimes, the SPM-dominant regime
and the Raman-extended regime, demonstrating with the latter a record bandwidth of
135 nm. The RIN measurement of the NLP source showed that for frequencies > 1kHz
the RIN level is comparable to that of a commercial SC source and at low frequencies
it shows slightly higher noise levels. However, there is still room for improvement in
terms of the RIN if the NLP source is re-configured to operate at higher power and/or
at repetition rate [148]. The results obtained here show that simple and compact NLP
Chapter 8 Broadband Noise-Like Pulse Erbium-Doped Fiber Ring Laser 105
Figure 8.6: (a) Optical spectra before (solid traces) and after (short dashed traces) the12 nm bandpass filter for the NLPs source (blue traces)and supercontinuum source(redtrace). (b) RF noise spectra of the filtered signals of the sources mentioned previously
sources operating in the Raman-extended regime can be cost-effective sources for many
optical systems that require broadband spectra with intermediate noise characteristics.
Chapter 9
Conclusions
The work presented in this thesis comprises three different research topics: 1) design of
self-starting tunable-wavelength picosecond sources using Er3+-doped fibre based tech-
nology, 2) amplification of picosecond pulses in LMA fibres, and 3) design of a compact
broadband source using Er3+ fibre based technology. In Chapter 4 and 5, I described
the development of an all-fiberized wavelength-tunable picosecond laser source using the
frequency-shifted feedback technique to mode-lock the laser source (Chapter 4). In addi-
tion, I performed numerical simulations to understand the dynamics of the laser source
(Chapter 5). Next, in Chapter 6 and 7 I described the development of a wavelength-
tunable picosecond laser source using a SESAM to mode-lock the laser source (Chapter
6), and a direct amplification system to produce multi-kW peak power pulses with
medium average power. Finally, in Chapter 8 I described the development of a compact
all-fiberized broadband source which combines Er3+ fibre based technology and a HNLF
to generate Raman gain. In this Chapter I summarize the work and results presented
in this thesis.
Mode-locked laser based on frequency-shifted feedback technique
The development of a tunable-wavelength picosecond sources using a frequency-shifted
feedback technique to mode-lock the laser source was presented. Empirical studies were
carried out to understand the performance and limitations of the laser source. Results
showed that an environmentally stable mode-locked regime was achieved by combining
the FSF technique with a NLPE technique provided by a polarizer located between a
pair of polarization controllers. For this configuration, the FSFL generated environmen-
tally stable asymmetric picosecond pulses (∼ 40 ps). The stability of the laser source
allowed me to carry out different experiments to further characterize the asymmetry
of the pulse spectra and pulse intensity as functions of different parameters of the laser
cavity (filter bandwidth, frequency shift, and coupling ratio). The results presented here
provide novel insights in the behaviour of FSFLs that were not previously addressed in
the literature. The results summarized in Chapter 4 showed that for configurations with
107
108 Chapter 9 Conclusions
broad intracavity filter bandwidths the shape of the spectrum tends to split and form a
hump on the longer (shorter) wavelength side due to the downshift (upshift) frequency
mechanism of the AOM. It is also shown that the hump formed on the longer (shorter)
wavelength side of the spectrum is responsible for the strong asymmetry on the trailing
(leading) edge of the pulse in the time domain. Interaction of polarization dependent
losses, nonlinear polarization rotation, and frequency shifts lead to adjustments of the
pulse shape and pulse width. Therefore, shorter pulses can be achieved for higher fre-
quency shifts and coupling power ratios close to unity. Broader filter bandwidths can
also lead to pulse shortening; however it can also lead to multi-wavelength behaviour.
Experimental results also showed that for narrow filter bandwidths the pulse spectrum
does not split and the side of the spectrum where the spectral components are constantly
shifted can be amplified to a level close to the spectral maxima. However, amplifica-
tion of the far end of the spectrum depends on the frequency-dependent gain/losses
of the cavity and the amount of frequency shift applied in the cavity. Furthermore,
these results show the possibility to generate multi-functional stable sources by choosing
the appropriate parameters in the cavity, for example, mode-locked multi-wavelength
sources by means of a Fabry-Perot filter, or use of the benefits of the AOM to amplitude
modulate the cavity and generate Q-switched mode-locked laser.
Numerical simulation presented in Chapter 5 showed novel results in terms of pulse
formation and spectral asymmetry for FSF lasers for different cavity parameters. For
specific parameters of the laser cavity, stable pulses circulating at the fundamental rep-
etition rate of the cavity could be formed. In this mode-locked regime, we also showed
that for broad filter bandwidths, the increment in SPM leads to a split of the main pulse
spectrum forming a hump on the wavelength side where the pulse spectral components
are being constantly shifted by the frequency shifter mechanism in the cavity. These
results corroborate the spectral shape of the pulses obtained experimentally. As a conse-
quence of the hump formation, the spectral maximum of the pulse shifts in the opposite
direction of the frequency shift mechanism. In the time domain, pulse asymmetry is
strongly related to the hump formation on the pulse spectrum. This work can help to
understand a few of the complex interactions effects happening in these lasers and that
have not been clarified in the literature so far.
Mode-locked lasers based on a semiconductor saturable absorber mirror
Chapter 6 shows the results of a hybrid-mode-locking configuration operating in the
1.5 µm region. Self-starting mode-locking behaviour in all three cavities is achieved by
enhancing NLPE and by incorporation of a commercial SESAM. The proposed sigma
cavity configuration works in a fundamental mode-locked regime with and without opti-
cal filter for pump powers as low as ≤ 23 mW. The laser can deliver (without an optical
filter) femtosecond pulses (≤ 380 fs) with a maximum average output power of ∼ 1.9
mW, at repetition rates of ∼ 13 MHz (Ep ∼ 105 pJ). Incorporation of an optical filter
Chapter 9 Conclusions 109
in the cavity allows for picosecond pulse (≤ 12 ps) generation with maximum average
powers of Ppump ∼ 1 mW, at repetition rates of ∼ 13 MHz, corresponding to pulse
energies Ep ≤ 102 pJ. The robust mode-locking stability of the laser cavity allows a
wavelength (1533 nm to 1558 nm) and bandwidth (7 nm to 1.3 nm) tuning, making the
laser a versatile tool for different applications (seeding of Erbium amplifiers or highly
non-linear fibres, second harmonic generation, medical applications, etc).
A comparison between the lasers presented in this Chapter and the FSF laser described
in Chapter 4 shows a better performance in terms of noise (e.g. see table 6.2), and
stability for the former ones. Mode-locked lasers with SESAM showed more resilience to
environmental fluctuations (e.g. vibrations or changes in temperature), although both
kinds of laser could remain mode-locked for hours. Another advantage observed with the
lasers using SESAM is the lack of hysteresis present in FSF lasers to achieve self-starting
fundamental mode-locking behaviour (i.e. there is no need to pump at high powers to
start the mode-locking mechanism in the cavity).
Amplification of a picosecond bandwidth-tunable laser source
Two different MOPA systems are proposed for amplification of picosecond pulses at
different wavelengths. The first configuration comprises a LMA cladding-pumping Er3+/
Yb3+ co-doped fibre amplifier which delivered pulses with peak powers and pulse energies
of ∼ 5.7 kW and 74 nJ, respectively. Higher peak powers are limited by the onset
of pulse-breaking. The second configuration comprised a LMA Yb3+-free Er3+-doped
fibre, which delivered pulses with peak powers and pulse energies of ∼ 11 kW and
106 nJ, respectively. Higher peak powers could be achieved but were limited by pump
power at longer wavelengths, and by ASE at shorter wavelength. The novelty of the
second configuration is that it includes a hybrid pumping configuration to tackle the
low cladding absorption of the Er3+-doped fibre, allowing me to reduce the active fibre
length. Thus, it was possible to delay the onset of pulse-breaking, due to excessive
nonlinearities. Although the configuration was designed to ensure preferential gain for
the fundamental mode by exciting it through the taper section of the fibre, cladding
pumping deteriorates the quality beam factor by exciting higher order modes in the
fibre. A M2 factor of 2.4 was achieved at a maximum output power.
Broadband sources for optical coherence tomography
Development and detailed characterization of a lineraly polarized ultra-broadband fi-
bre laser source based on Er3+ technology was presented. Broadband spectrum was
generated by exploiting the birefringence and nonlinearity of the fiber in a ring cavity
configuration. The developed laser could operate in two different regimes: 1) SPM-
dominant regime, and 2) Raman-extended regime. Regarding the former, pulse energy
and width were readily reconfigurable from 0.7 nJ to 1.1 nJ and from 90 ps to 220 ps,
respectively, via controlling the cavity finesse and/or pumping power. Regarding the
110 Chapter 9 Conclusions
former, the soure could generate a record bandwidth of 135 nm with 6.9 mW of output
power. In addition, the RIN of the source was measured and compared with that of a
commercial SC source. Results showed a RIN of -97 dB/Hz at low frequencies up to 100
kHz and -104 dB/Hz at high frequencies up to 5 MHz. In comparison with a commercial
SC source, the NLP source has similar noise characteristics except for slightly higher
noise levels at low frequencies (< 1 kHz).
Chapter 10
Future Work
In this final Chapter I present possible future directions of research and investigations.
The work carried out in Chapter 4 and 5 provides novel insights into the behaviour
of FSFLs that were not previously addressed in the literature. Nevertheless there are
still several features of these lasers that are not entirely understood, for example, the
mechanisms in the laser cavity that force pulses to propagate in clusters at the funda-
mental repetition rate when high pump powers are applied. The experimental results,
presented in this thesis, showed that separation between pulses is related to the optical
filter bandwidth in the cavity. Therefore it would be useful to carry out an empirical
research with a bandwidth-tunable filter like the one used in Chapter 6 (Alnair filter)1. The experimental results could be useful to determine more precisely the relation
between the filter bandwidth, the pulse width and the space between the cluster pulses.
Regarding the numerical simulations, the model presented in this thesis does not take
into account the polarization state in the cavity. Therefore, future improvements to
this model should consider the polarization state of the optical signal to account for the
NLPE effect in the experimental cavity.
Regarding the work presented in Chapter 6, the laser configuration used a SESAM
mounted on a translation stage which makes the configuration less attractive in terms
of compactness and alignment-free. Therefore, a future direction for this research could
be the replacement of the “bulk” SESAM by a more attractive one based on a saturable
absorber (in transmission mode) mounted on the end face of a single-mode fibre. This
will allow for a more compact all-fiberized cavity. In addition, the net dispersion of
the cavity was limited by the amount of fibre used in the two manual polarization con-
trollers. Therefore, it was not possible to operate this laser configuration with a net
positive dispersion β2 > 0 or close to zero. The net positive dispersion will force the
1 At the time these experiments were carried out the Alnair filter was not available.
111
112 Chapter 10 Future Work
laser to operate in a stretched-pulse regime, generating pulses with higher energy and
broader bandwidth [149].
Results presented in Chapter 7 regarding direct amplification of picosecond pulses in
LMA fibres, were mainly limited in terms of efficiency and power scaling by the fi-
bre designs. For the case of the Er3+/Yb3+ co-doped fibre with core diameter 27 µm,
pulse break-up was observed for pulses with peak powers of Pp ∼ 9 kW after ampli-
fication. In this case, the core size of the Er3+/Yb3+ co-doped fibre was too small.
For the Er3+-doped fibre, pulse amplification was only limited by the available pump
power. Nevertheless, the low cladding absorption of the fibre also imposes a limit to
the minimum length that can be used in the amplifier. Core pumping the fibre with
a more powerful Raman laser can improve not only the laser efficiency but also the
beam quality at the output of the amplifier. High peak powers with relatively high
average output power suggest that this compact source can be suitable for applications
such as second-harmonic generation. This technique can be a good option to generate
average power wavelength-tunable picosecond pulses in a wavelength region ∼ 780 nm.
Although second-harmonic generation is a well-established technique in “bulk” solid-
state lasers to generate frequency-double sources, in the area of fibre lasers it is still
not a consolidated area. Therefore, experimental work can be carried out on this area.
Nevertheless, improvements to the laser source should be done in terms of beam quality.
Recent publications [150] have shown that conversion efficiency of the second-harmonic
generation (SHG) decrease with rising beam propagation factor M2. In fact, from [150]
it can be calculated that for a M2 ∼ 2.4 the SHG efficiency will drop by more than 50%
compared with a diffraction-limited beam. In addition, the spectral width of the pulse
should remain relatively narrow in order to fit into the spectral acceptance bandwidth
of a nonlinear crystal.
Broadband sources are quite useful for applications such as metrology, optical component
testing or medical imaging such as OCT. Up to date, most work [151] have focused on
developing supercontinuum generation sources with the help of MOPAs and nonlinear
optical fibres. These systems add complexity, cost and size to the source. In this
situation, the broadband source presented in Chapter 8 can be a good candidate as
a compact and cost-effective source for OCT. Nevertheless, a clear drawback of the
NLP source at this stage is its low output power (Pout ∼ 6.9 mW), which will limit its
application to slow acquisition [151]. Therefore, future work on this laser source should
be focused on increasing the output power. A cladding-pumping configuration of the
NLP source presented in Chapter 8 may provide a way for power-scaling.
Appendix A
Characterization of the noise in
mode-locked lasers
This appendix explains the theoretical framework for the characterization of amplitude
noise and time jitter in mode-locked lasers based on the work of Von der Linde [9]. The
noise contributions calculated in this appendix correspond to the output signal of the
wavelength-tunable mode-locked fibre laser described in Section 6.3.2. Although these
are the only calculations presented here, the same procedure was carried out to calculate
the noise contributions of the different lasers described in Chapter 4 and 6.
The output signal of a mode-locked laser presents small random fluctuations in ampli-
tude and repetition time. In the frequency domain, these random fluctuations contribute
in different ways to the formation of the power spectrum of the signal. Therefore, with
a proper characterization of the intensity power spectrum it is possible to identify these
fluctuations and quantify them through ordinary measurements in an RF spectrum anal-
yser.
The signal of a noisy cw mode-locked laser can be written as:
F (t) = F0(t) + F0(t)A(t) + F0(t)TJ(t) (A.1)
Where F0(t) represents a perfectly (noise-free) mode-locked laser signal (e.g. F0(t) =∑µ f(t+µT ) with f(t) being the temporal profile of the individual pulses in the signal,
and T the pulse repetition time), F0(t)A(t) represents amplitude fluctuations character-
ized by a random function A(t), and F0(t)T J(t) represents small random variations of
the pulse repetition time.
113
114 Appendix A Characterization of the noise in mode-locked lasers
The power spectrum of A.1 can be obtained by applying the Fourier transform of the
where PA(ω) and PJ(ω) are the power spectra of A(t) and J(t), respectively, f(ω) is
the Fourier transform of the slowly temporal intensity profile of the individual free-noise
pulses, and µ is an integer from minus to plus infinity. Fig. A.1 depicts the rapidly
varying terms defined by the sum in Eq. A.2. The terms comprising the sum are formed
by a series of frequency bands centred at (ω − 2πµ/T ) with a constant spacing 2π/T .
Each band has a contribution from the ideal pulses (δ-function) and contributions from
the amplitude noise PA(ω) and the temporal jitter PJ(ω). As shown in Fig. A.1, the
µ2 dependence of the temporal jitter on Eq. A.2 allows one to distinguish the two noise
contributions (i.e. components centred around ω = 0 are dominated by amplitude noise,
while higher order components are dominated by timing jitter).
Figure A.1: Power spectrum PF (ω) of a train of pulses with random fluctuations inamplitude and repetition time. The dotted line indicates the maxima of the amplitudenoise frequency band, while the dashed line represents the maxima of the temporaljitter frequency band. Inset shows an sketch of the structure of an arbitrary frequency
component of PF (ω). Figure and inset taken and modified from [9].
For stochastic processes, the amount of random fluctuations is characterized by the root-
mean-square (rms) deviation of the noisy signal (e.g. the area of the noise spectrum).
Therefore, for amplitude fluctuations, the rms deviation ∆Ep of the average pulse energy
Ep, is calculated as
∆Ep/Ep =
∫ +∞
−∞PA(ω)dω, (A.3)
Appendix A Characterization of the noise in mode-locked lasers 115
and for temporal fluctuations, the rms deviation ∆t of the average pulse repetition time
T is given by
∆t/T =
∫ +∞
−∞PJ(ω)dω (A.4)
In a practical experiment, the amplitude noise and time jitter contributions to the laser
signal can be extracted from its RF spectrum by measuring the power densities (Pδ,
PB, PA, and the frequency width ∆fi of the noise bands (see inset of Fig. A.1). Pδ
represents the maximum power of the spikes in a specific frequency band (i.e. the δ-
function defined in A.2), PB is the peak power of the fully resolved noise band (timing
jitter contribution), and PA is the peak power of the broad noise band (amplitude noise
contribution). Taking into account these values, and from Eq. A.2 it is possible to
calculate the power ratio of the n-th order spectral side band for high frequency (PA)
and low frequency (PB) contributions as:
(PA/Pδ)n = 2π∆fres
[PA(0) + (2πn)2 PJ(0)
], (A.5)
(PB/Pδ)n = 2π∆fres[PA(0) + (2πn)2 PJ(0)
], (A.6)
where ∆fres is the resolution bandwidth given by the spectrum analyser.
Using Eq. A.3, and A.5 it is possible to write an expression for energy fluctuations at
the fundamental frequency component (n = 0) as:
∆Ep/Ep = [(PA/Pδ)n=0∆fA/∆fres]1/2 , (A.7)
For the case of the RF-spectrum of the wavelength-tunable mode-locked fibre laser shown
in 6.4 (a), I obtained a value of Pδ = -39.16 dBm and PA = -110.21 dBm, with a frequency
width ∆fA = 83 kHz and a resolution frequency ∆fres = 300 Hz . The frequency band
noise includes the base of the spectrum at the fundamental frequency and the noise
bands located at -125 kHz and 125 kHz. Using Eq. A.7 I calculated a value ∆Ep/Ep =
0.47 %.
The low amplitude noise obtained in this laser allows neglecting it while calculating the
timing jitter from the high-order noise components. Thus, using A.4, and A.6 the low
frequency timing jitter contribution is given as
∆t/T = (2πn)−1 [(PB/Pδ)n∆fJ/∆fres]1/2 , (A.8)
116 Appendix A Characterization of the noise in mode-locked lasers
The inset in 6.4 (b) shows the RF spectrum of the 10th harmonic. From this figure values
of Pδ = -39 dBm, PB = -101 dBm, and ∆fJ = 0.41 kHz with a frequency resolution
∆fres = 10 Hz were measured. Using Eq. A.8 I calculated a value ∆t · T = 6.09 ps,
with T = (13.28 MHz)−1.
Appendix B
Equipment data sheets
117
118 Appendix B Equipment data sheets
Figure B.1: Specifications for bandwidth-variable tunable filter BVF-200CL
Appendix B Equipment data sheets 119
120 Appendix B Equipment data sheets
Appendix C
List of publications
This appendix contains the list of published work during my research stay at the ORC
Journal publications
1. L.A. Vazquez-Zuniga, S. Chung, and Y. Jeong, “Thermal Characteristics of an
Ytterbium-Doped Fiber Amplifier Operating at 1060 and 1080 nm”, Japanese
Journal of Applied Physics, 2010. 49(2).
2. L.A. Vazquez-Zuniga, and Y. Jeong, “Super-Broadband Noise-Like Pulse Erbium-
Doped Fiber Ring Laser with a Highly Nonlinear Fiber for Raman Gain Enhance-
ment” Submitted to IEEE Photonics Technology Letters
3. L.A. Vazquez-Zuniga, and Y. Jeong, “On the study of a mode-locked Er-doped
frequency-shifted-feedback fiber laser. Part 1: Numerical simulation results” To
be submitted
4. L.A. Vazquez-Zuniga, and Y. Jeong, “On the study of a mode-locked Er-doped
frequency-shifted-feedback fiber laser. Part 2: Experimental results” To be sub-
mitted
Conferences
1. L.A. Vazquez-Zuniga, and Y. Jeong, “Spectral and temporal behavior of a mode-
locked Er-doped frequency shifted feedback fiber laser”, 2011 16th Opto-Electronics
and Communications Conference (OECC 2011), 2011.
2. L.A. Vazquez-Zuniga, H. Jeong, and Y. Jeong, “Linearly Polarized, 135-nm Band-
width Pulse Generation in an Erbium-Doped Fiber Ring Laser”, 2010 Conference
on Lasers and Electro-Optics (CLEO), 2010.
121
122 Appendix C List of publications
3. Y. Jeong, C. A. Codemard, J. Ji,L. A. Vazquez-Zuniga, G. van der Westhuizen, S.
Yoo, A. J. Boyland, M. Petrovich, F. Poletti, G. M. Ponzo, J. K. Sahu, J. Nilsson,
D. J. Richardson, D. N. Payne, “Novel fibre technology for high-power lasers”,
2010 Asia Communications and Photonics Conference and Exhibition (ACP 2010),
2010.
4. L.A. Vazquez-Zuniga, S. Chung, and Y. Jeong, “Temperature dependence of a
high-power ytterbium-doped fiber amplifier operating at 1060 nm and 1080 nm”,
2009 14th OptoElectronics and Communications Conference (OECC), 2009.
5. J. Nilsson, Y. Jeong, C. A. Codemard, C. Farrell, L.A. Vasquez J. Ji, M. S. Z.
Abidin, G. van der Westhuizen, S. Yoo, J.K. Sahu. High power fibre lasers: Ex-
ploitation of unique properties. Lasers and Electro-Optics 2009 and the European
Quantum Electronics Conference. CLEO Europe - EQEC 2009.
6. L. A. Vazquez-Zuniga, P. Petropoulos, D. J. Richardson, “Design of a fiber Bragg
grating for decoding DPSK signals”, e-PhotonONe+/COST 291 Brest 16-20 Jul
2007.
Bibliography
[1] M. J. Digonnet, Rare-earth-doped fiber lasers and amplifiers. New York: Plenum
Press, 4th ed., —1998—.
[2] D. J. Richardson, J. Nilsson, and W. A. Clarkson, “High power fiber lasers: current
status and future perspectives,” Journal of the Optical Society of America B-
Optical Physics, vol. 27, no. 11, pp. B63–B92, 2010.
[3] C. Codemard, High-power cladding-pumped Raman and Erbium-Ytterbium doped
fibre sources. PhD thesis, University of Southampton, UK, 2007.
[4] G. P. Agrawal, “Nonlinear fiber optics: its history and recent progress invited,”
Journal of the Optical Society of America B-Optical Physics, vol. 28, no. 12,
pp. A1–A10, 2011.
[5] G. R. Agrawal, Applications of Nonlinear Fiber Optics. San Diego: Academic, —
2001—.
[6] L. E. Nelson, D. J. Jones, K. Tamura, H. A. Haus, and E. P. Ippen, “Ultrashort-
pulse fiber ring lasers,” Applied Physics B: Lasers and Optics, vol. 65, no. 2,
pp. 277–294, 1997.
[7] E. R. Thoen, E. M. Koontz, M. Joschko, P. Langlois, T. R. Schibli, F. X. Kartner,
E. P. Ippen, and L. A. Kolodziejski, “Two-photon absorption in semiconductor