Page 1
Leaching Characteristics of Recycled Asphalt Shingles Mixtures
2013
Student Investigators: Jiannan Chen, Kyle J. Groves, Liangquan Wang
Advisors: Tuncer B. Edil, Ali Soleimanbeigi
University of Wisconsin-Madison
UNIVERSITY OF WISCONSIN SYSTEM SOLID WASTE RESEARCH PROGRAM Student Project Report
Page 2
Leaching Characteristics of Recycled Asphalt Shingles Mixtures
Jiannan Chen Graduate Research Assistant, Department of Geological Engineering, University of Wisconsin-Madison. Email: [email protected]
Kyle J. Groves Undergraduate Research Assistant, Department of Geological Engineering, University of Wisconsin-Madison. Email: [email protected]
Liangquan Wang Undergraduate Research Assistant, Department of Geological Engineering, University of Wisconsin-Madison. Email: [email protected]
Tuncer B. Edil Professor and Research Director, Recycled Materials Resource Center, Department of Geological Engineering, University of Wisconsin-Madison. E-mail: [email protected]
Ali Soleimanbeigi Research Associate, Department of Geological Engineering, Department of Geological Engineering, University of Wisconsin-Madison. E-mail: [email protected]
ABSTRACT: Asphalt shingle waste has been identified by Environmental Protection Agency within top five
priority material for reuse application. Use of RAS in hot mix asphalt is common but does not
consume all available reclaimed asphalt shingles. Previous research results showed that
recycled asphalt shingles (RAS) stabilized with fly ash (FA) or mixed with granular materials
such as bottom ash (BA) have suitable geotechnical properties for use as structural fill in
highway embankments opening new areas of application (Soleimanbeigi 2012). However,
leaching of heavy metals from the coal ash mixed in the RAS could have the potential to
contaminate the surrounding soil and groundwater. In this study, the leaching characteristics of
heavy metals from different RAS/Coal Ash mixtures were evaluated. Long-term column leaching
tests were conducted on the compacted RAS/BA (25/75 wt/wt), RAS:FA (80/20 and 90/10 wt/wt)
mixtures, and the concentrations of heavy metals in leachate were compared to the USEPA
drinking water standard and health advisory. From the results of column leaching tests, RAS/BA
(25/75 wt/wt) has less environmental impact than the RAS/FA mixtures.
KEYWORDS: RAS, BA, FA, fly ash, leachate, temperature, season, long-term, column
2 | P a g e
Page 3
INTRODUCTION Recycling and reusing industrial wastes is an excellent way of saving energy, resources and
reducing the greenhouse gas emission (Edil 2006, Lee et al. 2010).Nearly 80% of structures in
the United States are covered by asphalt shingles and due to roof renovation, approximately 11
million Mg of asphalt roofing shingle waste is generated each year in the US. (Krivit, 2007).Re-
roofing jobs account for 10 million Mg, with another 1 million Mg manufacturing scrap shingles.
Applications including as a component of hot mix asphalt (HMA), cement kiln fuel, cold patch in
paved roads and dust control in gravel roads account for reuse only between 10 to 20% of the
total asphalt shingle waste and therefore the remaining large amount is disposed of in landfill
(Townsend, 2007; Turley, 2011). Since highway construction usually consumes large volumes
of material, the potential for using the asphalt shingle in other highway applications such as in
unbound layers or fill is an appropriate option for reusing this material.
Typically, an asphalt shingle is made by impregnating a layer of organic or fiberglass material
with liquid-blown asphalt. After being coated with proper thickness of asphalt, one side of the
shingle is covered by granules in order to protect the shingle from being damaged physically
and from the ultraviolet rays; the other side is covered by fine sand or fly ash to prevent the
shingles from sticking with each other during packing and transport processes.
The asphalt shingle wastes are produced by either removing old asphalt shingles from the
existing houses during house renovation process, in which they are called “tear-off shingle”, or
rejecting asphalt shingle/shingle tabs that are discarded during the manufacturing process of
new asphalt shingles, these shingle wastes are called “manufacturing shingle scrap”. Because
RAS itself is too compressible to provide serviceable highway embankments, engineering
properties of RAS mixed with granular byproducts, e.g., bottom ash (BA) and sand, and self-
cementing fly ash (FA) are evaluated by Soleimanbeigi in 2012. It is suggested that
geotechnical properties of compacted RAS/BA and RAS/FA mixtures are appropriate for
structural fill application.
BACKGROUND An important step to evaluate suitability of RAS as structural fill is to investigate its
environmental impact. Use of coal ash raises environmental concerns related to heavy metal
leaching (Li et al. 2006, Kossen et al. 1996, Kossen al. 2002, O’Donnell et al. 2010,
Komonweeraket et al. 2011). Concentrations of leaching of Arsenic (As), Boron (B), Chromium
(Cr) and Mercury (Hg) from fly ash and fly ash stabilized soils are observed in the laboratory
3 | P a g e
Page 4
batch tests to exceed the USEPA groundwater standard (Komonweeraket et al. 2011). To
wisely and safely use RAS/additive mixtures as structural material, investigation of the leaching
behavior is crucial.
In this study, RAS/Coal Ash mixtures are proposed to be used in construction of highway
embankment. Physical properties of fly ash, and bottom ash including grain size distribution,
specific gravity and maximum dry unit weight were evaluated. Previous studies on RAS showed
limited information on the chemical properties and leaching of contaminants in unbound
applications. Laboratory-scale column leaching tests on the RAS/Coal Ash mixture compacted
to the expected field densities were performed to characterize the long-term leaching behavior
of heavy metals.
TEST MATERIALS The Resample used in this study was provided by Stratford Building Supply Company, Stratford,
WI. The non-friable RAS samples were processed from tear-off roofing shingle waste to remove
common impurities including nails, paper, plastic and wood chips. The percent impurities
measured from the received RAS sample was less than 0.3% by weight.Fig.1 (a) shows the
typical shape of RAS particles, the sand cover and mineral coating on RAS particle surfaces.
AS particles are plate-like, irregular in shape, highly angular and have rough surface texture.
The angularity of RAS particles reduces to semi-round to round as the particle size decreases.
Self-cementing class C fly ash (FA) used for RAS stabilization was supplied by Columbia Power
Plant, Portage, WI. Bottom ash (BA) was selected as a granular industrial byproduct additive to
RAS. Fig. 1 (b) shows the microphotograph of the BA, internally porous, angular and rough in
surface texture.
In this study, RAS was mixed with FA and BA respectively. RAS/FA ratio of 90/10(wt/wt) and
80/20(wt/wt) were selected for RAS stabilization, Andres/BA ratio of 25/75 (wt/wt) was selected
for BA as granular mixture for RAS. The determination of RAS/Coal Ash ratio is based on both
material strength and drainage considerations, the details are described in Soleimanbeigi
(2012).
TEST METHODS Physical Property Tests
The physical property tests, including grain size distribution, specific gravity, and compaction
tests, were conducted on RAS, BA and FA samples.
4 | P a g e
Page 5
Grain Size Distribution. The Grain size distributions of RAS, BA and FA samples were
determined in accordance with ASTM D422. The specimens were first wet sieved through sieve
No. 200 to separate coarse and fine particles. The coarse portions of BA and FA samples were
oven dried (105°C) for 24 hours prior to mechanical sieving. The coarse portion of RAS sample
was air dried to prevent binding of the particles at oven temperature.
Specific Gravity. The specific gravities of RAS, BA and FA were measured based on ASTM
D854. A pycnometer is continuously agitated for an hour under a consistent vacuum to remove
the entrapped air in the slurry and to prevent clogging by sample particles during the test. De-
airing is accomplished by vacuuming distilled water
Compaction. Standard Proctor compaction tests were conducted based on ASTM D698. RAS
was mixed with FA at 80/20 and 90/10 wt/wt and with BA at 25/75 wt/wt.
Column Leaching Tests
RAS/FA (80/20 and 90/10) and RAS/BA (25/75) mixtures were used to conduct the long-term
column leaching test (CLT). These specimens were compacted using the standard Proctor effort
(ASTM D698) at 90% of the maximum dry unit weight (i.e., the field specification) and optimum
water content into a PVC column, which has a diameter of 20 cm and a height of 10 cm. A
schematic view of column setup is presented in Fig.2. All fittings in contact with specimens are
non-metallic. Specimens with RAS/FA mixtures were cured 7 days right after compaction.
Synthetic rainwater, as described in Scalia and Benson (2010) was used as inflow permeant. A
continuous, upward flow was generated by a peristaltic pump at a Darcy flux of 1.6 cm/day
(approximately 0.5 pore volumes of flow, PVF, per day), which was sufficient to avoid
preferential flow paths, wet-dry cycles, and air bubbles in the system. Specimens were
saturated 24 h before test initiation, and leachate samples were collected every day in the first 2
pore volumes of flow (PVFs), and twice per week afterward. The column tests were terminated
at 20 PVFs, which is equivalent to approximately 4 to 5 years of permeation in the field
(calculated from Chen et al. 2013).
Chemical Analysis
pH, Electrical Conductivity (EC) and Redox Potential (Eh) measurements of the leachate were
recorded immediately after the sampling. 0.45μm filter paper was used for leachate sample
filtering process. Samples were then preserved with trade-grade nitric acid (HNO3) and was
stored at 4 °C. Metals that are listed in USEPA drinking water standard and health advisories,
5 | P a g e
Page 6
i.e., Arsenic (As), Barium (Ba), Beryllium (Be), Boron (B), Cadmium (Cd), Chromium (Cr),
Copper (Cu), Lead (Pb), Antimony (Sb), Selenium (Se), Thallium (Tl) and Zinc (Zn), were
analyzed in this study. The maximum contamination level (MCLs) and method detection limits
(MDLs) of the elements are listed in Table 1.
TEST RESULTS Physical Properties
Grain Size Distribution and Specific Gravity. The grain size distributions of RAS, BA and FA
particles are shown in Fig.3. More than 80% of the particles of RAS and BA are sand size with
the fine contents less than 5%. RAS and BA have very similar grain size distributions. According
to the Unified Soil Classification System (USCS), RAS is classified as well graded sand and BA
is classified as poorly graded sand. RAS has a relatively low specific gravity (1.74), this low
specific gravity is attributed to organic cellulose felt and asphalt cement contents which together
constitute about 50% by mass of RAS. The specific gravity of BA is 2.67. The FA sample has
95.3% fines, and is classified as class C fly ash because of its self-cementing properties. The
compositional properties of the fly ash are 6.0% loss on ignition (LOI), minimum 50% of SiO2,
Al2O3, and Fe2O3, and minimum 75% of strength activity at 7 days. The specific gravity of this
class C fly ash is 2.70 (Edil et al. 2006).The physical properties of RAS, BA and FA are
summarized in Table 2.
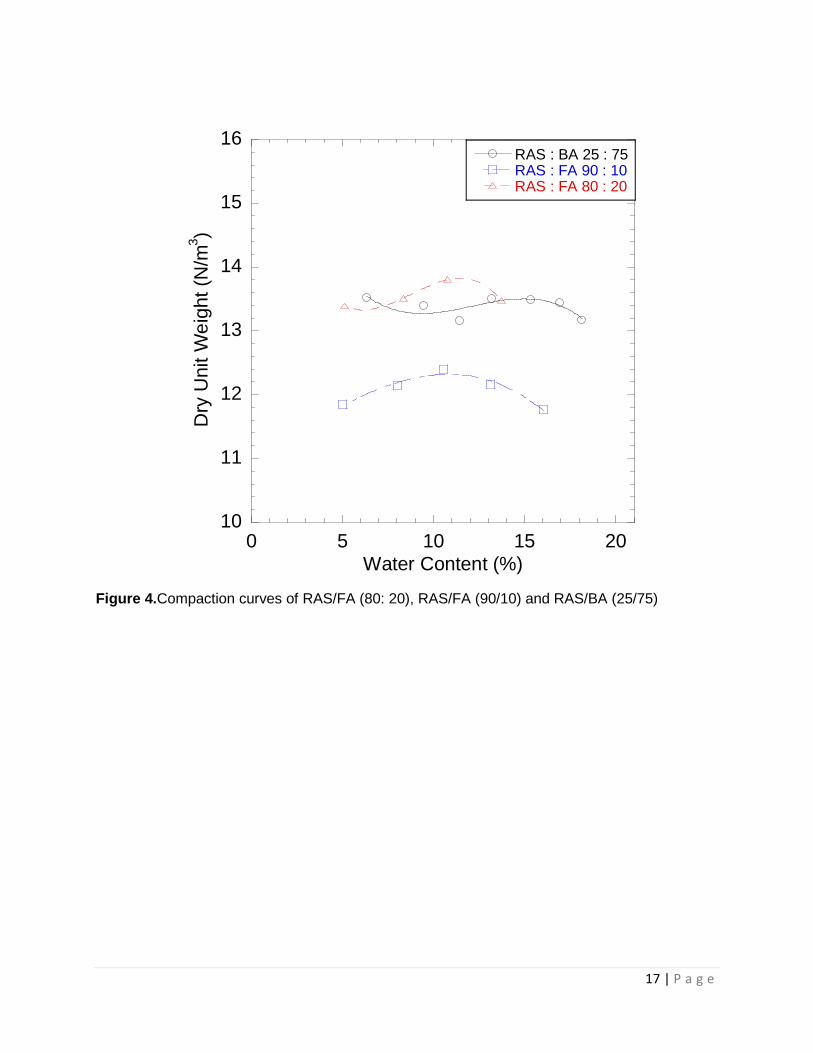
Compaction Test. Fig.4 shows the compaction curves of RAS/FA (80: 20), RAS/FA (90/10)
and RAS/BA (25/75). RAS/FA mixtures have well-defined compaction curves with γdmax varying
from 12.5kN/m3 to 13.8kN/m3, and increasing FA content results in higher γdmax. The γdmax of
RAS/FA (80: 20) mixtures is identical to γdmax of RAS/BA (25/75). The low γdmax of RAS mixtures
makes the BA favorable alternative to compacted sandy soils for construction of highway
embankments over weak subgrade.
Column Leaching Tests
pH, Electrical Conductivity (EC) and Oxidation-Reduction Potential (ORP). pH, EC and
ORP of leachates as a function of pore volumes of flow (PVFs) are shown in Fig.5.All three
specimens presented a trend of increasing pH and decreasing EC and ORP over the first 5
PVFs, and the values leveled off afterwards up to20 PVFs. The pH and ORP of first flush (<2
PVFs) for all three specimens are similar and within a range of pH = 7.7 to 8.2 and ORP = 235.5
to 253.3 mV. The EC value of first flush from RAS/FA (80/20) (EC = 6570 us/cm) is much higher
6 | P a g e
Page 7
than those of RAS/BA (25/75) and RAS/FA(90/10), while the EC values of RAS/BA(25/75) and
RAS/FA(90/10) are very similar (2260 and 2380 us/cm).
After 5 PVFs, both RAS/FA mixtures have higher leachate pH and EC than RAS/BA mixture,
with pHRAS/FA=8.7 to 11.4, ECRAS/FA= 243 to 1003 us/cm compared with pHRAS/BA = 7.4 to 8.2,
ECRAS/BA= 290 to 521 us/cm. Since FA is a cementitious material and also fine-grained material,
it is more active than bottom ash when it comes to contact with water. The hydration process of
FA generates alkaline substances, such as potlandite and brucite, which help enhance the
leachate pH. Simultaneously, leaching of hydration products increases the total dissolved solids
(TDS) in leachates and contributes to the higher leachate EC. Additionally, when compared both
specimens containing FA, the specimen with higher FA content (i.e., 20/80) has higher leachate
pH and EC, i.e., pH20%FA = 11.1 to 11.4, EC20%FA =610 to 1003 us/cm compared to the specimen
with lower FA content, i.e., pH10%FA = 8.7 to 10.8, EC20%FA = 243 to 456us/cm. The leachate
ORP values from all three specimens are within the range of-100 ~ 250 mV, with RAS/FA
(80/20) has lower ORP (-100 to 29.5 mV) than the other two specimens.
Heavy Metals Leaching. The concentrations of metals in the leachate are shown in Fig.6, 7, 8
and 9 as a function of PVF. Exceedance of maximum contaminant level (MCL) for drinking
water by As and Se in the leachates was observed during the first 10 PVFs for all three
specimens. The peak concentration of As and Se happened during the first 5 PVFs with
RAS/FA (80/20) having higher peak values than the other specimens. The peak value of As in
leachate from RAS/FA (80/20) is 102.8 ppm, while RAS/FA (90/20) is 69.5 ppm and RAS/BA is
51.1 ppm. In the first 10 PVFs, the RAS/FA mixtures present a slightly higher As concentration
in leachate than RAS/BA mixture, with AsRAS/FA= 29.4 to 102.8 ppm, and AsRAS/BA = 29.4 to 51.1
ppm. Moreover, higher FA content induced greater As leaching with a range of 38.1 to 102.8
ppm for RAS/FA (80/20) compared with 29.4 to 69.4ppm for RAS/FA (90/10). After 10 PVFs, the
As exceedance of MCL is not clear due to the limitation of analysis method. Since ICP-OES
method is not quite sensitive to As, Sb and Tl in low level range (< 50 ppb), the MDLs of these
three metals are all above their MCLs, which make the analysis doubtful. Although, the Sb and
Tl concentration in the leachates are all under their corresponding MDL, exceedance is still
possible. RAS/FA (80/20) leached much higher concentration of Se (312.2 to 941.3 ppm) during
the first 2 PVFs than the other two specimens (68.6 to 90.5 ppm), which indicates the FA
content also has great impact on the Se leaching. The Se concentration in leachate decreased
as continuous flow through the specimens, and no exceedance was observed after 10 PVF.
7 | P a g e
Page 8
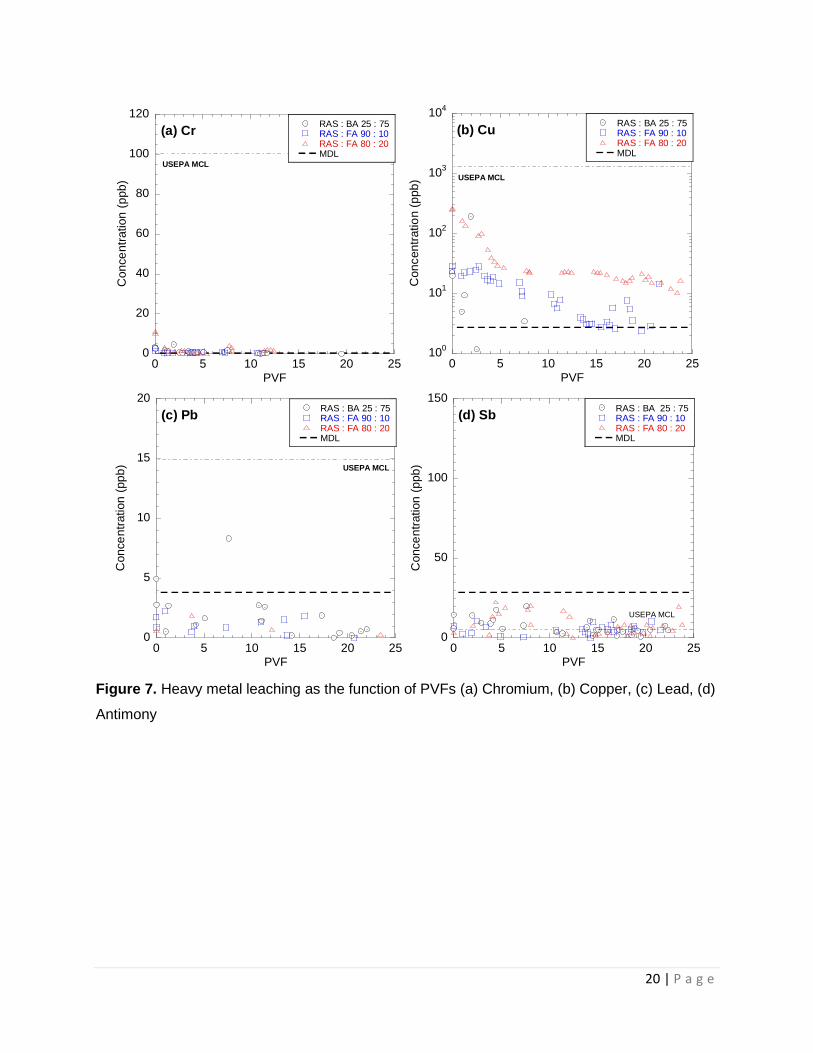
No exceedance of Ag, Ba, Be, B, Cd, Cr, Cu, Pb and Zn was observed during the testing period
(Fig.6, 7, 8 and 9). Concentration of Ag, Be, Cd, Cr and Pb in the leachate from the three
specimens are all below or close to the MDL. The concentration of Ba and Cu in leachate
presented a dependency on the fly ash content, i.e., RAS/FA (80/20) has higher Ba and Cu
leaching than RAS/FA (90/10).
DISCUSSIONS Exceedance of MCL by As and Se in first flush were observed from all three tested specimens.
In the field, the heavy metal in the leachate could be naturally reduced by bioprocess, soil
adsorption and dilution of rainwater or groundwater, which, to certain degree, can help relieve
the environmental impact. However, to better evaluate the leaching behavior and contaminant
transport, water sampling is highly recommended near the highway embankment. The leachate
from RAS/FA (80/20) presented higher pH, electrical conductivity values and concentrations of
As and Se than that from RAS/FA (80/20) and RAS/BA (25/75). The leaching of heavy metals
from RAS/FA (80/20) and RAS/BA (25/75) are quite identical, however, the leachate pH values
of both RAS/FA mixture are higher than the recommended value in the Secondary Drinking
Water Regulations of USEPA Drinking Water Standards and Health Advisories which is 6.5 to
8.5 whereas RAS/BA does not produce alkaline substance to cause pH rise. Additionally, since
(a) metal leaching from RAS/FA mixtures is FA content dependent, and (b) RAS content in
RAS/BA (25/75) mixture is minority, RAS proved not to be a contributor to leachate quality, and
the type and amount of coal ash admixture control the leachate quality. In conclusion, from an
environmental perspective, RAS/BA (25/75) is a more benign mixture for highway construction.
CONCLUSIONS Mixtures of recycled asphalt shingle (RAS) with bottom ash (BA) and fly ash (FA)were
respectively tested in the laboratory. Three mixtures with different RAS/Coal Ash ratios and
combinations were investigated: RAS/FA (90/10), RAS/FA (80/20) and RAS/FA (25/75).
Laboratory column leaching tests were conducted on compacted specimens simulating field
conditions. Leachate samples were collected periodically to track the effluent pH and released
metals up to 20 pore volumes of flow. Based on the collected data, the following conclusions are
drawn:
1. Exceedance of maximum contaminant limits (MCL) for drinking water by As and Se were
observed from all three testing specimens during the first flush, while other elements listed in
USEPA drinking water standard were either below the corresponding maximum
8 | P a g e
Page 9
contaminated level or the method detection limit. Higher fly ash content results in enhanced
heavy metal leaching, which may have environmental impacts.
2. RAS/FA mixtures have higher leachate pH than RAS/BA mixture, and the pH level is above
the recommended range in Secondary Drinking Water Regulations of USEPA Drinking
Water Standards and Health Advisories.
3. RAS indirectly proved not to be a contributor to leachate quality, since the type and amount
of coal ash admixture is observed strongly affect the leachate quality.
4. RAS/BA (25/75) is a more environmental benign mixture out of the three tested mixtures,
however, field water samples are still required to monitoring the water chemistry around the
highway embankment.
ACKNOWLEDGEMENT Support for this study was provided the University of Wisconsin System Solid Waste Research
Program,
TPF-5 (129) Recycled Unbound Materials Pool Fund and Recycled Materials Resource Center.
Any opinions, findings, or conclusions expressed in this paper do not necessarily reflect the
views of the sponsors. Special thanks to Professor Tuncer B Edil, James M. Tinjum, and
Sabrina L. Bradshaw, lab managers Jackie B. Cooper and Xiaodong Wang, Undergraduate
researcher Brigitte L. Brown, Geo-friends, and University of Wisconsin Madison.
9 | P a g e
Page 10
REFERENCES Chen, J., Tinjum, J and Edil, T. (2013). Leaching of Alkaline Substances and Heavy Metals from
Recycled Concrete Aggregate Used as Unbound Base Course. Transp Res Rec 2013;
1786:76-86.
Edil, T., Acosta, H., and Benson, C. (2006). “Stabilizing soft fine-grained soils with fly ash.” J.
Mater. Civ. Eng., 18(2), 283–294.
Joseph Scalia IV, S.M. ASCE and Craig H. Benson, F. ASCE (2010). “Hydraulic Conductivity of
Geosynthetic Clay Liners Exhumed from Landfill Final Covers with Composite Barriers.”
Journal of Geotechnical and Geoenvironmental Engineering © ASCE / January 2011.
O’Donnell, J., Benson, C. H., Edil, T. B. and Bradshaw, S. L. 2010. Trace element leaching from recycled pavement materials stabilized with fly ash.Green Streets and Highways, American Society of Civil Engineers, T&DI, (CD-ROM).
Komonweeraket, K. Benson, C.H., Edil, T.B., and Bleam, W.F.(2010). “Leaching Behavior and
Mechanisms Controlling the Release of Elements from Soil Stabilized with Fly Ash.”
Geo- Frontiers 20111, Dallas, TX, CD-ROM.
Kosson, D. S., Van Der Sloot, H. A., Sanchez, F., and Garrabrants, A. C. (2002). “An integrated
framework for evaluating leaching in waste management and utilization of secondary
materials.” Environmental Engineering Science, 19(3), 159-204.
Krivit, D. (2007). Recycling of Tear-Off Shingles: Best Practices Guide. Final report prepared for
the Construction Materials Recycling Association (CMRA).
Lee, J., Edil, T., Tinjum, J., and Benson, C. (2010). "Quantitative Assessment of Environmental
and Economic Benefits of Using Recycled Construction Materials in Highway
Construction." J. Transportation Research Board, 2158, 138- 142.
Li, L., Benson, C. H., Edil, T. B. and Hatipoglu, B. (2006). “WiscLEACH: A Model for
Predicting Ground Water Impacts from Fly-Ash Stabilized Layers in Roadways.”
GeoCongress 2006, Atlanta, GE, ASCE, CD-ROM.
Soleimanbeigi, A. (2012). “Recycled Geotechnical Evaluation of Recycled Asphalt Shingles as
Structural Fill.” PhD Dissertation, Univ. of Wisconsin-Madison, Madison, WI.
10 | P a g e
Page 11
Townsend, T., Powell, J., and Xu, C. (2007). Environmental issues associated with asphalt
shingle recycling. Construction Materials Recycling Association, US EPA Innovations
Workgroup.
Turley, W. (2010). Personal Communication. Construction Materials Recycling Association,
Eola, IL.
Zickell, A. J. (2003). “Asbestos Analysis of Post Consumer Asphalt Shingles.” Technical Report
#41.Chelsea Center for Recycling and Economic Development, Technical Research
Program.
11 | P a g e
Page 12
TABLES Table 1. Elements considered in column leaching tests
Element Instrument MCL* (ug/L) MDL (ug/L)
Antimony ICP-OES 6 28.0 Arsenic ICP-OES 10 28.6 Barium ICP-OES 2 0.08
Beryllium ICP-OES 4 0.11 Boron ICP-OES 6000*** 3.8 Cadmium ICP-OES 5 0.53 Chromium ICP-OES 100 0.3
Copper ICP-OES 1000** 2.7 Lead ICP-OES 15 3.8
Selenium ICP-OES 50 44.2 Thallium ICP-OES 2 14.2
Zinc ICP-OES 5000 0.5 *USEPA drinking water standard and Health Advisories
**Secondary drinking water regulation
***Health Advisories - Life time
12 | P a g e
Page 13
Table 2. Physical properties of RAS, BA and FA
*From Edil et al. (2006)
Material d10 (mm)
d50
(mm) CU CC % Fines Gs USCS
Classification
RAS 0.17 1.1 7.6 1.6 3.8 1,74 SW
BA 0.19 0.9 6.3 0.8 1.9 2.67 SP
FA* 0.001 0.006 8.2 0.8 95.3 2.70 -
13 | P a g e
Page 14
FIGURES
Figure 1. Photos of(a) RAS particles, the sand cover and mineral coating on RAS particle
surfaces, (b) bottom ash
(a) (b)
14 | P a g e
Page 15
Figure 2. Schematic view of column test apparatus
Peristaltic Pump
Inflow Port
Flow Direction
Outlet
Effluent (Teflon Bag)
Filter Layer (GT)
Filter Layer (GT)
Compacted RCA at 95% γd
15 | P a g e
Page 16
0
20
40
60
80
100
0.00010.0010.010.1110
RASBAFA (Edil et al. 2006)
Per
cent
Fin
er (%
)
Grain Size (mm)
Figure 3. Grain size distributions of RAS, BA and FA samples.
16 | P a g e
Page 17
10
11
12
13
14
15
16
0 5 10 15 20
RAS : BA 25 : 75RAS : FA 90 : 10RAS : FA 80 : 20
Dry
Uni
t Wei
ght (
N/m
3 )
Water Content (%)
Figure 4.Compaction curves of RAS/FA (80: 20), RAS/FA (90/10) and RAS/BA (25/75)
17 | P a g e
Page 18
4
6
8
10
12
14
0 5 10 15 20 25
(a) pHRAS : BA 25 : 75 RAS : FA 90 : 10RAS : FA 80 : 20
pH
PVF
102
103
104
0 5 10 15 20 25
(b) ECRAS : BA 25 : 75 RAS : FA 90 : 10RAS : FA 80 : 20
Ele
ctric
al C
ondu
ctiv
ity (u
s/cm
)
PVF
-200
-100
0
100
200
300
0 5 10 15 20 25
(c) ORPRAS : BA 25 : 75 RAS : FA 90 : 10RAS : FA 80 : 20
OR
P (m
V)
PVF
Figure 5. Leachate chemistry (a) pH, (b) EC and (c) ORP
18 | P a g e
Page 19
0
50
100
150
200
0 5 10 15 20 25
(a) As RAS : BA 25 : 75RAS : FA 90 : 10RAS : FA 80 : 20MDL
Con
cent
ratio
n (p
pb)
PVF
USEPA MCL
101
102
103
104
0 5 10 15 20 25
(b) Ba
RAS : BA 25 : 75RAS : FA 90 : 10RAS : FA 80 : 20MDL
Con
cent
ratio
n (p
pb)
PVF
USEPA MCL
0
1
2
3
4
5
0 5 10 15 20 25
(c) Be RAS : BA 25 : 75RAS : FA 90 : 10RAS : FA 80 : 20MDL
Con
cent
ratio
n (p
pb)
PVF
USEPA MCL
0
2
4
6
8
10
0 5 10 15 20 25
(d) Cd RAS : BA 25 : 75RAS : FA 90 : 10RAS : FA 80 : 20MDL
Con
cent
ratio
n (p
pb)
PVF
USEPA MCL
Figure 6. Heavy metal leaching as the function of PVFs (a) Arsenic, (b) Barium, (c) Beryllium, (d)
Cadmium
19 | P a g e
Page 20
0
20
40
60
80
100
120
0 5 10 15 20 25
(a) Cr RAS : BA 25 : 75RAS : FA 90 : 10RAS : FA 80 : 20MDL
Con
cent
ratio
n (p
pb)
PVF
USEPA MCL
100
101
102
103
104
0 5 10 15 20 25
(b) Cu RAS : BA 25 : 75RAS : FA 90 : 10RAS : FA 80 : 20MDL
Con
cent
ratio
n (p
pb)
PVF
USEPA MCL
0
5
10
15
20
0 5 10 15 20 25
(c) Pb RAS : BA 25 : 75RAS : FA 90 : 10RAS : FA 80 : 20MDL
Con
cent
ratio
n (p
pb)
PVF
USEPA MCL
0
50
100
150
0 5 10 15 20 25
(d) Sb RAS : BA 25 : 75RAS : FA 90 : 10RAS : FA 80 : 20MDL
Con
cent
ratio
n (p
pb)
PVF
USEPA MCL
Figure 7. Heavy metal leaching as the function of PVFs (a) Chromium, (b) Copper, (c) Lead, (d)
Antimony
20 | P a g e
Page 21
0
200
400
600
800
1000
0 5 10 15 20 25
(a) Se RAS : BA 25 : 75RAS : FA 90 : 10RAS : FA 80 : 20MDL
Con
cent
ratio
n (p
pb)
PVF
USEPA MCL
0
5
10
15
20
25
30
35
40
0 5 10 15 20 25
(b) Tl RAS : BA 25 : 75RAS : FA 90 : 10RAS : FA 80 : 20MDL
Con
cent
ratio
n (p
pb)
PVF
USEPA MCL
0
50
100
150
0 5 10 15 20 25
(c) Ag RAS : BA 25 : 75RAS : FA 90 : 10RAS : FA 80 : 20MDL
Con
cent
ratio
n (p
pb)
PVF
USEPA MCL
0
50
100
150
0 5 10 15 20 25
(d) Zn
RAS : BA 25 : 75RAS : FA 90 : 10RAS : FA 80 : 20MDL
Con
cent
ratio
n (p
pb)
PVF
USEPA MCL = 500 ppb
Figure 8. Heavy metal leaching as the function of PVFs (a) Selenium, (b) Thallium, (c) Silver, (d)
Zinc
21 | P a g e
Page 22
101
102
103
104
105
106
107
0 5 10 15 20 25
B
RAS : BA 25 : 75RAS : FA 90 : 10RAS : FA 80 : 20MDL
Con
cent
ratio
n (p
pb)
PVF
USEPA life-time
Figure 9. Boron leaching as the function of PVFs
22 | P a g e