36
1 UNLISTED REAL ESTATE – THE HUNT FOR YIELD Adrian Harrington Head of Funds Management - Folkestone July 2018

1
UNLISTED REAL ESTATE –THE HUNT FOR YIELDAdrian HarringtonHead of Funds Management - Folkestone July 2018

2
FOLKESTONE OVERVIEW
Funds Management
$1.5bn in FUM
Folkestone Limited
Co-Investment in FET $88.4m
Developments
$66.1m Employed
Unlisted Income Funds
FUM
$228.1m
Unlisted Value-add/
Development/ Opportunistic
Funds
FUM
$132.4m
Unlisted Seniors Living
Fund
FUM
$47.9m
FET
$88.4m1
A-REIT Securities
Fund/ Mandates
FUM
$93.7m
Active
$35.4m2
Non-Active (Subject to Planning)
$30.7m
1. Based on Folkestone Education Trust’s (ASX:FET) Unit price of $2.88 at 31 December 2017. Excludes interest in FET held by Folkestone Maxim A-REITs Fund/Mandates.2. Includes FLK’s co-investments in the Folkestone Seniors Living Fund No.1, Folkestone Truganina Development Fund and Folkestone Wollert Development Fund.
Listed FET
FUM
$954.1m
Folkestone is an ASX listed real estate funds manager and developer providing real estate wealth solutions for private clients and select institutions

3
REAL ESTATE LANDSCAPE

4
INVESTMENT LANDSCAPE
• Market forces continue to re-shape the landscape
• Capital is changing –a greater array of investorsand investment opportunities
• Redefining what types of investment are included in the portfolio

5
• Sydney and Melbourne growing above trend
• Population forecasting has consistently fallen short – ABS forecast’s 1999 vs 2017:• Australia - 22.2m vs 24.6m
• Sydney - 4.45m vs 5.1m
• Melbourne - 3.67m vs 4.9m
• Inner city & middle ring population growth stronger than expected
• Infrastructure has not kept pace
• Pressure on social services –childcare/aged care/schools/medical especially inner & middle ring
• Creates social infrastructure real estate investment opportunities
Demographic Shift – Cities
NSW-18,100
QLD+12,000
NT-1,900
WA-6,900
SA-5,500
Vic+9,200
Net Interstate Migration
SOCIAL / DEMOGRAPHICS
Population at 30 June 2017
Change on Previous Year
No. %
Greater Sydney
Greater Melbourne
Greater Brisbane
Greater Adelaide
Greater Perth
Greater Hobart
Greater Darwin
ACT
Total Cities
5,131,326
4,850,740
2,408,223
1,333,927
2,043,138
226,884
146,612
410,301
16,551,151
101,600
125,400
48,000
9,600
21,100
2,400
700
6,800
315,600
2.0
2.7
2.0
0.7
1.0
1.1
0.5
1.7
1.6

6
ECONOMIC - EMPLOYMENT
0.0 500.0 1000.0 1500.0 2000.0
Health Care and Social Assistance
Retail Trade
Construction
Professional, Scientific and Technical…
Education and Training
Manufacturing
Accommodation and Food Services
Public Administration and Safety
Transport, Postal and Warehousing
Other Services
Financial and Insurance Services
Administrative and Support Services
Wholesale Trade
Agriculture, Forestry and Fishing
Arts and Recreation Services
Mining
Information Media and Telecommunications
Rental, Hiring and Real Estate Services
Electricity, Gas, Water and Waste Services
No. of People (‘000)-8.0 -6.0 -4.0 -2.0 0.0 2.0 4.0 6.0 8.0 10.0
Rental, Hiring and Real Estate Services
Retail Trade
Professional, Scientific and Technical…
Construction
Agriculture, Forestry and Fishing
Administrative and Support Services
Wholesale Trade
Health Care and Social Assistance
Education and Training
Manufacturing
Arts and Recreation Services
Information Media and Telecommunications
Public Administration and Safety
Other Services
Financial and Insurance Services
Mining
Accommodation and Food Services
Transport, Postal and Warehousing
Electricity, Gas, Water and Waste Services
%
Employment By Industry: As At May 2018 Employment By Industry Change: 2017 - 2018
Source: ABS

7
CAPITAL FLOWS – NON RESIDENTIAL REAL ESTATE
Asia Pacific Cross Border Investment: 12 Months to 31 March 2018
Source: Savills
Most Active Metros By Real Estate Type: 12 Months to 30 June 2018
Source: Savills
• Australia continues to be attractive to Asian investors • Sydney office, Sydney/Melbourne/Brisbane industrial and Brisbane retail in demand from Asian investors
8
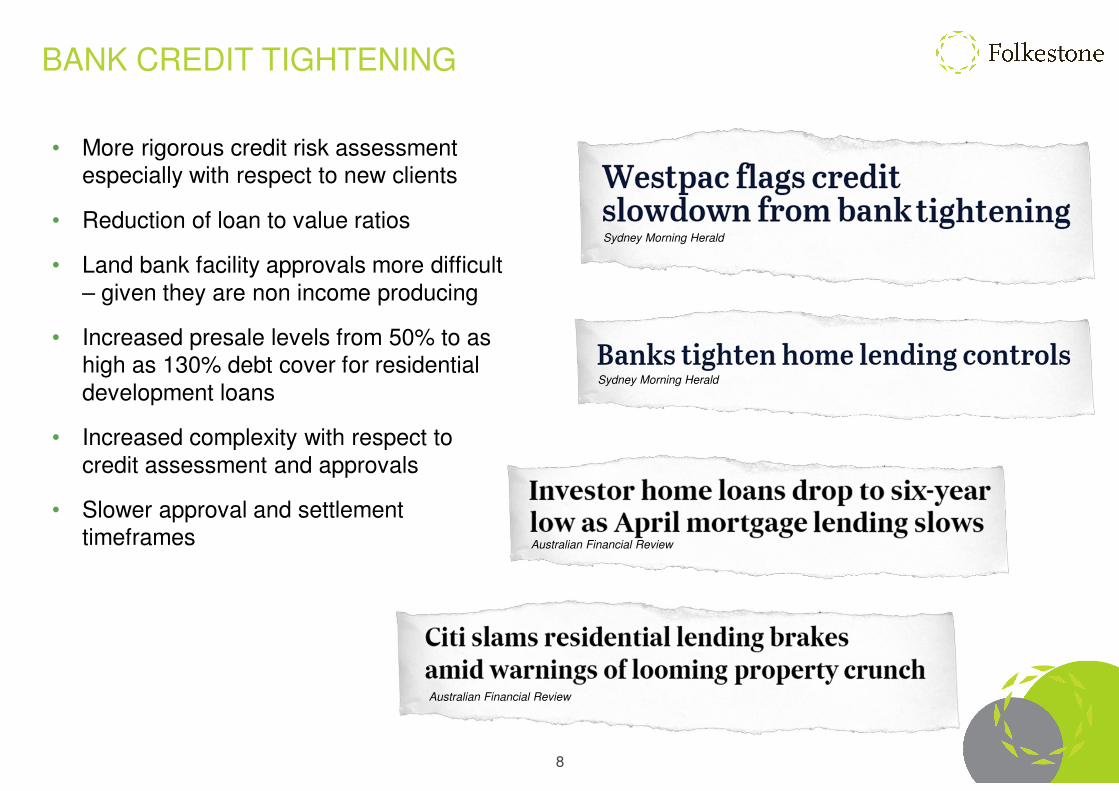
BANK CREDIT TIGHTENING
• More rigorous credit risk assessment especially with respect to new clients
• Reduction of loan to value ratios
• Land bank facility approvals more difficult – given they are non income producing
• Increased presale levels from 50% to as high as 130% debt cover for residential development loans
• Increased complexity with respect to credit assessment and approvals
• Slower approval and settlement timeframes
Sydney Morning Herald
Sydney Morning Herald
Australian Financial Review
Australian Financial Review

9
THE RISE OF NON-BANK LENDERS
Source: Stamford Capital
• Major banks still have appetite for investment loans but less so for construction loans
• Non-bank lenders are increasing their stake
• New funding sources are emerging
• Lending criteria to remain tight

10
UNLISTED REAL ESTATEPERFORMANCE

11
FOUR QUADRANT REAL ESTATE INVESTING
PUBLIC DEBTCorporate Bonds
Commercial Mortgage-Backed Securities (CMBS)
PRIVATE DEBTSenior Debt
Mezzanine Debt
Mortgage Funds
EQUITY
DEBT
PUBLIC
PRIVATE
PUBLIC EQUITYReal Estate Investment
Trusts (A-REITs)
Real Estate Developers and Managers
PRIVATE EQUITYDirect Real Estate
Syndicates
Open-ended Funds
12
INCOME
(9 TO 12%)
DEVELOPMENT
(15% PLUS)
RISK
RE
TU
RN
INCOME
ORIENTED
TOTAL RETURN
ORIENTED
VALUE ADDED
(10 TO 15%)
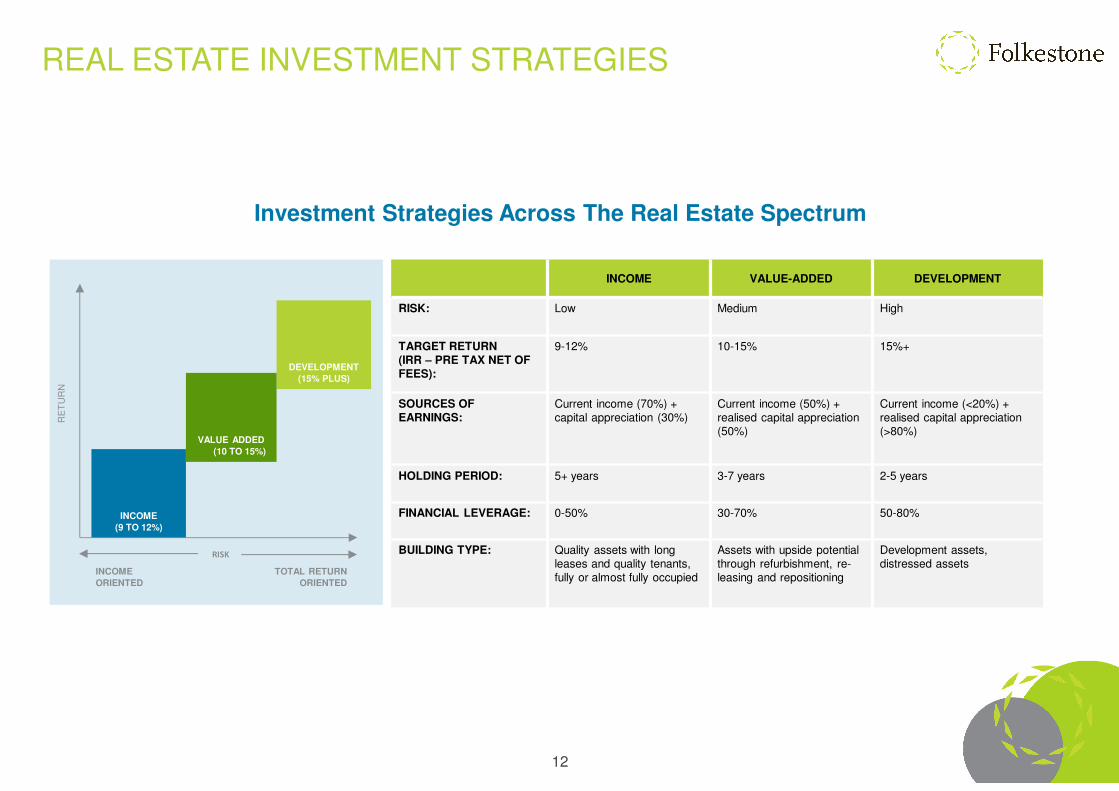
Investment Strategies Across The Real Estate Spectrum
INCOME VALUE-ADDED DEVELOPMENT
RISK: Low Medium High
TARGET RETURN (IRR – PRE TAX NET OF FEES):
9-12% 10-15% 15%+
SOURCES OFEARNINGS:
Current income (70%) + capital appreciation (30%)
Current income (50%) + realised capital appreciation (50%)
Current income (<20%) + realised capital appreciation (>80%)
HOLDING PERIOD: 5+ years 3-7 years 2-5 years
FINANCIAL LEVERAGE: 0-50% 30-70% 50-80%
BUILDING TYPE: Quality assets with long leases and quality tenants, fully or almost fully occupied
Assets with upside potential through refurbishment, re-leasing and repositioning
Development assets, distressed assets
REAL ESTATE INVESTMENT STRATEGIES
13
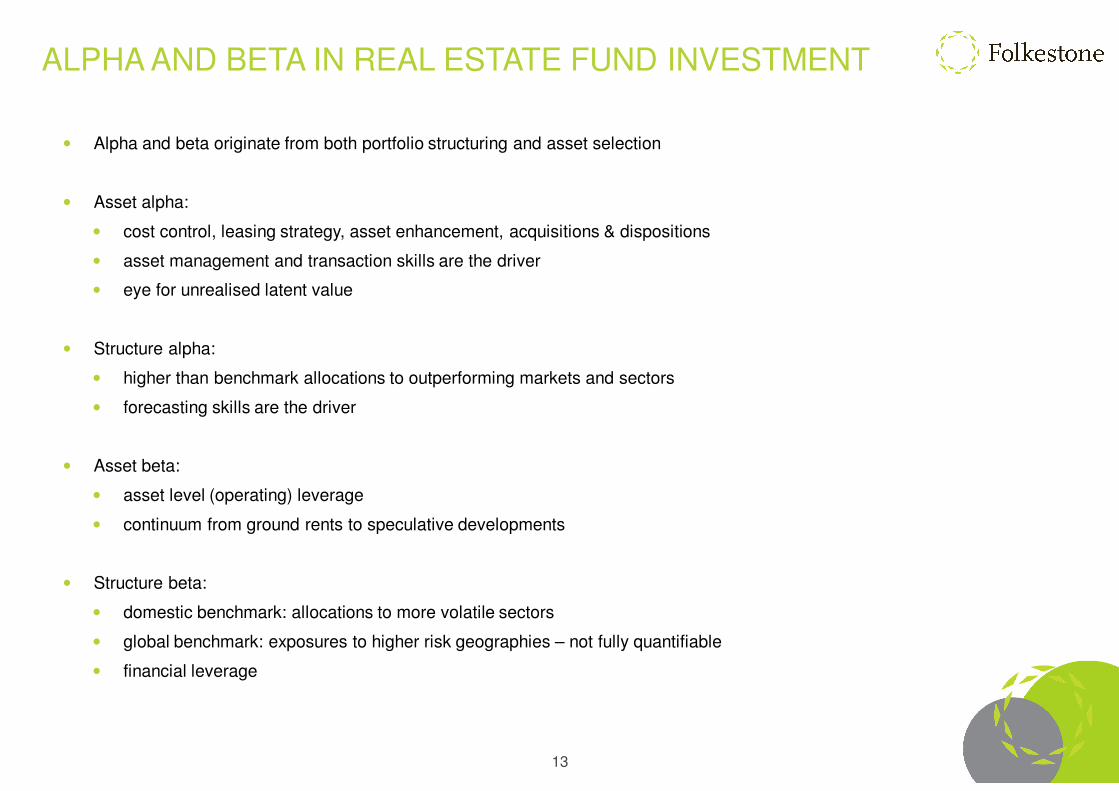
ALPHA AND BETA IN REAL ESTATE FUND INVESTMENT
• Alpha and beta originate from both portfolio structuring and asset selection
• Asset alpha:
• cost control, leasing strategy, asset enhancement, acquisitions & dispositions
• asset management and transaction skills are the driver
• eye for unrealised latent value
• Structure alpha:
• higher than benchmark allocations to outperforming markets and sectors
• forecasting skills are the driver
• Asset beta:
• asset level (operating) leverage
• continuum from ground rents to speculative developments
• Structure beta:
• domestic benchmark: allocations to more volatile sectors
• global benchmark: exposures to higher risk geographies – not fully quantifiable
• financial leverage

14
Portfolio Structure / Market Risk
Asset Risk
Accounting Policy
Fund Structure
SOURCES OF RISK AND RETURN IN REAL ESTATE FUNDS
• Market risk:
• allocations to more volatile sectors
• macro / supply risks
• transparency, property rights
• Asset risk:
• asset level (operating) leverage
• risk continuum from ground rents to speculative developments
• age, structure
• income quality
• diversification
• Fund structure:
• financial leverage: floating rate/fixed rate debt, collateralization
• vehicle characteristics: age, structure, fees/costs (alignment), fiscal efficiency
• public market volatility if listed
• Accounting policy:
• treatment of items e.g. mark-to-market valuations of interest hedging instruments, right off or capitalise costs incurred
Real Estate FundRisk & Return

15
YIELDS – THE SEARCH FOR INCOME
Source: Yield Report, Core Logic, RP Data, Credit Suisse, IRESS Folkestone
Investment Yields: 30 June 2018
• Non-residential property and A-REITs provide an attractive yield relative to other investments
0.0
1.0
2.0
3.0
4.0
5.0
6.0
7.0C
ash R
ate
10
Yea
rB
onds
ING
Dire
ctT
erm
De
posit
Syd
ney
Resid
ential
Aust
ralia
nE
quitie
s
A-R
EIT
s
Non
-R
esid
ential
Rea
l Est
ate
%
16
WHY UNLISTED REAL ESTATE IN THE PORTFOLIO?
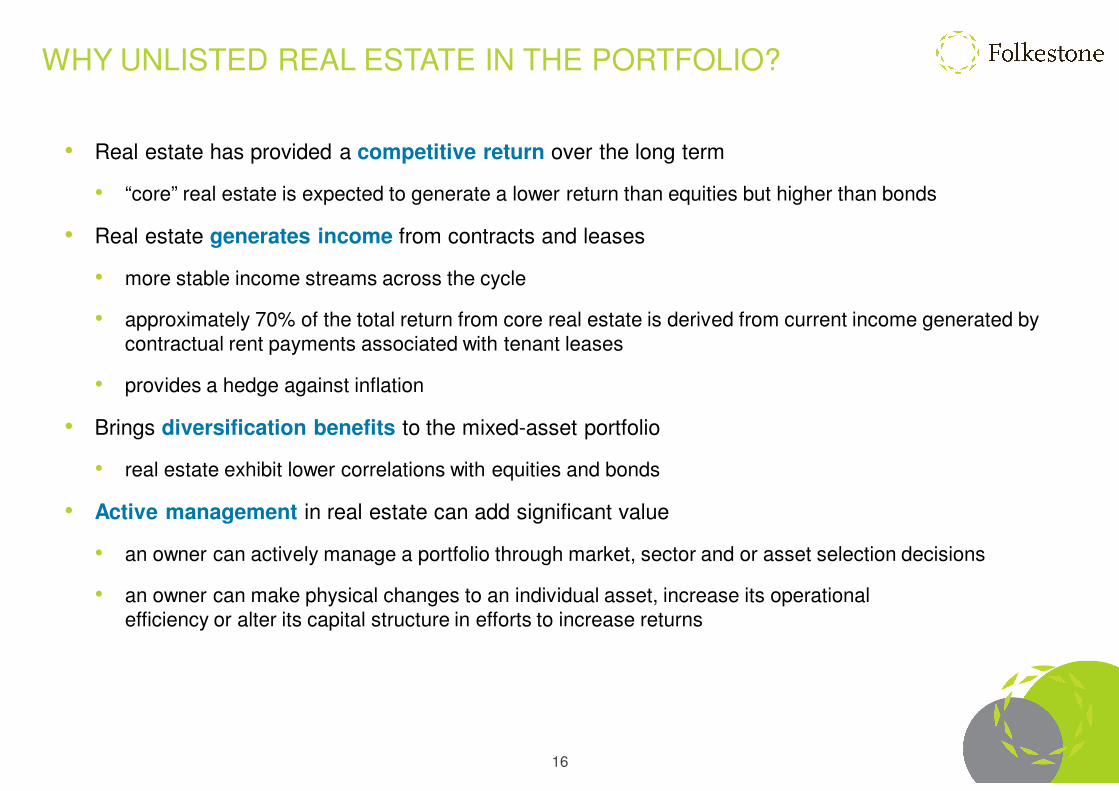
• Real estate has provided a competitive return over the long term
• “core” real estate is expected to generate a lower return than equities but higher than bonds
• Real estate generates income from contracts and leases
• more stable income streams across the cycle
• approximately 70% of the total return from core real estate is derived from current income generated by contractual rent payments associated with tenant leases
• provides a hedge against inflation
• Brings diversification benefits to the mixed-asset portfolio
• real estate exhibit lower correlations with equities and bonds
• Active management in real estate can add significant value
• an owner can actively manage a portfolio through market, sector and or asset selection decisions
• an owner can make physical changes to an individual asset, increase its operational efficiency or alter its capital structure in efforts to increase returns

17
NON-RESIDENTIAL REAL ESTATE PERFORMANCE
• Cap rates at record lows – difference between 2007 and now is spread between bond yields
1.0
2.0
3.0
4.0
5.0
6.0
7.0
8.0
9.0
10.0
11.0
12.0
Ma
r-95
Ma
r-96
Ma
r-97
Ma
r-98
Ma
r-99
Ma
r-00
Ma
r-01
Ma
r-02
Ma
r-03
Ma
r-04
Ma
r-05
Ma
r-06
Ma
r-07
Ma
r-08
Ma
r-09
Ma
r-10
Ma
r-11
Ma
r-12
Ma
r-13
Ma
r-14
Ma
r-15
Ma
r-16
Ma
r-17
Ma
r-18
%
Retail Office Industrial Other 10 Year Bond Yields
Lead up to GFC
Non-Residential Real Estate Yields: March 1995 – March 2018
Source: MSCI/PCA

18
NON-RESIDENTIAL REAL ESTATE PERFORMANCE
Drivers of Non-Residential Real Estate Investment Returns: 1995 - 2018
Source: MSCI
• Returns have been driven by cap rate compression rather than income growth
-15.0
-10.0
-5.0
0.0
5.0
10.0
15.0
20.0
Ma
r-95
Sep-9
5
Ma
r-96
Sep-9
6
Ma
r-97
Sep-9
7
Ma
r-98
Sep-9
8
Ma
r-99
Sep-9
9
Ma
r-00
Sep-0
0
Ma
r-01
Sep-0
1
Ma
r-02
Sep-0
2
Ma
r-03
Sep-0
3
Ma
r-04
Sep-0
4
Ma
r-05
Sep-0
5
Ma
r-06
Sep-0
6
Ma
r-07
Sep-0
7
Ma
r-08
Sep-0
8
Ma
r-09
Sep-0
9
Ma
r-10
Sep-1
0
Ma
r-11
Sep-1
1
Ma
r-12
Sep-1
2
Ma
r-13
Sep-1
3
Ma
r-14
Sep-1
4
Ma
r-15
Sep-1
5
Ma
r-16
Sep-1
6
Ma
r-17
Sep-1
7
Ma
r-18
Rolli
ng A
nnual R
etu
rns %
Income Return Captial Growth Total Return

19
NON-RESIDENTIAL REAL ESTATE PERFORMANCE
Asset Class Returns: Year to 31 March 2018
Source: MSCI/UBS
• Unlisted real estate funds the best performing asset class
-10
-5
0
5
10
15
20
25
Direct Property Unlisted Property Funds A-REITs Equities Bonds
(%)
Income Return Captial Growth
*
* Direct Property – PCA/IPD Australia Direct Property Index (excludes residential real estate)** Unlisted Property Funds – PCA/IPD Australia Unlisted Core Retail Fund Index
**

20
NON-RESIDENTIAL REAL ESTATE PERFORMANCE
Non-Residential Real Estate Sectors: Total Returns March 2017 and March 2018
• Other real estate – healthcare, carparks etc. outperformed in both 2017 and 2018
• Retail lagged for the 2nd year in a row
Source: MSCI
0
5
10
15
20
Ma
r-17
Ma
r-18
Ma
r-17
Ma
r-18
Ma
r-17
Ma
r-18
Ma
r-17
Ma
r-18
Ma
r-17
Ma
r-18
All Retail Office Industrial Other
12 M
onth
Retu
rn (
%)
Income Return Captial Growth

21
0.0 5.0 10.0 15.0 20.0
North Sydney - Office
Parramatta - Office
North Ryde - Office
Sydney - CBD Office
Rest of Australia - Office
Melbourne - CBD Office
Rest of Australia - Non-CBD Office
Sydney - Industrial
Canberra Region - Office
New South Wales - Retail
Melbourne - Industrial
Victoria - Retail
South Australia - Retail
Brisbane - CBD Office
Brisbane Fringe - Office
Brisbane - Industrial
Queensland - Retail
Western Australia - Retail
Rest of Australia - Industrial
Perth - CBD Office
%
0.0 5.0 10.0 15.0 20.0
Parramatta - Office
Sydney - Industrial
North Sydney - Office
Sydney - CBD Office
North Ryde - Office
Melbourne - CBD Office
Rest of Australia - Office
Rest of Australia - Non-CBD Office
New South Wales - Retail
Melbourne - Industrial
Victoria - Retail
Western Australia - Retail
Brisbane Fringe - Office
Canberra Region - Office
Brisbane - Industrial
Rest of Australia - Industrial
Queensland - Retail
South Australia - Retail
Brisbane - CBD Office
Perth - CBD Office
% p.a.
Annualised Total Returns:5 Years to 31 March 2018
Total Returns:1 Year to 31 March 2018
Source: MSCI/IPD
Non-Residential Real Estate Markets: Total Returns March 2017 and March 2018
Office Retail Industrial
NON-RESIDENTIAL REAL ESTATE PERFORMANCE

22
LISTED VS DIRECT REAL ESTATE
-60.0
-40.0
-20.0
0.0
20.0
40.0
60.0
Ma
r-96
Ma
r-97
Ma
r-98
Ma
r-99
Ma
r-00
Ma
r-01
Ma
r-02
Ma
r-03
Ma
r-04
Ma
r-05
Ma
r-06
Ma
r-07
Ma
r-08
Ma
r-09
Ma
r-10
Ma
r-11
Ma
r-12
Ma
r-13
Ma
r-14
Ma
r-15
Ma
r-16
Ma
r-17
Ma
r-18
Rolli
ng A
nnual T
ota
l R
etu
rn (
%)
Property A-REITs Equities
Total Returns: 1996 - 2018
Source: MSCI/IPD
* Direct Property – PCA/IPD Australia Direct Property Index (excludes residential real estate)
• Direct real estate is less volatile than listed real estate – in part due to the less frequency of valuation
23
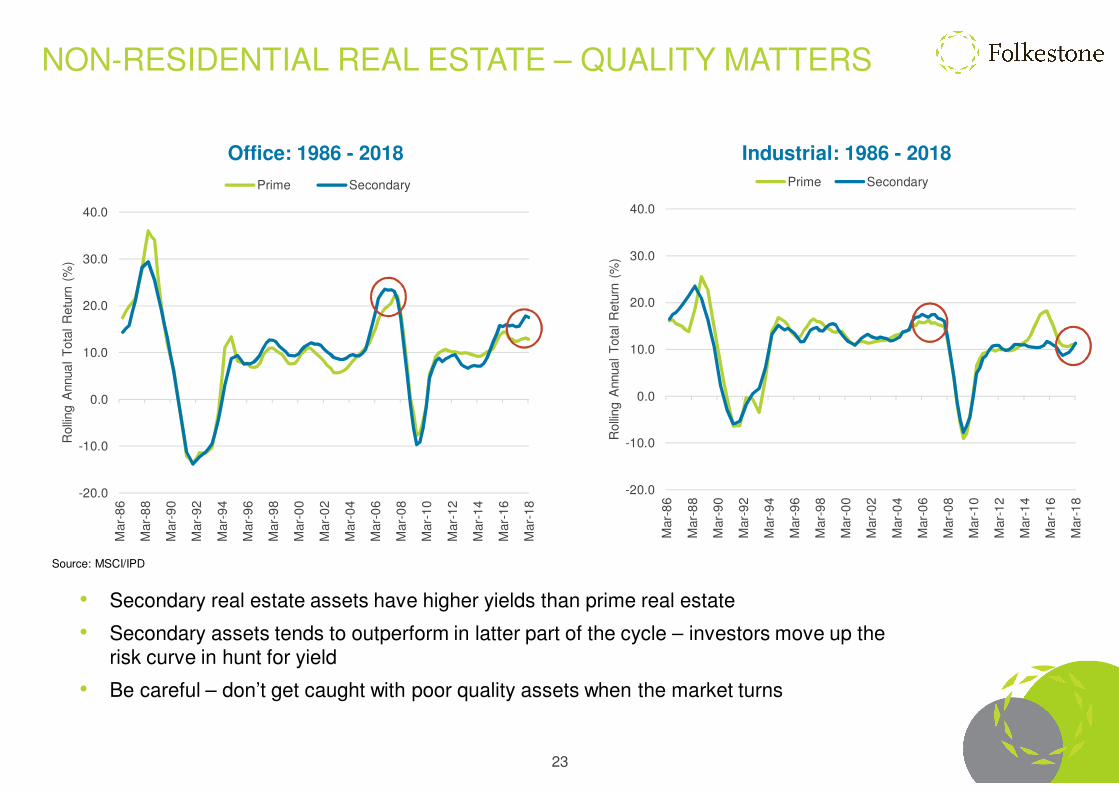
NON-RESIDENTIAL REAL ESTATE – QUALITY MATTERS
-20.0
-10.0
0.0
10.0
20.0
30.0
40.0
Mar-
86
Mar-
88
Mar-
90
Mar-
92
Mar-
94
Mar-
96
Mar-
98
Mar-
00
Mar-
02
Mar-
04
Mar-
06
Mar-
08
Mar-
10
Mar-
12
Mar-
14
Mar-
16
Mar-
18
Rolli
ng A
nnua
l T
ota
l R
etu
rn (
%)
Prime Secondary
-20.0
-10.0
0.0
10.0
20.0
30.0
40.0
Mar-
86
Mar-
88
Mar-
90
Mar-
92
Mar-
94
Mar-
96
Mar-
98
Mar-
00
Mar-
02
Mar-
04
Mar-
06
Mar-
08
Mar-
10
Mar-
12
Mar-
14
Mar-
16
Mar-
18
Rolli
ng A
nnua
l T
ota
l R
etu
rn (
%)
Prime Secondary
Industrial: 1986 - 2018Office: 1986 - 2018
Source: MSCI/IPD
• Secondary real estate assets have higher yields than prime real estate
• Secondary assets tends to outperform in latter part of the cycle – investors move up the risk curve in hunt for yield
• Be careful – don’t get caught with poor quality assets when the market turns

24
CORRELATION OF RETURNS
Return Correlations to March 2018
Source: MSCI AU Real Estate Equities Gross in Local Currency, MSCI Australia Equities Index Gross in Local Currency, J.P. Morgan, GBI Global, Australia, Unhedged index in AUD, 7-10 Years, AUD, CPI: Eight Capital Cities
Market Sector / Asset Class
Retail Office Industrial OtherAll
PropertyMSCI AU Real Estate Equities
MSCI Australia Equities
Index
J.P. Morgan, GBI Global, Australia,
Unhedged index in AUD, 7-10 Years, AUD
CPI: Eight
Capital Cities
Retail 1
Office 0.66 1
Industrial 0.71 0.89 1
Other 0.42 0.69 0.62 1
All Property 0.77 0.98 0.91 0.64 1
MSCI AU Real Estate Equities
0.33 0.25 0.38 0.20 0.32 1
MSCI Australia Equities Index
0.24 0.09 0.13 0.14 0.13 0.61 1
J.P. Morgan, GBI Global, Australia, Unhedged index in AUD, 7-10 Years, AUD
-0.15 -0.22 -0.18 0.03 -0.23 0.04 -0.17 1
CPI: Eight Capital Cities 0.44 0.34 0.21 -0.07 0.36 -0.04 0.12 -0.01 1
Diversification Benefits of Real Estate

25
CHALLENGES FACING REAL ESTATE MANAGERS
Key Challenges Facing Private Real Estate Fund Managers: 2018
Source: Preqin (survey of 215 global real estate firms)
0 10 20 30 40 50 60 70
Valuations
Deal Flow
Interest Rates
Performance
Volatility/Uncertainty In Global Markets
Exit Environment
Fundraising
Regulation
Availability/Pricing Of Debt Financing
Fulfilling Investor Demands
Fee Pressure
%
• pricing and competition for assets have intensified – more difficult to deploy a growing pool of capital

26
UNLISTED REAL ESTATEFUNDS

27
UNLISTED REAL ESTATE FUNDS – LESSONS LEARNED
ISSUES PRE-GFC POST-GFC
Asset Quality Focus on higher yielding, lower quality assets rather than lower yielding, higher quality assets
Higher quality assets with longer term leases
Leverage Gearing above 50% with little or no head room in LVR and ICR covenant
Gearing between 30% - 50% with head room on LVR and ICR covenant
Distribution Higher yields sometimes due to propping up from higher payout ratios (sometimes greater than 100%) and/or financial engineering
Focus on income generation of the asset, sustainable payout ratio less than 100% of income and not using debt to drive higher distribution yield
Fees No alignment of interest, focus on up front fees and disposal rather than performance fees
Greater alignment with investors on fees with a focus on lower upfront and ongoing management fees (often based on net not gross assets) and a performance fee based on actual outperformance
Liquidity Often had daily/monthly/quarterly redemptions and roll over provisions at end of initial term with low hurdles
Limited or no liquidity during investment term, clearer mechanisms for rolling over funds at review date and a performance fee structure that incentivises the manager to wind up the fund early if in the best interest of investors
Manager Capability Lack of transparency and sometimes poor governance Managers focus on alignment of interest with investors, stronger corporate governance, higher quality reporting and often backed by an institutional manager or listed A-REIT

28
GOVERNANCE & TRANSPARENCY – UNLISTED FUNDS
Investors are more demanding of their managers when it comes to reporting, risk management processes,
governance and succession planning

29
SOLID AFTER TAX RETURNS
TRANSPARENCY
GOOD COMMUNICATION
ADHERENCE TO MANDATE
ALIGNMENT OF FEES
STRONG CORPORATE GOVERNANCE
SIMPLICITY
WHAT TO LOOK FOR IN A MANAGER?
30
LEVERAGE - CONSIDERATIONS
• Asset level considerations
• the point in the cycle - what is the likelihood of the asset’s price increasing or decreasing in the coming years
• location – how deep is the market if you want to exit, what are the supply and demand fundamentals?
• quality of the tenant covenants – what is the likelihood of tenant default?
• lease expiry profile – are there any vacancies or upcoming lease expiries?
• quality of an asset’s income streams – can the cashflow from the asset adequately cover the debt costs, what are the lease structures and rent review mechanisms in the leases?
• investment hold period – is the asset being held for short-term trading or long-term investment?
• impact on operational flexibility - cash flow escrows, deposit requirements, prepayment lockouts and penalties
• Structuring and managing debt considerations
• cost of debt - the higher the leverage, typically the higher the cost of the debt that the lender requires to compensatefor the increased leverage risk
• debt covenants – the maximum loan to value ratio and minimum interest cover ratios that the lender will require
• type of debt – interest only or principal and interest?
• source of debt – traditional bank lending or capital markets medium term notes, CMBS etc?
• capital stack – is the debt just senior “first ranking” or has the capital stack been layered to allow a combination of senior and mezzanine debt
• duration of the debt - short or long-term debt?
• hedging profile - how much of the debt is at fixed or variable interest rates?
31
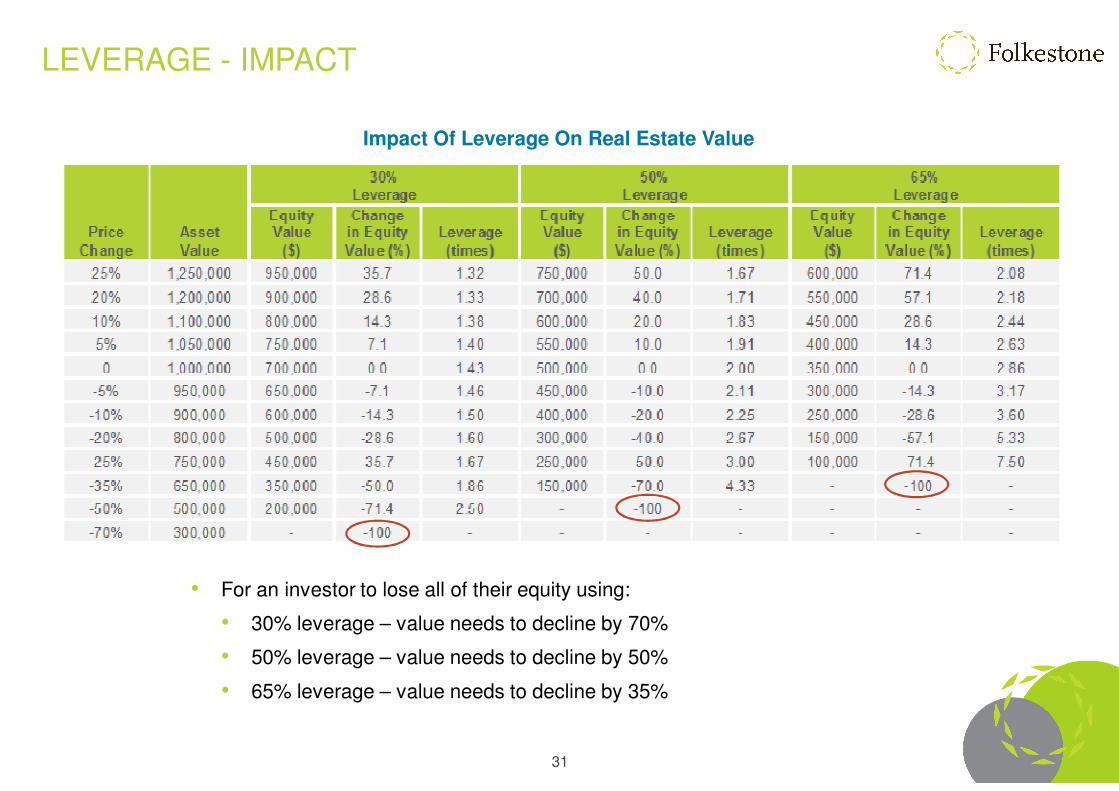
LEVERAGE - IMPACT
• For an investor to lose all of their equity using:
• 30% leverage – value needs to decline by 70%
• 50% leverage – value needs to decline by 50%
• 65% leverage – value needs to decline by 35%
Impact Of Leverage On Real Estate Value
32
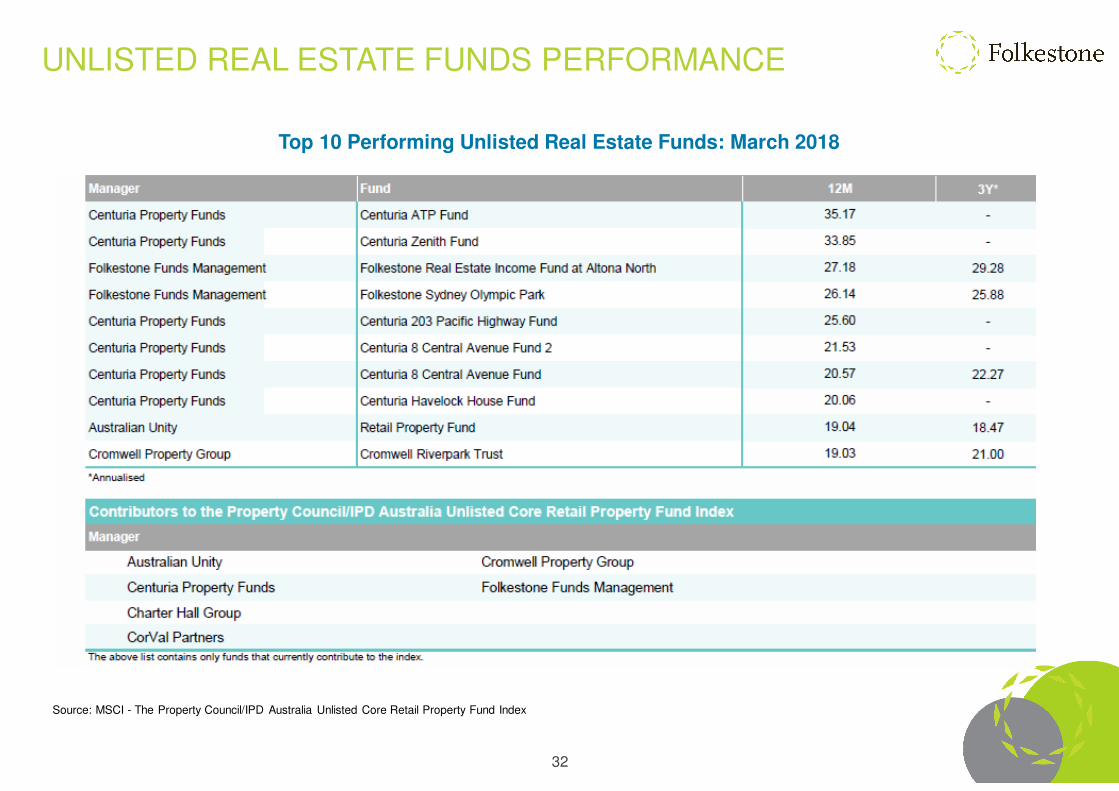
UNLISTED REAL ESTATE FUNDS PERFORMANCE
Top 10 Performing Unlisted Real Estate Funds: March 2018
Source: MSCI - The Property Council/IPD Australia Unlisted Core Retail Property Fund Index

33
• Real Estate & Capital Markets
• need to understand both real estate and capital markets
• capital structure is important – balance between debt and equity and investing across the capital stack
• capital flows at certain times in the cycle will overwhelm real estate fundamentals (its happening now)
• markets come unstuck when risk is not understood and therefore not priced appropriately
• Investors
• need to fully understand their risk and return profile
• want basic, transparent and true to label products
• need to understand that comparing funds and/or A-REITs based on 1st year yield does not guarantee it is a good product – real estate is a total return proposition and has a cycle!
• Managers
• must remember investors come first
• be transparent with investors – especially in relation to NTA and yield calculations
• need to always be looking ahead – what are the key drivers? what are the keys risks? - be prepared to adapt and change
LESSON’S FROM PAST - A GUIDE TO THE FUTURE

34
SUMMARY
• Investors should focus on quality non-residential assets with secure income
• Cap rates have followed interest rates down (and real estate values have gone up) – nearing end of compression cycle but cap rates should remain low while we remain in a lower for longer interest rate environment
• Direct real estate offers benefits for investors
• Unlisted real estate funds – quality managers, quality assets, transparency and low gearing
The challenge in the low interest environment is to avoid simply taking greater risk in the search for yield…
investors need to remain disciplined

35
FOLKESTONE REAL ESTATE IQ
Real Estate IQ provides our latest thinking on real estate to assist you in navigating the world of real estate markets and issues, to make more informed investment decisions.
Visit: www.folkestone.com.au/real-estate-iq/

36
DIRECTORYFOLKESTONE
ASX Code: FLK
Website: www.folkestone.com.au
ABN: 21 004 715 226
Level 14, 357 Collins StreetMelbourne VIC 3000T: +61 3 9046 9900
Level 10, 60 Carrington StreetSydney, NSW 2000T: +61 2 8667 2800
INDEPENDENT BOARD OF DIRECTORS
Garry SladdenNon-Executive Chairman
Mark BaillieNon-Executive Deputy Chairman
Greg Paramor AOManaging Director
Ross StrangNon-Executive Director
COMPANY SECRETARY
Scott MartinTelephone: +61 3 9046 9910
INVESTOR RELATIONS
Lula LiossiTelephone: +61 3 9046 [email protected]
REGISTRY
Boardroom Pty LimitedP.O. Box R67, Royal Exchange NSW 1223
Telephone: 1300 737 760 or +61 2 9290 9600 [email protected] www.boardroomlimited.com.au
DISCLAIMER:This presentation has been published for information purposes only. The information contained in this presentation is of a general nature only and does not constitute financial product advice. This presentation has been prepared without taking account of any person's objectives, financial situation or needs. Because of that, each person should, before acting on this presentation, consider its appropriateness, having regard to their own objectives, financial situation and needs. You should consult a professional investment adviser before making any decision regarding a financial product.
In preparing this presentation the author has relied upon and assumed, without independent verification, the accuracy and completeness of all information available from public sources or which has otherwise been reviewed in preparation of the presentation. The information contained in this presentation is current as at the date of this presentation and is subject to change without notice. Past performance is not an indicator of future performance.
Neither Folkestone Limited, nor any of their associates, related entities or directors, give any warranty as to the accuracy, reliability or completeness of the information contained in this presentation. Except insofar as liability under any statute cannot be excluded, Folkestone Limited and its associates, related entities, directors, employees and consultants do not accept any liability for any loss or damage (whether direct, indirect, consequential or otherwise) arising from the use of this presentation.
If a product managed by Folkestone Limited or its associates is acquired, Folkestone Limited or its associates and related entities may receive fees and other benefits. The author of this presentation does not receive commissions or remuneration from transactions involving the financial products mentioned in this presentation.


