57
PwC Golden Age Index Unlocking a potential $3.5 trillion prize from longer working lives www.pwc.com July 2018

PwC Golden Age Index Unlocking a potential $3.5 trillion prize from longer working lives
www.pwc.com
July 2018

PwC Golden Age Index
Contents
Contents
Key results from the Golden Age Index
Potential boost to GDP from longer working lives
Focus on: Automation and older workers
Focus on: Germany
Executive summary
Drivers of the employment for older workers
Comparison of key labour market indicators across the OECD
AppendicesAppendix 1: Methodology
Appendix 2: Bibliography
Appendix 3: Contacts
Page 4 Page 9 Page 16
Page 21 Page 26 Page 32
Page 38
Page 47
Page 53
Page 55
July 2018

PwC Golden Age Index
The potential $3.5 trillion prize from longer working lives
Between 2015 and 2050, the number of people aged 55 and above in OECD countries will grow by almost 50% to around 538 million. It is good news that we are living longer, but an ageing population is already putting significant financial pressure on health, social care and pension systems, and this will only increase over time.
To offset these higher costs, we think older workers should be encouraged and supported to remain in the workforce for longer. This would increase GDP, consumer spending power and tax revenues. It could also help to improve the health and wellbeing of older people by keeping them mentally and physically active.
We have developed our Golden Age index to quantify how far different economies are harnessing the power of their older workers. The index captures a broad range of indicators relating to the participation of older people in employment and training. We find that Iceland, New Zealand, Israel, Estonia and Sweden lead the OECD on this index, with large potential economic gains if employment rates for those over 55 could be raised to those of the top performers. Note that this year the Golden Age index includes an extra country - Latvia, which joined the OECD in 2016.
Specifically, across the OECD as a whole, we estimate that the potential long-term GDP gain from raising employment rates for those aged 55 and over to New Zealand levels could be around $3.5 trillion. Potential gains could be as high as 23% of GDP for Greece and 20% for Belgium.
We also consider trends in Germany in more detail in this year’s report. While progress has been made over time in narrowing the gender gap in employment for 55-64 year olds, we estimate there could be a potential 10.1% (c.€298 billion) boost to Germany’s GDP in the long run if it could match New Zealand’s performance.
For governments across the OECD, the priorities include reforming pension systems and providing other financial incentives to encourage later retirement. This year, we take a closer look atthe drivers of employment rates for older workers. We find that financial incentives can explain people’s decision to stay employed, for example pension policy and family benefits, and that longer life expectancy is associated with longer working lives.
Automation poses both potential opportunities and challenges for older workers. AI technology can boost economic growth, generate more labour demand and support longer working lives (e.g. through use of digital platforms that allow older workers to market their skills more widely). However, our estimates suggest that older workers do face a higher risk of job automation compared to other age groups. Female older workers face a higher risk than male older workers over the next decade mainly because of their higher employment in clerical jobs.Measures to support lifetime learning and retraining for older workers will be critical to maximising the gains from these technologies.
For employers, flexible working and partial retirement options can pay dividends, as can redesign of factories, offices and roles to meet the changing needs and preferences of older workers.
We hope you find our analysis useful as a contribution to this important area of debate. Please do come back to us if you would like a more in-depth discussion of how we can help you to harness the power of older workers in your own organisation.
John HawksworthChief Economist, PwC UK
Petra RaspelsMember of the Management Board and Human Capital Leader, PwC Germany
Dr. Nicole ElertHead of Employment Law, PwC Germany
3July 2018

Executive summary
PwC Golden Age Index4

PwC Golden Age Index
Increasing the employment rates of older workers in the OECD to New Zealand levels could boost GDP by around $3.5 trillion in the long term
A geographically diverse group of relatively small economies occupy the top 3 places in our index
1st2nd 3rd
IcelandNew Zealand
Israel
$3.5 trillionOur analysis suggests the OECD could experience a potential long-run increase in GDP of c.$3.5 trillion by increasing older worker employment rates to New Zealand 1 levels.
Sources: PwC analysis, OECD
1 We have moved away from using Sweden as a benchmark as it has fallen to fifth place in our index whilst New Zealand is in second place after Iceland, where employment rates are extremely high and may be difficult to replicate for other OECD countries.
Countries with the highest older worker employment rates (55-64 year olds)…
$815bn $406bn $351bn(≈€298bn)
$322bn $245bn $123bn
…and the lowest rates
If OECD countries raised their older worker employment rates to New Zealand’s levels, they could experience a long-run boost to GDP of…
United States
Japan
GermanySpain
United Kingdom
FranceItaly
$194bn
Iceland New Zealand Sweden Luxembourg Greece Turkey
84%78% 76%
40%38%
34%
OECD average: 60%70%
Germany
7th
5July 2018

Germany shows the biggest improvement within the G7, climbing from rank 26 in 2003 to 14 in 2016
PwC Golden Age Index
Germany ranks 14th in this year's Golden Age Index, significantly improving its position from rank 25 in 2003.
14th* 21st
26th
20072003 2016
Employment rate of 55-64 year olds and 65-69 year olds
39%
51%
69%
6% 7%15%
2003 2007 2016
$351 billion (≈€298 billion)boost to long-run German GDP, which is equivalent to around
$22,929 (≈€19,478)per 55-69 year old from boosting employment rates
New ZealandGermany
70%78%
Germany still lags behind high performers such as New Zealand in terms of employment of 55-64 year olds (2017)
Germany is among the
top-10 OECD countries with regard to its employment rate of the 55-64 year olds.
*Note – out of 35 OECD countries
6July 2018

Successful policy measures of the top performers include:
PwC Golden Age Index
A flexible labour market that encourages and supports older workers is a key feature of top performers on our Golden Age Index
Some of the biggest risers on the index since 2003 have implemented strong labour market reforms targeted at older workers such as redesigning jobs to meet physical needs:
IsraelGermany New Zealand
+ 12 places
+ 10 places
+ 7 places
Pension policies
Life expectancy
Caring responsibilities
Key drivers of the employment of older workers include:
Increasing the retirement age
Supporting flexible working
Improving the flexibility of pensions
Further training and support for older workers to become ‘digital adopters’
Sources: PwC analysis, OECD
7July 2018

Public policy-makers and employers need to promote lifelong learning and retraining to help older workers adapt to the challenges of automation
PwC Golden Age Index
The percentage of jobs at risk of automation for older workers within the next ten years for some of the largest economies ranges from around 5% up to 30%, with an average of around 20%.
27%25%
24% 23%
18%
13%
8%
USA France Germany UK New Zealand Japan KoreaNewZealand
Percentage of jobs at potential risk of automation for 55+ years old over the next ten years
…compared with 26% of jobs for female older workers.
Up to 19% of jobs could be at risk of automation over the next decade for male older workers…
However, automation technologies can create new job opportunitiesfor older workers in new industries and new business models;
and through boosting economic growth.
Policy measures to lower the risk of job automation for older workers:
Invest in technology training for older workers
Engage policy makers and employers to retrain older workers to be more suited for jobs at lower risk of automation
Encourage lifelong learning and career development
1 2 3
Sources: PwC analysis, OECD
8July 2018

PwC Golden Age Index
Key results from the Golden Age index
9

Our Golden Age Index takes a holistic view of the labour market for older workers across the OECD, combining indicators into one comparable metric
PwC Golden Age Index
Labour market indicators Process Labour market indicators
The PwC Golden Age Index combines a broad range of labour market indicators as listed below with relative weights shown in brackets. Employment rates have the highest weights but other variables are included to present a more holistic picture:
• Employment rate 55–64 (40%)
• Employment rate 65–69 (20%)
• Gender gap in employment, 55–64: ratio women/men (10%)
• Incidence of part-time work 55–64 (10%)
• Full time earnings 55–64 relative to 25–54 (10%)
• Average effective exit age from the labour force (5%)
• Participation in training: ratio 55–64 to 25–54 (5%)
These indicators are normalised, weighted and aggregated to generate index scores for each country.
The index scores are on a scale from 0 to 100, with the average OECD value in the base year of 2003 set to 50. However, the average index values for 2007, 2015 and 2016 can be higher or lower than this 2003 baseline.
We can therefore compare how each country’s performance has evolved over time in absolute terms, as well as the relative performance of countries in a particular year.
See Appendix 1 for more details of the methodology.
All data are taken from the OECD.
We focus mostly on the 55–64 age group for data reasons. We do, however, include total employment rates for 65–69 year olds in the index and look at all workers over 55 in calculating potential boosts to GDP from higher employment rates for older workers.
The latest data available across the broad range of countries covered are for 2016, so this is the final year covered by the index.
10July 2018

Our Golden Age Index explores the economic prospects of older workers across 35 OECD countries over time
PwC Golden Age Index
Iceland and New Zealand continue to occupy the top two places, with Israel and Estonia outperforming Sweden this year. The Southern European countries including Turkey, Greece and Italy perform less strongly on the index.
Map 1: Golden Age Index rankings
18th
Canada
9th
US25th
Spain29th
Italy
32nd
Greece
1st
Iceland
14th
Germany
5th
Sweden
21st
UK
3rd
Israel
6th
Japan7th
Korea
17th
Australia
2nd
New Zealand
26th
France
Low GAI score
High GAI score
Sources: PwC analysis, OECD
4th
Estonia
11July 2018

PwC Golden Age Index: Key results Iceland, New Zealand, Israel, Estonia and Sweden take the top five places
PwC Golden Age Index
Sources: PwC analysis, OECD1 The PwC Golden Age Index 2018 edition uses 2016 data as the latest available data.
Estonia continues to rise up the rankings, having gained 4 places since 2003.
The UK’s relative ranking has fallen from 18th place to 21st since 2003, despite a gradual improvement in its absolute index score over time.
Germany has shown the greatest improvement of all OECD countries since 2003, increasing its score by 12 places.
The United States is now only the second highest G7 country in the list as Japan has seen a relatively strong increase in its score since 2015.
The Nordic countries continue to do very well as Iceland, Sweden and Norway all occupy a place in the top 10.
The East Asian countries in our index perform strongly, with both Korea and Japan making strong improvements in their absolute index scores and improving on their rankings since last year.
Ranking Country Raw Index Score2003 2007 2015 2016 2003 2007 2015 2016
1 1 1 1 Iceland 93.1 93.7 99.5 98.79 3 2 2 New Zealand 61.1 71.8 84.7 85.313 11 3 3 Israel 58.3 66.0 80.6 82.38 2 5 4 Estonia 63.7 73.9 78.8 81.83 4 4 5 Sweden 68.4 71.5 80.1 81.25 7 8 6 Japan 67.1 70.6 76.2 78.67 6 7 7 Korea 64.3 71.0 77.3 77.74 8 6 8 Norway 67.6 70.0 77.9 77.32 5 9 9 United States 69.0 71.0 75.0 75.914 12 10 10 Chile 57.4 66.0 72.1 74.511 15 13 11 Denmark 59.8 59.6 68.0 70.517 9 12 12 Latvia 48.6 67.7 68.5 70.410 14 11 13 Switzerland 60.9 63.0 71.2 70.426 21 15 14 Germany 36.9 47.6 66.2 68.016 16 14 15 Finland 51.2 58.5 66.4 66.812 10 18 16 Portugal 59.4 66.9 62.7 66.421 18 17 17 Australia 45.7 55.0 64.7 66.315 17 16 18 Canada 53.6 58.2 65.6 66.16 13 19 19 Mexico 64.7 65.7 62.5 63.222 23 22 20 Czech Republic 43.5 45.8 59.3 62.518 20 20 21 United Kingdom 47.8 51.1 61.4 62.119 19 21 22 Ireland 47.3 54.7 60.3 61.128 27 23 23 Netherlands 34.6 42.5 56.4 58.331 26 24 24 Austria 32.3 43.3 55.0 56.325 22 26 25 Spain 42.5 46.5 52.5 54.324 25 25 26 France 42.7 44.9 53.3 53.930 31 27 27 Hungary 32.3 36.1 51.1 53.433 33 29 28 Slovak Republic 29.7 35.4 48.6 51.929 29 28 29 Italy 32.9 36.6 49.5 51.527 35 30 30 Poland 35.5 32.2 48.0 50.135 30 31 31 Belgium 28.8 36.5 47.7 49.620 24 32 32 Greece 46.2 45.1 46.4 48.934 28 33 33 Slovenia 29.4 37.2 44.5 48.232 32 34 34 Luxembourg 30.0 35.4 41.1 38.823 34 35 35 Turkey 43.4 34.0 36.5 38.4
OECD Average 50.0 55.6 63.9 65.4
Sweden has slipped to 5th
position in the index this year, despite an absolute increase in performance.
Italy is the lowest ranking G7 country and has slipped by one position to 29th place this year.
Latvia has newly been added to the index and is in 12th position on the index.
12July 2018
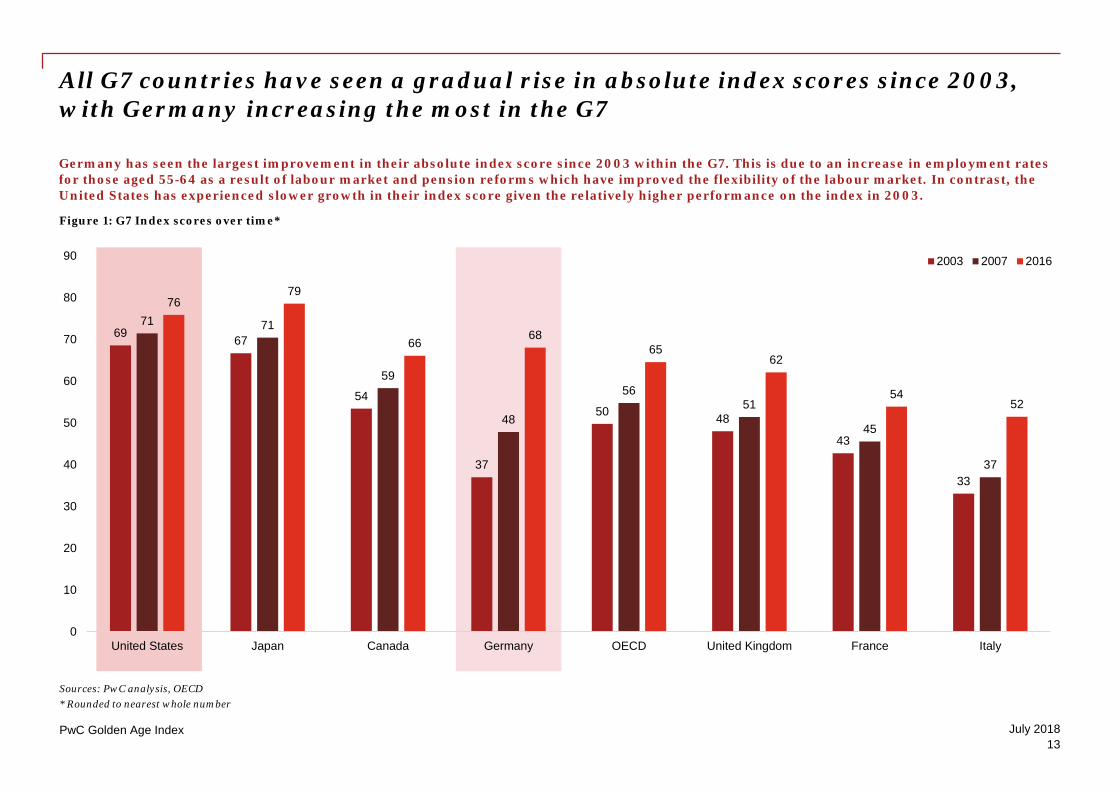
All G7 countries have seen a gradual rise in absolute index scores since 2003, with Germany increasing the most in the G7
PwC Golden Age Index
Germany has seen the largest improvement in their absolute index score since 2003 within the G7. This is due to an increase in employment rates for those aged 55-64 as a result of labour market and pension reforms which have improved the flexibility of the labour market. In contrast, the United States has experienced slower growth in their index score given the relatively higher performance on the index in 2003.
Figure 1: G7 Index scores over time*
Sources: PwC analysis, OECD* Rounded to nearest whole number
69 67
54
37
50 48
43
33
71 71
59
48
5651
45
37
7679
66 6865
62
5452
0
10
20
30
40
50
60
70
80
90
United States Japan Canada Germany OECD United Kingdom France Italy
2003 2007 2016
13July 2018

Germany, Israel and New Zealand have seen the biggest rise in the rankings between 2003 and 2016, while Mexico, Turkey and Greece have each fallen by over 10 places. Overall, the UK has seen a slight fall in its ranking.
PwC Golden Age Index
Sources: PwC analysis, OECD
Germany Israel New Zealand UK Mexico Greece Turkey
26th
14th
13th
3rd
9th
2nd
35th32nd19th
23rd20th6th18th
21st
14July 2018

GermanyIndex rank: 14
Enhancing incentives to remain in work longer and raising retirement ages have been key drivers for the rise of Germany in our index
PwC Golden Age Index
Sources: PwC analysis, OECD
26th
2003
The German labour force has been experiencing structural changes over the last decade. Workers in Germany benefit from a generous pay-as-you-go public pension scheme, with relatively low retirement ages when compared to other OECD countries. However, recent labour market and pension reforms have improved work incentives for older works. These changes, coupled with increased reduced gender disparity in participation rates (Dietz and Walwei 2011), have resulted in greater participation of older German workers (Dlugosz et al 2013).
In particular, several policies have driven the increase in older workers:
• The ‘Hartz reforms’ (2003–2006) aimed to increase work incentives for people with low earnings potential. Maximum entitlement periods for unemployment benefit were substantially reduced, especially for the older unemployed from a maximum of 32 months to 18 months.
• Regional employment pacts have been launched to ensure better employment for older workers. These have used a wide range of different policies and activities including profiling, assessments, special training measures, internships in companies, placement activities and publicity campaigns to raise awareness of the benefits of working later in life.
• The age of retirement has been gradually increasing since 2012 and will reach 67 by 2029, increasing the overall time that employees remain in employment and participation. For instance, early retirement options were mostly used by low skilled and industrial older workers (OECD 2006), increased employment rate of these workers due to reduced opportunities to retire following pension reforms may also contribute to the positive trend seen in the labour force participation of workers aged 55 and above over the last decade.
21st 15th
14th
2007 2015 2016
Golden Age Index ranking
39
51
6670
4751
58 60
0
10
20
30
40
50
60
70
80
2003 2007 2016 2017
Empl
oym
ent r
ates
55-
64, %
Germany OECD Average
15July 2018

PwC Golden Age Index
Potential long-run boost to GDP from longer working lives
16

We estimate how much countries could gain from boosting the employment rates of older workers to levels in New Zealand, one of the top performers
PwC Golden Age Index
There is a large variation in the employment rates of older workers (Full Time Equivalent rates) across the OECD countries, ranging from around 30–40% in many of the Southern European countries, to over 60% in many of the Nordic countries. Therefore, there is scope for many OECD countries to improve the economic prospects of their older workers.
Source: OECD1 We use the latest annual available data for full-time equivalent employment rates for 55–64 year
olds across the OECD.
New Zealand’s Full Time Equivalent employment rates, 2017
New Zealand
OECD
Em
plo
ymen
t rat
es
17%
8%
65+ year olds55-64 year olds
69%
52%
Publicservices
Culture
Flexibleworking
Low prevalence of age discrimination driven by a ‘culture of inclusion’ supported by HR practices of organisations that boost the employability of older workers, encouraging working later in life.
Flexible working patterns are commonplace within New Zealand. A factor that has driven an increase in participation for older workers is the increasing availability of part-time work, a structural shift that is valued by many older workers.
New Zealand’s Superannuation (NZS) public policy of benefits for the elderly which simultaneously discourage early withdrawal and rewards those who continue to work beyond the age at which workers are eligible for pensions has improved incentives to work for the elderly.
Why does New Zealand score so highly?
We have moved away from using Sweden as our benchmark as it has fallen to fifth place this year in the rankings as other countries such as Estonia outpace Sweden’s improvements. We have chosen to use New Zealand as a benchmark as it is the second highest performer, after Iceland which is deemed a special case given very high employment rates that are not feasible for many OECD countries to match.
31%
Turkey
35%
Greece
47%
Italy46%
Spain
56%
Switerzerland
58%
Germany
44%
France
53%
UK68%
Sweden
Key:
55-64 FTE1 rates
Country
17July 2018

Increasing employment rates of those aged over 55 to match New Zealand levels could boost total OECD GDP by around $3.5 trillion in the long run
PwC Golden Age Index1 We focus on employment rates as they are the most important indicators in our index (70% weight including part-time/full-time split) and the ones most readily related to GDP.
The OECD could add around $3.5 trillion to total GDP if countries with lower employment rates1 among those aged over 55 increased their rates to New Zealand levels
• Our analysis provides an estimate of the broad order of magnitude of potential gains from raising older worker employment rates to match those of New Zealand and Sweden – our previous benchmark country.
• The potential GDP boost from increasing the employment rates to match those of New Zealand for 55–64 year olds and people aged 65+ varies significantly across countries, from around 2% in Korea to around 23% in Greece.
• Within the G7, the overall gain could be c.$2.4 trillion, with Italy and France having the potential for long-run increases in GDP of c.17% from moving towards New Zealand’s employment rates.
Countries that scored lower on the Golden Age Index have the most to gain in the long-run from increasing their employment rates to match those of New Zealand
• Greece could experience the largest increase in GDP of around 23%.
• For top scorers the gains are lower as their employment rates are likely to be quite close to New Zealand levels already.
Moving towards New Zealand levels, Germany could achieve an increase in GDP of around 10.1%
• Germany has consistently increased its employment rate among the 55–64 year olds since 2003, but there is still a gap with highest ranking New Zealand (70% for Germany, 78% for New Zealand in 2017). As for those aged 65+, the Germany's employment rate of 15% in 2016 was also lower than that of New Zealand (43%).
• By increasing its 55+ employment rates to New Zealand levels, Germany could increase its GDP by around €298 billion ($351 billion at 2017 values).
US
3%
Japan
2%
Korea
2%
23%
Belgium
20%
Slovenia
18%
$3.5 trillionPotential total OECD gain from matching New Zealand employment rates
Greece
$2.1 trillionPotential total OECD gain from matching to Swedishemployment rates
Belgium
15%
14%
Slovenia US Japan Korea
1%2%3%
13% New ZealandSweden
Key:
10%
Germany
4%
18July 2018

0
5
10
15
20
25
Gre
ece
Bel
gium
Slov
enia
Ital
y
Fran
ce
Luxe
mbo
urg
Spai
n
Aus
tria
Pola
nd
Net
herl
ands
Hun
gary
Turk
ey
Slov
ak R
epub
lic
Port
ugal
Finl
and
Ger
man
y
Uni
ted
Kin
gdom
Irel
and
Latv
ia
Cze
ch R
epub
lic
Den
mar
k
Aus
tral
ia
Swit
zerl
and
Can
ada
Est
onia
Nor
way
Mex
ico
Uni
ted
Stat
es
Chi
le
Isra
el
Japa
n
Kor
ea
Swedish benchmark New Zealand Benchmark
Countries scoring lower on our Golden Age Index have the most to gain from boosting employment rates for those aged over 55 to New Zealand and Swedish levels
PwC Golden Age Index
Sources: PwC analysis, OECDNote: Iceland is excluded from the analysis as it has a higher employment rate of 55 + year olds than both New Zealand and Sweden.
Figure 2: Potential long-run GDP boost, %
KeyHigh GDP impact (>10%)Medium GDP impact (5.0–9.9%)Low GDP impact (< 5.0%)
22.8
20.0
18.217.3
16.5 16.215.7
14.614.0 13.6 13.1
11.711.5 11.3
10.710.1 9.3
9.28.4
7.9 7.6 7.5
6.04.9 4.8 4.4
2.7 2.52.1
8.9
6.5
3.5
19July 2018

The United States could increase its GDP by over $800bn by increasing the employment rate of its older workers to match New Zealand levels
PwC Golden Age Index
Sources: PwC analysis, OECDNote: Iceland is excluded from the analysis as it has a higher employment rate of 55 + year olds than New Zealand and Sweden.
Country Name Change in GDP ($ billions, 2016 prices)
using New Zealand levels
Change in GDP ($ billions, 2016 prices) using Swedish levels
United States 815 591
France 406 247
Germany 351 144
Italy 322 175
United Kingdom 245 105
Spain 194 116
Japan 123 90
Netherlands 106 59
Turkey 101 84
Canada 99 52
Australia 99 55
Belgium 94 64
Poland 66 43
Austria 57 35
Mexico 52 49
Switzerland 50 20
Country Name Change in GDP ($ billions, 2016 prices)
using New Zealand levels
Change in GDP ($ billions, 2016 prices) using Swedish levels
Greece 44 29
Korea 30 25
Ireland 28 16
Finland 25 11
Denmark 24 7
Portugal 23 12
Norway 18 4
Hungary 16 10
Czech Republic 16 7
Slovak Republic 10 7
Luxembourg 9 7
Chile 9 8
Israel 9 6
Slovenia 8 6
Latvia 2 1
Estonia 1 1
20July 2018

PwC Golden Age Index
Drivers of employment rate for older workers
21

We use an econometric approach to analyse drivers of the employment rate of older workers across the OECD
PwC Golden Age Index
Understanding the policies and incentives for continuing to work for longer are becoming increasingly important as we face ageing populations and increasing pressures on health and social care requirements. Our analysis explores the key drivers of labour participation amongst older workers, including structural factors such as life expectancy, financial incentives, as well as personal traits such as marital status. Note that there could be other factors that influence employment rate of older workers which have not been included in the econometric analysis due to limitations in the data available.
• We use a dynamic panel model to estimate the key drivers of the employment rate of older workers, using employment rate for the 55 to 64 age group as our dependent variable. Our dataset covers all 35 OECD countries over 17 years (2000-2016).
• Our approach exploits cross-country differences in the labour market for older workers across the OECD. Our approach is robust, as it accounts for a) potential reverse causalities where the employment rate for older workers influences one or more of the explanatory variables and b) endogeneity concerns (e.g. unobserved factors that are potentially correlated with labour market and policy variables).
• We model the drivers of employment as the function of a number of explanatory variables, as outlined on the right. The model accounts for country-specific characteristics (or ‘fixed effects’) that explain the employment rate for older workers and are constant over time.
• The dynamic panel model also tests whether the employment rate of older workers is persistent over time. Persistency (i.e. when the current employment rate is influenced by past employment rates) could be caused by policy and structural factors which take time to have an effect such as health policies which influence life expectancy, or pension policies which do not vary significantly unless there is major structural reform.
• Appendix 1 contains more details of our econometric specification, modelling approach and results.
Our approach Variables used in the econometric model
Gender participation gap
Marital statusPublic expenditure on
family benefits as a share of GDP
Annual average wage growth
Public pension expenditureLife expectancy
Dependent variable
Independent variables
Employment rate, 55-64 (% of age group)
Employment protection for temporary contracts
Other variables (e.g. training participation rate, share of public sector employment,
gender pay gap) were also considered for the
econometric model which were not
statistically significant (please see
appendix 1 for the long list)
22July 2018

The existing evidence suggests that both structural and policy factors can help explain the employment rate amongst older workers
PwC Golden Age Index
Life expectancy
Life expectancy is likely to have a positive impact on employment because the longer that people are expected to live, the more likely they are to spend more of their life working. Life expectancy also captures other factors which may influence the employment rate for older workers such as level of health which could be impacted by health care policies, medical advances and technological developments. Disney et al. (2006) suggests that health can influence the age at which a worker retires. Cai (2010) also finds a positive relationship between health and labour force participation.
Public pension expenditure as a share of GDP
Greater expenditure on pensions is expected to reduce the incentive for older workers to participate in work. Hurd, Michaud and Rohwedder (2012) find that increasing state pension wealth is associated with a lower retirement age. Gruber and Wise (2001; 2004) and Sousa-Poza (2009) also suggest pension generosity, which includes policies around state pension age, have substantial impacts on employment.
Annual average wage growth
The impact of wages on employment is ambiguous. On the one hand, economic theory suggests that higher wages should encourage greater levels of workforce participation. However, higher wages could also be associated with higher unemployment for older workers. This is because it is often easier for older workers to find alternative income to that from paid employment, such as pension or disability benefits. Halberg (2011) also finds that where employers’ payroll taxes are progressive with regards to age and wage, this means older workers are more costly so there is a greater incentive for employers to offer early retirement packages.
Marital status
Marriage may have a knock on impact on employment in older age if the spouse is assumed to have greater responsibility to take care of their partner or other relatives, decreasing availability for full-time employment (Hoskins, 1996). Hesselius (2009) analyses Swedish data to find that spouses’ retirement increases average sickness absence among women. Combined income from a family unit can be greater than an individual which could decrease the financial incentive to work for longer.
Public expenditure on family benefits as a share of GDP
Public expenditure on family benefits, including direct cash benefits and benefits in kind for childcare, may help explain a person’s choice to participate in the workforce for longer. Greater financial benefits for families can lower the financial burden for the parents and grandparents. Research on the impact of various other financial incentives show that they are a strong determinant of people’s retirement choices (IEA, 2014).
Gender participation gap
Lowering the barriers that prevent women from participating in the labour force is likely to improve the overall employment rate. The gender participation gap is an indicator of both the structural and policy factors which have impacted women’s decision to work. The continued support for women, for example during earlier years when they start a family, is likely to increase the amount of time they spend in the labour force after parental leave.
Employment protection for temporary contracts
Studies on effect of general employment protection laws and age discrimination laws have been mixed. Some studies argue that these laws negatively affect employment among older workers, as employers see older workers as a greater burden if they have greater protection, even though the intended effect is to help improve employment prospects for older workers (Heywood and Siebert, 2009). However, employment protection for part-time work has not been widely studied previously and may help older workers who decide part-time work is more suitable or are involuntary part-time workers.
23July 2018

Higher levels of public expenditure are associated with lower employment rates, while longer life expectancy is associated with higher employment amongst older workers
PwC Golden Age Index
Increases older worker employment rate
Countries with higher average wage growth tend to have lower employment rates for older workers. A 1pp increase in average wage growth rate is associated with a 5.09pp decrease in the employment rate for 55-64 workers.
Average annual wage growth
Reduces older worker employment rate
Countries with higher average life expectancy is associated with higher employment rate for older workers. A one year increase in life expectancy is associated with a 0.013pp increase in employment rate for 55-64 workers.
Life expectancy
Countries with higher levels of public pension expenditure are associated with lower employment rate in the 55 to 64 age category. A 1pp increase in public pension expenditure as a % of GDP is associated with a 0.95pp decline in the employment rate for older workers.
Public pension expenditure as a share of GDP
There is a negative relationship between the percentage of people in the 55-64 age group being currently married and employment rate within this age category. A 1pp increase in the proportion of married people in the 55-64 age group is associated with a 0.29pp decrease in the employment rate for older workers.
Marital status
Countries with higher levels of public expenditure on family benefits are associated with lower employment rate in the 55 to 64 age category. A 1pp increase in public expenditure on family benefits as a % of GDP is associated with a 0.95pp decline in the employment rate for older workers.
Public expenditure on family benefits as a share of GDP
Higher levels of employment protection for temporary contracts has a negative relationship with the employment rate for older workers. A 1 unit increase of the index used to measure strictness of employment protection of temporary contracts is associated with a 0.79pp decrease in the employment rate for older workers. This may reflect the fact that employment protection is not tailored to help older workers enough.
Employment protection of temporary contract
Limited effect
A lower gender participation gap does have an association with higher employment rate for 55-64 workers but is not statistically significant. This may be because the structural and policy factors which have helped close the gender participation gap has had limited impact for some of the older female workers who did not benefit from more recent policies compared to younger female workers.
Gender participation gap
Refer to the Appendix for results on statistical significance of variables
24July 2018
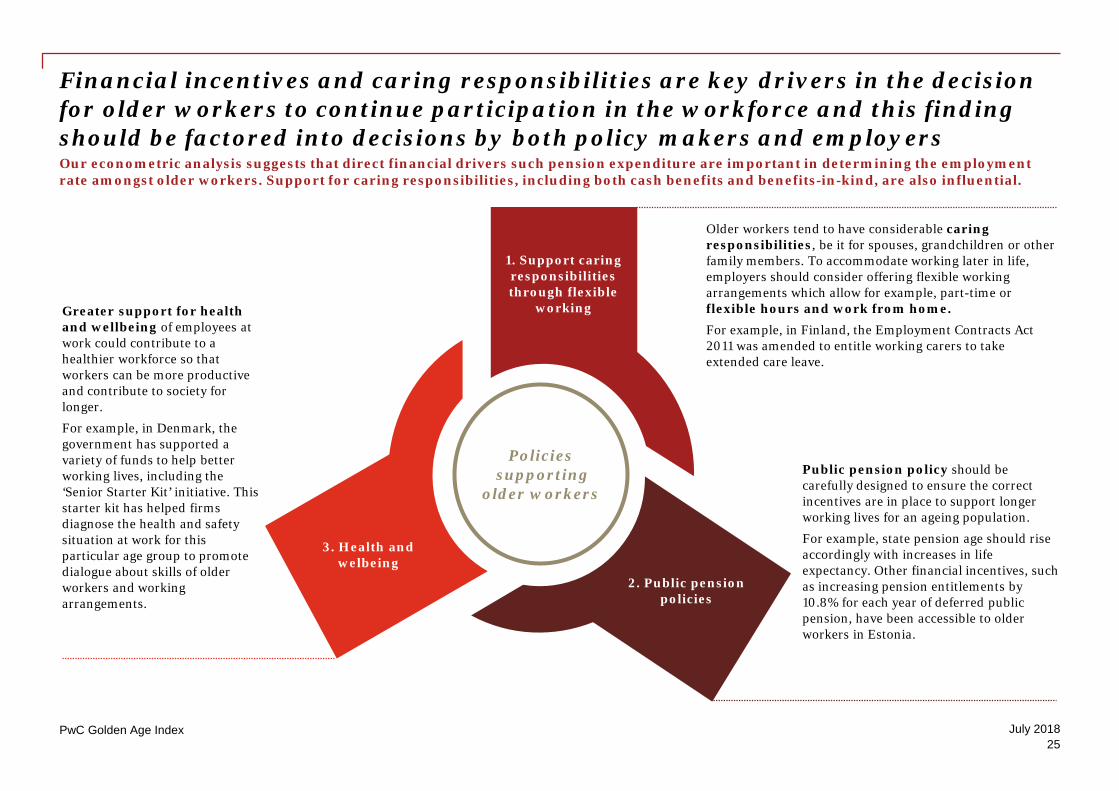
Financial incentives and caring responsibilities are key drivers in the decision for older workers to continue participation in the workforce and this finding should be factored into decisions by both policy makers and employers
PwC Golden Age Index
Our econometric analysis suggests that direct financial drivers such pension expenditure are important in determining the employment rate amongst older workers. Support for caring responsibilities, including both cash benefits and benefits-in-kind, are also influential.
Policiessupporting
older workers
1. Support caring responsibilities through flexible
working
3. Health and welbeing
2. Public pension policies
Older workers tend to have considerable caring responsibilities, be it for spouses, grandchildren or other family members. To accommodate working later in life, employers should consider offering flexible working arrangements which allow for example, part-time or flexible hours and work from home. For example, in Finland, the Employment Contracts Act 2011 was amended to entitle working carers to take extended care leave.
Public pension policy should be carefully designed to ensure the correct incentives are in place to support longer working lives for an ageing population.
For example, state pension age should rise accordingly with increases in life expectancy. Other financial incentives, such as increasing pension entitlements by 10.8% for each year of deferred public pension, have been accessible to older workers in Estonia.
Greater support for health and wellbeing of employees at work could contribute to a healthier workforce so that workers can be more productive and contribute to society for longer.
For example, in Denmark, the government has supported a variety of funds to help better working lives, including the ‘Senior Starter Kit’ initiative. This starter kit has helped firms diagnose the health and safety situation at work for this particular age group to promote dialogue about skills of older workers and working arrangements.
25July 2018

PwC Golden Age Index
Focus on: Automation and older workers
26

Technological advances, such as automation, are fundamentally changing the way we work – putting some jobs at risk whilst also creating many new opportunities and business models
PwC Golden Age Index
Recent analysis by PwC suggests that the biggest perceived driver of change to the world of work is technological innovation.
Sources: PwC (2017).1 These results are from a PwC survey of 10,000 members of the general population based in China, Germany, India, the UK and the US.
Figure 2: What will transform the way people work over the next 10-15 years?
53%
39%
36%
33%
26%
4%
13%
0 10 20 30 40 50 60
Technologybreakthrough
Resource scarcityand climate change
Shift in globaleconomic power
Demographicshifts
Rapidurbanisation
None of these
Don't know/not sure
As workforces become more diverse and people work for longer; traditional jobs and career models may soon become outdated. Many of the roles and job titles of the future may be ones we haven’t even thought of yet.
64% of people around the world believe that their job prospects will improve from the overall economic boost technology can provide.
64%
2 out of 5 people around the world believe that traditional employment won’t be around in the future. Instead, people will have their own ‘brands’ and sell their skills to those who need them.
44% of people around the world said that the most important thing in a job for them is job security.
27July 2018

Automation could impact up to 20% of jobs on average for older workers over the next decade
PwC Golden Age Index
Artificial intelligence is set to be a key source of transformation, disruption and competitive advantages in today’s fast changing economy. Over the past few years, fears of technology-driven job losses have intensified with advances in robotics, artificial intelligence and other digital technologies producing innovations which have the potential to replace the need for humans in many industries – driverless cars and trucks, intelligent virtual assistants and healthcare robots. So what are the implications for today’s older workers?
By the late 2020s, our analysis suggests that around 20% of jobs for older workers could be at risk of automation in many developed and developing countries1
• Recent PwC analysis has found that the potential jobs at high risk of automation within the next ten years could range from around 5-30% across many developed and developing countries.
• These estimates are based on an algorithm which links automatability to the characteristics of the tasks involved in different jobs and the characteristics of the workers doing them.
• The graph to the right illustrates the potential risk of automation to jobs within the next ten years currently held by older workers across various countries. The average risk across all countries and sectors is around 20% by the late 2020s. This is higher than the average risk (19%) across all age groups.
• In the UK, for example, up to 23% of jobs currently held by older workers could be displace by automation technology, in particular for its use in clerical support and simple decision making within the next decade. This potential risk is greater than the average for workers of all ages in the UK (20%).
• Looking even further into the future, expectations for technological advancements in physical labour and problem solving of dynamic real-world issues will further increase the risk associated with job automation to an average of 32% for older workers by the mid-2030s.
1 Average across Austria, Belgium, Chile, Cyprus, Czech Republic, Denmark, Finland, France, Germany, Greece, Ireland, Israel, Italy, Japan, Korea, Poland, Netherlands, Norway, Russia, Singapore, Slovenia, Slovakia, Spain, Sweden, Turkey, United States and United Kingdom.
21%+ risk for older workers
15%-20% for older workers
0%-14% risk for older workers
Median risk for older workers*
Risk for workers of all ages
Median risk for workers of all ages*
0%
5%
10%
15%
20%
25%
30%
35%
USA
Fran
ce
Pola
nd
Ger
man
y
UK
Net
herla
nds
Spai
n
Swed
en
Irela
nd
New
Zea
land
Sing
apor
e
Japa
n
Turk
ey
Gre
ece
Kore
a
Auto
mat
ion
risk
of w
orke
rs in
the
next
10
year
s
28July 2018
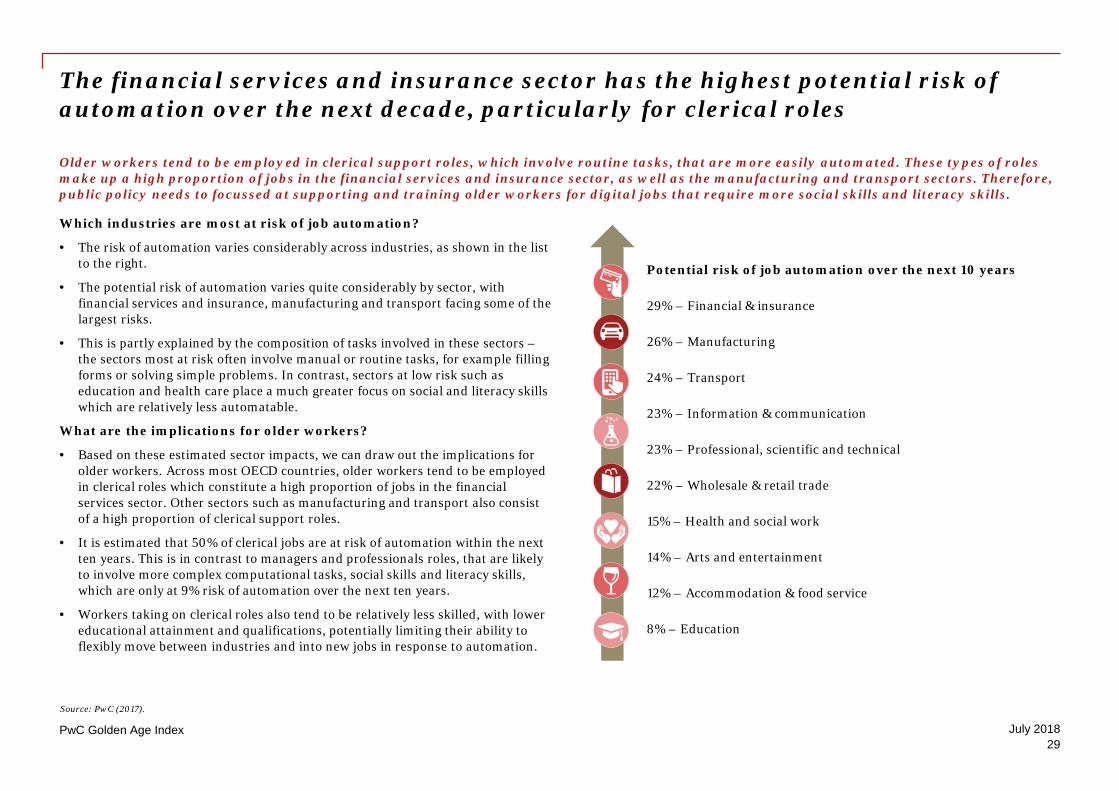
The financial services and insurance sector has the highest potential risk of automation over the next decade, particularly for clerical roles
PwC Golden Age Index
Which industries are most at risk of job automation?
• The risk of automation varies considerably across industries, as shown in the list to the right.
• The potential risk of automation varies quite considerably by sector, with financial services and insurance, manufacturing and transport facing some of the largest risks.
• This is partly explained by the composition of tasks involved in these sectors –the sectors most at risk often involve manual or routine tasks, for example filling forms or solving simple problems. In contrast, sectors at low risk such as education and health care place a much greater focus on social and literacy skills which are relatively less automatable.
What are the implications for older workers?
• Based on these estimated sector impacts, we can draw out the implications for older workers. Across most OECD countries, older workers tend to be employed in clerical roles which constitute a high proportion of jobs in the financial services sector. Other sectors such as manufacturing and transport also consist of a high proportion of clerical support roles.
• It is estimated that 50% of clerical jobs are at risk of automation within the next ten years. This is in contrast to managers and professionals roles, that are likely to involve more complex computational tasks, social skills and literacy skills, which are only at 9% risk of automation over the next ten years.
• Workers taking on clerical roles also tend to be relatively less skilled, with lower educational attainment and qualifications, potentially limiting their ability to flexibly move between industries and into new jobs in response to automation.
Potential risk of job automation over the next 10 years
29% – Financial & insurance
26% – Manufacturing
24% – Transport
23% – Information & communication
23% – Professional, scientific and technical
22% – Wholesale & retail trade
15% – Health and social work
14% – Arts and entertainment
12% – Accommodation & food service
8% – Education
Source: PwC (2017).
Older workers tend to be employed in clerical support roles, which involve routine tasks, that are more easily automated. These types of roles make up a high proportion of jobs in the financial services and insurance sector, as well as the manufacturing and transport sectors. Therefore, public policy needs to focussed at supporting and training older workers for digital jobs that require more social skills and literacy skills.
29July 2018

Older workers could be at greater risk of job automation compared to young workers, and older female workers could be at a greater risk compared to male counterparts over the next decade
PwC Golden Age Index
*Average across Austria, Belgium, Chile, Cyprus, Czech Republic, Denmark, Finland, France, Germany, Greece, Ireland, Israel, Italy, Japan, Korea, Poland, Netherlands, Norway, Russia, Singapore, Slovenia, Slovakia, Spain, Sweden, Turkey, United States and United Kingdom.
Automation is likely to impact older workers more than younger workers within the next ten years
• The average risk of automation for older workers is higher (21%) compared to young workers (18%) and core age group workers (18%).
• This could be explained by the differences in skills and educational attainment as the older workforce consist of a higher proportion of low education workers. Workers with lower levels of education are at higher risk of job automation as the roles that they are employed in are more easily automated (e.g. craft and trade work, services and sales work).
• Public policy should therefore focus on education and training of older workers to help them adapt to technological changes that they will experience.
Older female workers face a higher risk of job automation compared to their male counterparts within the next ten years
• Female workers have a higher risk of job automation compared to males for each age group. The risk for older female workers is 7pp higher than for older male workers.
• This can be explained by the higher proportion of older female workers in clerical roles compared to older male workers (13% compared to 4%), which could be associated with factors such as educational attainment or career breaks that may have impacted a female worker’s career opportunities in the past.
• Therefore, a focus on supporting older female workers transition from clerical roles to jobs in an automated workplace is essential for improving employment rates of older workers.
0% 5% 10% 15% 20% 25% 30% 35%
Young (<25)
Core (25-54)
Older (55+)
Average risk of automation within the next ten years*
0%
5%
10%
15%
20%
25%
30%
Young (<25) Core (25-54) Older (55+)
Ris
k of
aut
omat
ion
in th
e ne
xt te
n ye
ars
Males Females
30July 2018

Automation has the potential to boost economic growth from increased productivity and consumer demand, creating new jobs for older workers
PwC Golden Age Index
Economic growth from automation technology
• PwC analysis suggests that global GDP will be up to 14% higher in 2030 as a result of the accelerating development and take-up of AI. This is the equivalent of an additional $15.7 trillion.
• Economic growth will primarily be driven by:
1. Productivity gains from businesses automating processes (e.g. robots and autonomous vehicles)
2. Productivity gains from businesses augmenting their existing labour force with AI technology (i.e. assisted and augmented intelligence)
3. Increased consumer demand from the availability of personalised and/or higher-quality AI-enhanced products and services.
4. Spill-over effects of increased product demand on industries that are not directly affected by technological progress.
Potential opportunities for older workers
• Older workers have the opportunity to take advantage of the benefits that AI can bring. For example, process automation will mean that workers can focus on more productive tasks at work and also spend more time for skills training and learning about new technologies.
• AI is also likely to create new markets in personalised products, which can create new job opportunities in the design and production of these goods and services. Older workers can benefit from the increased labour demand in these new sectors.
• Advances in AI have, and will, also lead to supporting healthier and longer lives . For example, AI has potential in supporting faster and more accurate diagnoses and more personalised treatment which can save time and reduce the risk of illness and hospitalisation. This can improve health and well-being and save lives, meaning older workers are more likely to participate in the work force for longer.
Regional gain from the impact of AI
14.5% of GDP($3.7trillion)
North America
9.9% of GDP($1.8trillion)
Northern Europe 26.1% of GDP($7.0trillion)
China
10.4% of GDP($0.9trillion)
Developed Asia
5.6% of GDP($1.2trillion)
Africa, Oceania and other Asian
markets
11.5% of GDP($0.7trillion)
Southern Europe
5.4% of GDP($0.5trillion)
Latin America
31July 2018

PwC Golden Age Index
Focus on: Germany
32

Germany shows the biggest improvement within the OECD countries, climbing from rank 26 in 2003 to 14 in 2016
PwC Golden Age Index
Sources: PwC analysis, OECD
How has Germany performed?
• Germany has consistently improved its position since 2003. Since 2014 Germany scores above the OECD average on the Golden Age Index.
• The employment rate of the 55-64 year olds has increased strongly from 39% in 2003 to 66% in 2015 and 70% in 2017. By comparison, the average employment rate of all OECD countries only increased by 13 percentage points between 2003 and 2017.
3
4
1
3
Germany and average OECD index score over time
37
48
63 66 68
5055
60 63 64
0
10
20
30
40
50
60
70
80
2003 2007 2014 2015 2016
Gol
den
Age
Inde
x sc
ore
Germany OECD Average
Germany is among the top-10 OECD countries with regard to its employment rate of the 55-64 year olds.
Around a quarter of all 55-64 year olds worked part-time in 2016 (24%), which is 7 percentage points higher than the OECD average.
The employment rate of the 65-69 year olds lies significantly below OECD average (OECD average in 2016: 21% compared with 15% for Germany). By contrast, with its 70% employment rate (55-64 year olds), Germany ranks above OECD average (60%).
With 63 years, the average exit age is slightly below OECD average (64 years) in 2016.
1
3
2
4
33July 2018

Only a small proportion of employees aged 65 and above work in Germany;elderly part-time work is popular among a quarter of the 55-64 year olds
PwC Golden Age Index
39%
51%
66%70%
6% 7%14% 15%
0%
10%
20%
30%
40%
50%
60%
70%
80%
2003 2007 2015 2016
55-64 65-69
Comparison of employment rate 55-64 vs. 65-69
23%
24% 24% 24%
22%
23%
23%
23%
23%
23%
24%
24%
24%
24%
2003 2007 2015 2016
Incidence of part-time work, 55-64 (% of total employment)
Sources: PwC analysis, OECD
34July 2018

Employment of older workers in Germany has clearly improved over time
PwC Golden Age IndexSources: United Nations (2016), ONS (2016), DWP (2018)
The number of people aged over 50 is growing…(population in million)
More people are working later in life, but improvements have not kept pace with life expectancy
Companies have had positive experience with the employment of elderly employees: They are perceived as motivated, they
integrate well and can use their experience.
2003: 60.7 years
2016: 63.2 years
78.6 years
81.5 years
Surveys show positive feedback for elderly employees
Effective labour
force exit age
Life expectancy
Employment rate of 55-64 year olds in Germany compared with other OECD countries, 2017
64%
70%
73%
78%
UK
New Zealand
Japan
Germany
OECD: 60%
0
10
20
30
40
1995 2005 2015 2025
28.1 30.435.2
38.0
35July 2018

Boosting training is crucial to upskilling older workers and ensuring they continue to have relevant and effective skills for today’s workplace
PwC Golden Age Index
Incidence of training of German employees by age
Source: Eurostat
• Analysis of data from Eurostat for Germany suggests that – despite a rising trend – older workers are less likely to participate in training than younger employees, with only 44% of those aged between 55 and 64 having received training in the past 12 months.
• This might in part be due to negative stereotyping from employers who are not prepared to invest in the training of older workers as they anticipate they will exit the workforce sooner than younger workers. But in fact, studies have shown that the risk of an employee leaving a company after receiving training is the same across all age groups.
• Differences in the prevalence of training for older and younger workers might reflect variations in job and workplace characteristics, as younger employees with higher qualifications are more likely to work in industries that require more frequent training, such as banking and finance.
53%51%
47%
28%
57%
52% 52%
39%
57%55%
53%
44%
0
10
20
30
40
50
60
25-34 35-44 45-54 55-64
2007 2011 2016
Parti
cipa
tion
rate
in e
duca
tion
and
train
ing
(in %
)
Employee age
36July 2018

Progress has been made in removing obstacles to elderly employment, but challenges around training and recruitment remain
PwC Golden Age Index
• According to a recent PwC study, elderly employees in Germany (>55 years) are less in danger of being potentiallyaffected by automation that younger employees (<25 years), which could support the positive development ofelderly employment in future.
• It is also positive to see the narrowing of the gender gap in employment among 55-64 year olds from 0.7 in 2003 to0.9 in 2016 (see slide 42).
• However, although continued progress has been made with regard to the employment of those aged between 55 and 64 years in Germany, both politicians and organizations should focus on further increasing the employment rate.
• Measures introduced by the government like early retirement with 63 under certain circumstances will only hamper the positive development of the employment rate and further aggravate the impact of the ageing society in Germany on the labour market. In fact, the number of applications to enter early retirement at 63 has increased to over one million in April 2018 since the introduction of early retirement in 2014 in Germany. This figure is reported to exceed the 2014 forecast made by the Federal Government by over one quarter.
A focus on retaining elderly employees is indispensable
Retain
Retrain
Recruit
• It is important to support older workers in their current role, as leaving their job may discourage them to find other work or they may struggle to compete against younger workers.
• Businesses will benefit from a fall in turnover costs and recruiting new staff.
• Training for older workers tends to have a more narrow focus on their current role, as opposed to supporting wider development.
• Businesses should encourage older workers to learn new skills, such as those related to technology, in order to assist their work in an evolving workplace.
• Older workers can bring valuable seniority and experience to a role. Businesses should look beyond assumptions of retirement at a certain age when selecting candidates and encourage them to apply, offering them flexible work to match their preferences to support work.
• By offering flexible working policies, elderly women should be especially encouraged to apply for jobs.
Sources: ARD (2018), Rente mit 63 teurer als erwartet, https://www.tagesschau.de/inland/rente-253.htmlPwC (2018): Will robots really steal our jobs? An international analysis of the potential long term impact of automation
37July 2018

PwC Golden Age Index
Comparison of key labour market indicators across the OECD
38
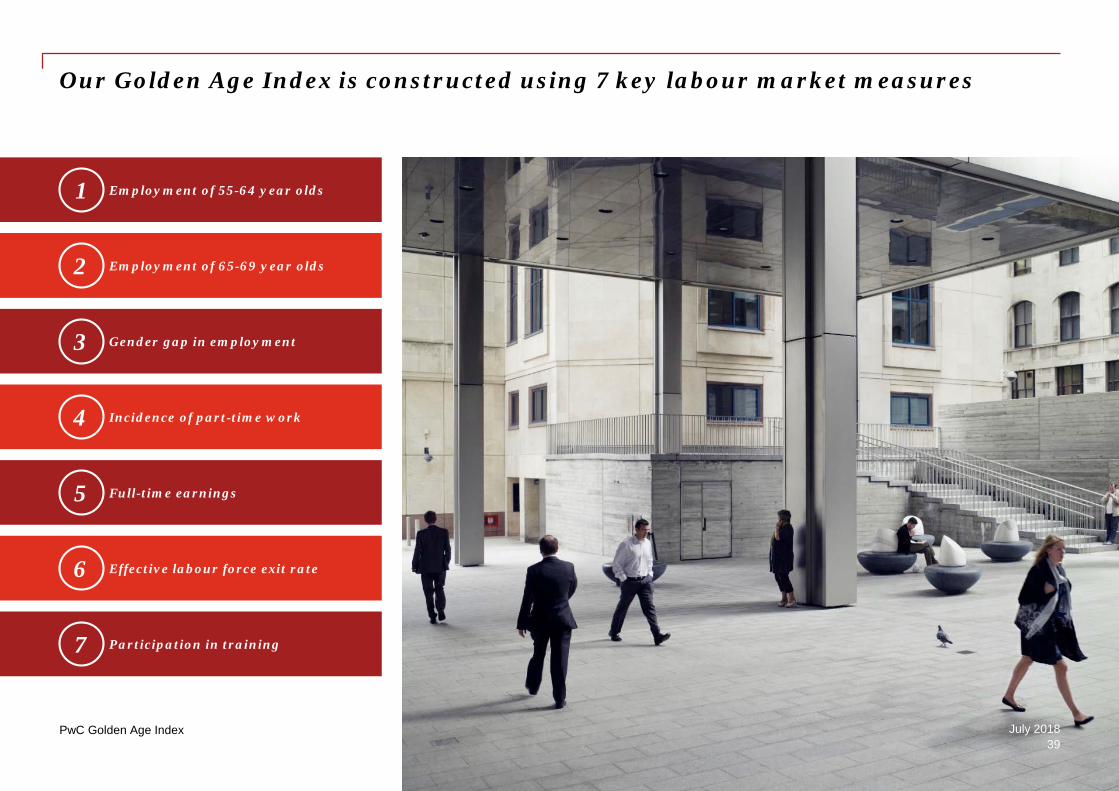
Our Golden Age Index is constructed using 7 key labour market measures
PwC Golden Age Index
Employment of 55-64 year olds
Incidence of part-time work
Gender gap in employment
Full-time earnings
Effective labour force exit rate
Participation in training
Employment of 65-69 year olds
1
2
3
4
5
6
7
39July 2018
0
10
20
30
40
50
60
70
80
90
Icel
and
New
Zea
land
Swed
en
Japa
n
Switz
erla
nd
Nor
way
Ger
man
y
Den
mar
k
Esto
nia
Kore
a
Isra
el
Net
herla
nds
Chi
le
Uni
ted
King
dom
Aust
ralia
Finl
and
Uni
ted
Stat
es
Latv
ia
Can
ada
Cze
ch R
epub
lic
Portu
gal
Irela
nd
Mex
ico
Slov
ak R
epub
lic
Italy
Hun
gary
Fran
ce
Aust
ria
Spai
n
Pola
nd
Belg
ium
Slov
enia
Luxe
mbo
urg
Gre
ece
Turk
ey
Empl
oym
ent r
ate
55-6
4 (%
)
2017 2016 2003
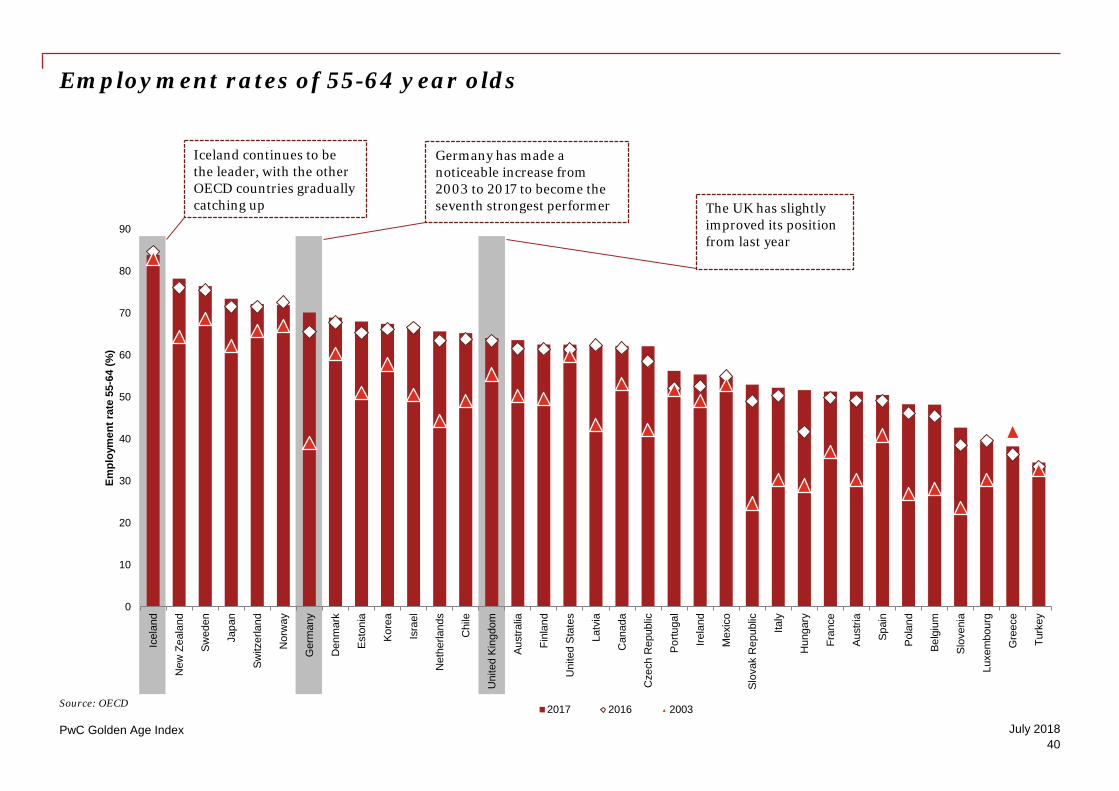
Employment rates of 55-64 year olds
PwC Golden Age Index
Source: OECD
Iceland continues to be the leader, with the other OECD countries gradually catching up
Germany has made a noticeable increase from 2003 to 2017 to become the seventh strongest performer The UK has slightly
improved its position from last year
40July 2018

Employment rates of 65-69 year olds
PwC Golden Age Index
Iceland continues to lead, improving on last year and exceeding Korea by over 10
percentage points
The UK continues to occupy a middling position despite improving by 8 percentage points in the 13 year period
Portugal has shown a marked decrease in their
employment rate of 65-69 year olds since 2003
0
10
20
30
40
50
60
Icel
and
Kore
a
Japa
n
New
Zea
land
Chi
le
Isra
el
Mex
ico
Esto
nia
Uni
ted
Stat
es
Nor
way
Aust
ralia
Can
ada
Swed
en
Switz
erla
nd
Uni
ted
King
dom
Latv
ia
Turk
ey
Irela
nd
Den
mar
k
Portu
gal
Ger
man
y
Finl
and
Net
herla
nds
Cze
ch R
epub
lic
Pola
nd
Italy
Gre
ece
Aust
ria
Fran
ce
Slov
ak R
epub
lic
Spai
n
Slov
enia
Belg
ium
Hun
gary
Luxe
mbo
urg
Empl
oym
ent r
ate
65-6
9 (%
)
2016 2015 2003
Germany has significantly improved its employment rate, but is still below the
OECD average
41July 2018

Gender gap in employment for 55-64 year olds
PwC Golden Age Index
Source: OECD
Some of the lowest ranking countries on the index have
made some of the largest improvements on this measure
The United Kingdom continues to improve on gender gap employment
Finland continues to lead after the gender gap in
Estonia widened from 2003
0,0
0,2
0,4
0,6
0,8
1,0
1,2
Finl
and
Esto
nia
Latv
ia
Swed
en
Fran
ce
Nor
way
Icel
and
Den
mar
k
New
Zea
land
Ger
man
y
Can
ada
Switz
erla
nd
Uni
ted
Stat
es
Uni
ted
King
dom
Isra
el
Aust
ralia
Portu
gal
Belg
ium
Slov
ak R
epub
lic
Spai
n
Slov
enia
Net
herla
nds
Cze
ch R
epub
lic
Japa
n
Aust
ria
Irela
nd
Hun
gary
Luxe
mbo
urg
Kore
a
Pola
nd
Italy
Gre
ece
Chi
le
Mex
ico
Turk
ey
Gen
der g
ap in
em
ploy
men
t, 55
-64
(rat
io)
2016 2015 2003
Germany continues to improve on gender gap employment
42July 2018
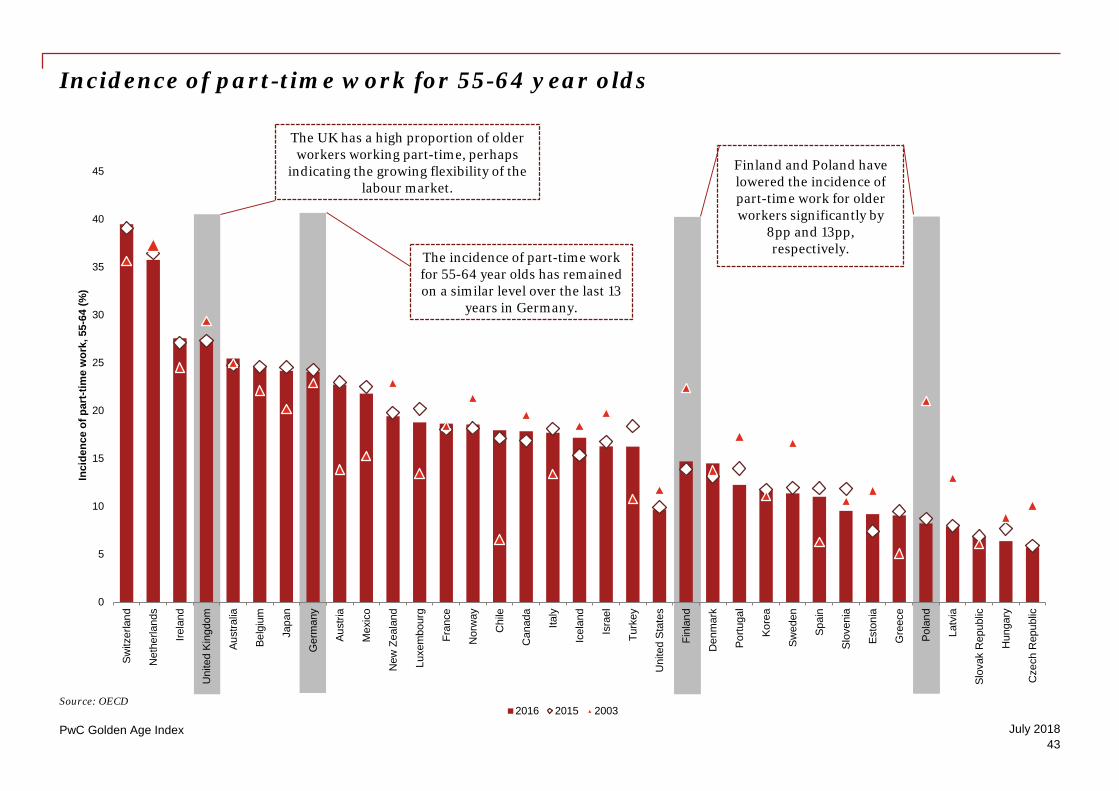
Incidence of part-time work for 55-64 year olds
PwC Golden Age Index
Source: OECD
The UK has a high proportion of older workers working part-time, perhaps
indicating the growing flexibility of the labour market.
Finland and Poland have lowered the incidence of part-time work for older workers significantly by
8pp and 13pp, respectively.
0
5
10
15
20
25
30
35
40
45
Switz
erla
nd
Net
herla
nds
Irela
nd
Uni
ted
King
dom
Aust
ralia
Belg
ium
Japa
n
Ger
man
y
Aust
ria
Mex
ico
New
Zea
land
Luxe
mbo
urg
Fran
ce
Nor
way
Chi
le
Can
ada
Italy
Icel
and
Isra
el
Turk
ey
Uni
ted
Stat
es
Finl
and
Den
mar
k
Portu
gal
Kore
a
Swed
en
Spai
n
Slov
enia
Esto
nia
Gre
ece
Pola
nd
Latv
ia
Slov
ak R
epub
lic
Hun
gary
Cze
ch R
epub
lic
Inci
denc
e of
par
t-tim
e w
ork,
55-
64 (%
)
2016 2015 2003
The incidence of part-time work for 55-64 year olds has remained on a similar level over the last 13
years in Germany.
43July 2018

Full-time earnings: ratio of 55-64 year olds relative to 25-54 year olds
PwC Golden Age Index
Source: OECD
The UK continues to perform below the OECD average.
Austria maintains its position at the top, with the smallest
difference between earnings of 25-54 and 55-64 year olds.
0,7
0,8
0,9
1,0
1,1
1,2
1,3
1,4
1,5
Aust
ria
Gre
ece
Portu
gal
Belg
ium
Fran
ce
Isra
el
Spai
n
Switz
erla
nd
Irela
nd
Ger
man
y
Uni
ted
Stat
es
Chi
le
Nor
way
Swed
en
Finl
and
Aust
ralia
Pola
nd
Icel
and
Den
mar
k
Mex
ico
Japa
n
Can
ada
Cze
ch R
epub
lic
Uni
ted
King
dom
New
Zea
land
Slov
ak R
epub
lic
Full-
time
earn
ings
55-
64 re
lativ
e to
25-
54 (r
atio
)
2016 2015 2003
Germany bettered its ratio of full-time earnings of 55-66 year olds relative
to 25-54 year olds.
Poland’s performance has notably worsened since 2003.
44July 2018
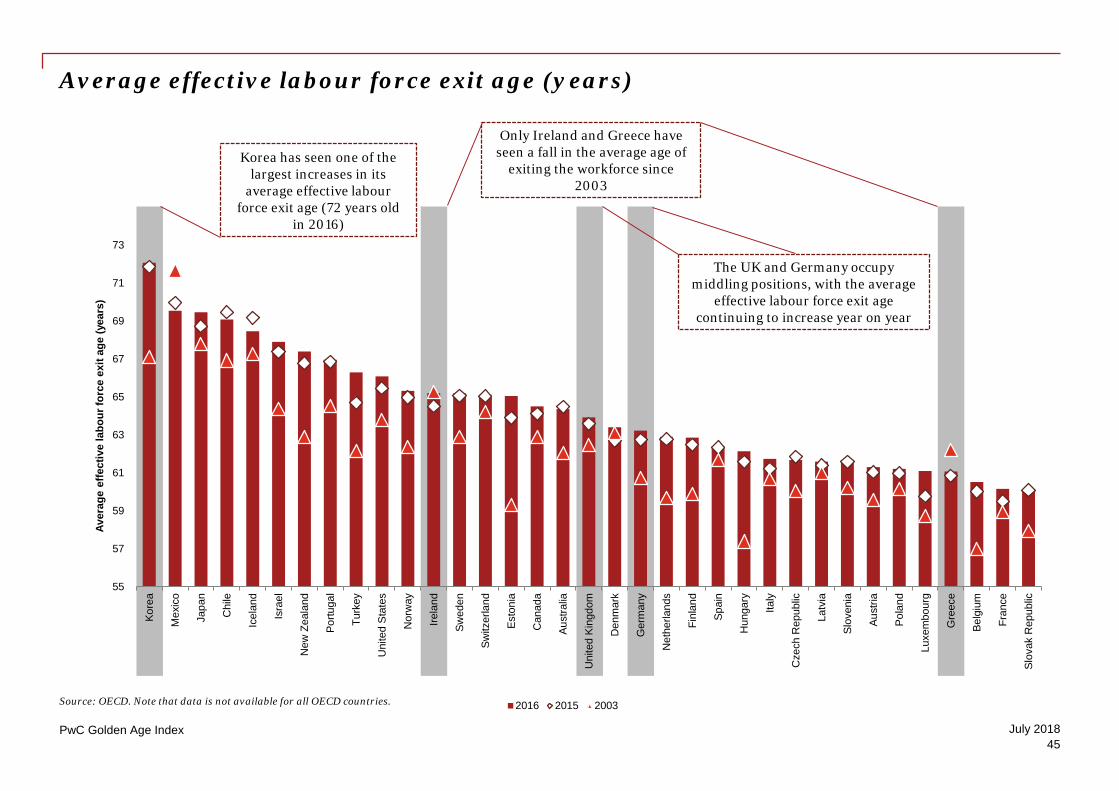
Average effective labour force exit age (years)
PwC Golden Age Index
Source: OECD. Note that data is not available for all OECD countries.
Korea has seen one of the largest increases in its
average effective labour force exit age (72 years old
in 2016)
Only Ireland and Greece have seen a fall in the average age of
exiting the workforce since 2003
55
57
59
61
63
65
67
69
71
73
Kore
a
Mex
ico
Japa
n
Chi
le
Icel
and
Isra
el
New
Zea
land
Portu
gal
Turk
ey
Uni
ted
Stat
es
Nor
way
Irela
nd
Swed
en
Switz
erla
nd
Esto
nia
Can
ada
Aust
ralia
Uni
ted
King
dom
Den
mar
k
Ger
man
y
Net
herla
nds
Finl
and
Spai
n
Hun
gary
Italy
Cze
ch R
epub
lic
Latv
ia
Slov
enia
Aust
ria
Pola
nd
Luxe
mbo
urg
Gre
ece
Belg
ium
Fran
ce
Slov
ak R
epub
lic
Aver
age
effe
ctiv
e la
bour
forc
e ex
it ag
e (y
ears
)
2016 2015 2003
The UK and Germany occupy middling positions, with the average
effective labour force exit age continuing to increase year on year
45July 2018

Participation in training for 55-64 year olds relative to 25-54 year olds
PwC Golden Age Index
Source: OECD1 Note: The data from Iceland, Switzerland and Hungary is taken from 2014 as this was the latest data available.
The US leads the pack for training older workers with a ratio of 0.9 relative to 25-54
year olds
Greece and Portugal have made significant improvements but are still
lagging behind the OECD average
The UK occupies a middling position despite improving the participation in training ratio for older workers during
the 12 year period
0,0
0,2
0,4
0,6
0,8
1,0
1,2
Icel
and
Uni
ted
Stat
es
Cze
ch R
epub
lic
Isra
el
Switz
erla
nd
New
Zea
land
Esto
nia
Slov
enia
Swed
en
Den
mar
k
Finl
and
Aust
ralia
Slov
ak R
epub
lic
Uni
ted
King
dom
Irela
nd
Belg
ium
Italy
Can
ada
Net
herla
nds
Hun
gary
Ger
man
y
Nor
way
Pola
nd
Luxe
mbo
urg
Spai
n
Chi
le
Aust
ria
Japa
n
Kore
a
Fran
ce
Gre
ece
Portu
gal
Turk
ey
Part
icip
atio
n in
trai
ning
, 55-
64 (r
elat
ive
to 2
5-54
yea
r old
s)
2016 2015 2003
Germany has improved its participation in training
ratio over the last 13 years.
46July 2018

PwC Golden Age Index
Appendix 1: Methodology
47
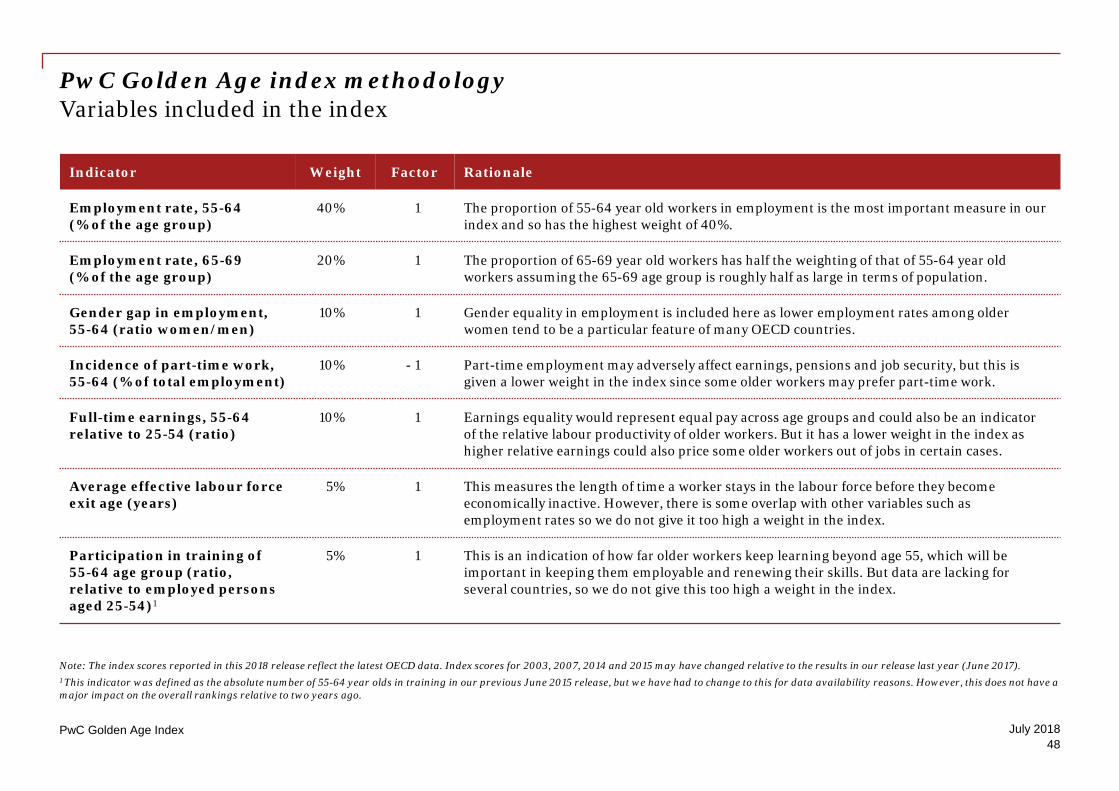
PwC Golden Age index methodologyVariables included in the index
PwC Golden Age Index
Indicator Weight Factor Rationale
Employment rate, 55-64(% of the age group)
40% 1 The proportion of 55-64 year old workers in employment is the most important measure in our index and so has the highest weight of 40%.
Employment rate, 65-69 (% of the age group)
20% 1 The proportion of 65-69 year old workers has half the weighting of that of 55-64 year old workers assuming the 65-69 age group is roughly half as large in terms of population.
Gender gap in employment, 55-64 (ratio women/men)
10% 1 Gender equality in employment is included here as lower employment rates among older women tend to be a particular feature of many OECD countries.
Incidence of part-time work, 55-64 (% of total employment)
10% - 1 Part-time employment may adversely affect earnings, pensions and job security, but this is given a lower weight in the index since some older workers may prefer part-time work.
Full-time earnings, 55-64 relative to 25-54 (ratio)
10% 1 Earnings equality would represent equal pay across age groups and could also be an indicator of the relative labour productivity of older workers. But it has a lower weight in the index as higher relative earnings could also price some older workers out of jobs in certain cases.
Average effective labour force exit age (years)
5% 1 This measures the length of time a worker stays in the labour force before they become economically inactive. However, there is some overlap with other variables such as employment rates so we do not give it too high a weight in the index.
Participation in training of 55-64 age group (ratio, relative to employed persons aged 25-54)1
5% 1 This is an indication of how far older workers keep learning beyond age 55, which will be important in keeping them employable and renewing their skills. But data are lacking for several countries, so we do not give this too high a weight in the index.
Note: The index scores reported in this 2018 release reflect the latest OECD data. Index scores for 2003, 2007, 2014 and 2015 may have changed relative to the results in our release last year (June 2017). 1 This indicator was defined as the absolute number of 55-64 year olds in training in our previous June 2015 release, but we have had to change to this for data availability reasons. However, this does not have a major impact on the overall rankings relative to two years ago.
48July 2018

PwC Golden Age index methodologyHow does it work?
PwC Golden Age Index
We used a standard method to construct this index, similar to the one used in the PwC Women in Work, Young Workers and ESCAPE indices, and by many other researchers constructing such indices.
2Apply positive/negative factor
Positive/negative factors are applied so each variable enters the index with the correct sign (e.g. positive for employment rates).
4Scale the index
Scores are rescaled to values between 0 and 100 with the average value across all 35 countries set, by definition, to 50 in 2003.
Calculatingthe PwC Golden
Age Index
Normalise Indicators are standardised using the z-score
method, based on the mean and standard deviation of the sample of 35 countries in a
base year of 2003, to allow for comparisons both across countries and across time.
3Calculate the scores
The scores are constructed as a weighted average of normalised labour market indicator
values.
1
49July 2018

PwC Golden Age index methodologyHow did we calculate the potential long-term GDP increase?
PwC Golden Age Index
We break down GDP in the following way:
GDP 15-54 FT * GDP per FT worker= 15-54 PT * GDP
per PT worker55-64 FT * GDP per FT worker
55-64 PT * GDP per PT worker
65+ FT * GDP per FT worker
65+ PT * GDP per PT worker+ + + + +
Key assumptions
• Total employment in the economy is equal to the employment of 15 year olds and above.
• A full-time (FT) worker is twice as productive on average as a part-time (PT) worker, due to working twice as many hours on average.
We took New Zealand as a benchmark country as it is one of the best performing countries in the OECD and calculated the impact on GDP if countries raised their 55-64 and 65+ employment rates to New Zealand levels. New Zealand is a high performer in the 55-64 year old employment rates category and also performs relatively well in the 65+ employment category. However, if a country has a higher full-time equivalent employment rate than New Zealand in either age category, as is the case, for example, in the US and Norway for the 65+ category, we did not assume any change to the employment rate currently experienced in that country.
Data
• Employment data by age and FT/PT split is sourced from the OECD.
• Due to data constraints for some countries with the employment data based on a common definition, we used FT/PT data employment based on national definitions.
• FT/PT employment data based on a national definition is only available for the 65+ age range, as opposed to 65-69 which is used within our index.
• For Korea, the OECD did not provide data based on a national definition, so we used the employment data based on an OECD common definition instead (which was an option in the case of Korea). There was also no data on the FT/PT breakdown of the 65+ age group so we estimated this by applying the average change in the distribution of FT/PT workers across the OECD economies as you move from the 55-64 age group to the 65+ age group to the overall employment estimate for 65+ years olds in Korea.
50July 2018

Drivers of the employment rate of older workers in the OECDEconometric methodology
PwC Golden Age Index
Table of coefficients• We used a dynamic panel approach in our analysis of employment of older workers, exploiting cross-country differences in employment rate for the 55-64 age group across the OECD.
• We used the existing academic literature on employment of older workers to inform our specification of drivers that explain the variables that could explain the employment rate. We narrowed our selection using the step-wise model selection technique in order to avoid the problems associated with multicollinearity, such as variables being individually insignificant and at times with unreliable coefficient signs.
• Our specification also contains fixed effects for each country to account for country-specific characteristics that explain the employment rate of older workers. The employment rate is also likely to be driven by structural factors –to account for this we included a lagged term for the employment rate in our overall specification to account for the persistence in the employment rate over time.
• To ensure robustness under a serially correlated dependent variable (in this case the employment rate of older workers), we used a system generalised method of moments (GMM) estimator (Blundell and Bond, 2000). The GMM approach involves using an instrumental variable-based approach where higher lag values of the lagged dependent variable are used as instruments. This approach also serves to eliminate any potential omitted variable bias and unobserved heterogeneity, which means country fixed effects are accounted for.
• The results from our analysis are shown in the table to the right.
• We find that our preferred specification pass all the robustness tests – (i) Robust Hansen test for validity of instruments (p-value = 0.234) (ii) Hausman test for the relevance of fixed effects (p-value = 0.01) and (iii) Arellano-Bond autocorrelation test for one (p-value =0.072) and two lags (p-value = 0.272).We also checked normality of the model with quantile plots.
Source: PwC analysis. *significant at 10% level **significant at 5% level ***significant at 1% level.
Dependent variable: Employment rate, 55-64 year old
Coefficient(standard error)
Lagged employment rate, 55-64 age group 0.62 (0.12)***
Life expectancy 1.55 (0.50)***
Logarithm of average annual wage -5.09 (2.08)***
Marital status -0.29 (0.11)**
Expenditure on family benefits as a share of GDP -0.95 (0.43)**
Public pension expenditure as a share of GDP -0.95 (0.45)**
Strictness of employment protection for temporary contracts -0.79 (0.35)**
Gender participation gap -0.08 (0.07)
51July 2018

Drivers of the employment rate of older workers in the OECDList of model variables used and other variables considered but not statistically significant
PwC Golden Age Index
Variables used in the econometric model Definition Source
Life expectancy Life expectancy at birth in years OECD
Logarithm of average annual wage Natural logarithm of average annual wage, measured in USD, at constant prices and 2010 PPP terms OECD
Marital status Share of the 55-64 population who are currently married UN Population Division
Expenditure on family benefits Government expenditure on family benefits as a percentage of GDP OECD
Public pension expenditure Government expenditure on public pensions as a percentage of GDP OECD
Gender participation gap Male labour force participation rate minus female labour force participation rate for the 55-64 age category OECD
Strictness of employment protection for temporary contracts
OECD constructed index to measure the strictness of regulation on dismissals and the use of temporary contracts
OECD
Other variables considered but not statistically significant
Definition Source
GDP per capita GDP per capita, measured in USD, at constant prices and 2010 PPP terms OECD
Share of public sector employment Employment of public sector as a percentage of public and private employment ILO
Gender pay gap The difference between median wages for male and female OECD
Dementia deaths per 100,000 Deaths per 100,000 population (standardised rates) OECD
Old age benefits Old age and survivors benefits as a % of GDP OECD
Disability benefits Incapacity related benefits as a % of GDP OECD
Share of 55-64 age group with tertiary education Share of population with tertiary educational attainment in the 55-64 age category OECD
Training and education participation rate for adults
Participation in education and training by adults as a % of total adults above 18 years old OECD, LFS, National Centre for Education Statistics
Household wealth Household wealth per capita as a percentage of GDP per capita OECD
52July 2018

PwC Golden Age Index
Appendix 2: Bibliography
53

Bibliography
PwC Golden Age Index
• Bertola, G., F. D. Blau, and L. M. Kahn (2007), ‘Labor Market Institutions and Demographic Employment Patterns’, Journal of Population Economics, 20: 833-867.
• Disney, R., Emmerson, C. and Wakefield, M., 2006. Ill health and retirement in Britain: A panel data-based analysis. Journal of health economics, 25(4), pp.621-649.
• Dorn, D. and A. Sousa-Poza (2010), ‘‘Voluntary’ and ‘Involuntary’ Early Retirement: An International Analysis’, Applied Economics, 42: 427-438.
• Cai, L., 2010. The relationship between health and labour force participation: Evidence from a panel data simultaneous equation model. Labour Economics, 17(1), pp.77-90.
• Gruber, J. and Wise, D., 2001. An international perspective on policies for an aging society (No. w8103). National Bureau of Economic Research.
• Haider, S. & Loughran, D., 2001. Elderly Labour Supply: Work or Play, Center for Retirement Research a
• Hallberg, D. (2011), ‘Is Early Retirement Encouraged by the Employer? Labor-Demand Effects of Age-Related Collective Fees’, Working Paper 2011:5, Uppsala Center for Labor Studies, Uppsala: Uppsala University.
• Hesselius, P. (2009), ‘Is Leisure Contagious? The Relationship Between Sickness Abscence and Spousal Retirement’, National Institute Economic Review, 209: 104-115.
• Heywood, J. S. and W. S. Siebert (2009), ‘Understanding the Labour Market for Older Workers: A Survey’, Discussion Paper No. 4033, Bonn: Institute for the Study of Labor.
• Hoskins, I. ed., 1996. Combining work and elder care: A challenge for now and the future (No. 16). International Labour Organization.
• Hurd, M., Michaud, P.C. and Rohwedder, S., 2012. The displacement effect of public pensions on the accumulation of financial assets. Fiscal studies, 33(1), pp.107-128.
• IEA (2014), ‘Income from work – the fourth pillar of income provision in old age’.
• OECD (2018), ‘Key policies to promote longer working lives. Country note 2007 to 2017. Denmark’.
• OECD (2018), ‘Key policies to promote longer working lives. Country note 2007 to 2017. Estonia’.
• OECD (2018), ‘Key policies to promote longer working lives. Country note 2007 to 2017. Finland’.
• PwC (2017), ‘Sixing the price. What’st he real value of AI for your business and how can you capitalise?’
• PwC (2018), ‘Will robots really steal our jobs? An international analysis of the potential long term impact of automation’.
• Riz, S.E. (2004). Ageing and Work A View from the United States. Washington, D.C. AARP, p.23.
• ARD (2018), Rente mit 63 teurer als erwartet, https://www.tagesschau.de/inland/rente-253.html
• Wise, D.A., 2004. Social security provisions and the labor force participation of older workers. Population and Development Review, 30, pp.176-205.
54July 2018

PwC Golden Age Index
Appendix 3: Contacts
55

For more information about this report, please contact
PwC Golden Age Index
Our Economics practice offers a wide range of services covering: market reform in a range of industry sectors (including energy, water, media and telecoms, financial services, health and government services); competition policy, disputes and other investigations; economic, social and environmental impact analysis; financial economics; fiscal policy and macroeconomics. This practice forms part of Strategy&, PwC’s strategy consulting business.
For more information about our Economics and People and Organisation services please visit:
www.pwc.co.uk/economics-policy
https://www.pwc.com/gx/en/services/people-organisation.html
This study forms part of our wider Leading in Changing Times programme:https://www.pwc.co.uk/who-we-are/annual-report/leading-in-changing-times.html
John HawksworthChief Economist at PwC UKE: [email protected]
Carmen CheungEconomistE: [email protected]
Saloni GoelEconomistE: [email protected]
Dr. Nicole ElertHead of Employment Law at PwC GermanyE: [email protected]
Petra RaspelsMember of the Management Board and Human Capital Leader at PwC GermanyE: [email protected]
Swati UtkarshiniEconomistE: [email protected]
56

www.pwc.comThis publication has been prepared for general guidance on matters of interest only, and does not constitute professional advice. You should not act upon the information contained in this publication without obtaining specific professional advice. No representation or warranty (express or implied) is given as to the accuracy or completeness of the information contained in this publication, and, to the extent permitted by law, PwC does not accept or assume any liability, responsibility or duty of care for any consequences of you or anyone else acting, or refraining to act, in reliance on the information contained in this publication or for any decision based on it.
© 2018 PwC. All rights reserved. In this document, “PwC” refers to the PwC network and/or one or more of its member firms, each of which is a separate legal entity. Please see www.pwc.com/structure for further details.


