Page 1
UNMANNED AERIAL SYSTEMS FOR SURVEYING AND MAPPING:
COST COMPARISON OF UAS VERSUS TRADITIONAL METHODS OF DATA
ACQUISITION
by
Bryan Phillip Fitzpatrick
A Thesis Presented to the
FACULTY OF THE USC GRADUATE SCHOOL
UNIVERSITY OF SOUTHERN CALIFORNIA
In Partial Fulfillment of the
Requirements for the Degree
MASTER OF SCIENCE
(GEOGRAPHIC INFORMATION SCIENCE AND TECHNOLOGY)
August 2016
Copyright 2015 Bryan Phillip Fitzpatrick
Page 2
ii
DEDICATION
I dedicate this document to First Lieutenant Amos "Camden" R. Bock, U.S. Army. As fellow
GIS undergraduate students at West Point, Amos sacrificed many hours to help me with several
projects over the course of our studies. He was always there when I needed help, never asking
for any in return. As with our undergraduate studies, any success in graduate level academia I've
achieved would be viewed as utter mediocrity compared to what his performance would've been,
had he been given the chance to continue his education.
Sadly, Amos gave the last full measure of devotion to his country on October 23rd
, 2006, when
he was killed in action in Baghdad, Iraq. He will be missed by more people than he ever
imagined, and will never realize the impact he had on the lives of others.
Well Done, Amos. Be thou at peace.
Page 3
iii
ACKNOWLEDGMENTS
I am indebted to my fellow Geographic Information Science and Technology (GIST) students
and instructors who’ve been there to help me along the way. Most importantly, thank you to my
wife and children for being a constant motivation for continued self-improvement.
Page 4
1
TABLE OF CONTENTS
DEDICATION ii
ACKNOWLEDGMENTS iii
LIST OF FIGURES 2
LIST OF ABBREVIATIONS 4
ABSTRACT 5
CHAPTER 1: INTRODUCTION 7
1.1 Unmanned Aerial Systems in Land Surveying 7
1.2 Research Statement 8
1.3 Thesis Organization 12
CHAPTER 2: SYSTEMS USED IN TESTING 13
2.1 Traditional Survey Methods and Systems 13
2.2 Testing Systems 17
CHAPTER 3: TESTING METHODOLOGY 21
3.1 Test 1: Comparison of UAS to Cross Sectional Method for Volumetric Calculation 21
3.2 Test 2: Comparison of UAS to Terrestrial LiDAR for Topographic Mapping 24
CHAPTER 4: RESULTS 32
4.1 Test 1: Comparison of UAS to Cross Sectional Method for Volumetric Calculation 33
4.2 Test 2: Comparison of UAS to Terrestrial LiDAR for Topographic Mapping 35
4.3 Test 3: Comparison of Cross-sectional Method and UAS Method for Topographic
Mapping 36
Page 5
2
CHAPTER 5: DISCUSSION AND CONCLUSIONS 41
5.1 Discussion of Results 41
5.2 Limitations of UAS 41
REFERENCES 48
Page 6
3
LIST OF FIGURES
Figure 1: Test Areas (airplane symbols) in Texas. ...................................................................... 10
Figure 2: Aircraft Used in the Study: Aero-M (Top), Iris+ .......................................................... 13
Figure 3: Example of Ground Control Points Viewed from a UAS, October 13th, 2015, Houston
Texas ............................................................................................................................................. 16
Figure 4: 3D Point Cloud from UAS Flight, August 2015, Austin Texas .................................... 17
Figure 5: Map of Ditch Survey Area, February 2015, Fate Texas. .............................................. 22
Figure 6: Volume polygon of ditch, drawn using Pix4D. ............................................................. 23
Figure 7: LiDAR Comparison Test Area, July 2015, Melissa Texas. .......................................... 25
Figure 8: Cross section of point clouds. Orange and Purple Are LiDAR, Green and Cyan Are
UAS............................................................................................................................................... 26
Figure 9: Cross Sectional Method Testing Site ............................................................................ 28
Figure 10: Topo Lines Generated by UAS .................................................................................. 29
Figure 11: Topo Lines Generated by Cross-Sectional Method. Numbers indicate Unique ID for
each GPS shot ............................................................................................................................... 29
Figure 12: Top: Test Location. Bottom: Comparison of UAS and Manned aircraft Topo Lines
(Lines shown in gray are from manned aircraft, lines in white are from UAS) ........................... 31
Figure 13: Cover page and Table of Contents of UAS Volumetric survey conducted by the
author in November 2015 ............................................................................................................. 39
Figure 14: Decision Matrix ........................................................................................................... 47
Page 7
4
LIST OF ABBREVIATIONS
AUVSI Association for Unmanned Vehicle Systems International
COA Certificate of Waiver or Authorization
FAA Federal Aviation Administration
FRMA FAA Reform and Modernization Act of 2012
GPS Global Positioning System
GIST Geographic Information Science and Technology
LiDAR Light Detection and Ranging
RPLS Registered Professional Land Surveyor
SSI Spatial Sciences Institute
TFR Temporary Flight Restriction
UAS Unmanned Aerial System
USC University of Southern California
Page 8
5
ABSTRACT
Commercial, government and private use of Unmanned Aerial Systems (UAS) are rapidly
expanding in the United States. Although commercial use of UAS is still limited to a case by
case basis, the Federal Aviation Administration began allowing companies to petition for use of
UAS for commercial purposes. As of October 30th,
2015, 2020 exemptions have been granted to
companies in various industries. Those companies approved to use UAS for surveying see a
need for the technology, but must also weigh the capabilities and limitations of UAS to acquire
and process survey data against those of more traditional methods. This study sought to answer
the question of whether or not using UAS for topographic mapping and volumetric surveying can
lower the cost and time to complete the same task using land surveying and manned aircraft
systems while still achieving acceptable accurate results. This study compares the use of UAS
within the surveying and mapping industry with traditional and accepted methods and provides a
comparison of their use. Specifically, this thesis reports on tests comparing UAS data
acquisition and processing for volumetric calculation and topographic mapping. Time, accuracy,
and cost were compared between UAS and traditional survey methods. The results of this study
showed that using UAS for topographic mapping and calculating volumes is more time and cost
efficient than land surveying, with no loss in accuracy, but only when performed over bare earth
terrain. The results also showed UAS to be more time and cost effective than using terrestrial
Light Detection and Ranging (LiDAR), but with less accurate results. The author is currently
employed as the Flight Operations Manager for a large surveying and mapping firm, and the
position involves the day-to-day remote acquisition of survey data through the use of aerial
LiDAR and aerial photography, as well as the establishment of a UAS department within the
Page 9
6
company. In addition, flight of all kinds, both manned and unmanned, has been a passion of the
author since becoming an aviator in the United States Army in 2004.
Page 10
7
CHAPTER 1: INTRODUCTION
1.1 Unmanned Aerial Systems in Land Surveying
In the profession of Land Surveying, new technologies, such as the Total Station (Moffit
and Bouchard, 41), Light Detection and Ranging (LiDAR) devices (Campbell and Wynne, 243),
and Global Positioning Systems (GPS) (Campbell and Wynne, 393), are appropriately met with
some level of skepticism. When first introduced, accuracy and precision are often compared to
previously used and accepted technologies and practices to determine their scientific validity.
Likewise, the introduction of Unmanned Aerial Systems (UAS) has undergone serious scrutiny
regarding precision, accuracy, and therefore validity in surveying by surveyors and their clients
alike. This skepticism is often countered by the claims of versatility and capability of UAS by
their manufacturers and proponents. Nevertheless, studies are emerging that show that UAS is a
viable alternative to traditional more costly surveying methods. For example, a recent study by
McKim and Creed (2016) tested UAS to conduct UAS landfill surveys, and found that the data
could be collected quickly, results were accurate to about 5cm, with less accuracy in vegetated
areas.
The purpose of this study is to compare using UAS for surveying against traditionally
accepted methods, so see if advantages exist in cost, time, and accuracy. One advantage of UAS
that is universally acknowledged is the level of safety it can bring to the hazardous profession of
aerial data acquisition. From 2003 to 2013, the Occupational Safety and Health Administration
(OSHA) recorded 258 fatalities in the electric utility industry alone1, many of which involved
visual inspections of electrical towers that could have been accomplished utilizing UAS. In
2014, there were five fatalities from accidents in manned rotorcraft, conducting similar visual
inspection work.
1 “Data and Statistics”, accessed October 2015, www.osha.gov
Page 11
8
Establishing the ability of new surveying technology to provide accurate and precise data
is just the first step in UAS technology’s widespread use. The high cost of systems such as
LiDAR must be offset by the benefit of time and money saved from their utilization. UAS is no
different in this respect.
At the most recent Association for Unmanned Vehicle Systems International (AUVSI)
conference in April 2015, there were more than 600 companies in attendance2, and hundreds of
UAS were on display. These systems ranged in price from the consumer grade level (less than
$10,000) to the professional and military grade levels of seven figures.
1.2 Research Statement
Acquiring survey grade data, either remotely through aerial LiDAR, or through
traditional methods of land surveying, is a time consuming and financially burdensome
endeavor. Utilizing UAS for data acquisition has three unique advantages: low initial
investment cost, low mobilization cost, and decreased time required to complete acquisition.
This study provides a comparison of using UAS to acquire land surface survey data. The scope
of this study is limited to using UAS under $10,000 and to two common tasks of surveying;
topographic mapping and volumetric calculation. In the context of this study, volumetric
calculation is defined as obtaining the fill between two surfaces, determining the average of the
two areas, and multiplying the average by the vertical separation or the contour interval (Moffitt
and Bouchard, 701). If the topographic lines generated using UAS are within 0.2 feet in all three
axes compared to those generated using traditional survey methods, then the accuracy of the
UAS method is considered to be as good as tradition survey methods. The Manual of Practice
for Land Surveying in the State of Texas states that contour accuracy must be plus or minus one-
half of the contour interval. For one-foot contour mapping, this would mean that the lines
2 “Unmanned Systems 2015”, last accessed May 2015, www.auvsi.org
Page 12
9
generated from both methods would need to be within 0.5 feet of each other3. However, the use
of UAS also falls under the discipline of photogrammetry, accuracy standards of which are
governed by the American Society for Photogrammetry and Remote Sensing (ASPRS). Their
standards manual states that vertical accuracy for surveying using photogrammetry must meet a
95% confidence level. Statistically, in non-vegetated terrain when elevation errors follow a
normal distribution, 68.27% of errors are within one standard deviation of the mean error,
(ASPRS, page A6), and 88.27% of 0.5 feet is 0.34 feet. To ensure “good” data, the industry
generally rounds this down to 0.2 feet. Additionally, the accepted industry standards, such as the
use of GPS, might also have an error, and choosing a standard of 0.2 feet will also help ensure
that all data meets the 0.5 feet accuracy standard for topographic mapping. Topographic
mapping is commonly known as the process of determining the positions, on the earth’s surface,
of the natural and man-made features of a given locality and determining the configuration of the
terrain (Moffitt and Bouchard, 615).] For volumetric calculations, two-foot contour mapping is
often used. According to the TSPS standard of accuracy, this would mean that the measurements
would need to be plus or minus one foot. Dirt volumes in the construction industry are measured
in cubic yards. One cubic foot is just over 3% of a cubic yard. Thus, for a volumetric
calculation, the UAS data must be within 3% of the calculation derived from traditional methods.
Four study areas for this thesis work were selected throughout the state of Texas, shown
in Figure 1, in order to compare results from locations with different terrain. Locations were
chosen which met Federal Aviation Administration (FAA) requirements for distance from
airports as well as vegetation coverage and battery life per flight for the UAS’s tested. For
example, a recent study by McKim and Creed (2016) showed that UAS technology is not
efficient in highly vegetated areas.
3 “TSPS Manual of Practice for Land Surveying in Texas”, 2006 Revised Eleventh Edition, page101.
Page 13
10
Figure 1: Test Areas (airplane symbols) in Texas.
In order compare the use of UAS to traditional land surveying methods the following
hypotheses were tested in this study:
Alternative Hypothesis 1: Using UAS for topographic mapping will take less time than
traditional surveying methods.
Null Hypothesis 1: Using UAS for topographic mapping will take more time than with
traditional surveying methods.
Alternative Hypothesis 2: Using UAS for volumetric calculation will take less time than
with traditional surveying methods.
Page 14
11
Null Hypothesis 2: Using UAS for volumetric calculation will take more time than with
traditional survey methods.
Alternative Hypothesis 3: Using UAS for topographic mapping will cost less money than
with traditional survey methods.
Null Hypothesis 3: Using UAS for topographic mapping will cost more money than with
traditional survey methods.
Alternative Hypothesis 4: Topographic lines generated using UAS will be within 0.2
feet, in all three axes of those generated using traditional survey methods.
Null Hypothesis 4: Topographic lines generated using UAS will not be within 0.2 feet, in
all three axes of those generated using traditional survey methods.
Alternative Hypothesis 5: UAS and traditional survey methods for volumetric
calculations will produce volumes that differ by 3% or less.
Null Hypothesis 5: UAS and traditional survey methods for volumetric calculations will
produce volumes that differ by more than 3%.
Alternative Hypothesis 6: Using UAS for volumetric calculations will cost less than
using traditional survey methods.
Null Hypothesis 6: Using UAS for volumetric calculations will cost the same or more
than using traditional survey methods.
Another goal of this work is to advance the application of UAS in the profession of
surveying. Additionally, this thesis will allow for dissemination of lessons learned regarding
best practices for their implementation to the surveying community.
The base of knowledge for this study was achieved through attending industry
conferences, and by exploring the following topics: UAS regulations in the United States, UAS
Page 15
12
technology, automated photogrammetric technology, project management, and standard survey
practices.
1.3 Thesis Organization
Chapter 2 provides detailed background on the systems and methods used during the
testing portion of this study. Technical descriptions of the UAS used, the LiDAR sensor used,
and the GPS and other equipment used during land surveying are presented. Chapter 3 describes
the testing methodology, is divided into subchapters covering volumetric calculation and
topographic mapping. Chapter 4 then describes the results of this study in detail. Likewise
divided into two subchapters, Chapter 4 compares the data acquired through all methods, the
relative accuracy, costs, and the time involved associated with each method of acquisition.
Lastly, Chapter 5 includes a discussion of the outcomes of this thesis work and recommendations
for future investigations. Two sections describe the limitations of UAS discovered in this study,
and the final conclusions provide suggestions for the best path forward using UAS based on the
results of the study.
Page 16
13
CHAPTER 2: SYSTEMS USED IN TESTING
This chapter describes the aircraft, sensors, software, LiDAR, Photogrammetry, GPS, and survey
tools used in the testing conducted in the study. Different testing systems were used for
volumetric calculation and topographic mapping. A rotary wing system and a fixed wing system
were used in order to study the physical limitations and capabilities associated with these types
of aircraft. The UAS used for volumetric calculation was the 3DRobotics Iris, and the UAS used
for topographic mapping was the 3DRobotics Aero-M, shown in Figure 2.
Figure 2: Aircraft Used in the Study: Aero-M (Top), Iris+
2.1 Traditional Survey Methods and Systems
2.1.1 Topographic Mapping and Volume Calculation by Cross Section
Cross sections created through manual surveying in the field are one of several traditional
survey methods used in this study. A cross section is a profile of the earth taken at right angles
Page 17
14
to the centerline of an area to be surveyed (Harbin, 2001). Cross sections are established by
noting latitude, longitude, and elevation of a series of points along a line perpendicular to the
survey area. In modern surveying, those latitudes, longitudes, and elevations are established
using Global Positioning Systems (GPS). Cross sections are shot (measured) at regular intervals
so as to cover the entire survey area. The size of the interval between cross sections differs
depending on the goal of the particular project and is dependent on the ground measurement
accuracy required. Topographic lines are then drawn by interpolation based on common points
of elevation within the survey area. Volumes are calculated by comparing two sets of
topographic lines, or by comparing the difference in elevations at the top and bottom of an
enclosed area, such as a ditch or dirt pile.
One of the study areas chosen for this thesis work was a small drainage ditch in Fate,
Texas, discussed in detail in this thesis. This ditch was chosen because it was devoid of
vegetation, was in an area that met all regulatory requirements for UAS, is representative of all
four study locations investigated in this thesis work, and because it was representative of a
majority of volumetric calculations conducted within the survey industry.
2.1.2 Topographic Mapping by Terrestrial LiDAR
Topographic mapping by terrestrial LiDAR is well documented and recognized as a
highly accurate method for conducting ground surveys (Campbell and Wynne, 2011). A LiDAR
is a device that emits up to 300,000 pulses each second, depending on the design of the device.
These laser pulses reflect off the objects they encounter then return to the LiDAR device.
Through a series of calculations, provided in detail in Campbell and Wynne (2011), involving
time of laser return, the angle the laser, and the strength of the return signal, the LiDAR device
assigns a latitude, longitude, and height value to each return point. The use of LiDAR generates
Page 18
15
a much larger amount of data than using the cross-sectional method and provides a very accurate,
detailed representation of terrain, and direct measurement of surface elevation. It’s use in the
context of this study is showed how the point cloud generated from LiDAR compared to that
derived from photogrammetry using UAS. Data was acquired from both systems using the same
control points for georeferencing the data.
2.1.3 Topographic Mapping by Photogrammetry
As defined by the American Society of Photogrammetry, photogrammetry is “the art,
science, and technology of obtaining reliable information about physical objects and the
environment through processes of recording, measuring and interpreting photographic images
and patterns of recorded radiant electromagnetic energy and other phenomena” (Wolf, 1983).
Although photogrammetry with manned aircraft was not performed as part of this study, the
UAS data was compared to a manned aircraft flight that occurred prior to UAS testing in the
same test area, and thus comparable data was acquired.
2.1.3.1 Traditional Photogrammetry with Manned Aircraft
Elevations and topographic lines are traditionally determined from measurements in
parallax difference between photographs (Wolfe, 1983). This is done only after an orthomosaic,
or a set of individual images put together in a correct geographic coordinate system, is created.
2.1.3.2 Automated Photogrammetry using UAS
Modern software, such as Pix4D and Agisoft, use a different approach to creating orthomosaics
and generating topographic lines. When images are loaded into automated photogrammetric
software, each image is divided into a set of pixels. The software then determines pixels from
each photograph that match each other and creates automated tie points, generating an
orthomosaic. This orthomosaic is based on the GPS position of the camera taking each
Page 19
16
photograph. Automated aerial triangulation and parallax measurements are calculated to
generate an elevation for each point. To draw accurate topographic lines, ground control points
must be used. Ground control points are set down within view of the planned coverage area, and
each 3D location is measured using a GPS (Figure 3). The longitude, latitude, and elevation
value for each ground control point are then manually assigned using the software to the
corresponding pixel where the GPS shot was taken. The software can then assign the remaining
pixels in the orthomosaic a 3D location based on their relative location to a known point. The
results can include thousands of 3D D\data points, similar to LiDAR (Figure 4).
Figure 3: Example of Ground Control Points Viewed from a UAS, October 13th, 2015, Houston
Texas
Page 20
17
Figure 4: 3D Point Cloud from UAS Flight, August 2015, Austin Texas
2.2 Testing Systems
2.2.1 Volumetric Calculation Testing Systems
One traditional land survey test was conducted to compare the results with volumetric
calculations obtained using UAS. The traditional test was conducted on the 25th
of February
2015. The total area surveyed was approximately 8 acres. The land surveyor utilized a Trimble
R10 Rover GPS to record 50-foot cross sections in the study area, as shown in Figure 54. The
R10 was linked to a virtual reference station run by the Texas Department of Transportation.
4 http://www.trimble.com/Survey/TrimbleR10.aspx
Page 21
18
The GPS data was processed using AutoCAD Civil 3D 2012. The same software was used to
calculate the volume of the canal.
The UAS used was the Iris, manufactured by 3DRobotics (footnote for the iris & 3D
Robotics URL). The Iris is a remotely piloted, four bladed small UAS. The sensor used with the
Iris was the Sony SteadyShot, an 11.9-megapixel camera with a 120-degree fisheye lens
(footnote for SteadyShot URL). The sensor was mounted to the front of the aircraft, with the
lens pointed downward toward the ground. The camera was not stabilized on a gimbal, but
rather hard mounted to the aircraft using after-market hardware. The flight was planned using
Mission Planner software, version 1.3.28. The images taken from the sensor mounted on the
aircraft and the top of slope points taken from the ground survey were processed using Pix4D
photogrammetric software, and the same software was used to calculate the volume of the ditch,
previously defined above. Both Mission Planner and Pix4D are open source software, free
software, and the total cost of the UAS and sensor was $950 USD.
2.2.3 Topographic Mapping Testing Systems
Three tests were conducted to compare different methods of Topographic Mapping. The
first test conducted on the 23rd
of July 2015 compared the point cloud generated by the UAS to
that of a terrestrial LiDAR scanner. Ground control points were set using the Trimble R10
Rover GPS, linked to a virtual reference station run by the Texas Department of Transportation.
The LiDAR data was collected using a Leica C10 Terrestrial LiDAR Scanner. The same ground
control points were used to georectify the data in both the UAS and the LiDAR tests. The
software used to calibrate the point cloud was Agisoft, and the software used to classify and
colorize the LiDAR points was PLS-CADD 2014. The UAS used was the Iris+, manufactured by
3DRobotics. The Iris+ is remotely piloted, four bladed aircraft, similar to the Iris used during the
Page 22
19
volumetric calculation. The sensor used was a GoPro Hero-4 Black, which contains a 12-
megapixel lens with a 120-degree field of view (footnote for GoPro, i.e., URL). The sensor was
externally mounted on the aircraft using a two-axis gimbal for stabilization. The sensor was set
to take a picture every one second. Mission Planner software was used to plan the flight. Pix4D
software was used to process the photos and export a .las file, an AutoCAD drawing file format
used for LiDAR processing. PLS-CADD software was used to generate one-foot interval
contour lines in .las format.
The second test conducted on 21 August 2015 compared the cross sectional method of
topographic mapping with the use of UAS. The total area surveyed was approximately 21 acres.
The land surveyor used a Trimble R10 GPS to shoot 100-foot cross sections. AutoCAD software
was used to interpolate topographic lines based on the GPS shots taken using the cross-sectional
method (footnote for AutoCAD software, URL). The UAS used was the Aero-M, manufactured
by 3DRobotics (footnote for Aero-M, URL). The Aero-M is a 2.7 pound fixed wing, remotely
piloted aircraft. The Aero-M uses a Canon S100 camera, a 12-megapixel point and shoots using
a digital camera (footnote for Canon, URL). The sensor was internally mounted on the Aero-M.
The Trimble R10 GPS was used to record the horizontal and vertical position of ground control
points. Mission Planner software was used to plan the flight. Pix4D software was again used to
process the photos, create an orthomosaic, and create 1-foot interval contour lines.
The third test conducted on 25 August 2015 compared the use of Manned aircraft
Photogrammetry to UAS for topographic mapping, described previously. The total area
surveyed was approximately 14 acres. The UAS used was the Aero-M. The Trimble R10 GPS
was used to identify the position of ground control points. Mission Planner software and Pix4D
were again used to plan the flight and process the imagery and create 1-foot contour lines. Due
Page 23
20
to confidentiality reasons, the type of manned aircraft, sensor, or processing software used during
the manned aircraft flight and subsequent topographic mapping is not reported in this thesis.
Nevertheless, the final topographic data, lines, generated by the manned aircraft flight in an
AutoCAD drawing file format were obtained for analysis as part of this thesis work.
As evident from this discussion above, several different systems were used during this thesis
study. To make the author’s work repeatable, a detailed testing methodology was needed before
showing the results of the study. Chapter 3 presents this methodology.
Page 24
21
CHAPTER 3: TESTING METHODOLOGY
This chapter describes the thesis work testing methodology. This chapter is divided into four
subchapters; UAS Vs. Cross-Sectional Method for Volumetric Calculation, UAS Vs. Terrestrial
LiDAR for Topographic Mapping, UAS Vs. Cross-Sectional Method for Topographic Mapping,
and UAS Vs. Manned Aircraft Photogrammetry for Topographic Mapping. Chapter 3 describes
the method of comparing traditional survey practices with the use of UAS. To conduct a
comparison, of the two survey methods, the accuracy of data acquired through the use of UAS
was determined, and the costs of acquiring that data using traditional land surveying and UAS
were compared. As a control, the field collection and data processing completed for each
method were conducted by the same researchers.
3.1 Test 1: Comparison of UAS to Cross Sectional Method for Volumetric Calculation
The accuracy of data acquired using UAS was determined by comparing the volume
calculated using UAS to the volume calculated using land surveying. The total acreage of the
area mapped was approximately 8 acres. To calculate the volume of the test site using UAS, a
digital elevation model was created in Pix4D. A volume polygon was then drawn around the
ditch (Figures 5 and 6). The polygon was drawn by connecting top of slope GPS points, to
create a controlled comparison. In the context of this study, top of slope refers to the point on the
ground at which the depressed area begins, separating it from the surrounding terrain. To be
deemed accurate, the total volume calculated using UAS had to be within three percent of the
volume calculated using land surveying (Per. Comm.). In addition to the standards of accuracy
described in chapter one, this standard of accuracy, plus or minus three percent, was confirmed
through interviews with Project Managers with a combined 20 years of experience in conducting
land surveys for the construction and transportation industries. These industries regularly
Page 25
22
commission land surveyors to calculate cut and fill volumes, with an excepted error of up to 3%
(Shropshire and Cox, 2015).
Figure 5: Map of Ditch Survey Area, February 2015, Fate Texas.
Page 26
23
The cost comparison was performed by calculating the total time spent by each person
involved in the test, and multiplying that time by their hourly charge rate, the amount of money
billed for associated services. The persons involved in the test included a UAS Pilot and
observer, a two-person field crew taking GPS shots for the cross-sectional method, and a project
manager in the office to process the data. The time to conduct each method of testing was
determined the summing the time spent planning in the office, mobilizing to the test site,
collecting the data, mobilizing back to the office, processing the data and calculating the
Figure 6: Volume polygon of ditch, drawn using Pix4D.
Page 27
24
volumes. The time to record the top of slope GPS shots was used in the time calculation for both
methods since those points were used in both types of volumetric calculations.
3.2 Test 2: Comparison of UAS to Terrestrial LiDAR for Topographic Mapping
The accuracy of data acquired using UAS was determined by comparing the point clouds
created by the LiDAR and the UAS methods, as illustrated in Figure 7. The total area mapped
during this test was approximately 10 acres. To be deemed accurate points determined using
UAS had to be within 0.2 feet, both horizontally and vertically, of the data acquired using the
LiDAR methodology. Although the Texas Administrative Code only requires that measurements
be recorded with equipment and methods of practice capable of attaining the accuracy and
tolerances required by the professional land surveying services being performed (Texas Code,
2015), the standard of 0.2 feet is a widely held standard of accuracy in surveying, based on the
discussion in Chapter 1.
The cost of each method was determined by calculating the total time spent by each
person involved in the test, and multiplying that time by their hourly charge rate, the amount of
money billed for associated services. The labor rates were then added to hourly rates for the use
of the equipment involved, in this case, a Trimble R10 GPS. The time to conduct each method
of testing was determined by summing the time spent planning in the office, mobilizing to the
test site, collecting the data, mobilizing back to the office, and processing the data. The images
shown in Figure 8 illustrate the comparison of a cross section of the two point clouds.
Page 28
25
Figure 7: LiDAR Comparison Test Area, July 2015, Melissa Texas.
Page 29
26
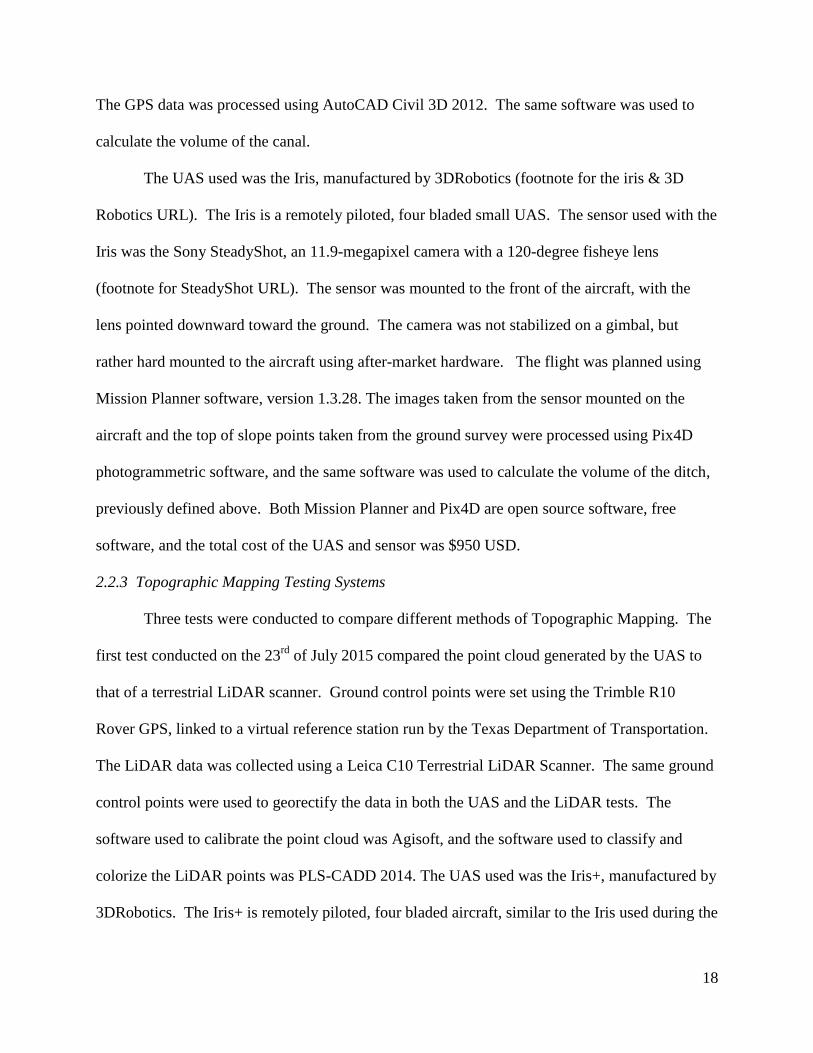
Figure 8: Cross section of point clouds. Orange and Purple Are LiDAR, Green and Cyan Are
UAS.
Regarding the cross section in Figure 8, if data sets are within 0.2 feet of each other vertically, all
points would overlap. Since these points do not overlap perfectly, meaning there are cross
sections that do not precisely overlap, this means that the UAS and LiDAR data are not within
0.2 feet of each other in those locations.
3.3 Test 3: Comparison of Cross-sectional Method and UAS Method for Topographic
Mapping
Both the cross-sectional method and the UAS method were conducted on the same day.
The accuracy of the topographic lines created using the UAS method was determined by
comparing their location and elevation to the topographic lines created using the cross-sectional
method (Figures 9 and 10). The total area mapped for this test was approximately 23 acres.
Elevation readings were noted on both sets of contour lines where they appeared to cross. The
cost of each method was obtained by calculating the total time spent by each person involved in
the test, and multiplying that time by their hourly charge rate, the amount of money billed for
Page 30
27
associated services. The labor rates were then added to hourly rates for the use of the equipment
involved, in this case, a Trimble R10 GPS and the Aero-M software. The time to conduct each
method of testing was determined as the sum of time spent planning in the office, mobilizing to
the test site, collecting the data, mobilizing back to the office, processing the data and creating
the topographic lines. The total cost of the Aero-M software, associated planning, and other
equipment was $5,400.
Page 31
28
Figure 9: Cross Sectional Method Testing Site
COMPARISON AREA
Page 32
29
Figure 10: Topo Lines Generated by UAS
Figure 11: Topo Lines Generated by Cross-Sectional Method. Numbers indicate Unique ID for
each GPS shot
N
B
Page 33
30
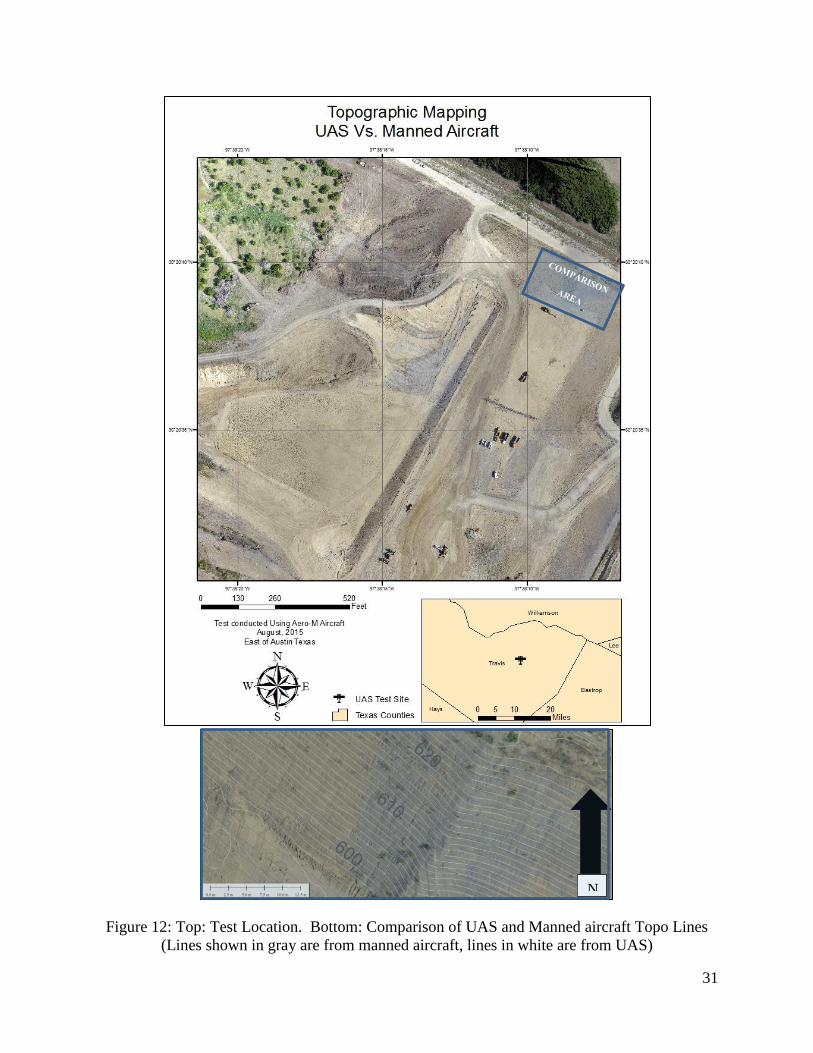
3.4 Test 4: Comparison of UAS Method and Manned Aircraft Photogrammetry for
Topographic Mapping
The UAS method and Manned Aircraft Method were conducted in 2015 during
different times of the year (Figure 12). The 14-acre test site underwent excavation during the
time between the manned aircraft flight and the UAS flight. To best compare the accuracy of the
two different topographic line sets, an area was chosen to analyze where no excavation had taken
place. The time to conduct the UAS flight was calculated by adding the time to mobilize from
the office to the site, establish ground control points, fly the mission, return to the office, and
process the data and create the topographic lines. The time for the manned aircraft to fly the
study areas and subsequent data processing steps is unknown. The cost of the UAS method was
calculated by multiplying the time spent by each person involved in the test by their hourly
charge rate. The total cost of the manned aircraft flight was $5,000 (Hanson, 2015).The
traditional survey methodologies described in this chapter are widely held throughout the survey
industry. The methodologies for UAS are not, however, as the technology is new and evolving.
The comparison of results, detailed in the next chapter, is one way to determine the validity of
both the technology described in Chapter 2 and the methodology presented in Chapter 3.
Page 34
31
Figure 12: Top: Test Location. Bottom: Comparison of UAS and Manned aircraft Topo Lines
(Lines shown in gray are from manned aircraft, lines in white are from UAS)
N
Page 35
32
CHAPTER 4: RESULTS
This chapter details the results of the testing in regards to the time required to accomplish each
task for each method, the cost associated with each method, and the comparison of accuracy
between methods used in each test. Overall the UAS method proved to be more beneficial than
using the cross-sectional method for both volumetric calculation and topographic mapping. The
UAS method took less time and cost less money with no loss in accuracy of the results. The
UAS method could not be proven to be more or less beneficial compared to the use of manned
aircraft for photogrammetry because time of flight data was not available for the latter, thus
assumptions of total time and thus cost had to be made. It is assumed that the UAS method for
topographic mapping took less time and cost less than using terrestrial LiDAR or manned
aircraft, and it was determined that it is a less accurate method for topographic mapping. Table 1
summarizes these results.
Test Traditional Method
Traditional
Method Time
UAS
Method
Time
Traditional
Method Cost
UAS Method
Cost
Accuracy
Comparison
Volumetric
Calculation
Cross Sectional
Method 11 Hours 5 Hours $2,235 $1,316.50
0.09% Difference
between
calculation
results
Topographic
Mapping Terrestrial LiDAR 10 Hours 7 Hours $4,600 $2,450 41% Accurate
Topographic
Mapping
Cross Sectional
Method 16 Hours 8 Hours $3,200 $1,944
Less than 0.1’
difference
between contour
lines
Topographic
Mapping
Manned Aircraft
Photogrammetry Unknown 8 Hours Unknown $1,011
Less than 0.1’
difference
between contour
lines
Table 1: Summary of results
Page 36
33
The cost was calculated by multiplying the number of hours to complete each method of
surveying by the charge rate for the individuals conducting the surveying. The charge rate is the
individual or team salary multiplied by a pre-designated multiplier. Equipment, health
insurance, and a 20% markup (for profit) are factored into the multiplier. Table 2 is a breakdown
of the charge rates.
Personnel Salary Overhead Multiplier Charge Rate
2 Person Survey Crew with
GPS $70 3.2 $225
UAS Pilot $35 4.1 $145
Observer $24 4.1 $98
Office Technician $35 4.1 $145
Table 2: Breakdown of Charge Rates
4.1 Test 1: Comparison of UAS to Cross Sectional Method for Volumetric Calculation
4.1.1 Comparison of Time
The UAS method was accomplished in a total of six hours. Two hours were spent
mobilizing to and from the test site. A total of 20 minutes were spent planning the flight, which
lasted 8 minutes. One hour of time was included in this total for the cross-sectional method,
accounting for the time necessary to acquire the top of slope locations used in the volumetric
calculations. Two and a half hours were spent processing the data in the office planning and
calculating the volume results.
The cross-sectional method was accomplished in a total of 11 hours. Two hours were
spent mobilizing to and from the site, six hours to acquire the GPS locations using the cross-
sectional method, and three hours were required in the office to create the surface model in
AutoCAD, then to calculate the final volume.
Page 37
34
The UAS method took five fewer hours, or 46% less time to calculate the volume than
using he cross-sectional method. In regards to time spent, Alternative Hypothesis 2 proved to be
true: using UAS for volumetric calculation took less time than the cross-sectional method.
4.1.2 Comparison of Cost
The charge rate for the Pilot In Command who flew the mission was $145 per hour, who billed 3
hours to the project. The charge rate for the observer who assisted with the flight was $98 per
hour, who billed 3 hours to the project. The charge rate for the two-person survey crew with the
Trimble R10 GPS was $225 per hour, who billed eight hours to the project. The charge rate for
the persons conducting the processing in the office was $145 per hour, for both methods.
The results were determined using the UAS method for a total cost of $1,316.50. Using
the traditional cross-sectional method, the total cost was $2,235. Thus, the UAS method cost
$918 less than the cross-sectional method. In regards to cost, Alternative Hypothesis 6 proved to
be true: Volumetric calculation using UAS cost less than the cross-sectional method.
4.1.3 Accuracy Results
The volume calculated using the UAS method was 5,276 cubic yards. The volume calculated
using the cross-sectional method was 5,271 cubic yards. The difference in volume between the
two calculations was five cubic yards, a 0.09% difference. In this test, Alternative Hypothesis 5
proved to be true: Volumetric calculation using UAS was as accurate as using the cross-sectional
method.
Page 38
35
4.2 Test 2: Comparison of UAS to Terrestrial LiDAR for Topographic Mapping
4.2.1 Comparison of Time
The UAS method required a total of 7 hours to complete the tasks of data acquisition and
analysis. Two hours were spent mobilizing to and from the test site, 30 minutes were spent
planning the flight, which lasted 15 minutes. Two hours were spent establishing ground control
points, and the remaining time was spent processing the data and creating a point cloud.
The traditional method of using Terrestrial LiDAR took a total of 10 hours to accomplish.
Two hours were spent mobilizing to and from the test site, an additional two hours to establish
ground control points, three hours to scan the test area, and lastly three hours to process the data
in the office.
In the end, the UAS method took three fewer hours to than using Terrestrial LiDAR to
complete the testing. In this case, Alternative hypothesis 1 proved to be true: Topographic
mapping using UAS took less time than using traditional methods.
4.2.2 Comparison of Cost
Utilizing the UAS method the testing was completed for a total cost of $2,450. Whereas
the traditional method using LiDAR cost $4,600. Thus, the UAS method cost $2,150 less than
the traditional method. In this case, Alternative Hypothesis 3 proved to be true: Using UAS for
topographic mapping cost less than using traditional methods.
4.2.3 Comparison of Accuracy
When the point clouds generated by the UAS method and the terrestrial LiDAR method
were compared, 41% of the points were within 0.1 feet of each other in the vertical axis, 81% of
the points were within 0.25 feet of each other, and 95% of the points were within 0.5 feet of each
other. In this case, Null Hypothesis 4 proved to be true: topographic lines created using UAS
Page 39
36
were less accurate than those using traditional methods. It is important to note, however, that
from a business standpoint, having 95% of the points fall within 0.5 feet of the LiDAR is
acceptable for many applications. Not all clients require 0.2 foot accuracy, and may prefer a less
costly and time-consuming survey that can achieve 0.5 foot accuracy.
4.3 Test 3: Comparison of Cross-sectional Method and UAS Method for Topographic
Mapping
4.3.1 Comparison of Time
The UAS method for topographic mapping in this test required a total of 8 hours to
complete. Three hours were spent mobilizing to and from the test site, while planning the flight
and preparing the aircraft took 30 minutes. The total flight time was 28 minutes long. One hour
was spent establishing ground control points, and the remaining time was spent coordinating the
flight with the U.S. Airforce (flight took place within the confines of airspace operated by
Lackland Air Force Base), processing the data in the office and creating the 1-foot interval
contour lines.
The cross-sectional method took a total of 16 hours to complete. Three hours were spent
mobilizing to and from the test site. Eight hours were spent collecting the topographic data using
the cross-sectional method, and the remaining five hours were spent creating the topographic
lines from the cross sections and conducting quality control of the data.
Using the UAS method required eight fewer hours to complete the data collection and
analysis than the traditional cross-sectional method. In this case, Alternative Hypothesis 1
proved to be true: Topographic mapping using UAS took less time than using the cross-sectional
method.
Page 40
37
4.3.2 Comparison of Cost
To conduct the topographic mapping, the UAS method cost a total of $1,944 based on a
charge rate of $145 per hour for the pilot and $98 per hour for the observer, each of whom spent
8 hours completing the project.
The total cost of using the cross-sectional method was $3200, based on an hourly charge
rate of $225 for the survey crew (3 hours of mobilization and 8 hours of surveying) and $145 per
hour for the office technician to process the data. In this case, Alternative Hypothesis 3 proved
to be true: Topographic mapping using UAS cost less than using traditional ground survey.
4.3.3 Comparison of Accuracy
Where the topographic lines from the UAS method and the cross-sectional method cross,
there is less than a 0.1-foot difference in all three axes as measured using AutoCAD. In this test,
Alternative Hypothesis 4 proved to be true.
4.4 Test 4: Comparison of UAS Method and Manned Aircraft Photogrammetry for
Topographic Mapping
4.4.1 Comparison of Time
The UAS method took 4 hours to complete the topographic mapping. A total of 30
minutes were spent mobilizing to and from the job site, one hour was spent setting ground
control points, one hour total was required to plan the flight and fly the aircraft, and the
remaining 90 minutes were spent processing the data.
As previously stated in Chapter 3, it is unknown how long the manned aircraft flight
required to complete the data collection task. In this test, the validity of Alternative Hypothesis 1
and Null Hypothesis 1 cannot be determined.
Page 41
38
4.4.2 Comparison of Cost
As previously stated, the total cost of the UAS Method was $1,960. Although the total
cost of the manned aircraft flight cannot be determined, it was estimated based on conversations
with the owner of the test flight who paid for the manned aircraft flight approximately $5,000.
Assuming true cost, then this test would prove Alternative Hypothesis 3 to be true: Topographic
Mapping using UAS costs less than using manned aircraft.
4.4.3 Comparison of Accuracy
There was less than 0.1 foot of difference in all three axes between the topographic lines
acquired using the UAS method when compared to those obtained using the manned aircraft
flight. Figure 11 illustrates that the 1-foot contour lines created by the UAS method line up
fairly close to those topographic lines generated by the manned aircraft flight. In this test,
Alternative Hypothesis 4 proved to be true: Topographic mapping using UAS is as accurate as
using manned aircraft.
4.5 Business Results
This study resulted in the broadened use of UAS by the author’s employer. Accuracy and
cost savings proven through testing, the author’s employer is now using UAS on a regular basis
for topographic mapping and volumetric calculations. After acquiring and processing data, and
creating either topographic maps or volumetric calculations, this company prepares and sends a
detailed report to its clients. This report not only gives the requested figures, such as the volume
of a surface, but also details how that data was obtained, and to what degree of accuracy the data
can reasonably be stated as true. The first two pages from such a report, prepared after a UAS
Survey, are shown below in Figure 13.
Page 42
39
Figure 13: Cover page and Table of Contents of UAS Volumetric survey conducted by the
author in November 2015
Page 43
40
Chapter 4 of this document provided a discussion of the results of this study. From this
discussion, many questions were raised as to why these particular results were obtained. Chapter
5 discusses in more detail some of the causes of error and expands on legal and technology
limitations and potential future uses of UAS.
Page 44
41
CHAPTER 5: DISCUSSION AND CONCLUSIONS
In this thesis study, alternative hypothesis 1, 2, 3, and 5 proved to be true. The UAS methods
proved to cost less, take less time, and be as accurate in all but one case, when compared to
traditional survey methods.
5.1 Discussion of Results
In conclusion, nearly all traditional survey methods required more time and money to
complete compared with using the UAS method. Test 4, comparison of UAS methods to
manned aircraft for topographic mapping, remains an exception since the necessary flight time
information for the manned aircraft flight could not be gathered. Test 2, comparing the point
clouds generated from UAS and LiDAR, was the only test in which the null hypothesis proved
true, though the UAS method is less accurate by only approximately 0.5 feet compared to the
traditional LiDAR method. Based on the testing conducted as part of this thesis work, it can be
determined that the use of UAS for topographic mapping is more cost efficient than traditional
methods, with limitations, as noted in the following discussion.
5.2 Limitations of UAS
As limitations were discovered when projects increased in size due to the regulatory
requirement of maintaining visual line of sight with UAS, it is recommended that future work in
this area be done after the FAA allows for commercial use of UAS beyond visual line of sight.
The need to de-regulate the industry and allow for beyond visual line of sight UAS flight
continues to be a subject of much debate5. In speaking before a House Oversight and
Government Reform Committee in June of 2015, Association for Unmanned Vehicle Systems
International (AUVSI) President Brian Wynne broached the subject, saying that, “Despite these
5 http://www.uasmagazine.com/articles/1281/uas-house-committee-debates-drone-rules-regs-risks
Page 45
42
positive steps, we need to permit expanded uses that pose no additional risk to the airspace
system. Whether within the context of the rule, through the reauthorization or by other means,
we need to allow for beyond-visual-line-of-sight, nighttime operations and operations over
congested areas. Otherwise, we risk stunting a still-nascent industry (AUVSI Weekly). Although
this appears to be the next step in civil UAS use in the United States, in reality, this is probably at
least two years away, as UAS technology continues to outpace our government’s ability to
regulate its use.
There are several limitations of UAS, some regulatory, some not, that affect the cost of
using UAS for surveying, and were avoided during this testing. These tests were very limited in
the areal coverage of the project study areas. No mapping project greater than 25 acres was
attempted. Also, all testing was done over bare earth surfaces, due to the testing aircraft using
passive sensors and automated photogrammetry (McKim and Creed, 2016).
5.2.1 Regulatory Limitations
The FAA Reform and Modernization Act of 2012 (FRMA) included several sections
regarding the use of UAS, and how private companies can go about using them for commercial
use (FAA Reform Act). Ultimately, what is needed by the FAA is an approved Certificate of
Waiver or Authorization (COA). Before the FRMA, only government entities were allowed to
receive a COA. Section 333 of the FRMA called for the FAA to establish a process by which
private companies could apply for a COA. In 2014, the FAA began issuing something known as
a Section 333 Exemption, which allows companies to apply for a COA (H.R.658, 2012). The
FAA has also begun issuing a “blanket COA” when they approve a Section 333 Exemption for a
company. There are many regulatory limitations imposed by the FAA on those companies
approved to use them for commercial use. The author’s employer received a Section 333
Page 46
43
exemption, which included more than 30 restrictions. FAA (FAA, 2015). In November of this
year, The University of Southern California received their Section 333 Exemption, which carried
32 restrictions, and further restrictions were placed on them in the COA they received (Duncan,
2015).
Local regulations also pose limitations on those seeking to use UAS for surveying.
Texas, for example, passed House Bill 1481, which took effect in September of 2015 and further
limits the areas in which people may lawfully operate UAS. The bill made an offense of the use
of UAS near critical infrastructure without the owner’s consent, giving a specific list of what
qualified as critical infrastructure (H.B. 1491, 2015). Other states have similar regulations that
further limit the use of UAS.
Perhaps the most limiting restriction is the requirement to maintain line of sight with the
aircraft at all times. For example in a recent mapping assignment following a natural disaster, the
author used UAS to map 2.6 miles of transmission line that had been hit by a tornado6. The
pilot’s visual contact with small UAS was lost much faster than with the larger manned
counterparts, and the aircraft could only be seen approximately one-half to three-quarters of a
mile away against the backdrop of a hazy sky. Even with a launch point in the middle of each
set of flight lines, flying in bad weather resulted in three separate takeoffs and landings, a total of
8 hours work for two people to fly the aircraft and set ground control. In this particular example
the work could have been accomplished much faster with a manned aircraft, and most likely at a
lower cost.
The line of site restriction is the best example of a regulation that, if changed, will affect
the time and cost of using UAS. Linear surveying and mapping projects, such as Electric
Transmission Line mapping, will be done at a much faster pace and lowered cost. In the author’s
6 http://www.12newsnow.com/story/30392984/tornado-reported-in-san-marcos-damage-in-floresville-dhanis
Page 47
44
experience during testing, small UAS could be seen only when one-half mile or closer to the
operator, limiting operations to around 1 mile of corridor mapping without re-positioning the
operator. The battery life and airspeed of the systems used during this testing allow the aircraft
to fly up to 15 miles in a single flight. If the line of sight restriction is lifted, linear mapping will
require far less time, due to a drastic reduction in time to re-position the observer and repeatedly
set up and tear down equipment. This lowered time will translate to a reduction in cost as well.
Because the FAA considers UAS to be aircraft, operators of unmanned aircraft must also
follow all restrictions placed on manned aircraft, unless specifically exempted from doing so in
their Section 333 Exemption and associated COA. An example of a common regulatory
hindrance to flight for all aircraft is the presence of Temporary Flight Restrictions or TFRs. The
FAA defines a TFR as “an area restricted to air travel due to a hazardous condition, a special
event, or a general warning for the entire FAA Airspace.” Large wildfires, the Super Bowl, and
presidential travel are examples of events and hazards that can trigger a TFR to be put up. TFRs
must be checked for before flight for all aircraft, including UAS. Although no TFRs interfered
with the testing for this study, it is highly likely that TFRs could disrupt commercial UAS
operations.
5.2.2 Physical Limitations
The majority of UAS in use today utilize automated photogrammetry for data acquisition
and processing, rather than LiDAR. While LiDAR systems do exist and are commercially
available, they are, in many cases, cost-prohibitive. Moreover, the increased weight of such
systems can severely limit the flight time of the aircraft.
Generating volume calculations and topographic mapping is a perfect task for automated
photogrammetry over bare earth. But the limitations of passive sensors of old remain in the UAS
Page 48
45
era, mainly vegetation (McKim and Creed, 2016)). If the true ground or bare earth is not present
in the image, the software will not map the true ground, but will instead map the top of trees,
grass, vehicles, buildings, and other objects obstructing the view of the true ground level.
Flight time is another limiting factor. While this is improving every day, the majority of
commercially available UAS can fly fewer than 90 minutes at a time, and thus cover much less
ground than a manned aircraft. This limitation is primarily due to the use of battery powered
engines. As battery technology improves in the future, so too will UAS flight time.
5.3 Conclusions
UAS can be more cost effective than traditional survey methods, but this is not
necessarily a cost-effective tool for every aspect of surveying and mapping. The limited flight
time and requirement to maintain line of site with the aircraft requiring multiple launches and
recoveries, and subsequent repositioning of aircrews, make the mapping of large regions less
effective than with manned aircraft. This study was not able to determine at what point an area
is too large for UAS to be cost effective when compared to manned aircraft. This would be an
excellent goal for future study.
UAS can also be less cost effective than the traditional cross-sectional method for small
surveying jobs, such as 1 to 5 acres in area. The regulatory requirement to have a certificated
airman flying the aircraft requires personnel with formal training and certification, unlike a
typical field survey crew with a GPS. Although using UAS was faster in all three test scenarios,
it is reasonable to assume that at some point on smaller projects the use of UAS could take as
much time as the traditional method. Since personnel with formal training and certifications
typically have a higher cost to business, the time may be equal, but the cost would, in theory, be
higher.
Page 49
46
This study determined that using UAS for volumetric calculation and topographic
mapping is as accurate as traditional survey methods and most cost and time effective when
mapping areas 10 to 200 acres in size, in survey locations with little to no vegetation. When
shared with the author’s employer, these test results led to a decision by the employer to invest
heavily, both in time and money, in growing a UAS surveying program. At the time of this
thesis, this program had earned over $40,000 in revenue in its first four months. This work,
along with the study detailed in this thesis, resulted in the creation of a general decision matrix
shown in Figure 12 below. This decision matrix has now become a tool to help project managers
not familiar with the capabilities of UAS. This matrix shows the general point where it becomes
more cost effective to use UAS for surveying of Land Surveying methods.
Page 50
47
Figure 14: Decision Matrix
Finally, UAS should not be considered a replacement for traditional methods of
surveying and mapping, but rather viewed as another tool in the toolbox, to be used only when
the situation warrants.
Page 51
48
REFERENCES
“FAA Section 333”, last modified November 2nd
, 2015,
ttp://www.faa.gov/uas/legislative_programs/section_333/
Unknown Author, AUVSI Weekly Newsletter, 6/23/2015, http://www.auvsi.org/blogs/auvsi-
advocacy/2015/06/17/auvsioversight
“Data and Statistics,” last modified October 2015, www.osha.gov
“Unmanned Systems 2015,” last updated May 2015, www.auvsi.org
Andrew L. Harbin, Land Surveyor Reference Manual, Third Edition, (Belmont: Professional
Publications, Inc, 2001)
James B. Campbell and Randolph H. Wynne, Introduction to Remote Sensing, (New York,
Guilford Press, 2011)
Paul R. Wolf, Elements of Photogrammetry, (Boston: Mcgraw-Hill, 1983)
Interviews with Sean Shropshire, Registered Professional Land Surveyor (RPLS), and
Christopher Cox, RPLS, Feb-March 2015
Christian Stallings, CP, A Case Study: Exploring UAS Effectiveness for Landfill Surveys,
(McKim and Creed 2016)
Texas Administrative code, Title 22, Part 29, Chapter 663, Subchapter B, rule 663.15
Pix4D Project Quality Report, Test 1, 1 March 2015
Pix4D Project Quality Report, Test 2, 24 July 2015
Pix4D Project Quality Report, Test 3, 21August 2015
Pix4D Project Quality Report, Test 4, 25 August 2015
Francis H. Moffitt, Surveying, Ninth Edition, (New York: HarperCollins, 1992)
Manual of Practice For Land Surveying in the State of Texas, (Austin: TSPS Board of Directors,
2005)
University of Southern California Grant of 333 Exemption, John Duncan, U.S. DOT, 5
November 2015
H.R. 658, FAA Modernization and Reform Act, 112th
Congress, Second Session, 2012
Page 52
49
ASPRS Positional Accuracy Standards for Digital Geospatial Data, Edition 1, Version 1.0,
(ASPRS Map Accuracy Standards Working Group, November 2014)
Trimble Website, visited 24 August 2015, http://www.trimble.com/Survey/TrimbleR10.aspx,
UAS Magazine Website, last visited October 2015,
http://www.uasmagazine.com/articles/1281/uas-house-committee-debates-drone-rules-regs-risks
Texas State Legislature, September 2015,
http://www.legis.state.tx.us/tlodocs/84R/billtext/pdf/HB01481F.pdf
FAA Website detailing TFRs, visited 6 March 2016, http://tfr.faa.gov/tfr2/about.jsp