Climate change and human vulnerability Page | 1 Discussion paper Climate change and human vulnerability: Mapping emerging trends and risk hotspots for humanitarian actors Summary for decision makers Dr Andrew Thow and Mark de Blois March 2008 – Edition 3
Transcript
Climate change and human vulnerability
Page | 1
Discussion paper Climate change and human vulnerability: Mapping emerging trends and risk hotspots for humanitarian actors Summary for decision makers Dr Andrew Thow and Mark de Blois March 2008 – Edition 3
Climate change and human vulnerability
Page | 2
Climate change and human vulnerability
Page | 3
Report to the UN Office for Coordination of Humanitarian Affairs, Palais des Nations CH-1211, Geneva 10, Switzerland
Prepared by Dr Andrew Thow and Mark de Blois of Maplecroft, The Towers, St Stephen’s Road, Bath, BA15JZ, UK
Methodology ................................................................................................................................................................ 8 Data, timeframe and limitations ................................................................................................................................... 8
4 Mapping human vulnerability ................................................................................................................................ 10 5 Hotspots of climate change risk ........................................................................................................................... 13
Flood and cyclone disasters ...................................................................................................................................... 13 Food and water ......................................................................................................................................................... 18 Population, displacement and conflict ....................................................................................................................... 21
Figures Figure 1: Basic approach to mapping climate change risk .............................................................................................. 8 Figure 2: Map showing overall human vulnerability based on a combination of natural, human, social, financial and physical factors.. ............................................................................................................................................................ 11 Figure 3: Map showing overall human vulnerability in South Asia based on a combination of natural, human, social, financial and physical factors.. ....................................................................................................................................... 12 Figure 4: Humanitarian risk hotspots for flooding.. ........................................................................................................ 14 Figure 5: Humanitarian risk hotspots for flooding in the East Africa region. .................................................................. 15 Figure 6: Humanitarian risk hotspots for cyclones. ........................................................................................................ 16 Figure 7: Humanitarian risk hotspots for cyclones in the Southeast Asia region. .......................................................... 17 Figure 8: Humanitarian risk hotspots for drought.. ......................................................................................................... 19 Figure 9: Humanitarian risk hotspots for drought in the sub-Saharan Africa region. ..................................................... 20 Figure 10: Map showing hotspots of humanitarian risk for floods, cyclones and drought (combined) overlaying a population density gradient.. .......................................................................................................................................... 22 Figure 11: Map showing hotspots of humanitarian risk for floods, cyclones and drought (combined) overlaying a population density change gradient.. ............................................................................................................................. 23 Figure 12: Humanitarian risk hotspots for drought and conflict.. ................................................................................... 24 Figure 13: Humanitarian risk hotspots for the three major climate-related hazards studied – flood, cyclones and drought. ......................................................................................................................................................................... 26 Figure 14: Map showing cumulative humanitarian risk hotspots for all three climate-related hazards studied – floods, cyclones and drought.. .................................................................................................................................................. 27
Climate change and human vulnerability
Page | 6
1 Executive summary • Human-induced climate change is expected to increasingly modify patterns of extreme weather such as flooding,
cyclones and droughts. Human influences have probably already contributed to increases in temperature extremes, the area affected by drought and the frequency of heavy precipitation events, as well as changes in wind patterns and cyclone tracks.1 Where increases in risk from climate-related hazards coincide with areas of high human vulnerability, there is potential for increased numbers of humanitarian disasters driven by climate change and associated deaths, injuries and damage to property and infrastructure.
• The impact of humanitarian disasters is related to the degree of exposure to a particular hazard, such as a flood, cyclone or drought, and the vulnerability of those populations affected. Vulnerability is a measure of the capacity of individuals, communities and societies to manage the impact of hazards without suffering a long-term, potentially irreversible loss of wellbeing and stability. It is determined by underlying natural, human, social, physical and financial factors.
• In this study – which focuses on impacts over the next 20-30 years – we use a Geographical Information Systems (GIS) mapping approach to map hazards associated with climate change (floods, cyclones and droughts) against factors that influence human vulnerability. Analysis of the interaction of patterns of climate hazards and vulnerability allows the identification of hotspots of high humanitarian risk relating to climate change. The results are intended to highlight key messages on the implications of climate change for humanitarian assistance and to inform the development of strategies by humanitarian actors. The complexity of climate change science and measurement of human vulnerability mean the results of this study should be interpreted as indicative only and require further research at the regional and local levels.
• Over the timeframe of this analysis (next 20-30 years), extreme weather hazards are not predicted to change much in location but are likely to intensify in many areas. This means that human vulnerability is likely to be a determining factor in the geographical distribution of humanitarian need. The largest and most important regions of high overall human vulnerability identified by this study are located in: Africa, particularly the Sahel, Horn of Africa and Central Africa; Central and South Asia, particularly Iran/Afghanistan/Pakistan/India and the Caspian region; and Southeast Asia, particularly Myanmar, Laos, Cambodia and Indonesia.
• To identify future hotspots of humanitarian risk relating to climate hazards, we analysed the interaction of high human vulnerability with flood, cyclone and drought hazards. Hotspots for humanitarian risk for flooding occur in: Africa, including the Sahel, the Horn of Africa, Great Lakes region, Central Africa and Southeast Africa; Central, South and Southeast Asia; and Central America and the western part of South America. Hotspots of humanitarian risk relating to cyclones occur largely in Mozambique and Madagascar, Central America, Bangladesh, several parts of India, Vietnam and several other Southeast Asian countries. Drought risk hotspots are mainly located in sub-Saharan Africa; South Asia, particularly Afghanistan, Pakistan and parts of India; and South East Asia, particularly Myanmar, Vietnam and Indonesia.
• Several parts of the world were identified as hotspots of humanitarian risk for more than one of the three types of hazards analysed. Areas that are at risk from more than one climate related hazard warrant significant concern from humanitarian actors. These include much of sub-Saharan Africa, especially the east coast, and much of South Asia. There are some areas that are considered as risk hotspots for all three hazards analysed. These include Southeast Africa and parts of South and Southeast Asia.
• Climate change not only increases humanitarian risks, but also increases the uncertainties surrounding where and how humanitarian disasters might unfold. This presents humanitarian actors with a challenge as it is likely to further stretch their capacity to respond effectively. Much humanitarian work in disaster preparedness and response already focuses on the effects of weather-related disasters and climate change therefore acts as an additional incentive to expand current programmes.
• For humanitarian actors, the major concern until 2030 should be areas already subject to extreme weather in combination with high human vulnerability (i.e. those areas identified as risk hotspots by this study). Over the next 20-30 years the increasing intensity of climate hazards in these areas is likely to result in a significant increase in humanitarian need. Humanitarians can be most effective by focussing efforts on reducing vulnerability in such risk hotspots. This is the most efficient strategy because the distribution of vulnerability is well known based on current data, knowledge and experience.
• Reducing vulnerability will also make societies more able to adapt to small changes in climate. This is important because there is a significant risk that even small climatic changes in highly vulnerable areas could lead to a vicious cycle, which would reinforce vulnerability and make those areas more prone to climate-related disasters in the future. Integrating disaster risk reduction into development strategies for areas of extremely high vulnerability, regardless of predicted climate impacts, could usefully mitigate this risk over the longer term.
Climate change and human vulnerability
Page | 7
2 Introduction According to the Intergovernmental Panel on Climate Change (IPCC) Fourth Assessment Report, published in 2007, warming of the Earth’s climate system is unequivocal, as is now evident from recorded increases in global average air and ocean temperatures, widespread melting of snow and ice, and rising global average sea level.2 Climate change is increasingly blurring the distinction between natural and man-made hazards. Although climatic hazards, such as droughts and floods, would occur regardless, man-made climate change is expected to increasingly modify these types of hazard. Human influences have probably already contributed to increases in temperature extremes, the area affected by drought and the frequency of heavy precipitation events, as well as changes in wind patterns and storm tracks.3 Where increases in risk from climate-related hazards coincide with areas of high population vulnerability, there is potential for increased numbers of humanitarian disasters driven by climate change and associated deaths, injuries and damage to property and infrastructure. Each year, humanitarian disasters associated with natural hazards cause thousands of deaths and injuries, huge damage and displacement, as well as substantive economic losses. During 2005 and 2006, natural disasters killed 120,000, affected 271 million others and caused economic losses totalling US$250 billion. There is also evidence that the human and economic costs of natural disasters are on the rise. In the decade 1984-1993, 1.6 billion people were affected by natural disasters, compared with 2.6 billion in the following decade (1994-2003). In constant dollars, disaster costs between 1990 and 1999 were more than 15 times higher (US$652 billion in material losses) than they were between 1950 and 1959 (US$38 billion at 1998 values).4 The impact of humanitarian disasters is related to the degree of exposure to a particular hazard, such as a storm, drought or flood, and the vulnerability of those populations affected. Vulnerability to natural hazards is determined by underlying social, economic, political and environmental factors, for example poverty, governance, demographic change and urbanisation, conflict, land degradation, food and water availability. It is therefore not surprising that it is the poorest who suffer most as a result of humanitarian disasters. The World Bank estimates that 97 percent of disaster-related deaths occur in developing countries and disasters are seen as a serious threat to the Millennium Development Goal of halving extreme poverty by 2015.5 In terms of share of GDP, economic losses as a result of natural disasters are heaviest in lower income countries. As well as destroying livelihoods and infrastructure, disaster losses can aggravate other financial, political, social and environmental problems, making it difficult for many countries to meet development goals. Humanitarian disasters associated with weather-related natural hazards (avalanches, extremes of temperature, droughts, floods, landslides, wild fires and wind storms) account for the majority of all human and economic disaster losses. According to analysis of Centre for Research on the Epidemiology of Disasters (CRED) data, 68 percent of deaths and 89 percent of all economic losses between 2000 and 2007 resulted from these kinds of events.6 This fact underlines the imperative of increased awareness and understanding of the effects that climate change will have on patterns of natural hazards and human vulnerability so that humanitarian agencies and society as a whole can respond effectively. Climate disasters are increasing in frequency and touching the lives of more people. The immediate consequences are extremely important, but climate shocks are also reinforcing wider risks and vulnerabilities, leading to long-term setbacks for human development.7 This study uses a Geographical Information Systems (GIS) mapping approach to attempt to understand how the projected impacts of climate change will intersect with patterns of human vulnerability. Using this method allows the identification of current and future hotspots of climate change risk. The results are intended to highlight key messages on the implications of climate change for humanitarian assistance to inform the development of strategies by humanitarian actors.
Climate change and human vulnerability
Page | 8
3 Approach Methodology This study builds on recent publications and data relating to trends in natural hazards and their relationship with climate change, including the IPCC Fourth Assessment Report (4AR),8 the Stern Review of the Economics of Climate Change 9 and the Human Development Report 2007/8.10 It is also intended to compliment the work carried out as part of the OCHA Global Focus Model project. A Geographical Information Systems (GIS) approach was used to model two groups of factors that influence climate change risk:
• Group 1 – Hazards such as floods, cyclones (hurricanes) and droughts. Historical data was combined with data from climate models to map the projected distribution of these hazards over the next 20-30 years. Historical hazard data came primarily from Dillley et al (International Bank for Reconstruction and Development/The World Bank and Columbia University).11
• Group 2 – Factors of human vulnerability that will influence the humanitarian risk associated with increased climate hazards. Vulnerability is a measure of the capacity of individuals, communities and societies to manage the impact of hazards without suffering a long-term, potentially irreversible loss of wellbeing and stability.
Table 1 shows the full selection of parameters mapped in this study. A GIS model was used to combine geographic information on climate hazards and human vulnerability to identify hotspots of climate change risk (Figure 1). The results and implications for humanitarian assistance are analysed in Chapters 4 and 5 under the following headings:
• Human vulnerability
• Flood and cyclone disasters
• Food and water
• Population, displacement and conflict
Figure 1: Basic approach to mapping climate change risk
Data, timeframe and limitations Technical details of the methodology used for this study and its limitations are given in Volume 2. Source data for the GIS model came from respected international organisations. The timeframe of the analysis focuses on immediate threats (next 20-30 years). However, some longer term projections of climate data were also used to indicate the direction of trends in the absence of other suitable datasets. The extreme complexity of climate change and human vulnerability means that this study should be considered as indicative only. We have taken a pragmatic approach in order to produce useful results and analysis within the scope and resources of this project.
Climate change and human vulnerability
Page | 9
Group Theme GIS Layer Future scenarios Source(s) Year
Group 1 Hazards
Projected trends Temperature trends Areas projected to temperature increase yes IPCC, WBGU, MPI Various Precipitation trends Areas projected to undergo change in precipitation yes IPCC, WBGU, MPI 2080-2099
Current climate hazards
Floods Distribution of flood mortality risk Change in extreme precipitation
Natural Water availability Distribution of water stress qualitative WWDRII, IPCC AR4, FAO, Alcamo 2007
Agricultural suitability Agricultural suitability for combination of staple crops no FAO GAEZ, GLC 2000, IPCC WGII 2000
Land degradation Distribution of soil degradation no ISRICI 2005
Human Poverty
Distribution of mortality rate infants no CIESIN 2000
Distribution of child malnutrition no CIESIN 2002
Human development index no UNDP 2008
Health National index for HIV, TB, malaria, malnutrition no WHO, UNAIDS, Maplecroft 2007
Social Governance National index no World Bank, OCHA Global Focus Model 2007
Conflict risk National index Forward looking ICG, Uppsala University, Maplecroft 2007
Displacement National index no UNHCR, Maplecroft 2007 Financial GDP Sub national GDP no CIESIN, World Bank, CIA Fact book 2006
Physical Road infrastructure Market accessibility no VMAP0 Digital Chart of the World 1997
Road coverage National index no IRF 2000-2005
Telecommunication National index no World Bank Development Indicators (WDI) 2007
Analysis
Human vulnerability Flood and cyclone disasters
Food and water Population, displacement and conflict
Table 1: Matrix of climate trends, associated hazards and vulnerability factors considered in this analysis
Climate change and human vulnerability
Page | 10
4 Mapping human vulnerability Natural hazards are dynamic and have highly variable potential impacts. The extent to which exposure to a hazard causes a humanitarian disaster – defined by its human impact, including deaths, affected people and property and infrastructure losses – is directly linked to the extent to which populations within a region are vulnerable to the impacts of the disaster. There are different notions of what human vulnerability is and how it is related to risk and adaptive capacity in relation to climate change. For the purposes of this analysis, we define human vulnerability as ‘a combination of multiple factors that influence the capacity of individuals, communities and societies to mitigate the risk of increased natural hazards as a result of climate change’. There are many methodological issues surrounding the choice, use and interpretation of indicators for vulnerability assessments. The results outlined in this section should therefore be treated as indicative only. In this analysis we have divided human vulnerability factors into five groups: natural vulnerability, human vulnerability, social vulnerability, financial vulnerability and physical vulnerability. Each group contains one or more individual indicators (see Table 1), which were combined to construct vulnerability indices for each group. The groups were then combined to give a single, overall human vulnerability index. This was then combined with information on the distribution of hazards to identify climate change risk hotspots (see Chapter 5) Figure 2 shows the distribution of overall human vulnerability. Areas of highest vulnerability are located in three main regions:
• Africa, particularly the Sahel, Horn of Africa and Central Africa, although there are isolated pockets of high vulnerability across much of the continent.
• Central and South Asia, particularly Iran/Afghanistan/Pakistan/India and the Caspian region
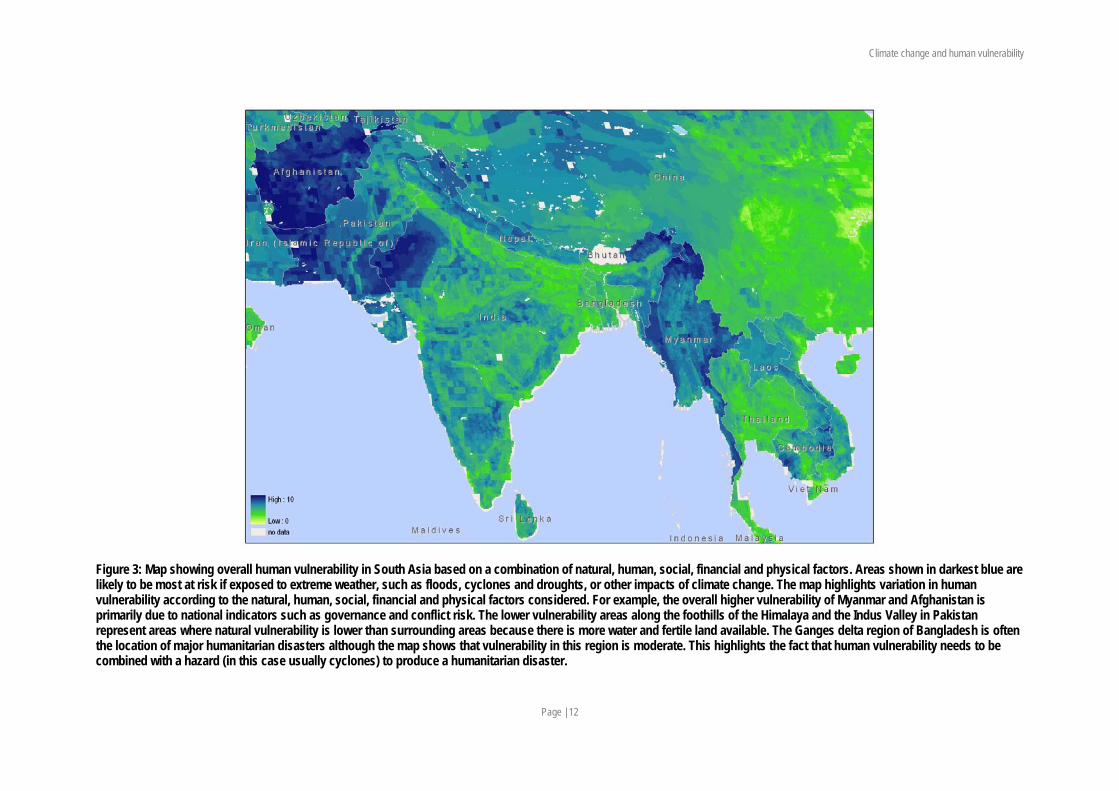
• Southeast Asia, particularly Myanmar, Laos, Cambodia and Indonesia. There are also smaller concentrations of high vulnerability in parts of East Asia, including Mongolia and northern and western China; and parts of South America, especially the Andean region. Figure 3 shows the distribution of overall vulnerability in South Asia. It highlights variation in human vulnerability according to the natural, human, social, financial and physical factors considered. For example, the overall higher vulnerability of Myanmar and Afghanistan is primarily due to national indicators such as governance and conflict risk. The lower vulnerability areas along the foothills of the Himalaya and the Indus Valley in Pakistan represent areas where natural vulnerability is lower than surrounding areas because there is more water and fertile land available. The Ganges delta region of Bangladesh is often the location of major humanitarian disasters although the map shows that vulnerability in this region is moderate. This highlights the fact that human vulnerability needs to be combined with a hazard (in this case usually cyclones) to produce a humanitarian disaster. Over the timeframe of this analysis, human vulnerability is likely to be the key determinant of humanitarian risk relating to climate change. This is because there are unlikely to be major changes in the distribution of climate hazards over the next 20-30 years. Those populations that are most vulnerable will be the first to be affected by small changes in the frequency or intensity of extreme weather. Furthermore, there is a significant risk that even small changes in climate could exacerbate existing vulnerability in populations least able to adapt. This could have the effect of causing a vicious cycle, whereby those populations would then be more prone to future humanitarian disasters. The key message for humanitarian actors is therefore to focus efforts on reducing vulnerability in areas where climatic hazards already exist. This is the most efficient strategy because the distribution of vulnerability is known well based on current data, knowledge and experience. However, the outputs of climate models, which could potentially indicate the distribution of future hazards, are uncertain at best. As climate science advances, humanitarian actors will increasingly be able to incorporate climate projections into their planning. In the immediate future, patterns of vulnerability will be more important. In the following Chapter we analyse the interaction of climate-hazards (including future projections) and vulnerability to identify hotspots of humanitarian risk.
Climate change and human vulnerability
Page | 11
Figure 2: Map showing overall human vulnerability based on a combination of natural, human, social, financial and physical factors. Areas shown in darkest blue are likely to be most at risk if exposed to extreme weather, such as floods, cyclones and droughts, or other impacts of climate change. They are also those areas most vulnerable if exposed to other humanitarian hazards – earthquakes for example.
Climate change and human vulnerability
Page | 12
Figure 3: Map showing overall human vulnerability in South Asia based on a combination of natural, human, social, financial and physical factors. Areas shown in darkest blue are likely to be most at risk if exposed to extreme weather, such as floods, cyclones and droughts, or other impacts of climate change. The map highlights variation in human vulnerability according to the natural, human, social, financial and physical factors considered. For example, the overall higher vulnerability of Myanmar and Afghanistan is primarily due to national indicators such as governance and conflict risk. The lower vulnerability areas along the foothills of the Himalaya and the Indus Valley in Pakistan represent areas where natural vulnerability is lower than surrounding areas because there is more water and fertile land available. The Ganges delta region of Bangladesh is often the location of major humanitarian disasters although the map shows that vulnerability in this region is moderate. This highlights the fact that human vulnerability needs to be combined with a hazard (in this case usually cyclones) to produce a humanitarian disaster.
Climate change and human vulnerability
Page | 13
5 Hotspots of climate change risk In this Chapter we look at the interaction of human vulnerability with the current and projected future climate hazards (flood, cyclone and drought) to identify hotspots of climate change risk.
Flood and cyclone disasters In this section we look at the interaction of human vulnerability with flood and cyclone hazards. We analyse flood and cyclone risks together as they represent sudden onset disasters, in contrast to the slower and more complex humanitarian impacts of drought (see following section). Climate change is very likely to intensify the water cycle, reinforcing existing patterns of water scarcity and abundance and increasing the risk of floods. By 2050, annual average river runoff and water availability are projected to increase by 10-40 percent at high latitudes and in some wet tropical areas. The frequency of heavy precipitation events is also very likely to increase over most land areas. These changes are very likely to increase the frequency of flash floods and large-area floods in many regions. Rising sea surface temperatures as a result of climate change are also likely to intensify tropical cyclones. However, changes to their location and overall numbers remain less certain. There is growing evidence that the expected increases in hurricane severity are already occurring, above and beyond any natural decadal cycles. The increasing intensity (and possibly frequency) of tropical cyclones would primarily impact those regions that already experience them (i.e. the North Atlantic, North Indian and Northwest Pacific ocean basins). Over the timeframe of this analysis (next 20-30 years), the location of floods and cyclones is not predicted to change dramatically, although these hazards may increase in intensity and frequency. For this reason we used data on the historical distribution of floods and cyclones as the best indicator of distribution over the next 20-30 years. However, we also included climate model outputs relating to increased extreme precipitation as a proxy for future flood risk. Figure 4 shows hotspots of flood risk, based on the interaction of high human vulnerability with extreme and significant historic and current flood hazard. In order to better understand how future climate change will affect humanitarian risk, it also shows areas of projected increases in intensity of precipitation, as a proxy of future flood risk. Figure 4 shows that flood risk hotspots occur mainly in the following regions:
• Africa, including the Sahel, the Horn of Africa, Great Lakes region, Central Africa and Southeast Africa
• Central, South and Southeast Asia
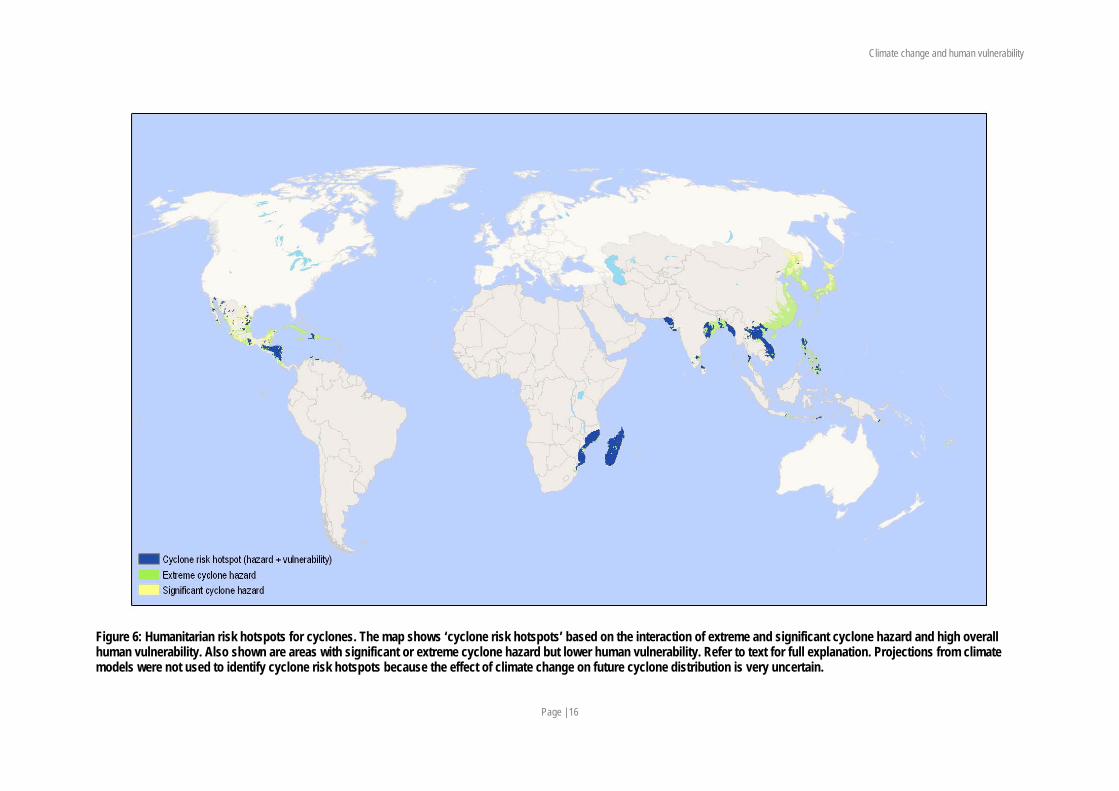
• Central America and the western part of South America Figure 5 shows the distribution of flood risk hotspots in East Africa. It also shows areas where the amount of extreme precipitation is projected to increase in the future. Where these areas intersect with flood risk hotspots they may signify the potential for increasing flood risk over the next 20-30 years. Flood risk hotspot areas that are projected to receive increases in extreme precipitation include the Horn of Africa, the Kenya/Tanzania region and parts of Madagascar. Figure 6 shows hotspots of cyclone risk based on the interaction of high human vulnerability with significant historic and current cyclone hazard. Hotspots of humanitarian risk relating to cyclones are much less extensive than for other climate hazards. They occur largely in Mozambique and Madagascar, Central America and the Caribbean, Bangladesh, several parts of India, Vietnam and several other Southeast Asian countries. Projections from climate models were not used to identify cyclone risk hotspots because the effect of climate change on future cyclone distribution is very uncertain. Figure 7 shows the distribution of cyclone risk hotspots in the Southeast Asia region.
Climate change and human vulnerability
Page | 14
Figure 4: Humanitarian risk hotspots for flooding. The map shows ‘flood risk hotspots’ based on the interaction of extreme and significant flood hazard and high overall human vulnerability. Also shown are areas with significant or extreme flood hazard but lower human vulnerability and areas where climate models predict an increase in extreme precipitation, as an indicator of possible future increases of flood risk. Refer to text for full explanation.
Climate change and human vulnerability
Page | 15
Figure 5: Humanitarian risk hotspots for flooding in the East Africa region. The map shows ‘flood risk hotspots’ based on the interaction of extreme and significant flood hazard and high overall human vulnerability. Also shown are areas with significant or extreme flood hazard but lower human vulnerability and areas where climate models predict an increase in extreme precipitation, as an indicator of possible future increases of flood risk. Refer to text for full explanation.
Climate change and human vulnerability
Page | 16
Figure 6: Humanitarian risk hotspots for cyclones. The map shows ‘cyclone risk hotspots’ based on the interaction of extreme and significant cyclone hazard and high overall human vulnerability. Also shown are areas with significant or extreme cyclone hazard but lower human vulnerability. Refer to text for full explanation. Projections from climate models were not used to identify cyclone risk hotspots because the effect of climate change on future cyclone distribution is very uncertain.
Climate change and human vulnerability
Page | 17
Figure 7: Humanitarian risk hotspots for cyclones in the Southeast Asia region. The map shows ‘cyclone risk hotspots’ based on the interaction of extreme and significant cyclone hazard and high overall human vulnerability. Also shown are areas with significant or extreme cyclone hazard but lower human vulnerability. Refer to text for full explanation. Projections from climate models were not used to identify cyclone risk hotspots because the effect of climate change on future cyclone distribution is very uncertain.
Climate change and human vulnerability
Page | 18
Food and water In this section we look at the interaction of human vulnerability with areas of high drought hazard in order to identify hotspots of humanitarian risk. The intensity and duration of droughts, as well as the area affected, is very likely to increase as a result of climate change. In addition to changes to the annual or seasonal amount of precipitation, there would be longer dry periods in many areas, leading to increased incidence of drought. Increasing numbers and intensity of droughts are likely to lead to increased water stress, land degradation, lower crop yields and increased risk of wild fire. These effects could have severe impacts on society, including food and water shortages.12 Figure 8 shows hotspots of drought risk, based on the interaction of high human vulnerability with significant historic and current drought hazard. In order to better understand how future climate change will affect humanitarian risk, Figure 8 also shows areas of projected increases in dry periods as a proxy for future drought risk. As is the case with flood and cyclone hazard distribution, significant changes in distribution of drought over the next 20-30 years are uncertain and not likely to be large. Therefore using current and historical drought risk data represents the most accurate way to determine future drought hotspots of humanitarian risk, with a likely intensification of droughts in currently prone areas likely to be more significant in humanitarian terms than changes in distribution. Figure 8 shows that the drought risk hotspots are located in the following regions:
• Large areas of sub-Saharan Africa
• South Asia, particularly Afghanistan, Pakistan and parts of India
• South East Asia, particularly Myanmar, Vietnam and Indonesia Figure 9 shows the distribution of drought risk hotspots in sub-Saharan Africa. It also shows areas projected to experience increases in dry periods as a proxy for future drought risk. There are some areas of Africa that are already drought hotspots, and the distribution of projected dry periods indicates that they are likely to experience increases in drought due to climate change. Examples include the region around Mozambique and Zimbabwe. There are also areas that are not currently considered drought risk hotspots because of their low or moderate vulnerability, for example Botswana and Namibia. However, the distribution of projected increases in dry periods indicates that these areas may increasingly suffer from drought as climate change proceeds. This is also the case for much of Central America.
Climate change and human vulnerability
Page | 19
Figure 8: Humanitarian risk hotspots for drought. The map shows ‘drought risk hotspots’ based on the interaction of extreme and significant drought hazard and high overall human vulnerability. Also shown are areas with significant or extreme drought hazard but lower human vulnerability and areas where climate models predict an increase in dry periods, as an indicator of possible future increases of drought risk. Refer to text for full explanation.
Climate change and human vulnerability
Page | 20
Figure 9: Humanitarian risk hotspots for drought in the sub-Saharan Africa region. The map shows ‘drought risk hotspots’ based on the interaction of extreme and significant drought hazard and high overall human vulnerability. Also shown are areas with significant or extreme drought hazard but lower human vulnerability and areas where climate models predict an increase in dry periods, as an indicator of possible future increases of drought risk. Refer to text for full explanation.
Climate change and human vulnerability
Page | 21
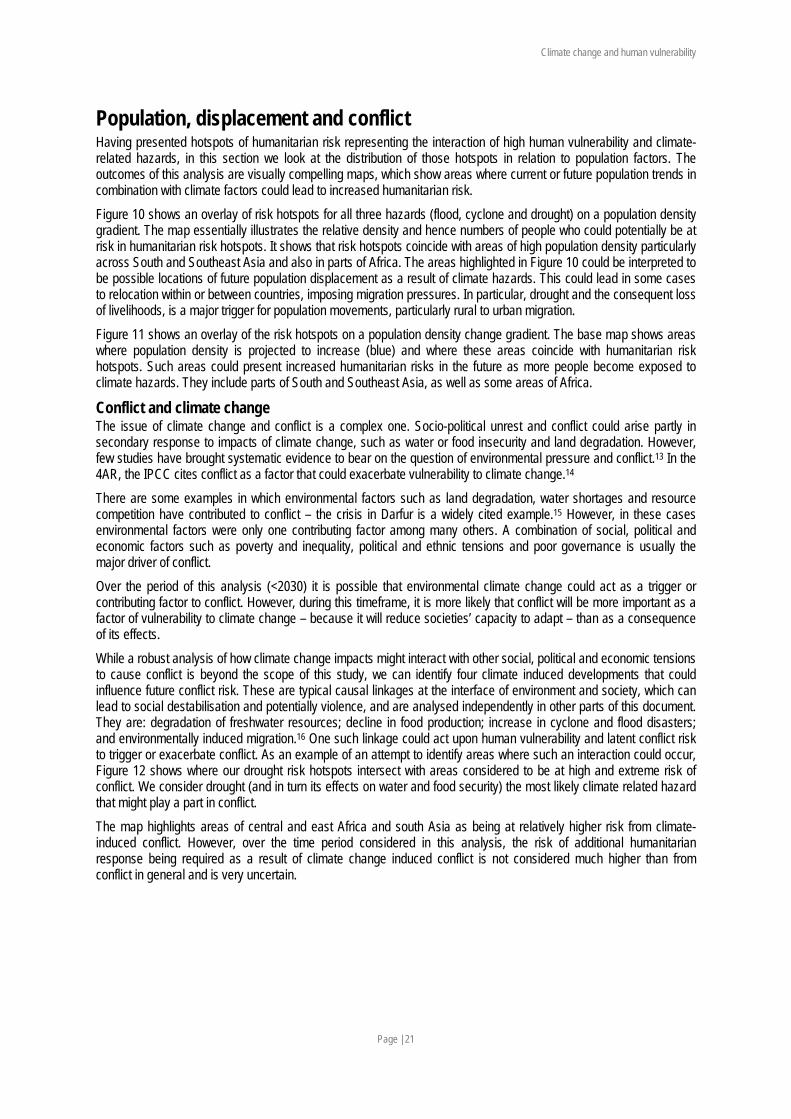
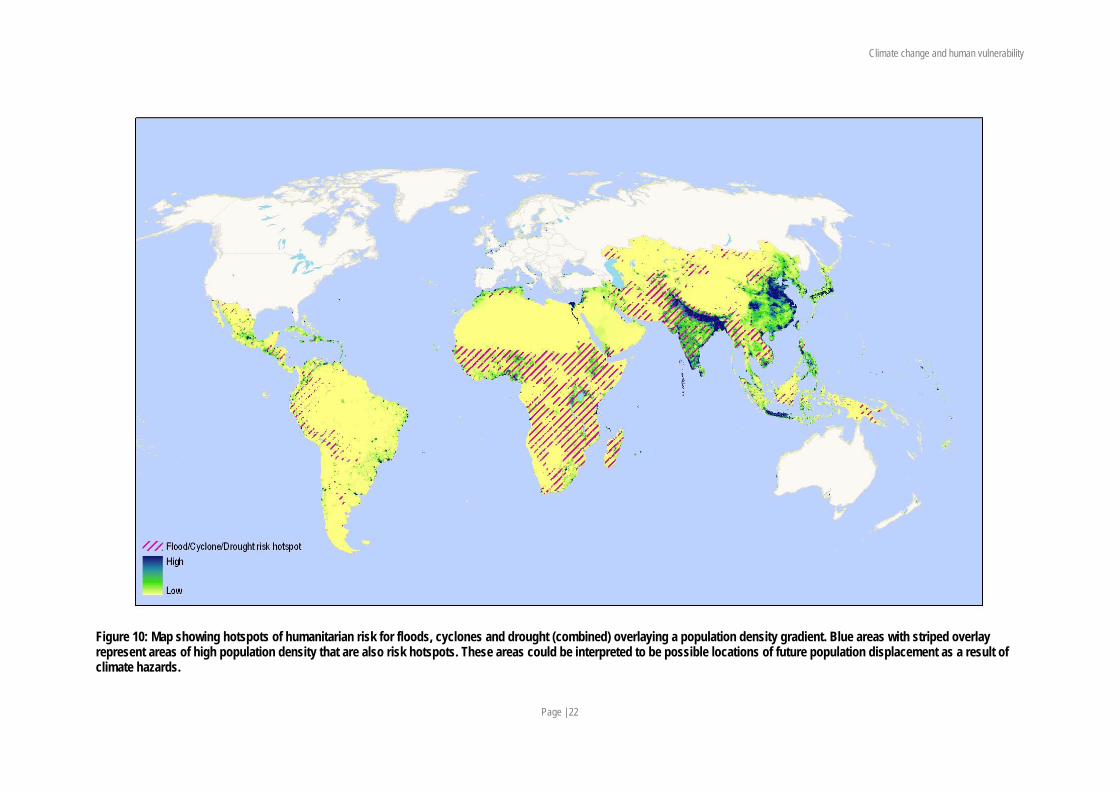
Population, displacement and conflict Having presented hotspots of humanitarian risk representing the interaction of high human vulnerability and climate-related hazards, in this section we look at the distribution of those hotspots in relation to population factors. The outcomes of this analysis are visually compelling maps, which show areas where current or future population trends in combination with climate factors could lead to increased humanitarian risk. Figure 10 shows an overlay of risk hotspots for all three hazards (flood, cyclone and drought) on a population density gradient. The map essentially illustrates the relative density and hence numbers of people who could potentially be at risk in humanitarian risk hotspots. It shows that risk hotspots coincide with areas of high population density particularly across South and Southeast Asia and also in parts of Africa. The areas highlighted in Figure 10 could be interpreted to be possible locations of future population displacement as a result of climate hazards. This could lead in some cases to relocation within or between countries, imposing migration pressures. In particular, drought and the consequent loss of livelihoods, is a major trigger for population movements, particularly rural to urban migration. Figure 11 shows an overlay of the risk hotspots on a population density change gradient. The base map shows areas where population density is projected to increase (blue) and where these areas coincide with humanitarian risk hotspots. Such areas could present increased humanitarian risks in the future as more people become exposed to climate hazards. They include parts of South and Southeast Asia, as well as some areas of Africa.
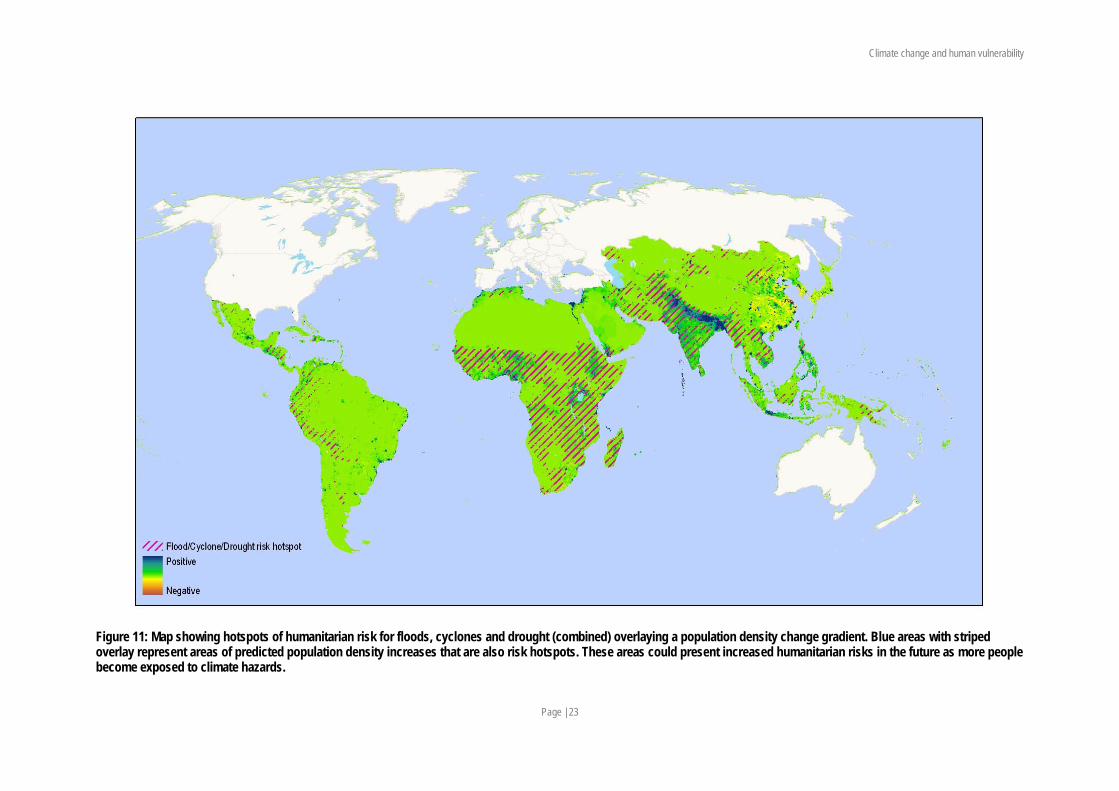
Conflict and climate change The issue of climate change and conflict is a complex one. Socio-political unrest and conflict could arise partly in secondary response to impacts of climate change, such as water or food insecurity and land degradation. However, few studies have brought systematic evidence to bear on the question of environmental pressure and conflict.13 In the 4AR, the IPCC cites conflict as a factor that could exacerbate vulnerability to climate change.14 There are some examples in which environmental factors such as land degradation, water shortages and resource competition have contributed to conflict – the crisis in Darfur is a widely cited example.15 However, in these cases environmental factors were only one contributing factor among many others. A combination of social, political and economic factors such as poverty and inequality, political and ethnic tensions and poor governance is usually the major driver of conflict. Over the period of this analysis (<2030) it is possible that environmental climate change could act as a trigger or contributing factor to conflict. However, during this timeframe, it is more likely that conflict will be more important as a factor of vulnerability to climate change – because it will reduce societies’ capacity to adapt – than as a consequence of its effects. While a robust analysis of how climate change impacts might interact with other social, political and economic tensions to cause conflict is beyond the scope of this study, we can identify four climate induced developments that could influence future conflict risk. These are typical causal linkages at the interface of environment and society, which can lead to social destabilisation and potentially violence, and are analysed independently in other parts of this document. They are: degradation of freshwater resources; decline in food production; increase in cyclone and flood disasters; and environmentally induced migration.16 One such linkage could act upon human vulnerability and latent conflict risk to trigger or exacerbate conflict. As an example of an attempt to identify areas where such an interaction could occur, Figure 12 shows where our drought risk hotspots intersect with areas considered to be at high and extreme risk of conflict. We consider drought (and in turn its effects on water and food security) the most likely climate related hazard that might play a part in conflict. The map highlights areas of central and east Africa and south Asia as being at relatively higher risk from climate-induced conflict. However, over the time period considered in this analysis, the risk of additional humanitarian response being required as a result of climate change induced conflict is not considered much higher than from conflict in general and is very uncertain.
Climate change and human vulnerability
Page | 22
Figure 10: Map showing hotspots of humanitarian risk for floods, cyclones and drought (combined) overlaying a population density gradient. Blue areas with striped overlay represent areas of high population density that are also risk hotspots. These areas could be interpreted to be possible locations of future population displacement as a result of climate hazards.
Climate change and human vulnerability
Page | 23
Figure 11: Map showing hotspots of humanitarian risk for floods, cyclones and drought (combined) overlaying a population density change gradient. Blue areas with striped overlay represent areas of predicted population density increases that are also risk hotspots. These areas could present increased humanitarian risks in the future as more people become exposed to climate hazards.
Climate change and human vulnerability
Page | 24
Figure 12: Humanitarian risk hotspots for drought and conflict. The base map shows an index of conflict risk. The striped areas of the map represent areas where drought risk hotspots coincide with high and extreme conflict risk. These areas are interpreted to be at relatively higher risk of climate-risk conflict. However, over the timeframe of this analysis the risk of additional humanitarian response being required as a result of climate change induced conflict is not considered much higher than from conflict in general and is very uncertain.
Climate change and human vulnerability
Page | 25
8 Conclusions • Climate change is very likely to increase the humanitarian risks from floods, tropical cyclones and drought. Although still
uncertain in terms of their future distribution at a local level, geographical patterns of climate hazards over the next 20-30 years can be predicted with a reasonable degree of certainty using current and historical data combined with results available from climate models. Many areas already affected by climate hazards, such as floods, cyclones and droughts, will probably see intensification of those hazards. This will lead to an overall increased humanitarian need in those areas. However, over the next 20-30 years there is unlikely to be a major shift in the scope or location of extreme weather hazards that can be predicted with any degree of certainty.
• The impact of humanitarian disasters is related to the degree of exposure to a particular hazard, such as a flood, storm or drought, and the vulnerability of those populations affected. Over the timeframe of this analysis (next 20-30 years), extreme weather hazards are not predicted to change much in location but are likely to intensify in many areas. This means that human vulnerability is likely to be a determining factor in the geographical distribution of humanitarian need. The largest and most important regions of high overall human vulnerability identified by this study are located in: Africa, particularly the Sahel, Horn of Africa and Central Africa; Central and South Asia, particularly Iran/Afghanistan/Pakistan/ India and the Caspian region; and Southeast Asia, particularly Myanmar, Laos, Cambodia and Indonesia.
• To identify future hotspots of humanitarian risk relating to climate hazards, we analysed the interaction of high human vulnerability with flood, cyclone and drought hazards. Figure 13 shows hotspots of humanitarian risk for each climate hazard analysed. Hotspots for humanitarian risk for flooding occur in: Africa, including the Sahel, the Horn of Africa, Great Lakes region, Central Africa and Southeast Africa; Central, South and Southeast Asia; and Central America and the western part of South America. Hotspots of humanitarian risk relating to cyclones occur largely in Mozambique and Madagascar, Central America, Bangladesh, several parts of India, Vietnam and several other Southeast Asian countries. Drought risk hotspots are mainly located in sub-Saharan Africa; South Asia, particularly Afghanistan, Pakistan and parts of India; and South East Asia, particularly Myanmar, Vietnam and Indonesia.
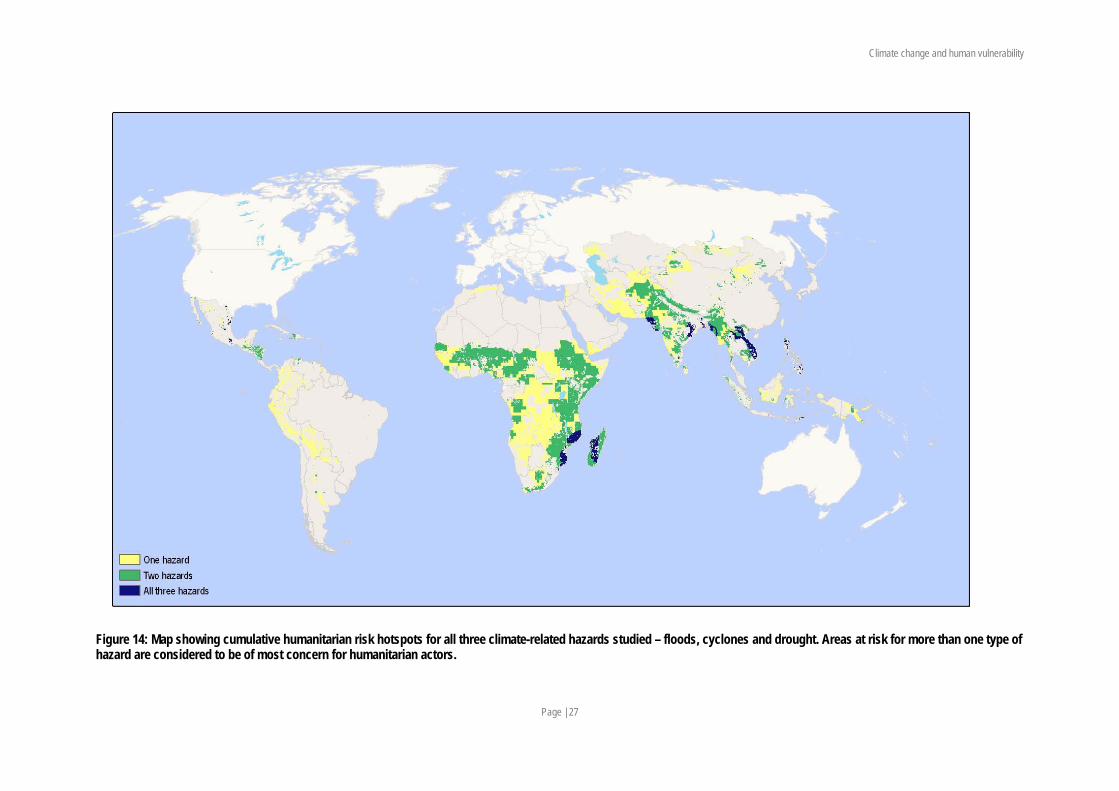
• Several parts of the world were identified as hotspots of humanitarian risk for more than one of the three types of hazards analysed. The distribution of multiple hazard hotspots is shown in Figure 14. Areas that are at risk from more than one climate related hazard warrant significant concern from humanitarian actors. These include much of sub-Saharan Africa, especially the east coast, and much of South Asia. There are some areas that are considered as risk hotspots for all three hazards analysed. These include Southeast Africa and parts of South and Southeast Asia.
• The interaction of high or increasing population density with increased humanitarian risk from climate change could lead to displacement in a number of areas. The most important areas identified by this study, which could be subject to migration pressures, are South and Southeast Asia and parts of Africa. Through extremely complex interactions between environmental, social and political factors, climate change could also play a part in triggering or exacerbating conflict. This analysis identified areas of Central and East Africa and South Asia as being at relatively higher risk of climate-induced conflict.
• Climate change not only increases humanitarian risks, but also increases the uncertainties surrounding where and how humanitarian disasters might unfold. This presents humanitarian actors with a challenge as it is likely to further stretch their capacity to respond effectively. Much humanitarian work in disaster preparedness and response already focuses on the effects of weather-related disasters and climate change therefore acts as an additional incentive to expand current programmes.
• For humanitarian actors, the major concern until 2030 should be areas already subject to extreme weather in combination with high human vulnerability (i.e. those areas identified as risk hotspots by this study). Over the next 20-30 years the increasing intensity of climate hazards in these areas is likely to result in a significant increase in humanitarian need. Humanitarians can be most effective by focussing efforts on reducing vulnerability in such risk hotspots. This is the most efficient strategy because the distribution of vulnerability is well known based on current data, knowledge and experience. However, the outputs of climate models, which could potentially indicate the distribution of future hazards, are uncertain at best and particularly so at the local level. As climate science advances, humanitarian actors will increasingly be able to incorporate climate projections into their planning.
• Reducing vulnerability will also make societies more able to adapt to small changes in climate. This is important because there is a significant risk that even small climatic changes in highly vulnerable areas could lead to a vicious cycle, which could reinforce existing patterns of vulnerability and make those areas more prone to climate-related disasters in the future. Integrating disaster risk reduction into development strategies for areas of extremely high vulnerability, regardless of predicted climate impacts, could usefully mitigate this risk over the longer term.
Climate change and human vulnerability
Page | 26
Figure 13: Humanitarian risk hotspots for the three major climate-related hazards studied – flood, cyclones and drought. Risk hotspots are defined as areas where high human vulnerability coincides with the distribution of weather-related hazards. The risk hotspots are shown as transparent layers to show where they overlap.
Climate change and human vulnerability
Page | 27
Figure 14: Map showing cumulative humanitarian risk hotspots for all three climate-related hazards studied – floods, cyclones and drought. Areas at risk for more than one type of hazard are considered to be of most concern for humanitarian actors.
Climate change and human vulnerability
Page | 28
Climate change and human vulnerability
Page | 29
9 References 1 Intergovernmental Panel on Climate Change (IPCC). 2007. IPPC Fourth Assessment Reports: Working Group I Report “The Physical Science Basis”. Available online at: http://www.ipcc.ch/. 2 Intergovernmental Panel on Climate Change (IPCC). 2007. Summary for Policymakers of the Synthesis Report of the IPCC Fourth Assessment Report. Available online at: http://www.ipcc.ch/. 3 Intergovernmental Panel on Climate Change (IPCC). 2007. IPPC Fourth Assessment Reports: Working Group I Report “The Physical Science Basis”. Available online at: http://www.ipcc.ch/. 4 World Bank. 2006. Hazards of Nature, Risks to Development: An IEG Evaluation of World Bank Assistance for Natural Disasters. Available online at: http://www.worldbank.org/. 5 United Nations International Strategy for Disaster Reduction (UNISDR). Hyogo Framework for Action 2005-2015: Building the resilience of nations and communities to disasters. Available online at: http://www.unisdr.org/. 6 EM-DAT: The OFDA/CRED International Disaster Database www.emdat.be Université Catholique de Louvain Brussels (Belgium). 7 UNDP. 2007. Human Development Report. 2007/8 – Fighting climate change: Human solidarity in a divided world. Available online at: http://hdr.undp.org/. 8 Intergovernmental Panel on Climate Change (IPCC). 2007. Summary for Policymakers of the Synthesis Report of the IPCC Fourth Assessment Report. Available online at: http://www.ipcc.ch/. 9 HM Treasury (UK). 2006. Stern Review on the Economics of Climate Change. Available online at: http://hm-treasury.gov.uk/. 10 UNDP. 2007. Human Development Report. 2007/8 – Fighting climate change: Human solidarity in a divided world. Available online at: http://hdr.undp.org/. 11 Dilley, M., Chen, R.S., Deichmann, U., Lerner-Lam, A.L. and Arnold, M. with Agwe, J. Buys, P., Kjekstad, O., Lyon, B. and Yetman, G. (2005): Natural Disaster Hotspots: A Global Risk Analysis. Washington, D.C.: International Bank for Reconstruction and Development/The World Bank and Columbia University. 12 UNESCO. 2006. From potential conflict to cooperation potential: Water for peace – prevention and resolution of water related conflicts. Available online at: http://www.unesco.org/. 13 Binningsbø, de Soysa & Gleditsch. 2007. Green giant or straw man? Environmental pressure and civil conflict, 1961–99. Population and Environment, 28:337–353.
14 Intergovernmental Panel on Climate Change (IPCC). 2007. IPPC Fourth Assessment Reports: Working Group II Report “Impacts, Adaptation and Vulnerability”. Available online at: http://www.ipcc.ch/. 15 UNEP. 2007. Post-conflict environmental assessment: Sudan. Available online at: http://postconflict.unep.ch/ 16 German Advisory council on Global Change (WBGU). 2007. Climate Change as a Security Risk. Available online at: http://www.wbgu.de/.