UNR Joint Economics Working Paper Series Working Paper No. 07-009 Urban Poor in China: A Case Study of Changsha Erqian Zhu and Shunfeng Song Department of Economics /0030 University of Nevada, Reno Reno, NV 89557-0207 (775) 784-6850│ Fax (775) 784-4728 email: [email protected]November, 2007 Abstract Since the late 1970s, many state-owned enterprise employees have been laid off and more and more rural people have migrated to urban areas. In this massive laying-off and migration process, many laid-off workers and migrants have become urban poor. Using data collected from a survey on 1641 relatively low-income households in Changsha in January 2007, this paper compares migrant workers with their city counterpart regarding income, employment, education, and social support. Based on qualitative and regression analysis, we found that worker’s age, Hukou status, education, enterprise ownership, and contract length are significantly affecting the annual income. There exists a big gap in the coverage of social security between urban and migrant workers. This paper provides some policy recommendations. JEL Classification: R23, I30 Keywords: Urban poor; Hukou; Laid-off workers; Migrant workers; Income determinants; Social insurance
Transcript
UNR Joint Economics Working Paper Series Working Paper No. 07-009
Urban Poor in China: A Case Study of Changsha
Erqian Zhu and Shunfeng Song
Department of Economics /0030 University of Nevada, Reno
Since the late 1970s, many state-owned enterprise employees have been laid off and more and more rural people have migrated to urban areas. In this massive laying-off and migration process, many laid-off workers and migrants have become urban poor. Using data collected from a survey on 1641 relatively low-income households in Changsha in January 2007, this paper compares migrant workers with their city counterpart regarding income, employment, education, and social support. Based on qualitative and regression analysis, we found that worker’s age, Hukou status, education, enterprise ownership, and contract length are significantly affecting the annual income. There exists a big gap in the coverage of social security between urban and migrant workers. This paper provides some policy recommendations.
JEL Classification: R23, I30 Keywords: Urban poor; Hukou; Laid-off workers; Migrant workers; Income determinants; Social insurance
Abstract Since the late 1970s, many state-owned enterprise employees have been laid off
and more and more rural people have migrated to urban areas. In this massive laying-off and migration process, many laid-off workers and migrants have become urban poor. Using data collected from a survey on 1641 relatively low-income households in Changsha in January 2007, this paper compares migrant workers with their city counterpart regarding income, employment, education, and social support. Based on qualitative and regression analysis, we found that worker’s age, Hukou status, education, enterprise ownership, and contract length are significantly affecting the annual income. There exists a big gap in the coverage of social security between urban and migrant workers. This paper provides some policy recommendations. Key words: Urban poor, Hukou, laid-off workers, migrant workers, income determinants, social insurance JEL codes: R23, I30
Before the 1990s, poverty in China had been considered as a rural issue. On one
side, this is partly because the urban poor population was too small to be noticed. On
the other side, poverty in rural areas was experiencing absolute poor in that period.
After the reform, the rapid development of the Chinese rural economy has improved
the absolute poor situation in rural areas. In consequence, rural residents’ average
annual income increased from 134 RMB in 1978, to 397 RMB in 1985, 602 RMB in
1989, and 3254 RMB in 2004(NBSC, China Statistical Yearbook, 2006). The Engel
coefficient for rural residents lowered from 0.677 in 1978 to 0.455 in 2005. The rural
poor population decreased from about 250 million in 1978 to 29 million in 2003,
accounting for 30.7 percent and 3 percent of the total rural poor population,
respectively (Xinhua News Agency, Oct 18, 2004).
While China has made a good progress in cutting the rural poverty population,
considerable amount of urban residents who have not benefited much from the
economic reform become the urban poor. Over last 10 years, the registered urban poor
have grown for more than twenty folds, from 0.85 million in 1996 to 22.32 million in
2005 (Ministry of Civil Affairs of People’s Republic of China, 2006). The process of
urbanization also has drawn millions of labors and families from rural areas to cities,
which further accelerates the growth of the poor population in Chinese cities.
Many studies have examined the urban poor problem, with most at the national
level. Some have analyzed factors that cause urban poor, such as the economic
transition, sector changes, labor demand and supply, urbanization, inflation (Tang,
2002; Mo, 2003; Wei, 2004; Sun and Qi, 2005; Li, 2005; Mei and Qin, 2005; Li and
Li, 2006). Some have investigated how the poverty lines are determined (Tang,
1997; Hussain, 2003; Chen, 2006). Some have proposed policy recommendations to
reform the social security system, enforce re-employment schemes, and improve a
balance between fairness and efficiency (Mei and Qin, 2005). Little research has been
done from a micro aspect, such as for a city. Because China has a large range of
territory and 33 administrative provinces and multiplicities, the problem of urban poor
1
varies from cities to cities. A closer look at urban poor by cities will help the country
to alleviate the problem more efficiently.
This paper analyzes the urban poor in China through a case of study of
Changsha city. The paper is structured as the follows. Section 2 reviews the
literature on the urban poor in China. Section 3 describes a survey conducted in
Changsha City, provides qualitative analysis on the urban poor, and examines income
determinants using the sample data from the survey. The final section concludes
main findings and makes policy recommendations.
2. Urban poor in China
This section attempts to provide a general picture of the urban poor in China by
answering the following questions. How many urban poor does China have? How
poor are the urban poor? Who are the urban poor? What cause the urban poor?
How many urban poor does China have?
A number of papers have examined the urban poor population in China, using
various criteria and from different perspective. Zhu (1998) estimated that the urban
poor population is about 30 million in1996, based on the NBSC’s survey on urban
residents and the organization of Chinese Labor Unit’s survey on 60,000 randomly
selected enterprises in China. Yang (2002) believed that Zhu’s figure was
underestimated because China had 16 million employees of suspended or bankrupted
companies, who were not included by the government as urban poor. Hua (2004)
estimated that there were 32.4 million urban poor by the end of 1997. No consensus
has been reached about the number of China’s urban poor.
Also, we believe that the official statistics underestimate the urban poor
population, mainly due to the fact that most poor rural migrant workers are excluded
from the official numbers. In 2005, more than 150 million rural residents swarmed
into the cities all across China (Li, 2005), and the majority of them entered into large
and developed cities in the eastern coast (Liu et al. 2003; World Bank 2006). Beijing
2
had around 4 millions workers from rural areas, and Shanghai had over 3 millions.
Because of the China’s urban household registration (Hukou) system, these rural
workers seldom receive the equal treatment as those who were born in the city. For
example, in 2004, the average income of the urban workers is 16,020 Chinese yuan.
But the workers from rural areas only got 6400 yuan on average (Liu, 2004). Besides,
most of rural workers are deprived of all kinds of benefits like health insurance and
employment-related insurance. They are suffering from poor living conditions, long
working hours and tough working environments (Lu and Song, 2006). Yet these poor
migrant workers are not in the official statistics of the urban poor and are not entitled
to receive social assistance from the city government. These rural migrants constitute
an ever-increasing undocumented urban poor population in China.
In this paper, we consider the urban poor population as the number of recipients
who receive the minimum subsistence from the Chinese government. This number
will certainly understate the true population because almost all rural poor migrants are
excluded from the welfare system and many urban poor are not registered. Since
this paper does not focus on the exact number of urban poor, using more consistent
data from official source would better describe the trend.
The Ministry of Civil Affairs (MCA) of China publishes a statistical bulletin
every year to report civil affairs, including the number of minimum subsistence
recipients in Chinese cities. Over last 10 years, the registered urban poor have
grown for more than twenty five folds, from 0.85 million in 1996 to 22.4 million in
2006 (Ministry of Civil Affairs of People’s Republic of China, 2006). In 2006, this
population accounted for 4.1 percent of the total urban residents in Chinese cities.
Table 1 shows the numbers from 2000 to 2006. From 2000 to 2002, China had
a rapid growth of its urban poor population, partly due to the increased awareness and
expansion of the coverage of the social assistance program, within which more and
more people are officially defined as urban poor. Although these are numbers of
minimum subsistence recipients, it reveals the least urban poor population. We can
say that by the end of 2006, China had at least 22,409,000 urban poor residents and
this number does not include the rural migrants who live in the city but are not
3
registered urban residents.
Table 1: Number of recipients of minimum subsistence
Year Number of recipients ( thousand)
2000 4,026
2001 11,707
2002 20,536 2003 22,350
2004 22,008
2005 22,328
2006 22,409
Source: National Bureau of Statistics of China, 2007
How Poor Are the Urban Poor?
Measurements of poverty are essential in the process of defining urban poor. One
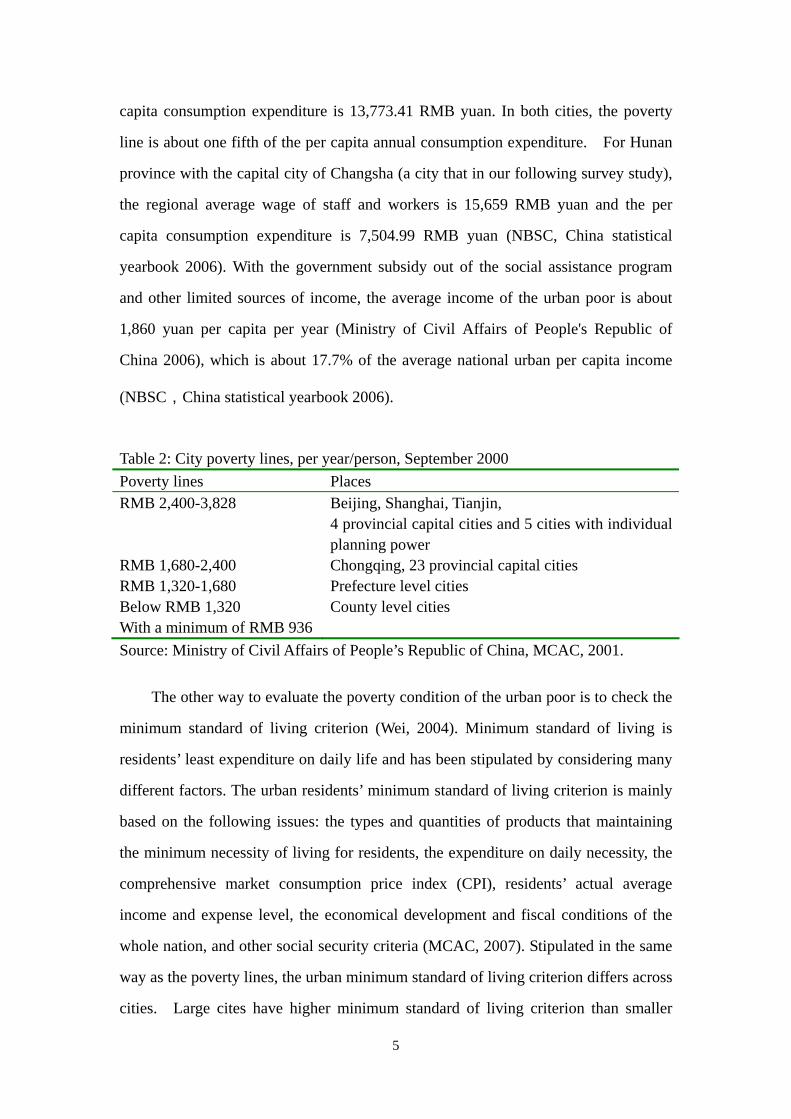
way to define the urban poor is to look at the poverty lines (Hussain, 2003). Table 2
presents a broad picture of the poverty lines across cities. It shows that urban poverty
lines vary with the administrative status and sizes of the city. The poverty line is
higher for higher administrative status and bigger cities. If we compare the
employees’ average wage and urban residents’ per capita annual consumption
expenditure in 2000 to urban poverty lines, it is easier to have an idea of how many
people are living below the poverty line and what kind of life they have. In 2000, the
national average wage of staff and workers is RMB 9,371 yuan, which is about 2.5
times as the highest poverty line; and the national per capita annual consumption
expenditure is 4,998, which is 1,000 higher than the highest poverty line (NBSC,
China statistical yearbook, 2001). This comparison has omitted the regional
differentiation, but a relative big gap between the poor and average level appears.
Take Beijing for example, in 2005,its average wage of staff and workers is 34,191
RMB yuan and the per capita consumption expenditure is 13,244.20 RMB yuan. For
Shanghai, its average wage of staff and workers is 34,345 RMB yuan and the per
4
capita consumption expenditure is 13,773.41 RMB yuan. In both cities, the poverty
line is about one fifth of the per capita annual consumption expenditure. For Hunan
province with the capital city of Changsha (a city that in our following survey study),
the regional average wage of staff and workers is 15,659 RMB yuan and the per
capita consumption expenditure is 7,504.99 RMB yuan (NBSC, China statistical
yearbook 2006). With the government subsidy out of the social assistance program
and other limited sources of income, the average income of the urban poor is about
1,860 yuan per capita per year (Ministry of Civil Affairs of People's Republic of
China 2006), which is about 17.7% of the average national urban per capita income
(NBSC,China statistical yearbook 2006).
Table 2: City poverty lines, per year/person, September 2000 Poverty lines Places RMB 2,400-3,828 Beijing, Shanghai, Tianjin,
4 provincial capital cities and 5 cities with individual planning power
RMB 1,680-2,400 Chongqing, 23 provincial capital cities RMB 1,320-1,680 Prefecture level cities Below RMB 1,320 With a minimum of RMB 936
County level cities
Source: Ministry of Civil Affairs of People’s Republic of China, MCAC, 2001.
The other way to evaluate the poverty condition of the urban poor is to check the
minimum standard of living criterion (Wei, 2004). Minimum standard of living is
residents’ least expenditure on daily life and has been stipulated by considering many
different factors. The urban residents’ minimum standard of living criterion is mainly
based on the following issues: the types and quantities of products that maintaining
the minimum necessity of living for residents, the expenditure on daily necessity, the
comprehensive market consumption price index (CPI), residents’ actual average
income and expense level, the economical development and fiscal conditions of the
whole nation, and other social security criteria (MCAC, 2007). Stipulated in the same
way as the poverty lines, the urban minimum standard of living criterion differs across
cities. Large cites have higher minimum standard of living criterion than smaller
5
cites because of less restrictions from local finance. In the first quarter of 2007, the
minimum standard of living criterion for Beijing is 310 RMB yuan per month, and it
is 197.78 RMB yuan per month for Changsha (NBSC, 2007). The key point needs to
be emphasized is this minimum standard of living is only the least amount of money
that help one person to survive, which is a very small amount of money that just
solves the “absolute poverty” problem.
Who are the urban poor?
Urban poor population can be generally categorized into four groups (MCAC,
2007; Wei, 2004; Li, 2005). The first group includes people who are unable to work
(i.e. disabled persons), no income source and no legal raiser (i.e. orphans). They are
normally called “three does not have” persons in China. Although the current social
security system can provide some subsidies to them, the amounts of subsidies are
really limited. These people can only live on the subsidies to survive in their daily life
and they are the first ones who should be considered as poor people. The second
group includes the unemployed population. Unemployment is becoming more and
more common in our daily life with the economical change and grows. If those
unemployed workers or laid-off employees could not find jobs again, they are losing
the source of living. Although government provides the minimum standard of living
subsidies to these people, they still live in poverty. The third group includes retired
people. In China, retired people depended on the retirement pension which provided
by companies they previously worked for. If the companies are running well, their
retirement pension is relatively higher and vice versa. According to current
employment situation in China, there are many laid-off and unemployed workers
because of companies’ reduction of staff to pursue economic profit or companies’
bankruptcy, those retired people’s retirement pension can not be guaranteed and
remains at a high level. The fourth group includes people who do not participated in
any social security program, low income or non income residents who have diseases
and people whose residential registration belongs to another place other than local
areas. The last mentioned people in this group have been defined as “floating
6
population”, which came with the rural to urban migration phenomenon. Because
many people are coming from rural areas and being paid low salaries, and live without
such protections as urban residents do, this “floating population” becomes a
significant part in the urban poor. In this group, there are people who are looking for
jobs. There are a certain number of people who has the ability to work but can never
find a satisfying job and then stay home without doing anything. Without any steady
income stream, those people have to be enrolled in the poor population.
Table 3 presents information about the numbers and ratios of four different
groups of people in the urban poor. In 2005, close 40 percent of all urban poor are
those who were unemployed. There are 55.70 percent of urban poor people belongs
to the fourth group as mentioned above. It is easy to see that floating population in
the fourth group is an important component of urban poor population.
Table 3: Numbers and ratios for different groups of urban poor people in 2005 Groups Three does not have Unemployed Retired Other
Number (thousand) 957 8332 602 12436
Ratio1 4.29% 39.56% 2.70% 55.70%
Source: Annual statistical report, MCAC, 2005.
It is worth noticing that the composition of the urban poor has changed during
the last 10 years. In 1995, the elderly, children, and disabled accounted for 82.27
percent of the total urban poor while the unemployment was not an issue. However, in
2005, the share of the unemployed and the laid-off workers has risen to 39.56 percent
(the unemployed and the laid-off workers are not the same in official Chinese
statistics) (Ministry of Civil Affairs of People’s Republic of China 2006). That means
the increasing unemployment has become a main source of the urban poor. According
to the official statistics, the registered unemployment rate was only 2.9 percent in
1995 and the proportion of the labor force in the labor market was as high as 83
1 According to Ministry of Civil Affairs of China’s annual statistical report, there are 22,328,000 urban residents received minimum subsistence, the ratio is calculated by the following equation: ratio=number/ 22,328.
7
percent. But by 2004, the registered unemployment rate rose to 4.5 percent and the
proportion of the labor force in the labor market declined to 71.6 percent (Cai 2006).
The actual unemployment rate could be much higher than that (Song 2003; Xue and
Wei 2003), because these data exclude the rural migrant workers.
Causes of urban poor
What cause the increasing urban poor population? Many previous studied have
discussed causes of urban poor in China, from various perspectives (Mo, 2003; Li,
2004; Wei, 2004). The first reason is the economic reform from planned-economy to
market economy (Song, 2001). The reform started in the late 1970s has leaded
Chinese economy into the international stage and brought the Chinese GDP in the
fourth place of the world by 2005 (NBSC, China statistical yearbook 2006). The
economic growth, however, does not benefit every one. In fact, China sees a vast
number of laid-off workers from public-owned enterprises. Before the reform,
China attempted to maximize urban employment and offered its workers irrevocable
job contracts (“iron-rice bowl” in Chinese terms). After the reform, this full and
permanent employment policy stepped out of the stage and many workers are laid off
to improve labor efficiency in production. The registered unemployed workers
increased from 5.75 million in 1999 to 8.39 million in 2005, with registered
unemployment rate of 3.1 and 4.1 percent, respectively (NBSC, China Statistical
Yearbook, 2006). These laid-off and unemployed employees constitute a great of
number of the urban poor population.
The second reason is related to the structural changes of the Chinese economy, in
terms of sectorial shift and ownership changes. According to the National Bureau of
Statistics of China (NBSC, China Statistical Yearbook 2006) data, in 1978, there were
70.5%, 17.4% and 12.1% employees working in the first, second and third industry,
respectively. In 2005, these ratios changed to 44.8%, 23.8%, and 31.4%. In 1978,
99.8 percent of urban employment belonged to the public sector which includes
state-owned and collectively-owned enterprises. This share decreased to 26.7% in
2005. These structural shifts imply frictional unemployment in urban China because
8
workers need time to transfer from one sector to another (many workers lose their
jobs in one sector but find new jobs in other). Some old industrial bases and resource
exhausted cities had experienced huge unemployment during the past two decades.
Take Jilin Province for example, there is 0.47 million workers that have had to
entangle in the state-owned companies reform and then lost their jobs (Ding, 2006).
The third important factor that causes the increasing number of urban poor is the
prominent rural-to-urban migration. Migrant farmers are usually defined as “floating
population” in China, who live in cities without permanent urban residence
registration. From 1996 to 2005, the estimated “floating population” increased from
6.6 million to 11.3 million (NBSC, China Statistical Yearbook 1997-2006); and
according to unofficial estimation, the “floating population” in 2006 is about 18
million (Li, 2005). There are two general reasons which contribute to the rural to
urban migration. One is the difficulty of living in rural areas because of farm land
scarcity and too much taxes and fees imposed on peasants that push rural residents out
of their hometowns (Zhang and Song, 2004). The other is the attractions from cities
in terms of high income and living quality or other factors that pull rural residents out
from relative simple life to prosperous life. Equipped with lower education level and
no permanent residence registration; this “floating population” could only find jobs
require physical energy with less payment. Therefore, many of them become urban
poor.
The fourth cause of urban poor is the incomplete social security system in China.
Although the social welfare guarantee system has greatly improved in the last two
decades, the government subsidy still can not fill the gap between the subsidies
needed population and the subsidy receivers. In 2003, the number of registered urban
unemployment persons for the total 31 provinces and municipalities is 6.84 million;
by 2005, this number increased to 7.197 million (NBSC, China Statistical Yearbook
2006), the growth rate of registered urban unemployment persons for these two years
is 5.44 percent.. According to the statistical annual report released by Ministry of
Civil Affairs of People’s Republic of China in 2004, after the minimal living standard
guarantee system started from 1999, more than 22 million urban residents received
9
government subsidy each year since 2003. All these facts show that the social security
system is not advanced enough to protect the urban residents’ life. As stated by Ding
(2006), China’s economic reform was widely processed under almost no social
welfare guarantees and this closely connected the unemployment and poverty.
In addition to the above causes, some other factors also contribute to the
increasing urban poor population in China, including inflation, limited coverage of
medical insurance, lack of job training, and inefficiency of the labor market. In fact, to
mitigate the urban poor problem, China may have to pay more attention to these
factors than the first three causes discussed above. Here we would argue that laying
off redundant workers, structural shifts, and rural-urban migration are inevitable in the
process of economic reform and development.
Consequences of rising urban poor population
Government should pay more attention to the negative influences that urban poor
problem brought about. One of the most explicit problems is that urban poor reduces
the capability of national economy runs in a steady and healthy way. The expansion of
urban poor will enlarge the income gap and then trigger a series of social problems
that affect the stability of society. This situation might be an obstacle in the middle of
constituting a harmonious well-being society in China.
Another problem is that urban poor creates labor force waste and loss of
economy wealth (i.e., GDP). Because the most of the urban poor population is
composed of “laid-off” or “unemployed” workers who are able to work but do not
have opportunities to work, this unused labor force is a huge waste for the whole
nation or even the world’s labor resources. Further more, if the urban poor population
keeps growing, the government needs to provide more social welfare to assist those
people, and subsidies will be a burden for the nations finance and reduce the nation’s
wealth.
10
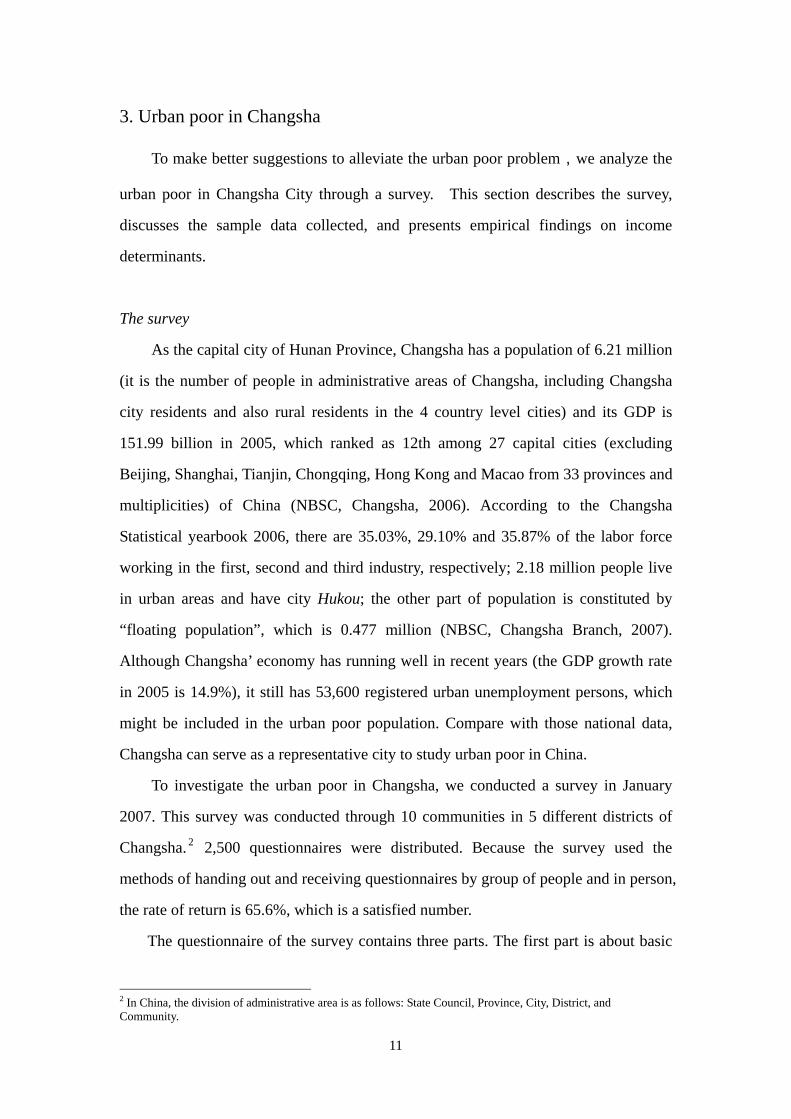
3. Urban poor in Changsha
To make better suggestions to alleviate the urban poor problem,we analyze the
urban poor in Changsha City through a survey. This section describes the survey,
discusses the sample data collected, and presents empirical findings on income
determinants.
The survey
As the capital city of Hunan Province, Changsha has a population of 6.21 million
(it is the number of people in administrative areas of Changsha, including Changsha
city residents and also rural residents in the 4 country level cities) and its GDP is
151.99 billion in 2005, which ranked as 12th among 27 capital cities (excluding
Beijing, Shanghai, Tianjin, Chongqing, Hong Kong and Macao from 33 provinces and
multiplicities) of China (NBSC, Changsha, 2006). According to the Changsha
Statistical yearbook 2006, there are 35.03%, 29.10% and 35.87% of the labor force
working in the first, second and third industry, respectively; 2.18 million people live
in urban areas and have city Hukou; the other part of population is constituted by
“floating population”, which is 0.477 million (NBSC, Changsha Branch, 2007).
Although Changsha’ economy has running well in recent years (the GDP growth rate
in 2005 is 14.9%), it still has 53,600 registered urban unemployment persons, which
might be included in the urban poor population. Compare with those national data,
Changsha can serve as a representative city to study urban poor in China.
To investigate the urban poor in Changsha, we conducted a survey in January
2007. This survey was conducted through 10 communities in 5 different districts of
Changsha. 2 2,500 questionnaires were distributed. Because the survey used the
methods of handing out and receiving questionnaires by group of people and in person,
the rate of return is 65.6%, which is a satisfied number.
The questionnaire of the survey contains three parts. The first part is about basic
2 In China, the division of administrative area is as follows: State Council, Province, City, District, and Community.
11
information, such as gender, age, marital status, place of location and degree acquired.
The second part is about employment information, such as whether the person has a
job or not, what kind of job the person has, annual income, whether the person has a
healthy insurance or not, and whether the person has unemployment insurance or not.
The last part is about living information, such as how many family members are you
living with, monthly expenses, housing information and the most urgent problem that
needs government’s help. Since we already talked to the people who are in charge of
the communities (those managers knew who are the poor people are) before we
handed out the questionnaires, it is easier to get the effective responses from poor
people who are living in the city. In other words, we have targeted the respondents of
the survey with the help of local district officials, which insures that the respondents
of the survey are relatively poor residents in the city. Although the community
managers and us went into people’s home or asked people to go to the communities’
offices and even had people who were selling food on the street to fill the
questionnaires, some of them are not able to answer the questions very well because
the lack of basic cognitive knowledge.3 That is why the result contains a total number
of effective questionnaires of 1,641 out of 2,500 questionnaires.
Since the average annual income for staff and workers of Changsha in 2006 is
24,615 RMB yuan (NBSC, Hunan Branch, 2007), we designed the questionnaires to
be fill by people with annual income range in the following: fewer than 3,000, 3,000
to 5,000, 5,000 to 10,000, 10,000 to 20,000, 20,000 to 50,000 and over 50,000 RMB
yuan. The survey results showed that 86.36% of people in the survey have annual
income less than 20,000 RMB yuan. This indicates that the survey indeed included
relatively poor people living in Changsha. In addition, as housing is major issue in
people’s daily life. In 2004, there are 80 percent of people who are living in Changsha
have their self-owned houses to live (http://www.haofz.com/wz/1.aspx?id=6372, Nov
26, 2005), but only 46 percent of sample population has their self-owned houses to
live in 2007. This is another indication to show the sample population is relatively
3 Cognitive knowledge: here means some of them are half illiterates, some of them are not very familiar with the governmental policies about working or living, so they can not answer the questions correctly and appropriately.
poor people living in the city. However, our survey might exclude some very poor
residents in the city because of cognitive knowledge deficiency and other factors, so
this might result in an overestimation for the annual income level and underestimation
of poor conditions for urban poor people.
Income Determinants
Poverty is normally measured with reference to either by income or expenditure
required by meeting basic needs (Hussain, 2003). Since we got exact information
about personal income in the survey, this paper uses income to measure the urban
poor in Changsha. Specifically, we want to investigate factors that affect people’s
income.
After conducting an extensive literature on income determination (e.g., Li, 1997,
Lu and Song, 2006), we choose the following variables in our income analysis. First,
we consider about gender. In China, gender always plays an important role in
employment issues. Because of physical energy difference, a male employee is
preferred to a female employee by employers and tends to get higher payment than a
female does, especially for some pure physical labor required jobs. In our sample, we
have 868 males and 773 females. The ratio of men to women is 1.12:1, which indicate
a relatively balanced employment in gender.
The second factor is age. Many relatively higher payment job positions always
require employees to have previous working experience, which are closely related to
employees’ age. Specifically, the maturity of a person and the ability to deal with
difficulties are also positively correlated to this person’s age. The average age in our
sample is 38.83 years old, which might imply this group of people, might have at least
ordinary salaries as their counter parts in the same level companies. Because the
sample variance is relatively large for this age variable, we use log of age instead of
age to reduce the variability of this variable.
The third factor is Hukou. If we look at recruitment posts, there are many relative
high payment positions, such as accountants and capital managers, are only accepting
employees from local areas with city registered Hukou. This is a requirement for
13
people who are looking a steady and good paid job in a city. We have categorized
surveyed people into two groups: urban population who has city Hukou (registered as
permanent residents in Changsha) and floating population who does not have Hukou
in Changsha. There are 1305 people grouped into urban population and 336 people
grouped into floating population in our survey.
The fourth factor is the education level. Education level is a main indicator for
employers to look at when they are hiring employees. Which level of education is
obtained by the candidate is always considered to measure the person’s ability to
perform the duty of the position. This is one reason why more and more people are
pursuing higher education in order to be more competitive in the job market. In our
survey, 18 people had been educated under primary school level, 95 people with a
primary school certificate, 407 people with junior high school certificates, 562 people
with high school certificates, 312 people graduated from professional training school
(this kind of schooling certificate is in the same level as senior high schooling
certificate) and 247 people owned a college bachelor degree. In the regression,
different levels of degrees are coded numerically, say, under primary school =1,
primary school=2, junior high school=3, senior high school=4, professional training
school=5 and college =6.
The fifth factor is working time of the employee. In China, many companies
have such policy stipulates that employees can get bonus payments if they are
working for the company more than a certain years, like 5 years or above. This kind
of policy will encourage employees to work in an active and loyal way. The average
working duration for those people who participated in our survey is 13.35 years. As
the as age, we use log of working time duration in order to reduce variability.
The sixth factor is training before working. Training before working could help
employees to increase the proficiency in jobs and as a result, more skilled workers
intend to get more payment. There are 33.8 percent people has training before
working experiences in the survey.
The seventh factor is job types of ownership for companies. Some jobs like the
state-owned companies offered less payment but a secured working contract for
14
employees, some companies featured as joint-venture or foreign capital sponsored
will offer higher payments but less secured job positions. According to data generated
from our survey, there are 56.67 percent of people working in state-owned companies,
the other portion of people are working in collect-owned, private, foreign, or
joint-venture companies.
The last factor we would like to count in is the contract type. The length of
contract is an indicator of welfare provided by companies. Temporary contact does
not provide such health insurance or other protection for employees, which will
decrease the payment for employees in terms of other expenses. About half of the
population in our survey have employment contract longer than 3 years; others are
having contracts with less than 3 years length, including employees working without
contracts. Because the contract length is so different between permanent contract and
temporary contract, we use log of contract length to reduce variability even though it
has been coded by numeral levels in the survey.
The annual income, the dependant variable in our regression model, is the sum of
12 months income and bonus. It is an ordinal variable, with 1 for less than 30,000
yuan, 2 for 3,000~5,000 yuan, 3 for 5,000~10,000 yuan, 4 for 10,000~20,000 yuan, 5
for 20,000~50,000 yuan, and 6 for over 50,000 yuan. To reduce the variation both in
dependent and independent variables, we use natural log for annual income, age and
working time duration.
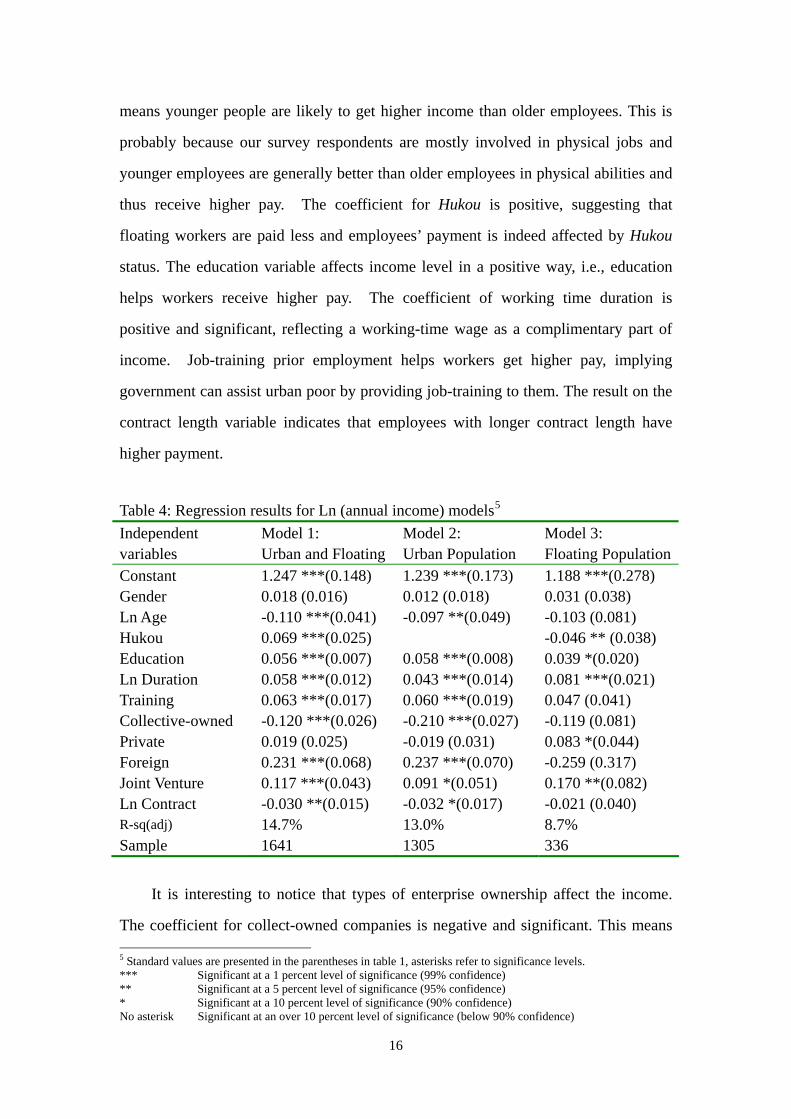
Table 4 presents the regression results, for the full sample, urban residents, and
floating population, respectively. In the third model, we adjusted the Hukou variable
by creating the dummy variable for people who has a local rural Hukou =1 and
otherwise=0. By doing this, we might able to analyze the income difference between
local rural-urban migrants and rural-urban migrants from outside areas with the
floating population group.4 Model 1 shows that age, education level, working time
duration, training before or after work, types of ownership (collective-owned, foreign,
joint-venture) and contract length are significantly affect the annual income of urban
poor people living in Changsha. Specifically, the coefficient for age is negative. This 4 In our sample, Hukou is mostly correlated with contract length, work-time duration, and education.
15
means younger people are likely to get higher income than older employees. This is
probably because our survey respondents are mostly involved in physical jobs and
younger employees are generally better than older employees in physical abilities and
thus receive higher pay. The coefficient for Hukou is positive, suggesting that
floating workers are paid less and employees’ payment is indeed affected by Hukou
status. The education variable affects income level in a positive way, i.e., education
helps workers receive higher pay. The coefficient of working time duration is
positive and significant, reflecting a working-time wage as a complimentary part of
income. Job-training prior employment helps workers get higher pay, implying
government can assist urban poor by providing job-training to them. The result on the
contract length variable indicates that employees with longer contract length have
higher payment.
Table 4: Regression results for Ln (annual income) models5
It is interesting to notice that types of enterprise ownership affect the income.
The coefficient for collect-owned companies is negative and significant. This means 5 Standard values are presented in the parentheses in table 1, asterisks refer to significance levels. *** Significant at a 1 percent level of significance (99% confidence) ** Significant at a 5 percent level of significance (95% confidence) * Significant at a 10 percent level of significance (90% confidence) No asterisk Significant at an over 10 percent level of significance (below 90% confidence)
16
people who are working in collect-owned companies have less income than people
working in state-owned companies do; people working in a foreign or joint venture
company have higher payment than people who are working in state-owned
companies do because of the coefficients for these two variables are positive and
significant. Theses results imply the characteristics of companies with different types
of ownerships in China. State-owned or collective-owned companies always provide
more secured jobs but less income due to the features of these companies: there are
normally big and old companies belongs to the industrial sector and play a role of
fundamental infrastructure in the developing process instead of profit seeking. Foreign
or joint venture companies have sufficient funds and reputation. They are more
focusing on profit and provide relative higher income for their employees. That is
why people would like to have higher income will look for jobs in foreign or joint
venture companies; and those are enjoying the secured working positions will look
jobs in state-owned or collective-owned companies.
The regression on the urban worker sub-sample does not show qualitative
differences from those for the full-sample. Model 3, however, produces some
unexpected results. For example, job-training and age are no longer significant
factors for migrant’s income. This could be due to less access to job-training for
rural migrants and less age variation among migrant workers (28.83 years old on
average, 10 years younger than the full-sample average). Nevertheless, model 3
shows that migrant workers receive higher pay if they are better educated, have
worked longer, and employees of joint-venture companies. Additionally, in this model,
we have adjusted the Hukou variable by creating the dummy variable for people who
has a local rural Hukou =1 and otherwise=0. The result on the Hukou variable tells
that rural migrants from outside of Changsha earn more than local rural workers.
We also used a logit model to determine income factors by dividing workers into
two groups, with the first group for those who had annual income less than 10,000
yuan. Table 5 presents the results. According to the signs of coefficients of variables,
male and younger workers are more likely to get higher pay than female and older
workers; workers with city Hukou are paid better than people who do not have city
17
Hukou; education and working experience help people get more; comparing with SOE
employees, workers get less pay if they are employees of collective-owned companies
but higher pay if they work for foreign or joint venture companies; employees with
longer job contracts are also paid better. A noticeable difference between linear
regression model and binary logit model is about gender and job training. The
variable of gender becomes significant in the logit model while it is not in the linear
model. The variable of job training becomes insignificant in the logit mode while it
was significant in the linear model. But for most other explanatory variables,
consistent results are obtained.
Table 5: Regression results for binary logit model Independent variables
for over 86% of this group of people is under 20,000 RMB yuan. It is so difficult for
these poor people to have their own houses, especially for the floating population.
Table 9: Housing information
Housing Total Urban Floating
Self-owned 46.07% 49.66% 32.14%
Rent 19.87% 15.56% 36.61%
Welfare 20.41% 22.84% 11.01%
Other 13.47% 11.88% 19.64%%
In the survey, we asked the question: “what is your first choice if the government
can solve the following problems for you?” Table 10 presents the summary. It shows
that most urban poor people want the government to help them in housing and job, the
two basic human rights. For the urban poor with city Hukou, about 38% consider
housing as their first problem that they want the government to help. We collected
some questionnaires in person and went to these poor people’s home; quite a number
of poor people are living a room like a studio about 30 square meters with 3 or 2
family members. About 28% consider children education and 22 % consider job as
their first problem to ask for government help. For the urban poor without city
Hukou, job (35.4%) is the first thing that they want the government to help. Housing
(34.8%) is of equal importance. About one quarter (14.6% plus 11.9%) of rural
migrants want the government to first help their own and children education. It is
interesting to notice than only 3.27% of floating population wants to solve the
problem of Hukou first. We believe it is partly because respondents for this question
can only choose one problem to be solved and partly because job and housing are
always the first two conditions for any rural migrants to stay in city, Hukou is
secondary.
22
Table 10: First problem that the urban poor want the government to help Problems Total Urban Floating
Housing 36.99% 37.55% 34.82%
Children 24.92% 28.28% 11.90%
Education 11.88% 11.19% 14.58%
Job 24.80% 22.07% 35.42%
Hukou 0.91% 0.31% 3.27%
Other 0.24% 0.31% 0%
No responses 0.24% 0.31% 0%
Some of our survey questions are for rural migrants only. For example, we
asked how long they plan to stay in the city and we found that 59.3% want to stay
permanently or as long as possible, 25.6% don’t know their plan, and only 14% plan
to stay in the city temporarily. This finding suggests that most rural migrants want to
live in the city for a long time, even if it is not permanent.
Table 11 shows reasons why farmers migrate into city. In our survey, we asked
participants to check all important reasons that caused them to migrate. Hence, the
sum of all percentages is not 100%. There are 47.7% and 50% of rural Hukou
residents chose higher income and more opportunities in cities as their reasons to
migrate. Higher living quality, children’s education and personal education also count
relative high ratios for 37%, 36% and 23%, respectively. No doubt, it is the cities’
halos that pull rural residents out of their hometowns. From Table 12, we do not find
strong evidence that rural-urban migration is caused by lack of land or too many taxes
and fees.
23
Table 11: Major reason for rural residents to migrate from rural to urban areas
Reasons Percentage
Higher income in cities 47.67%
More opportunities 50%
Higher living quality 37.21%
Following others 11.63%
For children’s education 36.05%
For personal education 23.26%
Lack of land 9.3%
Too many taxes and fees in rural areas 10.47%
Many rural migrants have families or relatives living in their hometowns and
depending on the money they send back home to maintain life. This “double
residence” characteristic of rural Hukou residents makes their poor life even more
complicated. How much money these migrants send back home directly affect the
lives of their relatives and themselves. If they are not doing well in cities and living in
the situation of poverty, this will lead to problems of both urban and rural poverty in
China. According to the data in our survey, the average amount of money these rural
residents sent home every month is about 518 yuan, which is 63.8% of their income.
How can migrant workers send most of their income back to their rural families?
We think it is because many migrant workers are working at construction sites or
restaurants and other companies which provide food and place to live for employees
(according to the data, 40% of people in this group are working at such companies).
These companies provide their migrant workers with shabby shelters (i.e. one 30
square meters shelter for 15 persons to live) or small rooms (i.e. or one 20 square
meters room for 6 persons to live) because they want employees’ working time to be
24
flexible and pay lower wages. Our survey further indicates that male rural workers are
more likely to send money back home than female workers. The amount of money
sent to rural homes is positively correlated to migrant’s annual income, martial status,
whether have children; it is negatively correlated to the time that migrant workers
have lived in cities and or left hometown. Clearly, connection with rural homes is an
important factor for migrant workers to send money back.
4. Conclusions and policy recommendations
This paper has examined the overall picture of the urban poor in China. We
found that the urban poor population has steadily increased since the beginning of this
century, with the number of minimum subsistence recipients rising from 4 million in
2000 to 22.4 million in 2006. The composition of the urban poor has changed from
mainly the elderly, children, and disabled to the laid-offs and new migrated rural
workers. We argued that the increasing urban poor population is largely caused by
the general economic reform which promotes production efficiency and introduces
competition, the structural changes of the economy which leads to frictional
unemployment especially in old industrial bases, a massive rural-urban migration
which bring millions of rural workers into Chinese cities, and the inadequate social
security system which excludes all most all rural migrants. It is inevitable to lay off
redundant workers, experience structural shifts, and have massive rural-urban
migration in the process of economic reform and development. It also will take
China a long time to improve its social security system. Therefore, urban poor is a
persistent problem and deserves more attention.
Based on a recent survey conducted in January 2007, which includes 1305 city
workers and 336 migrant workers, the paper has investigated income determinants
and other aspects of living standard for relatively poor residents in Changsha. Our
empirical results show that annual income is statistically affected by worker’s age,
Hukou status, education, working time duration, job training, enterprise ownerships,
and contract length. Facing unemployment, city workers would live mostly on social
25
security including unemployment insurance (28%), minimum subsistence (15%),
laid-off subsidies (16%), while migrant workers had to rely on private support
including family support (38%) and personal savings (23%). Migrant workers, who
are already making significant lower income and facing more uncertainties, have to
send significant portion of wages back to their rural homes. Our rural worker
sub-sample shows that migrant workers send about 64% of earnings to their rural
homes.
We would suggest the following policy recommendations. The first is to
eliminate the Hukou system. As a long existed administrative instrument, Hukou has
helped China to develop its urban economy, promote exports, and build public
infrastructure. However, it becomes a fatal distress for floating population when
they are looking for jobs in cities. Our survey shows that finding jobs is the first thing
that rural migrants want the government to help them. Removing the Hukou system
may make the competition between urban and rural workers more fierce in the short
run. It also could improve the efficiency and fairness of the labor market.
Second, education and job-training help the urban poor. Our survey show that
39% of city workers and 26% of migrant workers consider education is the first thing
they want the government to help them. Our regression analysis proves that
job-training significantly improve worker’s income. Facing a large number of
laid-off workers and massive rural-urban migration, we would suggest that the
Chinese government make great efforts to re-train laid-off workers and give equal
education opportunities to children of migrant families.
The third is to improve social insurance for poor people, including health
insurance, old-age insurance, and unemployment insurance. Our sample data indicate
that many workers do not have social security, especially migrant workers. In our
sample, 27%, 32% and 42% of urban workers do not have health insurance,
retirement pension and unemployment insurance, respectively. For floating
population, these numbers increase to 69%, 74% and 74%, respectively. More than
two-thirds of all migrant workers don’t have any social protection. Thus, it is
important for China to expand its social security coverage.
26
The fourth is to improve housing condition for the urban poor. In our sample,
less than half of urban workers and less than one-third of migrant workers own homes.
For urban workers, housing is the first thing that they need government help. For
migrant workers, housing is the second most important thing, right after jobs, that
they need government help. No question, improving housing condition will help to
mitigate the urban poor problem. Currently, China has various policies to help
lower-income families to buy homes, such as the “comfort housing” and “economy
housing” projects. However, China faces many challenges to implement its policies.
Still, the urban poor would not be able to purchase homes from “comfort housing”
and “economy housing” projects. To help the urban poor, public housing or housing
allowances may become necessary.
The urban poor problem, like many other urban problems such as transportation,
needs efforts from both the government and the general public. No one policy could
fully remedy the urban poor problem. Indeed, most individual policies cannot even
make a dent in such problem. That means various remedies must be combined to
effect a cure. Those who are striving to do so are like the woodsman who must cut
down a huge tree with only one small axe. He cannot fell the tree or even make
much of a cut in it with one swing of the axe. But he can eventually cut it down,
with one hundred or more small cuts. A multifaceted approach offers the only hope
of reducing urban poor significantly.
27
References CAI Fang, 2006. The Causes and Strategies of Chinese Urban Poverty http://economy.guoxue.com/article.php/8411, Accessed on July 28, 2006 Chen, Zhihong, 2006. “Measuring the Poverty Lines for Urban Households in China – An Equivalence Scale Method.” China Economic Review, 17(3), pp. 239-252. Ding, Sibao, 2006. “On China’s Urban Poverty and Suggested Measures”. China Opening Herald, No.2, pp 58-61 Hua, Yingfang, 2004. “Employment Safeguard for Urban Poor Population”. Review of Economic Research, No. 11, pp4-20 Hussain,A., 2003. “Urban Poverty in China: Measurement, Patterns and Policies”. International Labor Office, Geneva, January, International Labor organization, http://www.ilo.org/public/english/protection/ses/info/publ/china.htm Li, Siming, 1997. “Population Migration, Regional Economic Growth and Income Determination: A Comparative Study of Doungguan and Meizhou, China”. Urban Studies, Vol 34, No. 7, pp 999-1026 Li Qiang, 2005. “Urban Poverty in China”. Journal of Fuzhou University (Philosophy and Social Since), No.1, pp 22-29 Li, Ruilin and Li Zhengsheng, 2006. “A Research on the Problem of Urban Poverty in China’s Transition Course”. Economic Survey, No. 1, pp 114-117 Li Ruilin, 2005. “A Summarize on Urban Poor in China”. Academic Exploration, No.6, pp 49-55 Liu, S., Li, X., and Zhang, M. 2003. Scenario Analysis on Urbanization and Rural-Urban Migration in China. Interim Report IR-03-036, International Institute for Applied System Analysis and Institute of Geographic Sciences and Natural Resources Research, Chinese Academy of Sciences. Beijing, China. Liu, Yanhong, 2004. “Analysis on Poverty in China”. Fuzhou University Graduate Students, No.3, http://www.fzu.edu.cn/pgu/qikan/5/19.html Lu, Zhigang and Song, Shunfeng, 2006. “The Statistical Analysis On The Micro-Determinants That Affect Wages of Rural-Urban Migrants”. Modern Finance& Economics, No.10, Vol0.26, pp 77-81 Mei, Jianming and Qin, Ying, 2005. “A review on Urban Poverty and Anti-Poverty
Strategy in China”. Population Science of China, No.1, pp 90-96 Ministry of Civil Affairs of China, 2006, 2007. www.mca.gov.cn Mo, Rong, 2003. “The Complicated Causes of Urban Poor in China”, Xinhua News Agency, February 5 Research group of National Bureau of Statistics of China, 1991. “A Research on Urban Poor in China”. Statistical Research, No.6, pp 14-20 National Bureau of Statistics of China, 2007. www.stat.gov.cn National Bureau of Statistics of China, China Statistical Yearbook, 1991, 1997, 1999, 2001, 2005, 2006 National Bureau of Statistics of China, Changsha Statistical Yearbook, 2006 National Bureau of Statistics of China, Hunan Branch, 2007. www.hntj.gov.cn National Bureau of Statistics of China, Hunan Statistical Yearbook, 2006 National Bureau of Statistics and Ministry of Labor and Social Security, China Labor Statistical Yearbook, 2005 Song, Shunfeng, 2001. “City Size and Urban Unemployment: Evidence from China”. World Economy & China, No.1, pp 46-53 Song, Shunfeng, 2003. “Policy Issues of China’s Urban Unemployment.” Contemporary Economic Policy 21(2): 258-269. Sun, Jingshu and Qi, Yixuan, 2005. “The Current Problem of Poverty in the Urban Areas of China”. Nankai Economic Studies, No.2, pp22-25 Tang, Jun, 1997. “China’s Urban Poverty Lines Approach”. Sociological Research, No.2, pp 62-73 Tang, Jun, 2002. “Urban Poor in China: the Causes and Current situation”. Chinese Cadres Tribune, No.3, pp 21-24 Wei, Jinsheng, 2004. “A Research on Urban Poor Population in Big Cities of China”. www.chinapop.gov.cn, March 26 World Bank, 2006. China: Building Institutions for Sustainable Urban Transport. EASTR Working Paper NO.4. The World Bank, Washington D.C.
Xue, J. and Wei, Z. 2003. “Unemployment, Poverty and Income Disparity in Urban China.” Asian Economic Journal 17(4): 383-405. Yang, Yiyong, 2002. “Urban Poverty Can Not Be Underestimated”. Digest of Management Science, No.2, pp42-43 Zhang, Kevin Hoinglin and Song, Shunfeng, 2004. “Migration and Urbanization”. Urbanization and Social Welfare in China, edited by Aimin Chen etc, Ashgate Publishing Co., UK, pp 180-198 Zhu, Qingfang, 1998. “Characteristics and Causes of Urban Poor Population and Solutions”. Social Science Research, No. 1, pp 62-66


![STFTTfT ^ 05/2017/f^^ 12.12.2017 WT-WT ^ ^ ^x]^|^'...2 102718 rachna sharma f unrf unr 3 104316 rajnandini sharma f unrf unr 4 100278 ravindra parmar m unr obc 5 102066 kiran singh](https://static.documents.pub/doc/80x56/5ed1ca87451b173a8139019a/stfttft-052017f-12122017-wt-wt-x-2-102718-rachna-sharma-f.jpg)


