44
[email protected] 4. Residual state • S r < 0.1 • Liquid phase is discontinuous, air phase is continuous Unsaturated soils: definitions and notations Saturation states
1. Saturated state
• Sr = Vw / V = 1• Liquid phase is
continuous• Possibility of negative
pore water pressure uw<0
2. Quasi-saturated state
• 0.85 < Sr < 1• Liquid phase is
continuous, air phase is discontinuous
• The fluid phase (gaz + liquid) becomes compressible
3. Partially saturated state
• 0.1 < Sr < 0.85• Liquid and air phases are
both continuous
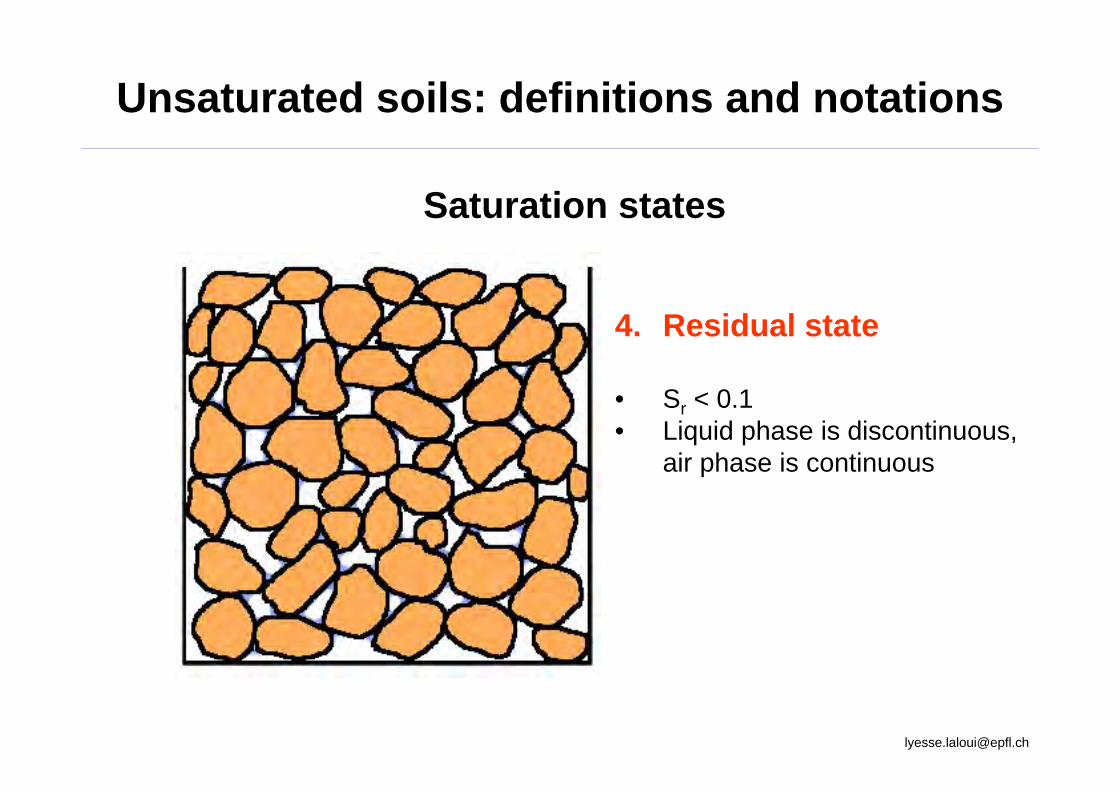
4. Residual state
• Sr < 0.1• Liquid phase is discontinuous,
air phase is continuous
Unsaturated soils: definitions and notations
Saturation states
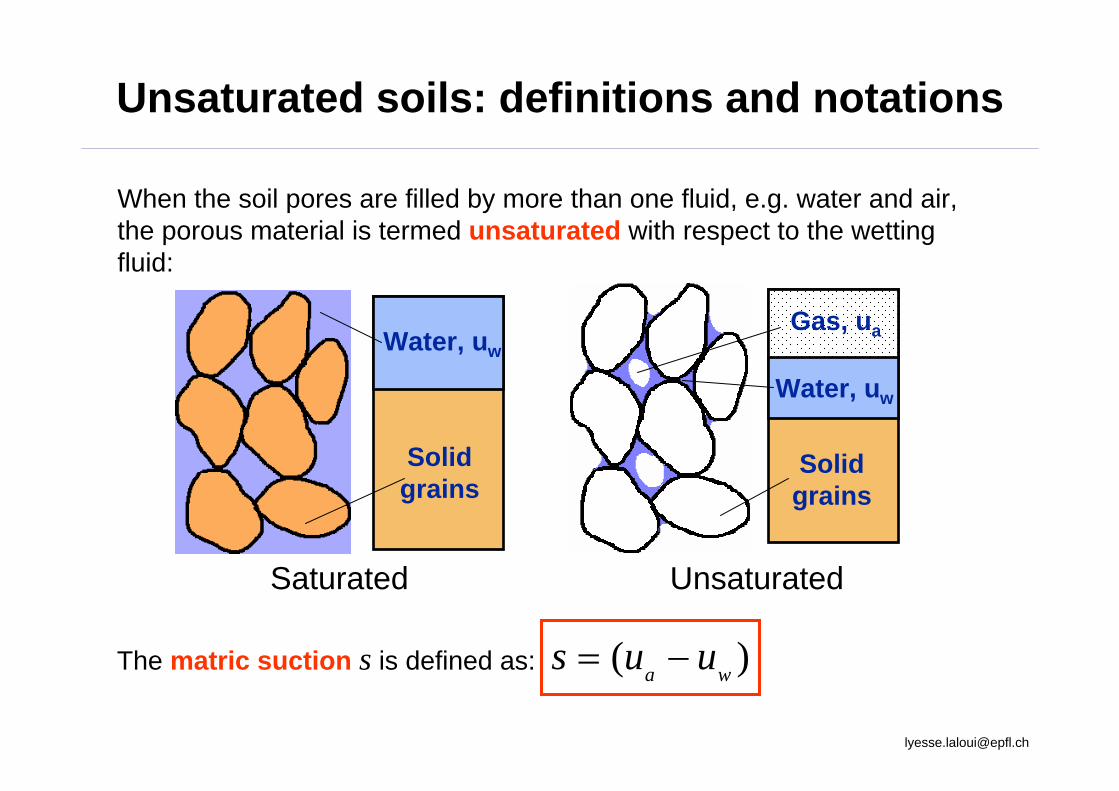
When the soil pores are filled by more than one fluid, e.g. water and air, the porous material is termed unsaturated with respect to the wetting fluid:
Solidgrains
Gas, ua
Water, uw
Solidgrains
Saturated Unsaturated
Water, uw
The matric suction s is defined as: ( )a ws u u= −
Unsaturated soils: definitions and notations

Ln s
Sr
se
Sr(res)
1
Water retention curve
Funicular Pendular
Hydrichysteresis
• Sr(res) :Residual degree of saturation
• se : Air entry suction, below which Sr =1
1 2 3 4 1 2
3 4
The water retention curve plots the evolution of the degree of saturation, Sr, as a function of the matric suction.

Ln s
εvhSr
se
sB
1 0
Idealized shape of the volumetric response(s):
Unsaturatedzone
Saturatedzone
dryi
ng
wet
ting
1 2
AA
BB
CC
DD
C’C’
EE OCNC
1. Hydric loading path
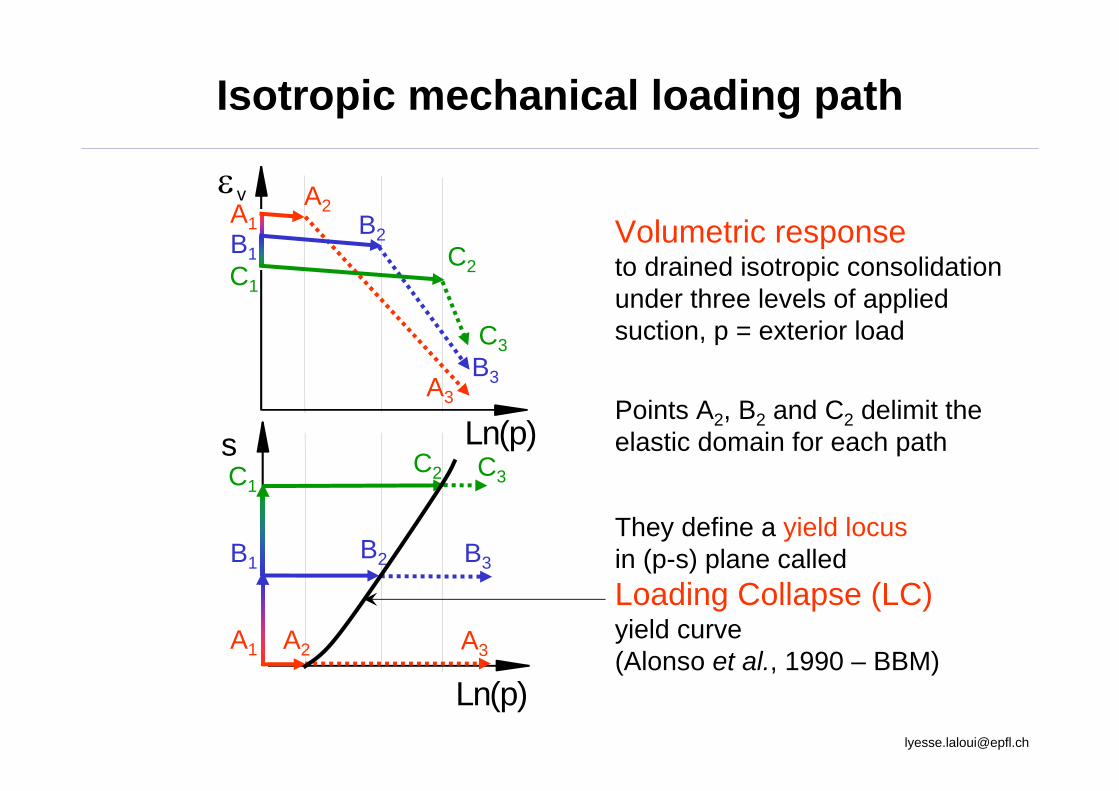
Volumetric responseto drained isotropic consolidation under three levels of appliedsuction, p = exterior load
Ln(p)
εv
Ln(p)
s
A1
A1
A2
A2
A3
A3
B1
B1B2
B2 B3
B3
C1
C1
C2
C2
C3
C3
Points A2, B2 and C2 delimit the elastic domain for each path
They define a yield locusin (p-s) plane calledLoading Collapse (LC)yield curve(Alonso et al., 1990 – BBM)
Isotropic mechanical loading path
s
p
εv
s
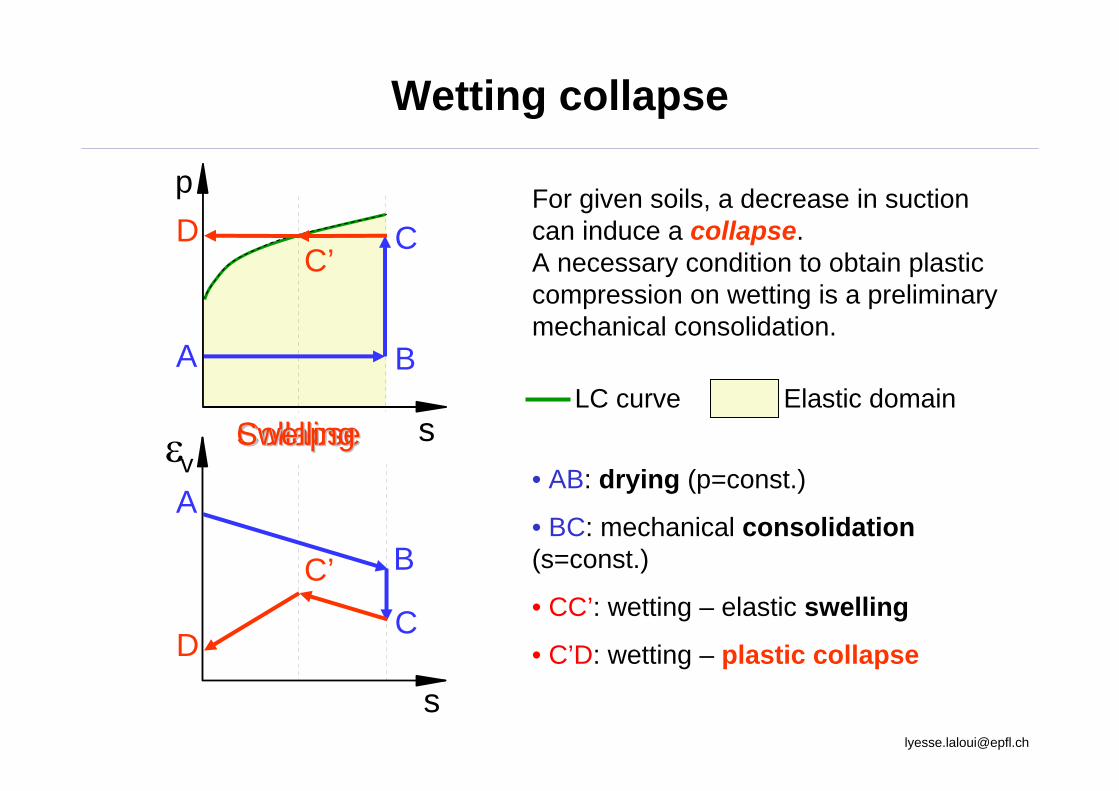
Wetting collapse
For given soils, a decrease in suction can induce a collapse. A necessary condition to obtain plastic compression on wetting is a preliminary mechanical consolidation.
• AB: drying (p=const.)
• BC: mechanical consolidation(s=const.)
• CC’: wetting – elastic swelling
• C’D: wetting – plastic collapse
A
A
B
B
C
C
C’
C’
D
D
CollapseCollapseLC curve Elastic domain
SwellingSwelling
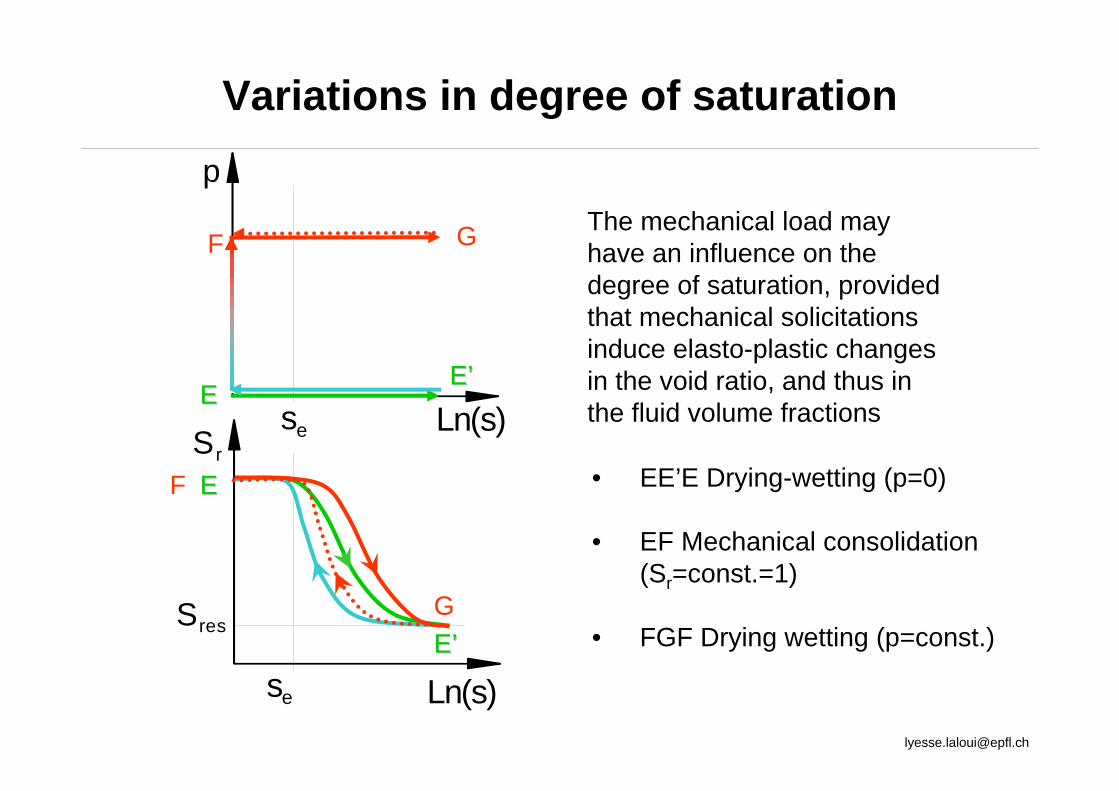
Variations in degree of saturation
The mechanical load may have an influence on the degree of saturation, provided that mechanical solicitations induce elasto-plastic changes in the void ratio, and thus in the fluid volume fractions
• EE’E Drying-wetting (p=0)
• EF Mechanical consolidation (Sr=const.=1)
• FGF Drying wetting (p=const.)
Ln(s)
p
Ln(s)
se
se
Sr
Sres
EE
EE
E’E’
E’E’
F
F
G
G

Effective stress for a multiphase material
Extending Terzaghi’s proposal to unsaturated soils:
Gas, ua
Water, uw
Solid
Continuum solid
Multi-phase descriptionSingle-phase description
Effective stress
2
1
'ij ij ijd d uβ ββ
σ σ α δ=
= −∑
Bishop (1959) thus proposed writing the effective stress as:
( ) ( )ij ij a ij a w iju u uσ σ δ χ δ′ = − + −
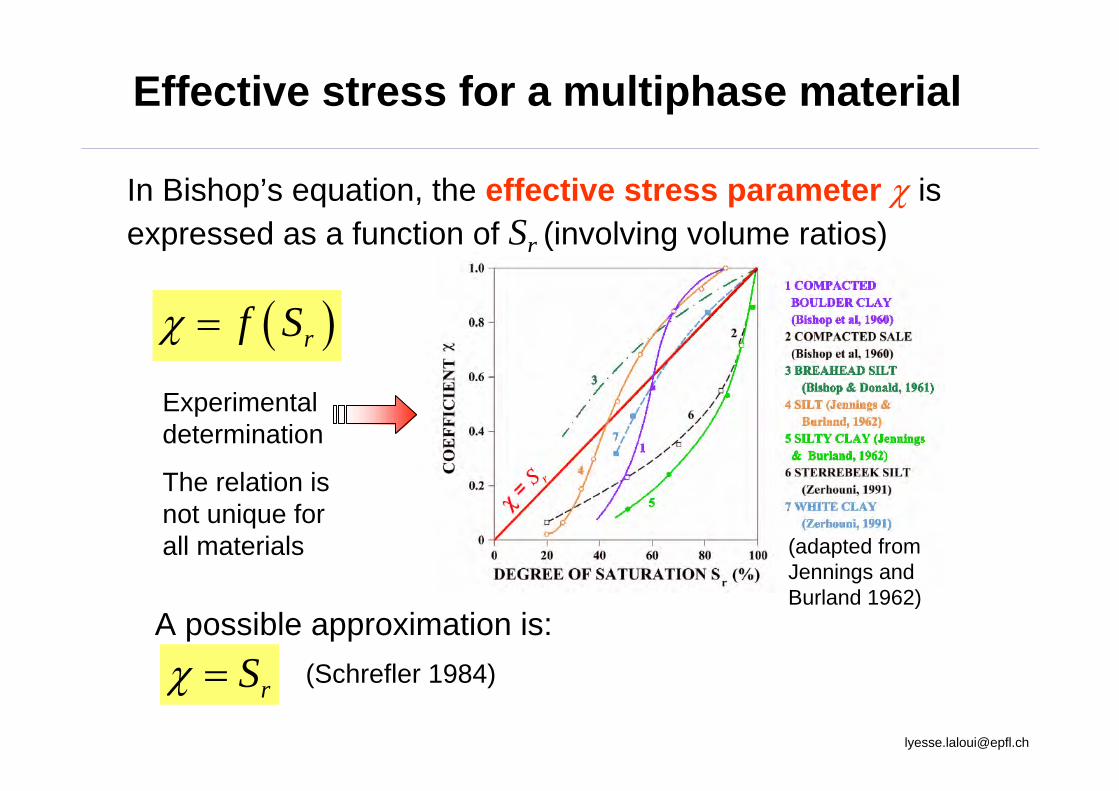
In Bishop’s equation, the effective stress parameter χ is expressed as a function of Sr (involving volume ratios)
rSχ =
Effective stress for a multiphase material
A possible approximation is:
( )rf Sχ =
Experimentaldetermination
The relation isnot unique for all materials
(Schrefler 1984)
(adapted fromJennings andBurland 1962)
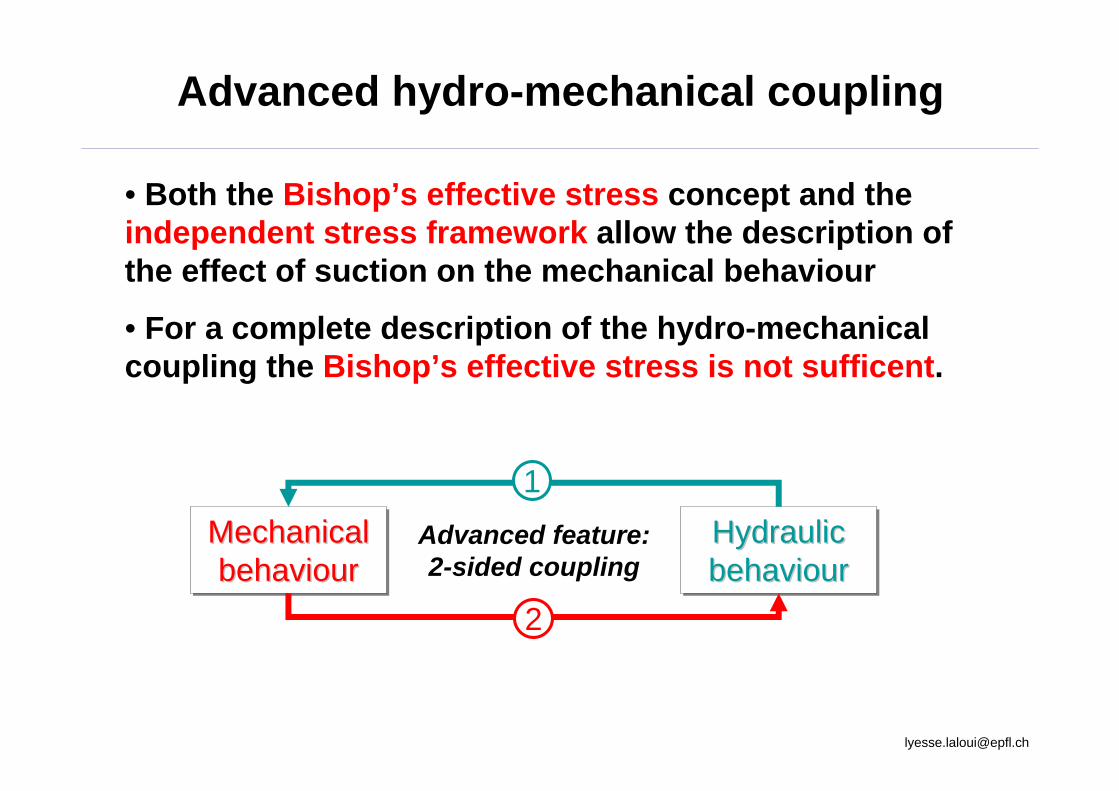
Advanced hydro-mechanical coupling
• Both the Bishop’s effective stress concept and the independent stress framework allow the description of the effect of suction on the mechanical behaviour
• For a complete description of the hydro-mechanicalcoupling the Bishop’s effective stress is not sufficent.
Mechanicalbehaviour
MechanicalMechanicalbehaviourbehaviour
HydraulicbehaviourHydraulicHydraulicbehaviourbehaviour
Advanced feature: 2-sided coupling
1
2
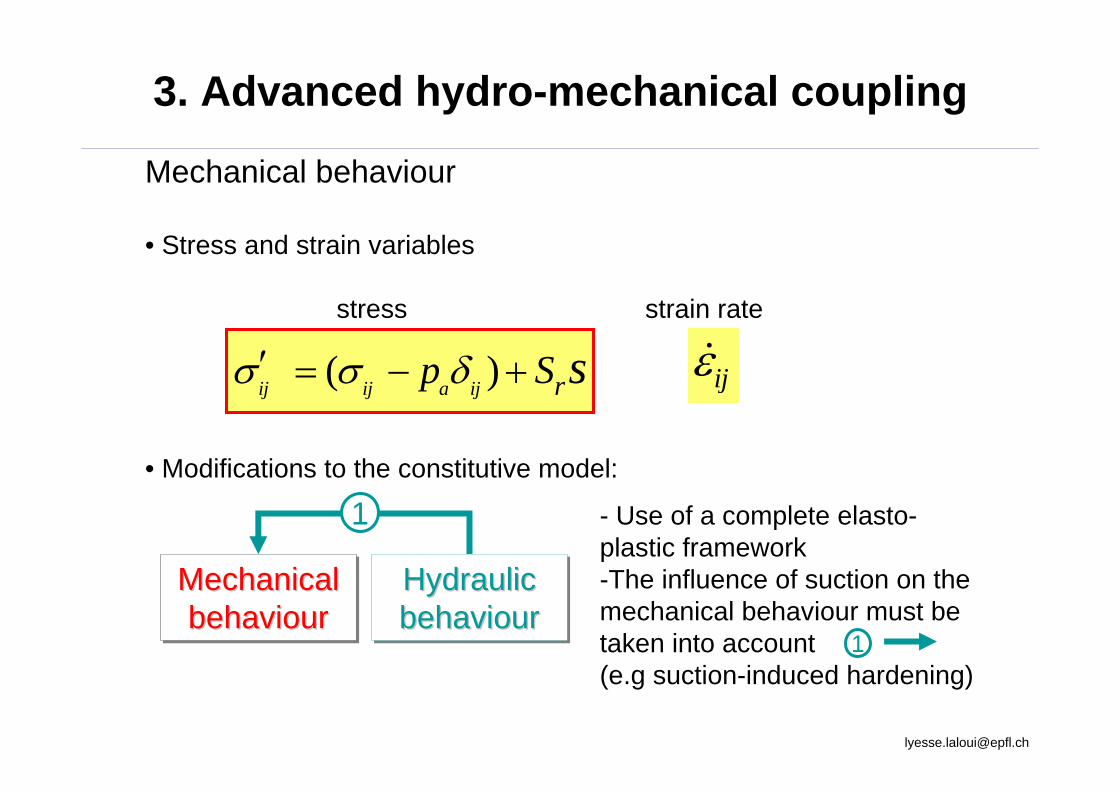
Mechanical behaviour
• Stress and strain variables
stress strain rate
• Modifications to the constitutive model:
( )ij ij a ij rp S sσ σ δ′ = − + ijε&
Mechanicalbehaviour
MechanicalMechanicalbehaviourbehaviour
HydraulicbehaviourHydraulicHydraulicbehaviourbehaviour
- Use of a complete elasto-plastic framework-The influence of suction on the mechanical behaviour must betaken into account(e.g suction-induced hardening)
1
1
3. Advanced hydro-mechanical coupling

Hydraulic behaviour
The “mechanical model” needs to be completed:
• Evolution of Sr and s need to be known to obtain the effective stress
• A full description of the state of the material must include the hydricbehaviour :
( )ij ij a ij ru S sσ σ δ′ = − +
Mechanicalbehaviour
MechanicalMechanicalbehaviourbehaviour
HydraulicbehaviourHydraulicHydraulicbehaviourbehaviour
The hydraulic part undergoesthe influence of the mechanicalstate (coupling )
2
2
3. Advanced hydro-mechanical coupling
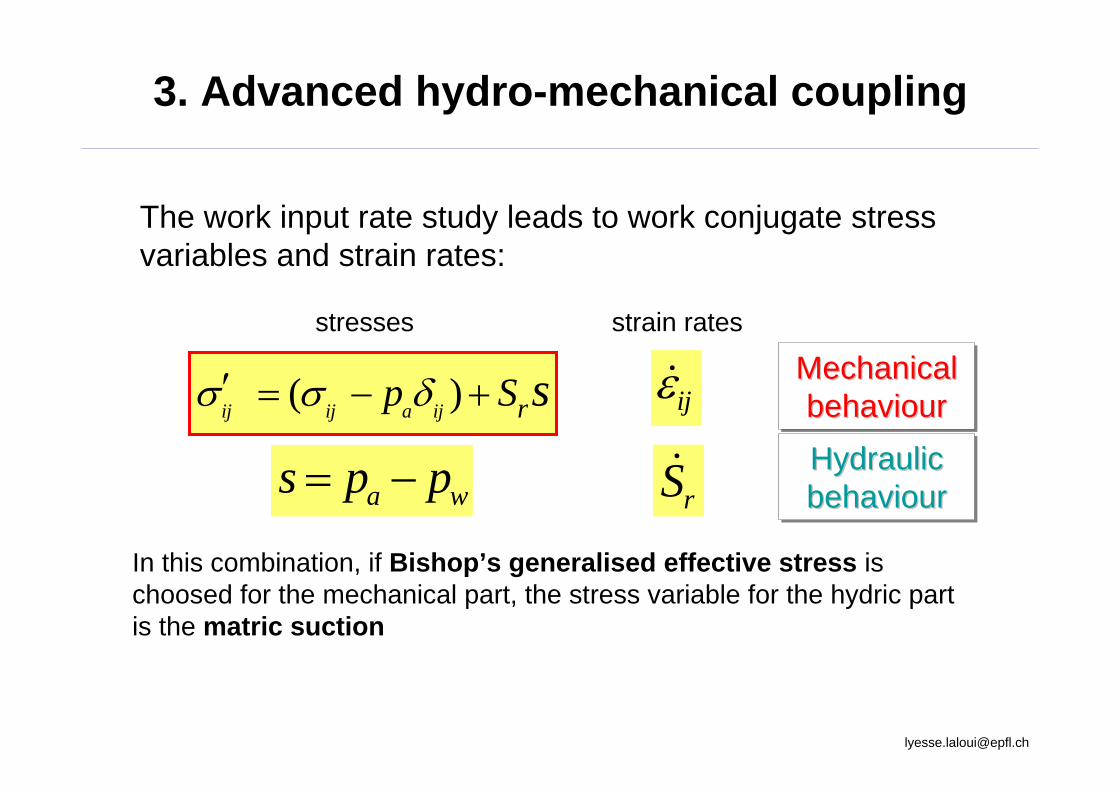
The work input rate study leads to work conjugate stress variables and strain rates:
stresses strain rates
( )ij ij a ij rp S sσ σ δ′ = − + ijε&
a ws p p= − rS&
In this combination, if Bishop’s generalised effective stress ischoosed for the mechanical part, the stress variable for the hydric part is the matric suction
Mechanicalbehaviour
MechanicalMechanicalbehaviourbehaviour
HydraulicbehaviourHydraulicHydraulicbehaviourbehaviour
3. Advanced hydro-mechanical coupling
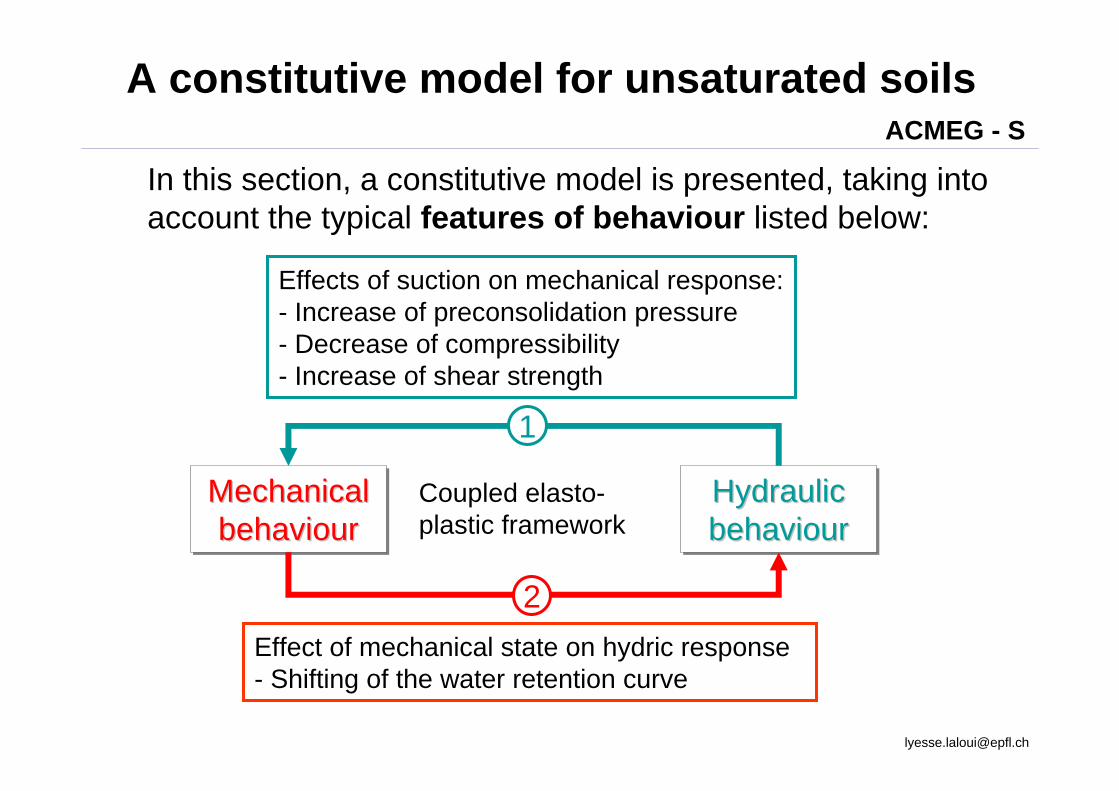
In this section, a constitutive model is presented, taking into account the typical features of behaviour listed below:
A constitutive model for unsaturated soils
Mechanicalbehaviour
MechanicalMechanicalbehaviourbehaviour
HydraulicbehaviourHydraulicHydraulicbehaviourbehaviour
1
2
Effects of suction on mechanical response:- Increase of preconsolidation pressure- Decrease of compressibility- Increase of shear strength
Effect of mechanical state on hydric response- Shifting of the water retention curve
Coupled elasto-plastic framework
ACMEG - S

A constitutive model for unsaturated soils
Referring to previous discussion, the following stress framework is adopted:
Stresses work conjugate strain rates
(Bishop’s generalised effective stress) (soil skeleton strain)
(matric suction) (degree of saturation)
The model is formulated within the framework of hardening plasticityThe strain rate is decomposed into an elastic and a plastic part:
( )ij ij a ij ru S sσ σ δ′ = − + ijε&
s rS&
e p
ij ij ijε ε ε= +& & &
ACMEG - S
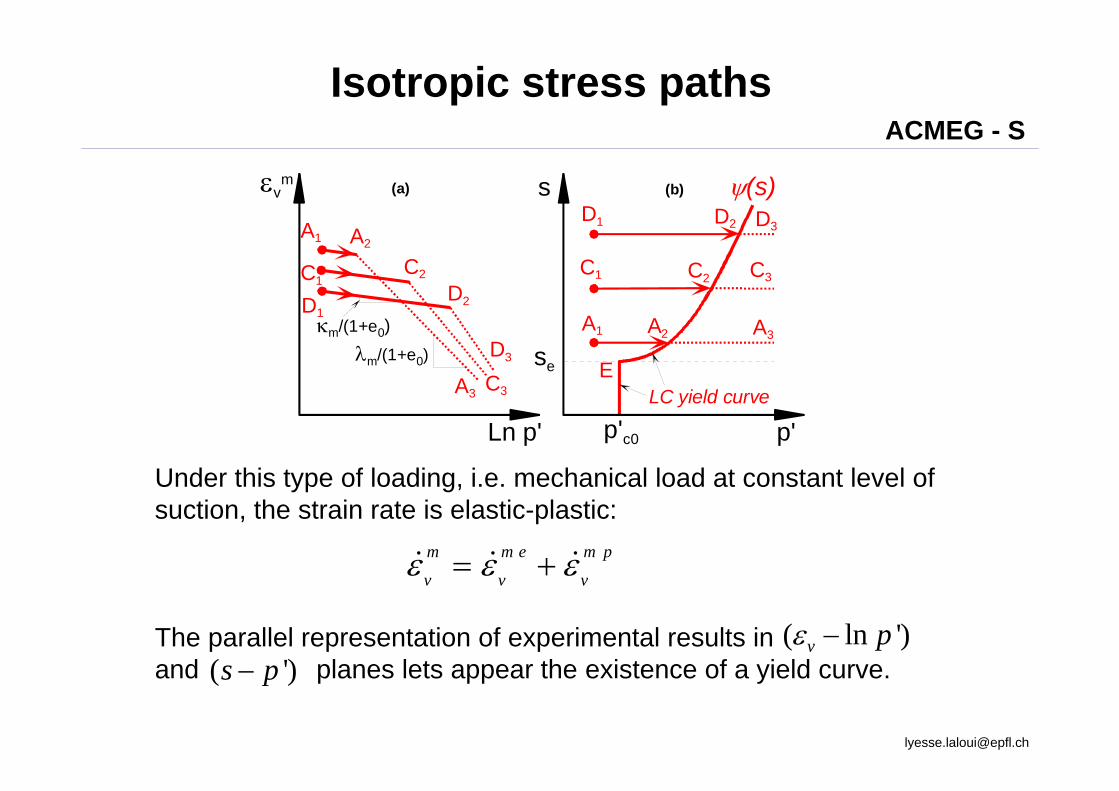
Isotropic stress paths
Under this type of loading, i.e. mechanical load at constant level of suction, the strain rate is elastic-plastic:
The parallel representation of experimental results inand planes lets appear the existence of a yield curve.
p'
A1
εvm
se
Ln p'
s
A2 A3
C1 C2 C3
D3D1 D2
E
p'c0
ψ(s)
LC yield curve
A1 A2
A3 C3
D1D2
D3
C1C2
(a) (b)
κm/(1+e0)λm/(1+e0)
( ln ')v pε −( ')s p−
m m e m p
v v vε ε ε= +& & &
ACMEG - S

Isotropic stress paths : LC yield curve
Comparison between numerical and experimental results0
0
( ) 0
( ) 1 log
c c e
c c s ee
p s p s s
sp s p s ss
γ
′ ′= < <
⎡ ⎤⎛ ⎞′ ′= + >⎢ ⎥⎜ ⎟
⎝ ⎠⎣ ⎦
for
for
(Sharma 1998) Bentonite/kaolin mix
0
50
100
150
200
250
300
350
400
0 100 200 300 400P' (kPa)
s (k
Pa)
EXP
model
(Kane 1973)loess
0
1020
30
4050
60
70
8090
100
0 50 100 150P' (kPa)
s (k
Pa)
EXP
model
ACMEG - S
p' εvh
Ln s
p'c0
sese
Ln s
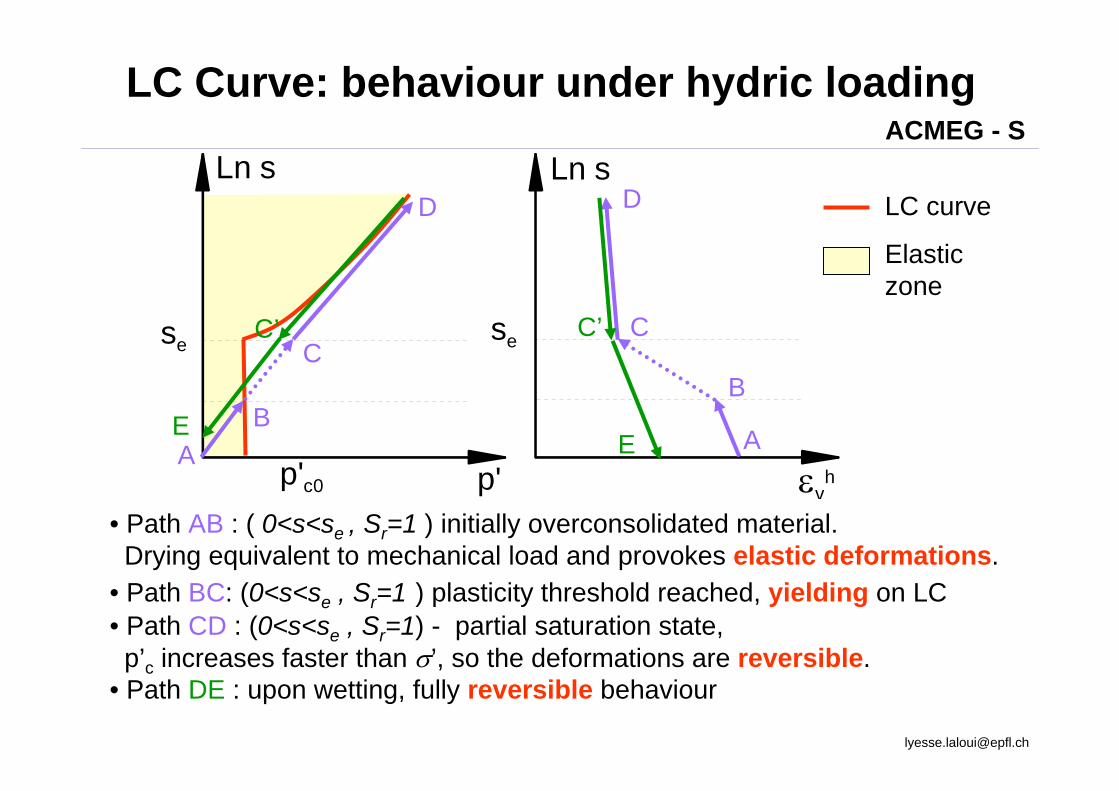
• Path AB : ( 0<s<se , Sr=1 ) initially overconsolidated material. Drying equivalent to mechanical load and provokes elastic deformations.
• Path BC: (0<s<se , Sr=1 ) plasticity threshold reached, yielding on LC• Path CD : (0<s<se , Sr=1) - partial saturation state, p’c increases faster than σ’, so the deformations are reversible.
• Path DE : upon wetting, fully reversible behaviour
LC Curve: behaviour under hydric loading
A A
BB
CC
DD
C’C’
EE
LC curve
Elasticzone
ACMEG - S
Ln(p')
s
se
εv
Ln(p')
sA
sBsC
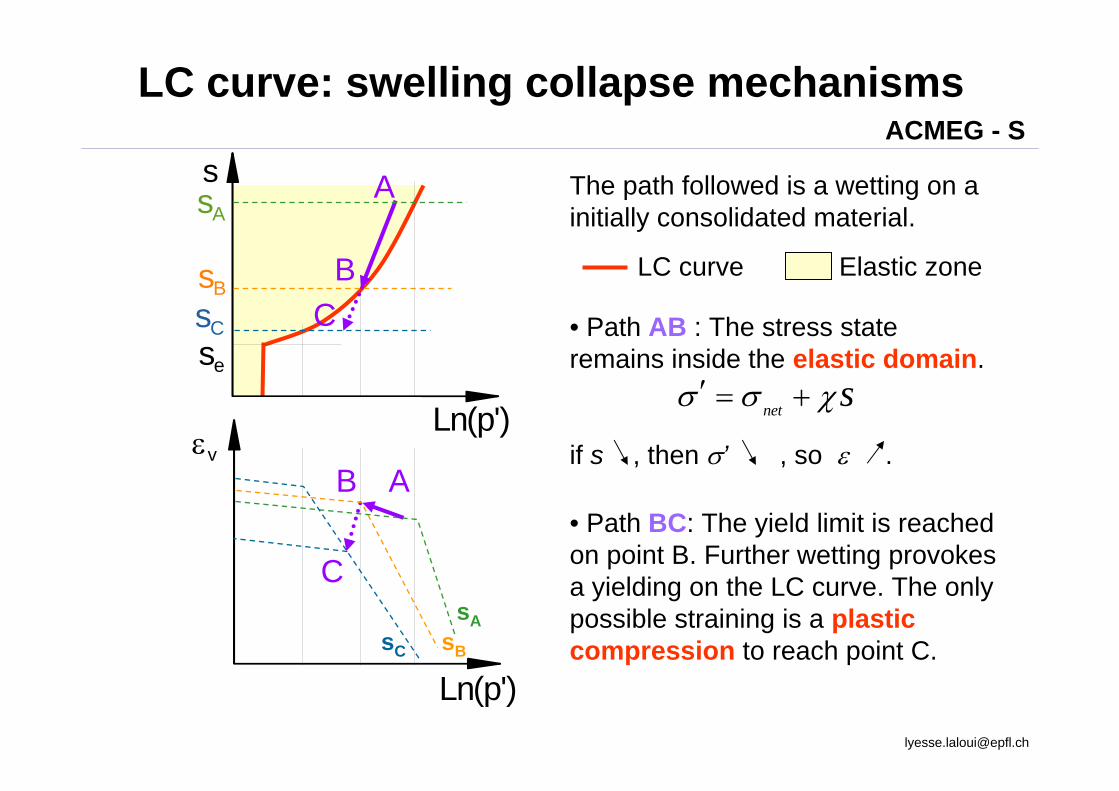
LC curve: swelling collapse mechanisms
• Path AB : The stress state remains inside the elastic domain.
.if s , then σ’ , so ε .
net sσ σ χ′ = +
A
A
B
B
C
C• Path BC: The yield limit is reached on point B. Further wetting provokes a yielding on the LC curve. The only possible straining is a plastic compression to reach point C.
The path followed is a wetting on a initially consolidated material.
LC curve Elastic zone
sAsBsC
ACMEG - S

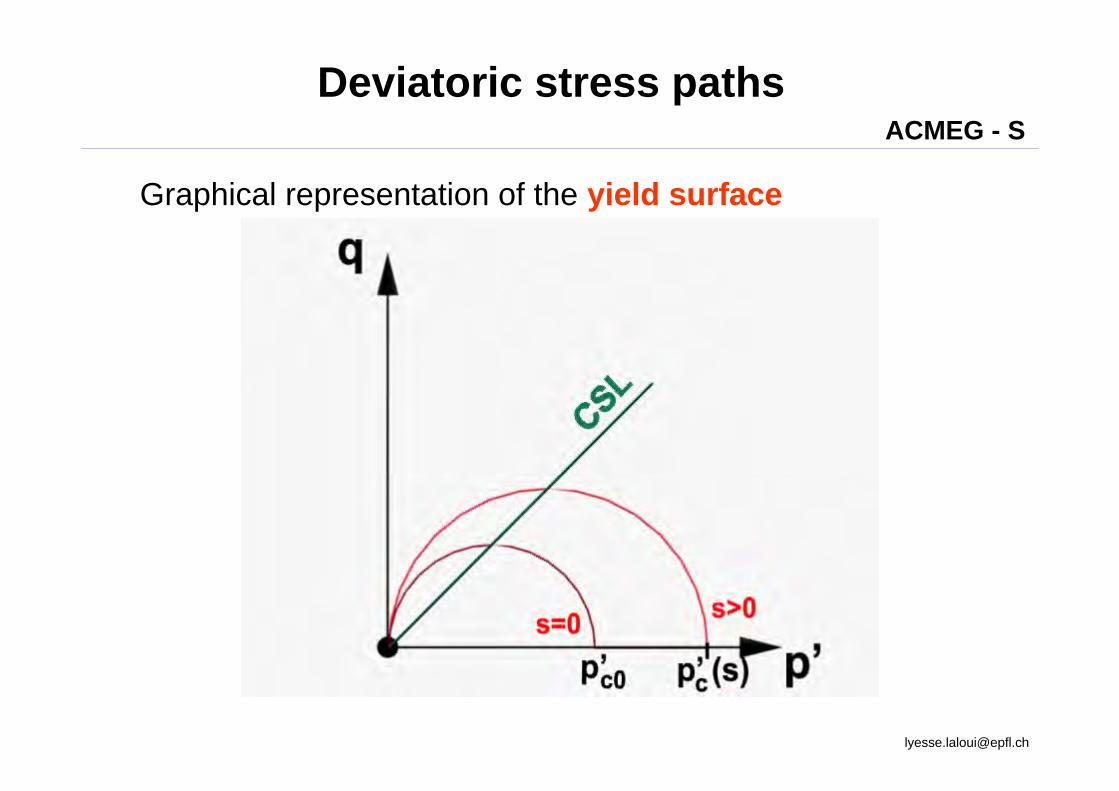
Deviatoric stress pathsThe modified Cam-clay model (Schofield and Wroth, 1968; Roscoe and Burland, 1968) is extended to unsaturated states by substituting Terzaghi’s effective stress by Bishop’s generalised effective stress.
• The deviatoric yield surface is simply expressed as follows:
which includes the effects of suction such as the increase p’c with s
• The critical state line is assumed unique in (p’-q) plane and obeys the relation:
• The elastic part of the deviatoric strain increment is simply written:
with G being the elastic shear coefficient (assumed independent on suction)
2 2 ( ( ) ) 0cf q M p p s p′ ′ ′= − − =
q Mp′=
3e
d
q
Gε =
&&
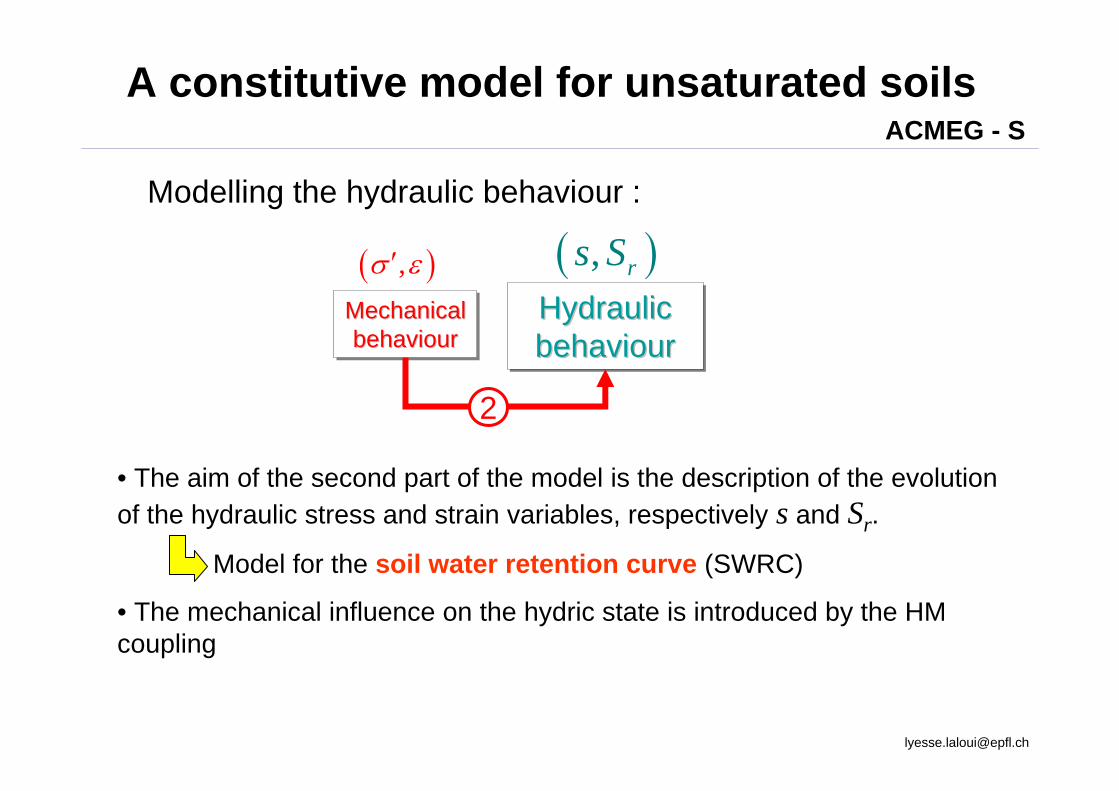
Modelling the hydraulic behaviour :
A constitutive model for unsaturated soils
Mechanicalbehaviour
MechanicalMechanicalbehaviourbehaviour
HydraulicbehaviourHydraulicHydraulicbehaviourbehaviour
2
• The aim of the second part of the model is the description of the evolutionof the hydraulic stress and strain variables, respectively s and Sr.
Model for the soil water retention curve (SWRC)
• The mechanical influence on the hydric state is introduced by the HM coupling
( ),σ ε′ ( ), rs S
ACMEG - S
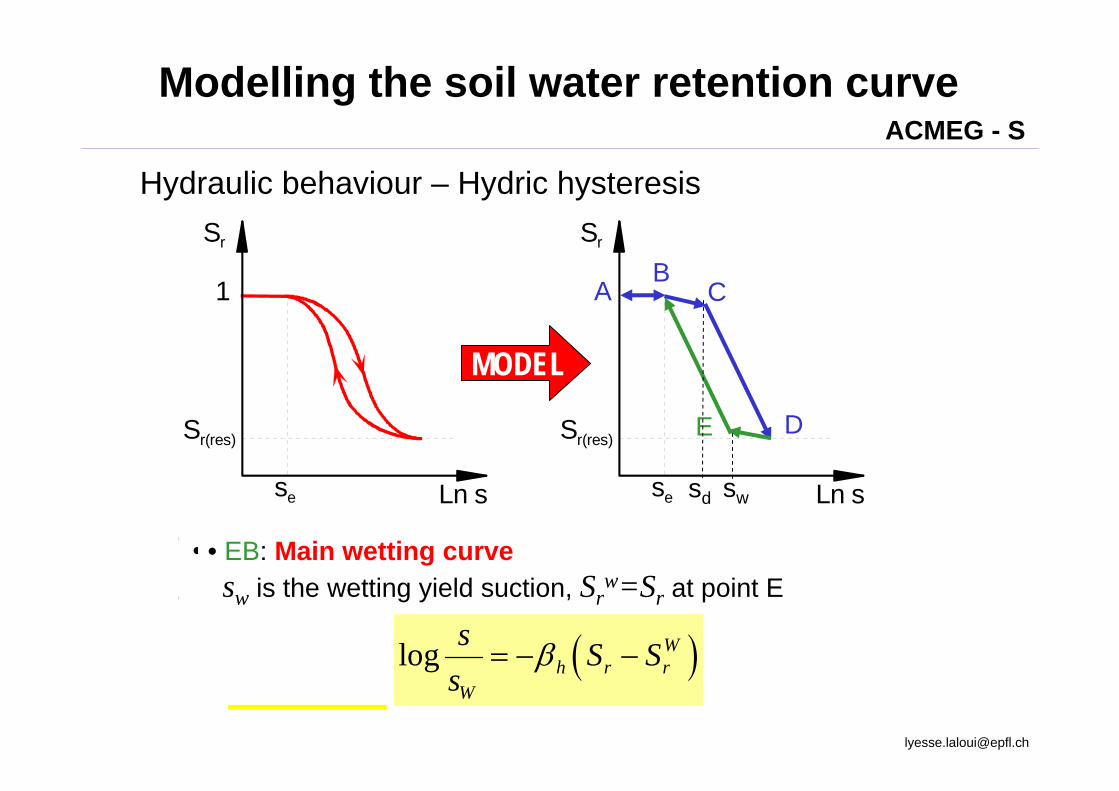
Modelling the soil water retention curve
Ln s
Sr
se
Sr(res)
1
Hydraulic behaviour – Hydric hysteresis
Ln s
Sr
se
Sr(res)
MODEL
AB
C
DE
• AB: Saturated part, 0<s<se, Sr = constant = 1.
• BC: (unsaturated state) Reversible slope
with the elastic modulus( )r
h
sSK s
=&& 0( )h h
ref
sK s Ks
⎛ ⎞= ⎜ ⎟⎜ ⎟
⎝ ⎠
• CD: Main drying curvesd is called the drying yield suction, Sr
d = Sr at point C
( )log dh r r
d
s S Ss
β= −
sd
• DE: Reversible slope, Kh
( )log dh r r
d
s S Ss
β= −
sw
• EB: Main wetting curvesw is the wetting yield suction, Sr
w=Sr at point E
( )log Wh r r
W
s S Ss
β= − −
ACMEG - S

BC
DE
Coupling with mechanical part
Ln s
Sr
se
Sr(res)
e0
e1<e0
The mechanical straining of the material may cause the water retention curve to be shifted right.
Shifting of water retention curve piloted by the air entry value se, which is dependent on the volumetric strain:
Mechanical state εv se(εvp) (Sr-s) relation
A
Ln s
Sr
Sr(res)
se1 se2
ACMEG - S

Mass and momentum balances
( ) 0pKkv
tp
sS
Sn
tp
pn
sS
Sn
www
rws
w
w
w
w
w
w
w
w
=⎟⎟⎠
⎞⎜⎜⎝
⎛ρ−∇
µ•∇+•∇
+∂∂
∂∂
−∂∂
⎟⎟⎠
⎞⎜⎜⎝
⎛∂∂ρ
ρ+
∂∂
g
g
( ) 0pKkv
tp
sS
S1n
tp
pn
sS
S1n
ras
ww
w
w
w
=⎟⎟⎠
⎞⎜⎜⎝
⎛ρ−∇
µ•∇+•∇
+∂∂
∂∂
−−
∂∂⎟⎟⎠
⎞⎜⎜⎝
⎛∂∂ρ
ρ+
∂∂
−
gggg
g
g
g
g
Water/solid mass balance
Air/solid mass balance
∇•[σ' - Sw pwI - (1- Sw) pg I] + ρg = 0 Momentum balance
of the three-phase mixture
neglected for two-phase modeling

Content
Introduction to Geomechanics• Introduction – standard approach• Effective stress concept• Soil constitutive behaviour• Seepage
Advanced Geomechanics for Landslides• Hydro-Mechanical coupling• Unsaturated soils• Finite elements simulations
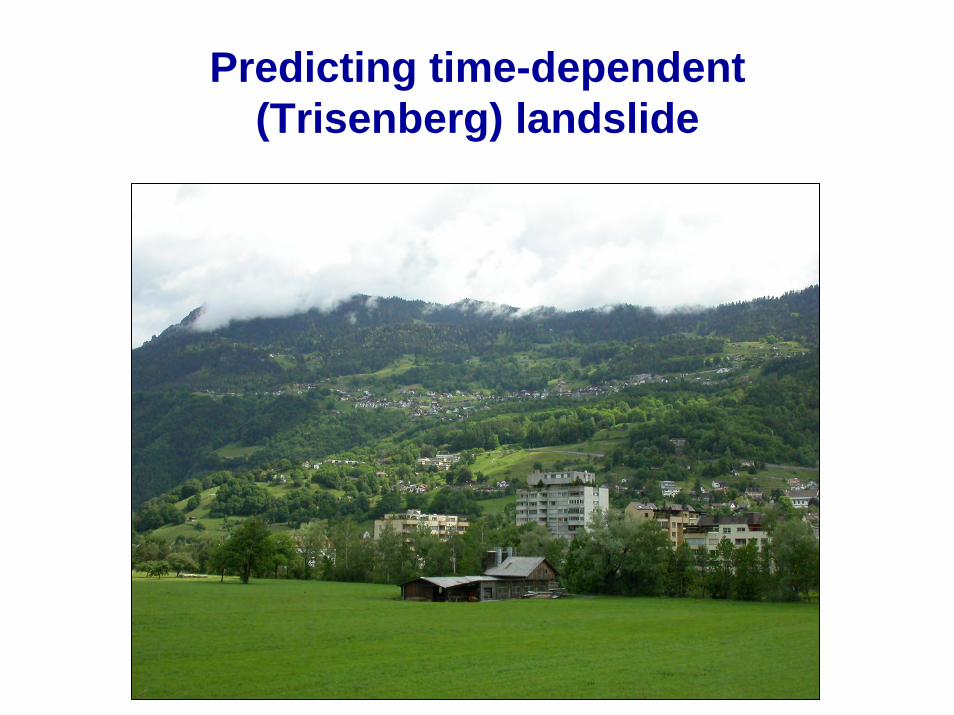
Predicting time-dependent(Trisenberg) landslide
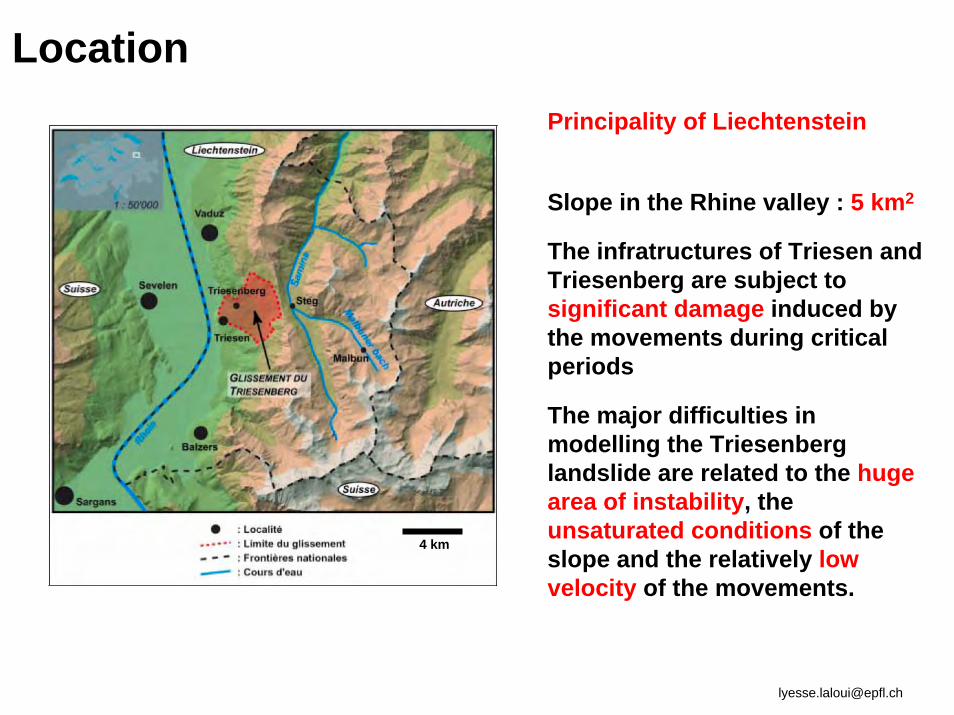
Location
4 km
Principality of Liechtenstein
Slope in the Rhine valley : 5 km2
The infratructures of Triesen and Triesenberg are subject to significant damage induced by the movements during critical periods
The major difficulties in modelling the Triesenberglandslide are related to the huge area of instability, the unsaturated conditions of the slope and the relatively low velocity of the movements.

24°
3 km
1.5 km
Location
Deeper-seated slope movement : 1.7 km2 - 74 Mio m3
Active slide : 3.1 km2 – 37 Mio m3
Mean inclination : 24°
Mean depth : 10 to 20 m
Two main parts :
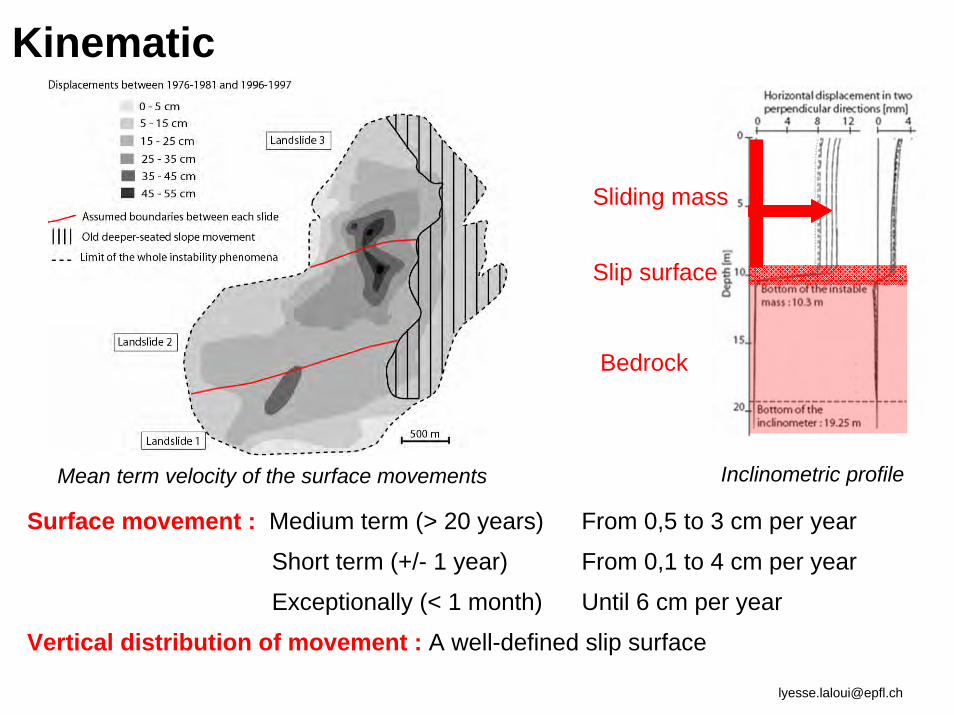
Inclinometric profileMean term velocity of the surface movements
Surface movement : Medium term (> 20 years) From 0,5 to 3 cm per year
Short term (+/- 1 year) From 0,1 to 4 cm per year
Exceptionally (< 1 month) Until 6 cm per year
Vertical distribution of movement : A well-defined slip surface
Sliding mass
Slip surface
Bedrock
Kinematic
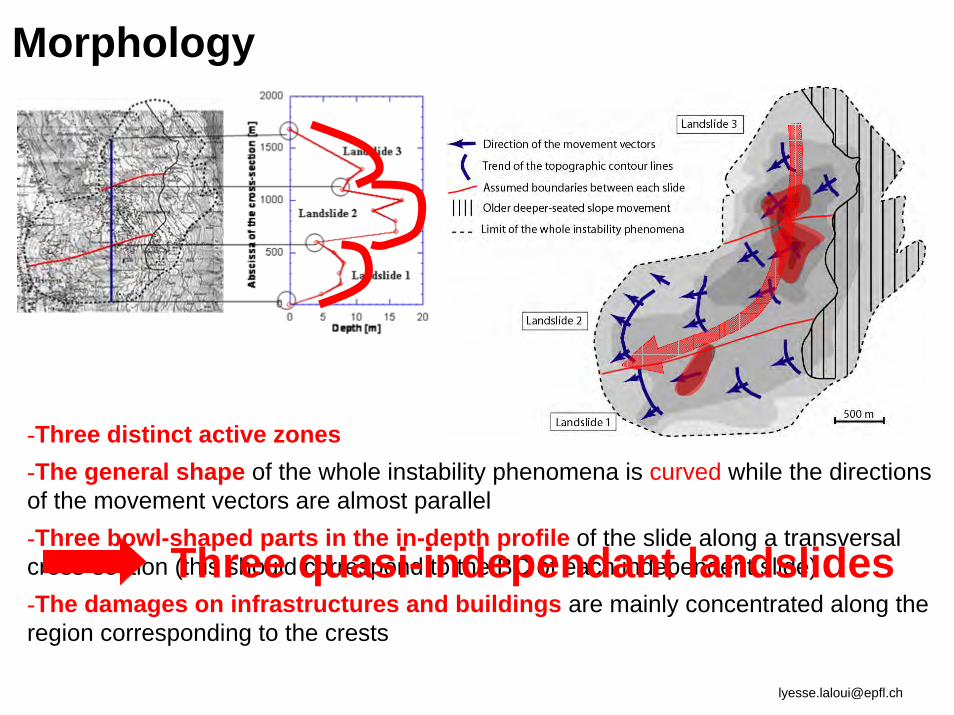
-Three distinct active zones-The general shape of the whole instability phenomena is curved while the directions of the movement vectors are almost parallel -Three bowl-shaped parts in the in-depth profile of the slide along a transversal cross-section (this should correspond to the BC of each independent slide) -The damages on infrastructures and buildings are mainly concentrated along the region corresponding to the crests
Three quasi-independant landslides
Morphology

The upper part : “Buntsandstein” sandstone, schists and limestones
The lower part : Austroalpine Triesen Flysh (clayey schists)
Toe : Rhine river alluvia
Hydraulic input from ValünaValley
Direct infiltration
Double feeding system in piezometric observations
Water table is about 20 m to 30 m below the soil surface at the top of the landslide, whereas at the bottom, it almost reaches the surface
The landslide takes place in unsaturated conditions for a large part of its profile
Tacher et al.
Hydrogeology

2D modelling : [2000 crisis modelling] – 2 main actives zones
0
2
4
6
8
Nov
/15/
1999
Jan/
15/2
000
Mar
/15/
2000
May
/15/
2000
Jul/1
5/20
00
Sep
/15/
2000
Continuous inclinometer B5Inclinometer KL1AInclinometer KL1A (Trend)Numerical modelling
Dis
plac
emen
ts [c
m]
Date
Initial time1st January 2000
Zone clearly observable on the map of the average annual displacements
• Good agreement with the general trend
• The measured values are higher than the simulated ones
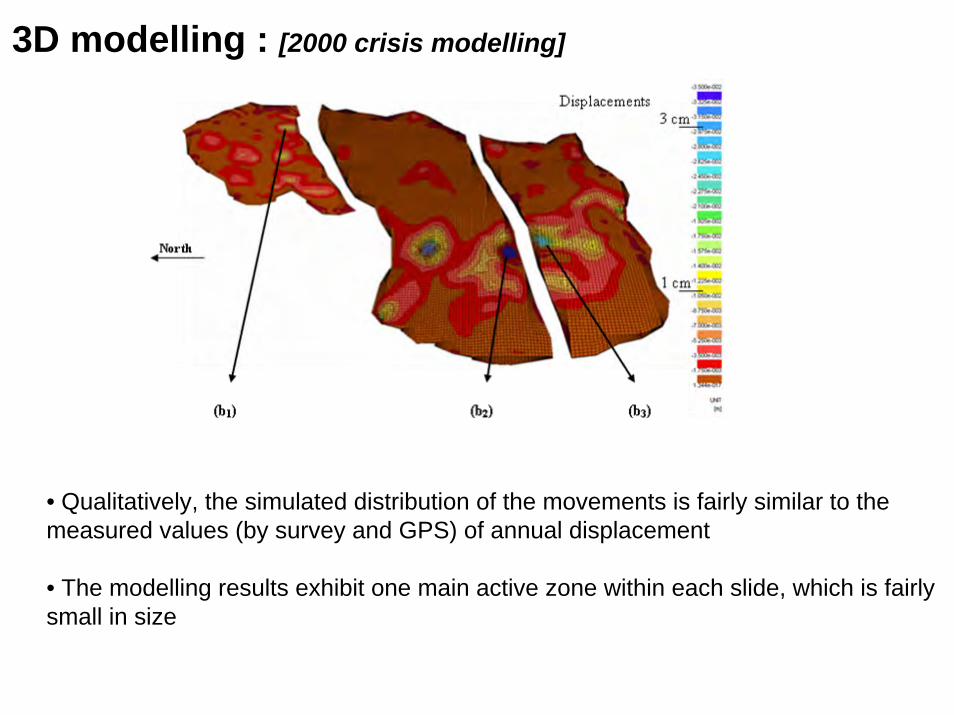
3D modelling : [2000 crisis modelling]
-1
0
1
2
3
4
5
6
7
20
30
40
50
60
70
80
90
100
0 50 100 150 200 250 300
Displacem entsPore water pressure
Dis
plac
emen
ts [m
m]
Por
e w
ater
pre
ssur
e [k
Pa]
T im e [days]
0
3
6
9
12
15
10
20
30
40
50
60
0 50 100 150 200 250 300
Displacem entsPore water pressure
Dis
plac
emen
ts [m
m]
Por
e w
ater
pre
ssur
e [k
Pa]
T im e [days]
0
10
20
30
40
50
-60
-40
-20
0
20
40
0 50 100 150 200 250 300
Displacem entsPore water pressure
Dis
plac
emen
ts [m
m]
Por
e w
ater
pre
ssur
e [k
Pa]
T ime [days]
Elastic reversible behaviour Elasto-plastic (irreversible) behaviour
April August• Qualitatively, the simulated distribution of the movements is fairly similar to the measured values (by survey and GPS) of annual displacement
• The modelling results exhibit one main active zone within each slide, which is fairly small in size

Stabilizing La Frasse landslide
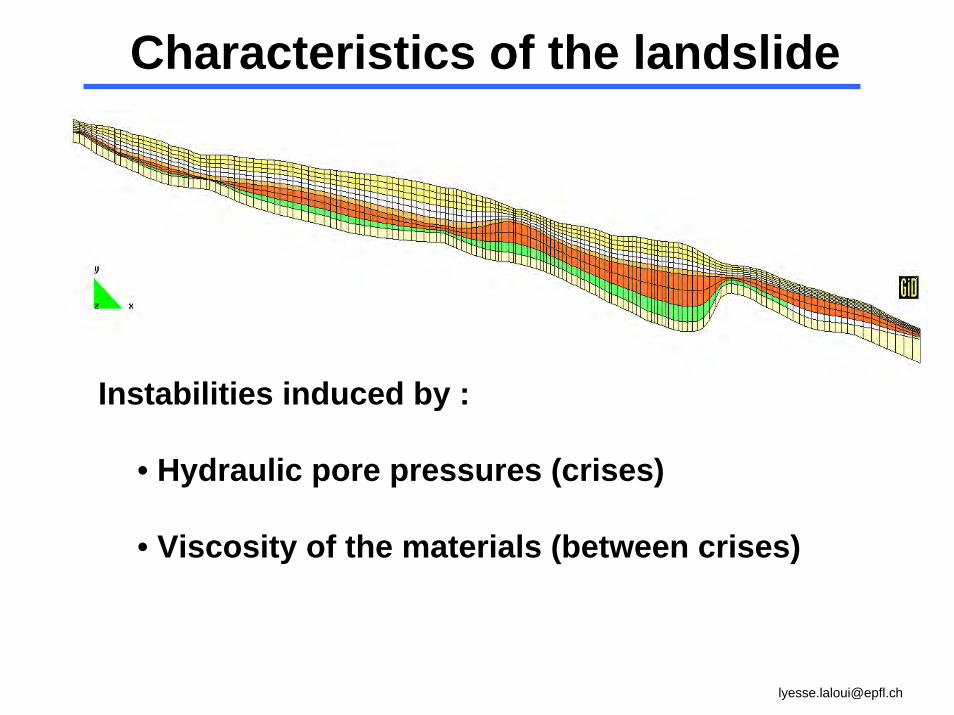
Instabilities induced by :
• Hydraulic pore pressures (crises)
• Viscosity of the materials (between crises)
Characteristics of the landslide

Background
Evolution of the observed displacements of three points A, B, C on La Frasse Landslide and of rainfall (monthly and 6-month running mean values). The shaded triangular bands represent the range of long-term average velocity characterizing the zones in which points A, B and C are located.

Hydro-Mechanical Modelling1890 m
433
m
406.3 kN/m
600.0 kN/mMain assumptions:• Hydro-mechanical coupled formulation• Darcy’s law for the fluid phase + saturated media + K = f(porosity)• Cyclic elasto-plastic + viscoplastic constitutive laws (Mohr-Coulomb,Cap, Hujeux)
2D Mesh: 1694 nodes, 1530 elementsSix layers with different mechanical characteristics

Horizontal displacement Vertical displacement
12• Crisis 94 – 300 days
• Displacement point 1
Comparison between two constitutive laws: cyclic elasto-plastic model (Hujeux) and elasto-perfectly plastic model
(Mohr-Coulomb)
-0.08
-0.06
-0.04
-0.02
0
0.02
0.04
0 50 100 150 200 250 300-0.05
0
0.05
0.1
0.15
0.2
0.25
0 50 100 150 200 250 300
Time [Days]Time [Days]
Hujeux EP
M-CVe
rtic
al d
ispl
acem
ent[
m]
Hor
izon
tal d
ispl
acem
ent[
m]
Point 1Point 1 Hujeux EP
M-C

-1.2-1
-0.8-0.6-0.4-0.2
00.2
0 50 100 150 200 250 300
12
0
1
2
3
4
5
0 50 100 150 200 250 300Time [Days]Time [Days]
Vert
ical
dis
plac
emen
t[m
]
Hor
izon
tal d
ispl
acem
ent[
m]
Without pumping
With pumping
With pumping
Without pumpingPoint 1 Point 1
Horizontal displacement Vertical displacement
• Crisis 94 – 300 days
• Displacement point 1
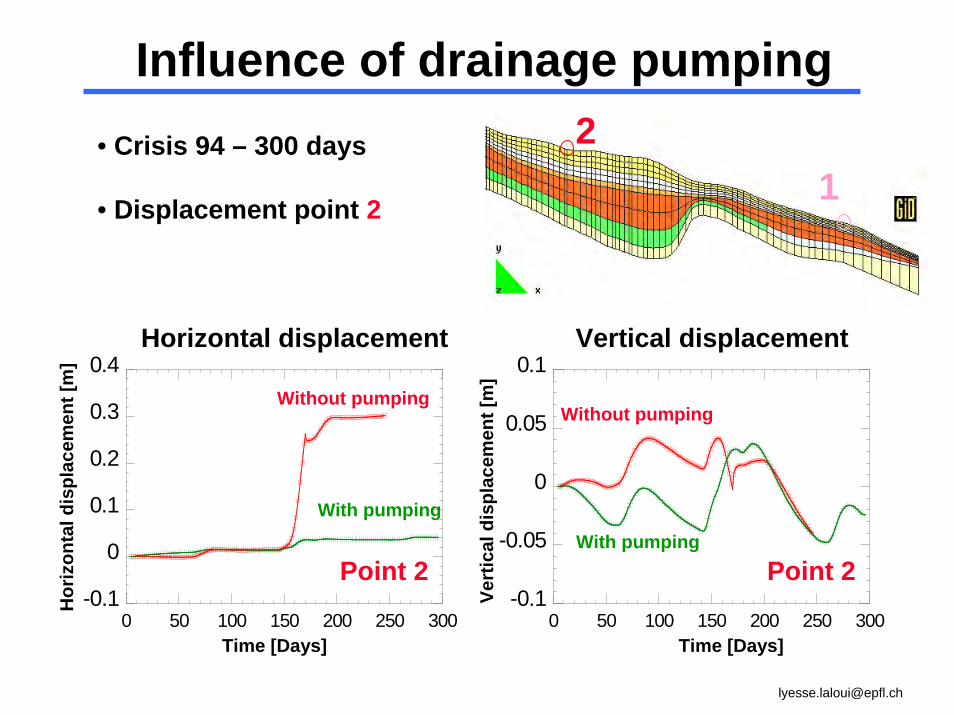
Influence of drainage pumping
-0.1
-0.05
0
0.05
0.1
0 50 100 150 200 250 300-0.1
0
0.1
0.2
0.3
0.4
0 50 100 150 200 250 300
12
Influence of drainage pumping
Time [Days]Time [Days]
Vert
ical
dis
plac
emen
t[m
]
Hor
izon
tal d
ispl
acem
ent[
m]
Without pumpingWithout pumping
With pumpingWith pumping
Point 2Point 2
• Crisis 94 – 300 days
• Displacement point 2
Horizontal displacement Vertical displacement
Conclusion
• Natural slopes represent complex phenomena to model, both in space and time
• Strong need for numerical analysis• Multiphase coupled formulation and
unsaturated soil mechanics may significantly improve the modelling
• Advanced 3D FEM analysis is confirmed to be a useful tool for the design and selection of risk mitigation strategies
Conclusions
Conclusion
• François B., L. Tacher, C. Bonnard, L Laloui, V. Triguero. “Numerical modelling of the hydrogeological and geomechanical behaviour of a large slope movement: The Triesenberg landslide (Liechtenstein)”. Canadian Geotechnical Journal, vol. 44, pp. 840-857, 2007.
• Nuth M., Laloui L. “Effective Stress Concept in Unsaturated Soils: Clarification andValidation of a Unified Framework”. International Journal of Numerical and Analytical Methods in Geomechanics (in press), 2007.
• Charlier R, L. Laloui, F. Collin ”Numerical modelling of coupled poromechanicsprocesses”. REGC (European Journal of Civil Engineering), Volume 10, N°6-7, pp. 669-702, 2006.
• Laloui L., M. Nuth. ”An introduction to the constitutive modelling of unsaturated soils”. REGC (European Journal of Civil Engineering), Volume 9, N°5-6, pp. 651-670, 2005.
• Tacher L., C. Bonnard, L. Laloui, A. Parriaux. "Modelling the behaviour of a large landslide with respect to hydrogeological and geomechanical parameterheterogeneity". Landslides journal. Vol. 2, N°1, pp. 3-14, 2005.
Recent publications
Conclusion
• Laloui L. "Mechanics of Porous Media". Course notes -Doctoral programme of Mechanics - EPFL, 2006. 122 pages.
• Laloui L. "Ecoulements souterrains". Course notes for students of the Civil Engineering Section of the EPFL, 2002 (new edition in 2007). 114 pages.
• Laloui L. "Seepage and Consolidation in Tunnelling". Course notes – Master of Advanced Studies in Tunnelling - EPFL, 2007 (95 pages).
• Laloui L. "Groundwater Flows Interacting withStructures". Course notes for the Advanced-levelcourses in hydraulic schemes, EPFL 2001.
Course NotesCould be obtained at : www.lelivre.ch