24
Untapped cash Down Under A $90Bn opportunity for Aus/NZ companies 2017 Working Capital Performance Survey November 2017
Untapped cash Down UnderA $90Bn opportunity for Aus/NZ companies
2017 Working Capital Performance Survey
November 2017
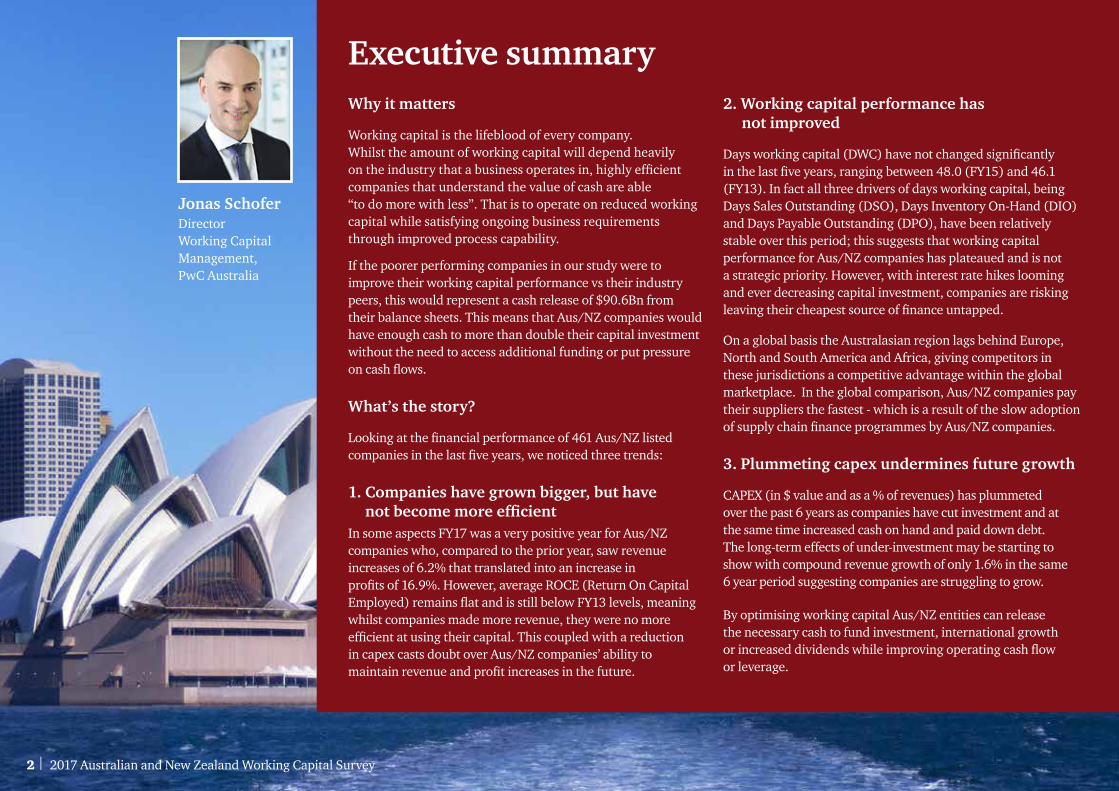
Executive summaryWhy it matters
Working capital is the lifeblood of every company. Whilst the amount of working capital will depend heavily on the industry that a business operates in, highly efficient companies that understand the value of cash are able “to do more with less”. That is to operate on reduced working capital while satisfying ongoing business requirements through improved process capability.
If the poorer performing companies in our study were to improve their working capital performance vs their industry peers, this would represent a cash release of $90.6Bn from their balance sheets. This means that Aus/NZ companies would have enough cash to more than double their capital investment without the need to access additional funding or put pressure on cash flows.
What’s the story?
Looking at the financial performance of 461 Aus/NZ listed companies in the last five years, we noticed three trends:
1. Companies have grown bigger, but have not become more efficient
In some aspects FY17 was a very positive year for Aus/NZ companies who, compared to the prior year, saw revenue increases of 6.2% that translated into an increase in profits of 16.9%. However, average ROCE (Return On Capital Employed) remains flat and is still below FY13 levels, meaning whilst companies made more revenue, they were no more efficient at using their capital. This coupled with a reduction in capex casts doubt over Aus/NZ companies’ ability to maintain revenue and profit increases in the future.
2. Working capital performance has not improved
Days working capital (DWC) have not changed significantly in the last five years, ranging between 48.0 (FY15) and 46.1 (FY13). In fact all three drivers of days working capital, being Days Sales Outstanding (DSO), Days Inventory On-Hand (DIO) and Days Payable Outstanding (DPO), have been relatively stable over this period; this suggests that working capital performance for Aus/NZ companies has plateaued and is not a strategic priority. However, with interest rate hikes looming and ever decreasing capital investment, companies are risking leaving their cheapest source of finance untapped.
On a global basis the Australasian region lags behind Europe, North and South America and Africa, giving competitors in these jurisdictions a competitive advantage within the global marketplace. In the global comparison, Aus/NZ companies pay their suppliers the fastest - which is a result of the slow adoption of supply chain finance programmes by Aus/NZ companies.
3. Plummeting capex undermines future growth
CAPEX (in $ value and as a % of revenues) has plummeted over the past 6 years as companies have cut investment and at the same time increased cash on hand and paid down debt. The long-term effects of under-investment may be starting to show with compound revenue growth of only 1.6% in the same 6 year period suggesting companies are struggling to grow.
By optimising working capital Aus/NZ entities can release the necessary cash to fund investment, international growth or increased dividends while improving operating cash flow or leverage.
Jonas SchoferDirector Working Capital Management, PwC Australia
2 | 2017 Australian and New Zealand Working Capital Survey
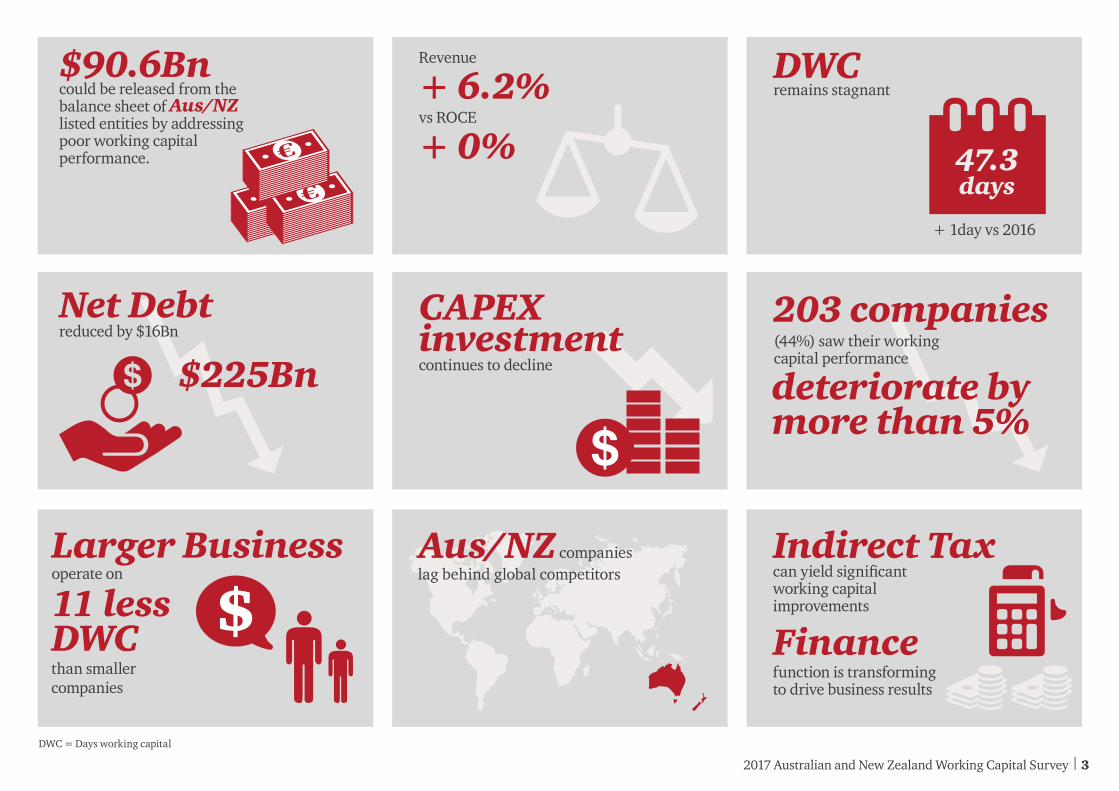
Larger Business operate on
11 less DWC than smaller companies
DWC = Days working capital
Indirect Tax
CAPEX investment continues to decline
can yield significant working capital improvements
function is transforming to drive business results
Net Debt reduced by $16Bn
$225Bn deteriorate by more than 5%
Finance
(44%) saw their working capital performance
203 companies
$90.6Bn could be released from the balance sheet of Aus/NZ listed entities by addressing poor working capital performance.
Revenue
+ 6.2%vs ROCE
+ 0%
DWC remains stagnant
+ 1day vs 2016
47.3 days
Aus/NZ companieslag behind global competitors
2017 Australian and New Zealand Working Capital Survey | 3
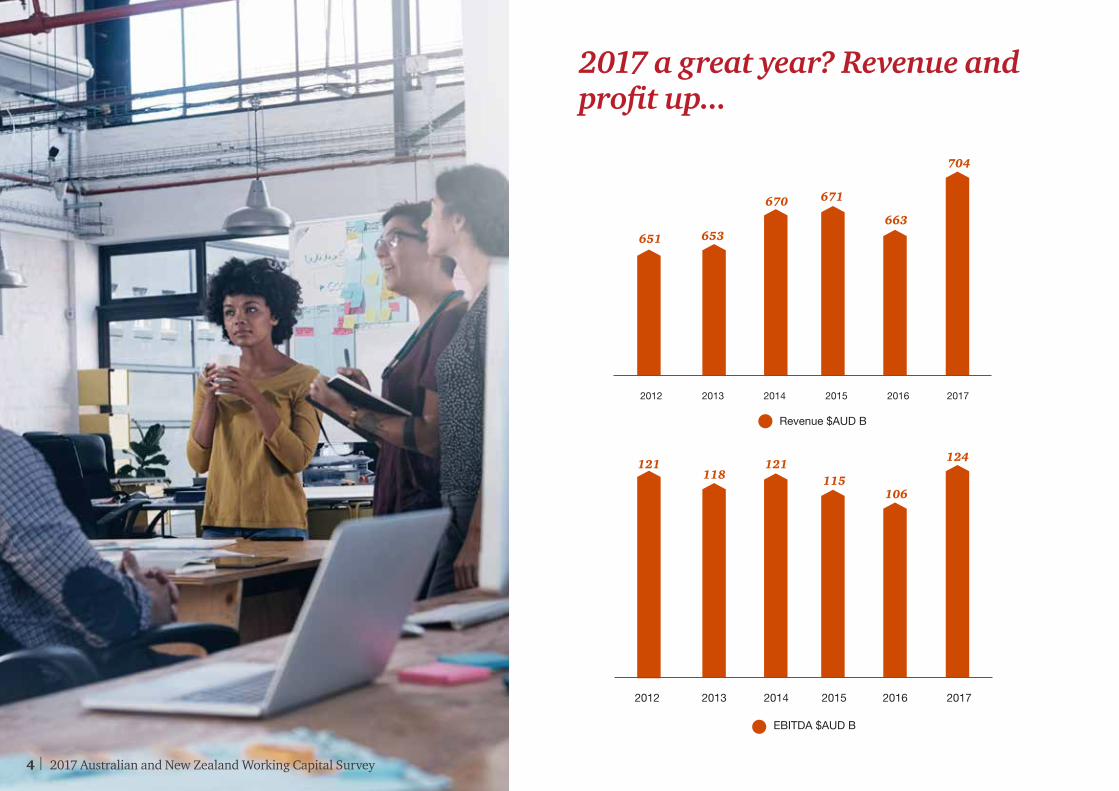
2017 a great year? Revenue and profit up...
115
2012 2013 2014 2015 2016 2017
106
124121118
EBITDA $AUD B
Revenue $AUD B
121
2012 2013 2014 2015 2016 2017
670
653651
671
663
704
115
2012 2013 2014 2015 2016 2017
106
124121118
EBITDA $AUD B
Revenue $AUD B
121
2012 2013 2014 2015 2016 2017
670
653651
671
663
704
4 | 2017 Australian and New Zealand Working Capital Survey
Value
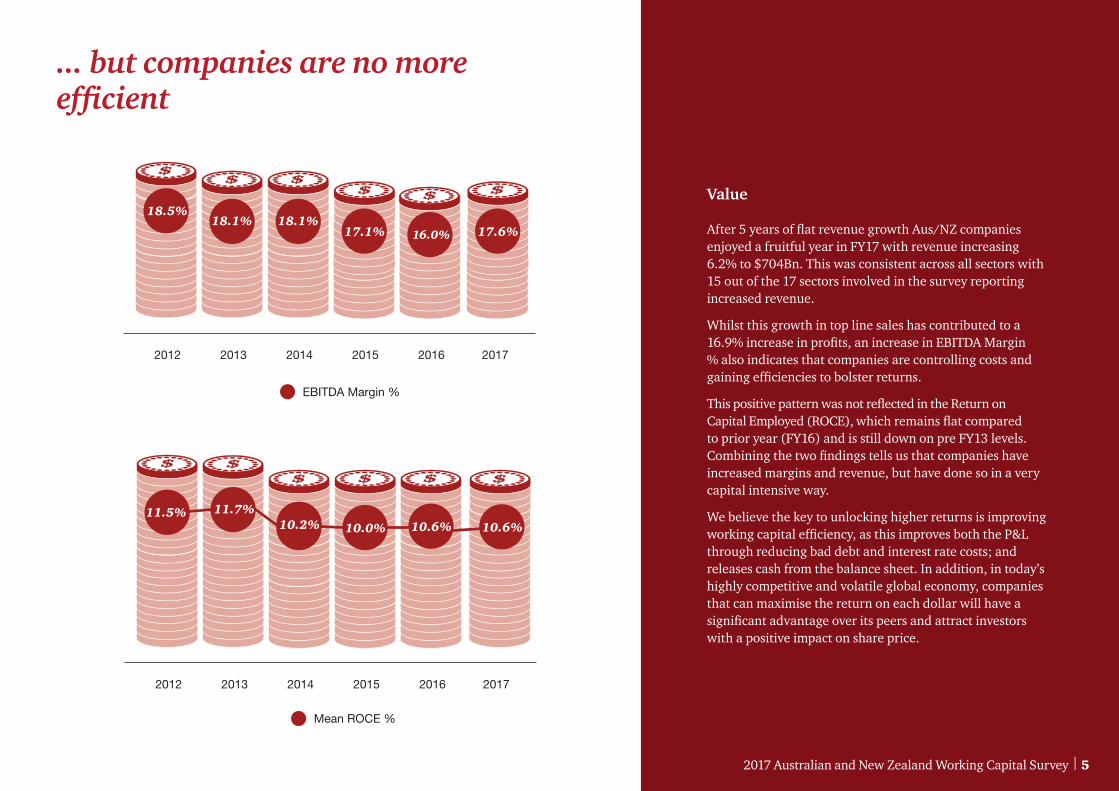
After 5 years of flat revenue growth Aus/NZ companies enjoyed a fruitful year in FY17 with revenue increasing 6.2% to $704Bn. This was consistent across all sectors with 15 out of the 17 sectors involved in the survey reporting increased revenue.
Whilst this growth in top line sales has contributed to a 16.9% increase in profits, an increase in EBITDA Margin % also indicates that companies are controlling costs and gaining efficiencies to bolster returns.
This positive pattern was not reflected in the Return on Capital Employed (ROCE), which remains flat compared to prior year (FY16) and is still down on pre FY13 levels. Combining the two findings tells us that companies have increased margins and revenue, but have done so in a very capital intensive way.
We believe the key to unlocking higher returns is improving working capital efficiency, as this improves both the P&L through reducing bad debt and interest rate costs; and releases cash from the balance sheet. In addition, in today’s highly competitive and volatile global economy, companies that can maximise the return on each dollar will have a significant advantage over its peers and attract investors with a positive impact on share price.
651 653
671 671663663
2012 2013 2014 2015 2016 2017
671
11.5% 11.7%10.2% 10.0% 10.6%
Mean ROCE %
EBITDA Margin %
10.6%
2012 2013 2014 2015 2016 2017
18.5%18.1% 18.1%
17.1% 17.6%67166316.0%
... but companies are no more efficient
2017 Australian and New Zealand Working Capital Survey | 5
1.3 1.3
- 1.5
42.5 43.0 42.243.6
42.043.3
DSO0.5
- 0.8
1.32.1
- 1.1
56.3 55.954.7 54.1
DIO- 0.3 - 0.6
1.4 0.8
- 2.9- 0.3
59.3 52.952.7
54.151.2 52.0
DPO
- 6.3
DSO Days change vs previous yearDIO DPO
DSO, DIO and DPO trend
2012 2013 2014 2015 2016 2017
663
704
671670653
651
DWC days Revenues $AUD Bn
Revenue and NWC days
55.958.1
42.8
46.146.3
47.047.3
48.0
1.3 1.3
- 1.5
42.5 43.0 42.243.6
42.043.3
DSO0.5
- 0.8
1.32.1
- 1.1
56.3 55.954.7 54.1
DIO- 0.3 - 0.6
1.4 0.8
- 2.9- 0.3
59.3 52.952.7
54.151.2 52.0
DPO
- 6.3
DSO Days change vs previous yearDIO DPO
DSO, DIO and DPO trend
2012 2013 2014 2015 2016 2017
663
704
671670
653651
DWC days Revenues $AUD Bn
Revenue and NWC days
55.958.1
42.8
46.146.3
47.047.3
48.0
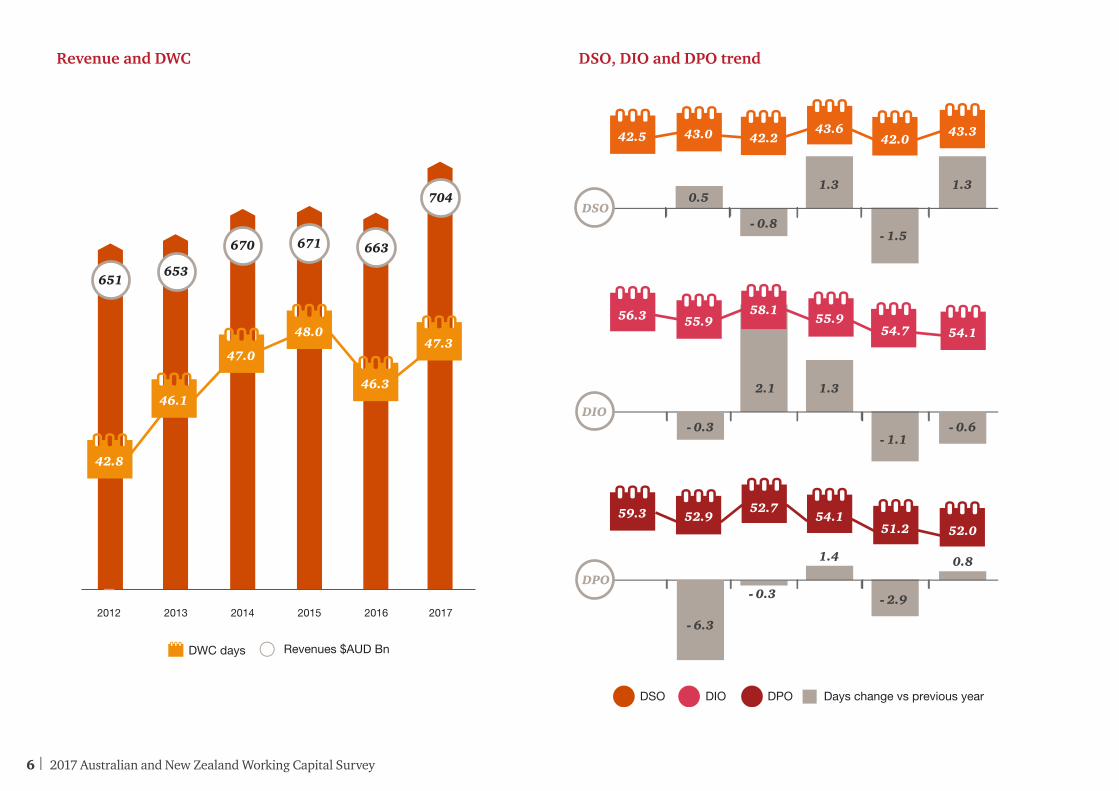
Revenue and DWC DSO, DIO and DPO trend
6 | 2017 Australian and New Zealand Working Capital Survey
Working capital performance has remained consistent for the 5th consecutive year, hovering between 46.1 DWC (2013) and 48.0 DWC (2015). This may suggest companies do not see working capital as a priority or are struggling to implement improvement initiatives.
2017 DWC increased 1 day to 47.3 vs the prior year indicating that working capital management performance deteriorated. The combination of an increase in revenue and a deterioration in DWC, means companies tied up more cash per dollar of revenue on their balance sheet to fund this revenue growth.
On the asset side of the balance sheet Days Sales Outstanding (DSO) has been stable for 6 years now, finishing at 43.3 days, with Days Inventory on-hand (DIO) marginally decreasing to 54.1 days. Whilst liabilities in Days Payments Outstanding at 52.0 days is in line with FY12 performance levels.
Companies that do not manage their cash conversion cycle will experience pressure on funding their day to day operations, which can be mitigated through optimising their DWC performance.
2017 Australian and New Zealand Working Capital Survey | 7
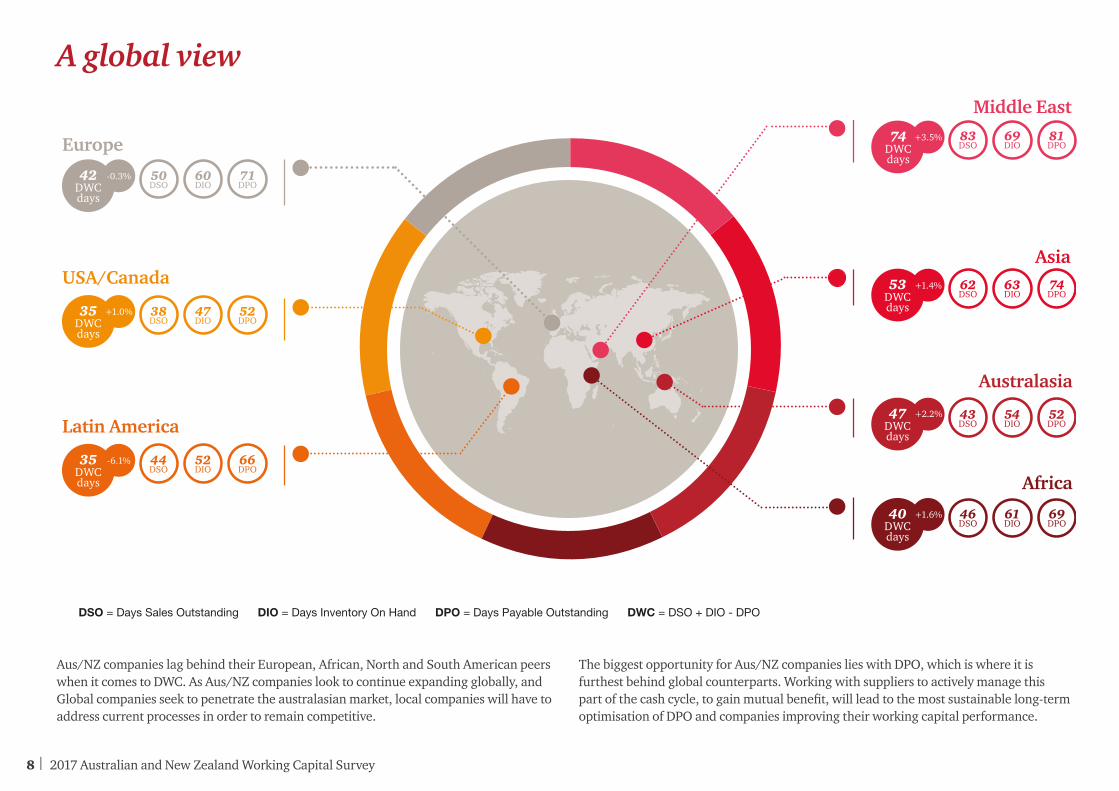
A global view
42DWCdays
35DWCdays
35DWCdays
74DWCdays
53DWCdays
47 DWCdays
40DWCdays
+2.2%
+1.6%
+3.5%
+1.4%
-0.3%
+1.0%
-6.1%
50DSO
60DIO
71DPO
38DSO
47DIO
52DPO
44DSO
52DIO
66DPO
83DSO
69DIO
81DPO
62DSO
63DIO
74DPO
43DSO
54DIO
52DPO
46DSO
61DIO
69DPO
DSO = Days Sales Outstanding DIO = Days Inventory On Hand DPO = Days Payable Outstanding DWC = DSO + DIO - DPO
Aus/NZ companies lag behind their European, African, North and South American peers when it comes to DWC. As Aus/NZ companies look to continue expanding globally, and Global companies seek to penetrate the australasian market, local companies will have to address current processes in order to remain competitive.
The biggest opportunity for Aus/NZ companies lies with DPO, which is where it is furthest behind global counterparts. Working with suppliers to actively manage this part of the cash cycle, to gain mutual benefit, will lead to the most sustainable long-term optimisation of DPO and companies improving their working capital performance.
Europe
Middle East
USA/CanadaAsia
Latin America
Australasia
Africa
8 | 2017 Australian and New Zealand Working Capital Survey

171
193185
223231
215
26%28%
35% 30%
Net Debt $AUD BnDebt / Revenue %
2012 2013 2014 2015 2016 2017
30% 33%
48
62 5956
52
Capex $AUD Bn Cash $AUD Bn
2012 2013 2014 2015 2016 2017
12%
81
55
9% 9%
CAPEX / Revenues %
Capex/ revenue trend
78
53
63 63 67
12%
8%7%
Working capital: the cheapest source of finance
Debt
Net debt both in quantum and relative to revenue decreased last year, with companies utilising increased cash flow to deleverage their balance sheets.
With debt levels still significantly higher than pre FY15 levels and looming interest rate rises, improving working capital performance can enable companies to pay down debt faster and reduce interest costs while positively impacting operating cash flow. Additionally, as the cheapest source of capital available working capital reduction is a funding option for investment when access to external finance is difficult and/or the cost and strategic implications are too high.
CAPEX
Whilst cash flows as a percentage of revenues has remained stagnant, capex levels have dropped by more than 40% in relative terms, from 12% of revenue in FY12 to 7% of revenue in FY17.
Simultaneously cash on hand has increased over the same period which may indicate companies are choosing to hold onto cash rather invest.
In the long term, this level of under investment will prove problematic as companies curtail innovation, development and ultimately growth.
If companies are reducing capex to support current cash flows, then improving working capital will enable companies to both protect cash flows whilst releasing cash for investment and growth.
2017 Australian and New Zealand Working Capital Survey | 9
Softw
areand
services
Healthcare eq
uipm
entand
services
Cap
italG
oods
Energy
Mining &
M
aterials
Consum
erservices
Retailing
Food, b
everageand
tobacco
Pharm
aceuticalsand
life sciences
Med
ia
Autom
obiles
and com
ponents
Com
mercial
and p
rofessional services
Utilities
Transportation
Telecomm
unicationS
ervices
TechnologyH
ardw
are and
Consum
er Durab
lesand
Ap
parel
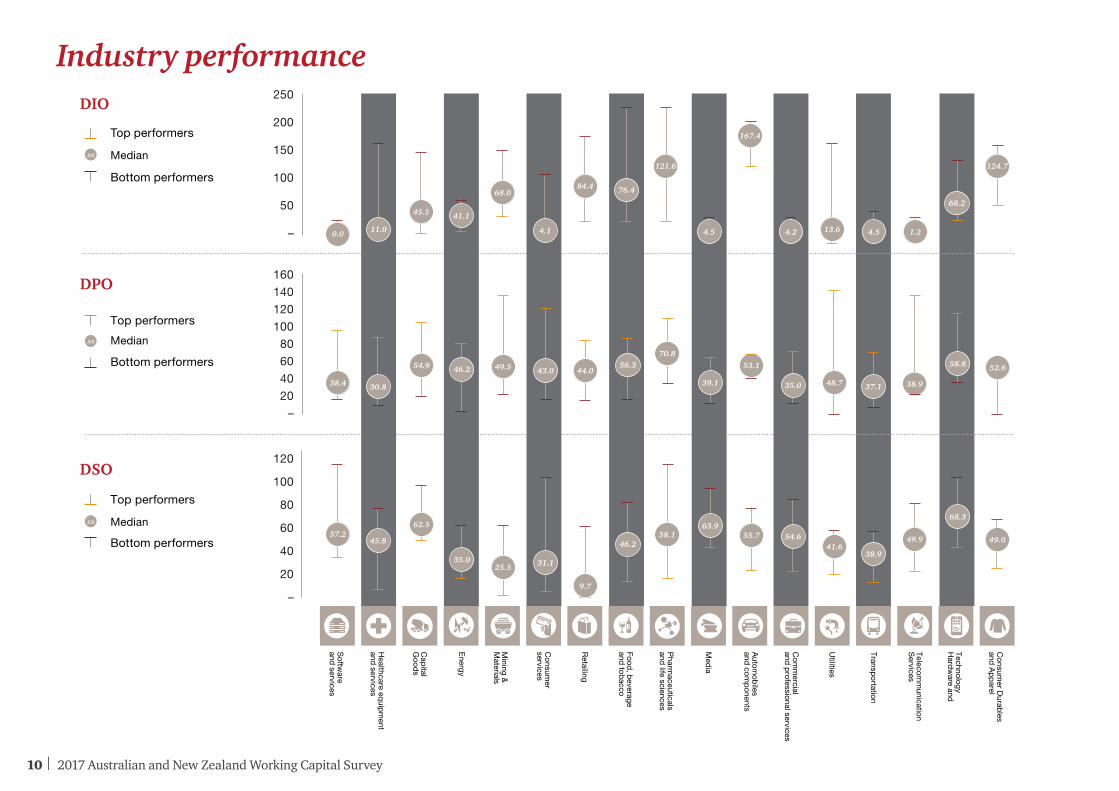
Top performers
Median
Bottom performers
xx
250
200
150
100
50
– 13.6 4.5 1.20.0 11.0 4.1 4.5 4.2
45.5 41.1
68.084.4 76.4
121.6 124.7
167.4
68.2
Bottom performers
Median
Top performers
xx
160
140
120
100
80
60
40
20
–
48.739.1 35.0
54.9 53.1
38.4 30.8
46.2 56.370.8
37.1 38.9
49.5 43.058.8 52.644.0
Bottom performers
Median
Top performers
xx
120
100
80
60
40
20
–
41.6
63.954.6
62.555.757.2
45.8
35.0
46.258.1
38.9
49.9
25.5 31.1
68.3
49.0
9.7
Industry performanceDIO
DPO
DSO
10 | 2017 Australian and New Zealand Working Capital Survey

Industry performance
ROCE, REVENUE and DWC days
The change in ROCE % is a simple difference between 2016 and 2017
The Change in Revenue between 2016 and 2017
The Change in mean DWC days between 2016 and 2017
Our clients in these sectors are increasingly seeking to optimise working capital management as a vital driver of enterprise value.
Mining & Materials
An increase in commodity prices and production output in FY17 has resulted in higher revenue and profits for the mining & materials sector. Although there has been an increased level of cash tied up in the working capital cycle, there has been a marginal reduction in DWC (with all subcomponents remaining relatively flat and equally weighted).
Retail
YOY revenue growth and profit improvement was consistent across nearly all companies in the retail sector. Retailers have the lowest mean DSO (reflecting their position at the end of the supply chain), and therefore limited opportunity to improve the collections process. It will come as no surprise that optimising inventory levels will have biggest impact of working capital for retail companies. However, management of DPO should not be ignored and we are seeing many retail industry leaders begin to implement SCF programs, which eases the burden on payment terms on suppliers.
Food, Beverage and Tobacco
Revenue growth for this sector was substantially driven by the 10 largest companies who dominate this sector.
DWC deteriorated by 7.2 days, primarily driven by an additional +6 days of DSO. This could be due to downstream companies increasing their payment terms, but with retailers data showing +0.5 DPO these would need to be customers in other sectors.
Change in ROCE
Change in ROCE
Change in ROCE
-0.4%
+0.8%
-2.3%
-0.2
+0.5
+7.2
+11.3%
+5.9%
+6.8%
Change in Revenues
Change in Revenues
Change in Revenues
Change in DWC days
Change in DWC days
Change in DWC days
2017 Australian and New Zealand Working Capital Survey | 11

12 | 2017 Australian and New Zealand Working Capital Survey
Large companies 17.7%
Medium companies 14.8%
Large companies9.9%
Medium companies 11.9%
39DSO
54DIO
-52DPO
49DSO
55DIO
-52DPO
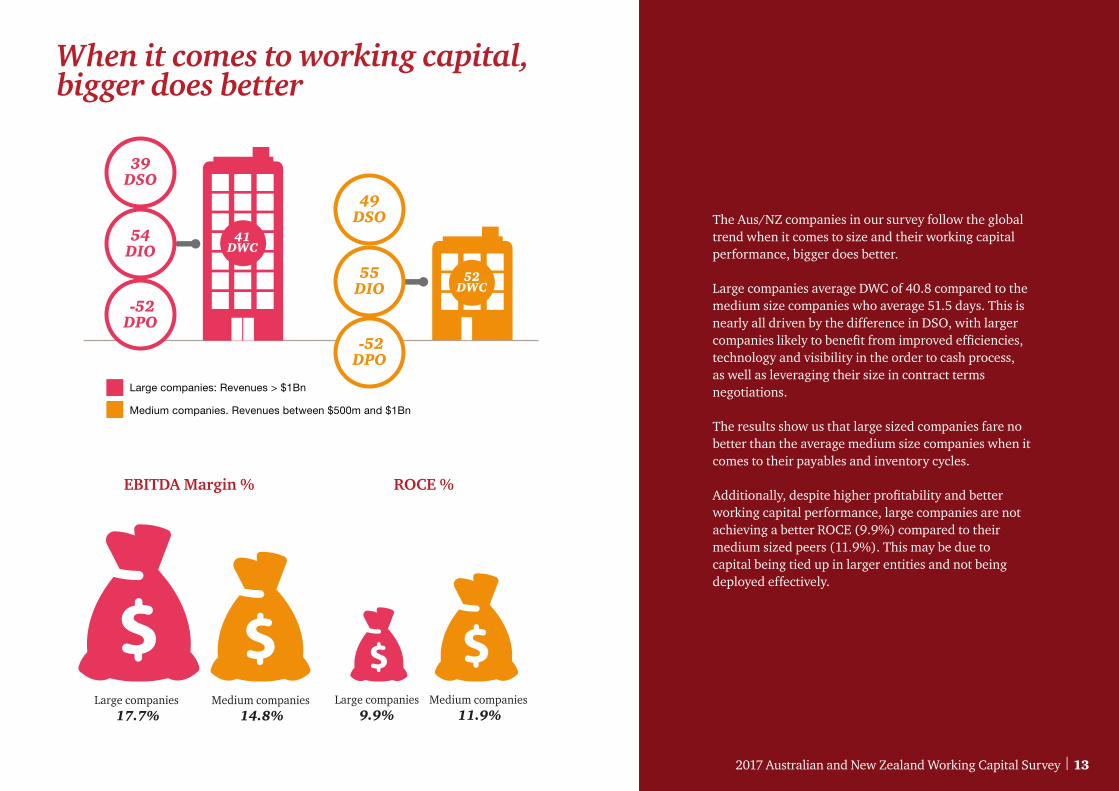
Large companies: Revenues > $1Bn
Medium companies. Revenues between $500m and $1Bn
41DWC
52DWC
The Aus/NZ companies in our survey follow the global trend when it comes to size and their working capital performance, bigger does better.
Large companies average DWC of 40.8 compared to the medium size companies who average 51.5 days. This is nearly all driven by the difference in DSO, with larger companies likely to benefit from improved efficiencies, technology and visibility in the order to cash process, as well as leveraging their size in contract terms negotiations.
The results show us that large sized companies fare no better than the average medium size companies when it comes to their payables and inventory cycles.
Additionally, despite higher profitability and better working capital performance, large companies are not achieving a better ROCE (9.9%) compared to their medium sized peers (11.9%). This may be due to capital being tied up in larger entities and not being deployed effectively.
When it comes to working capital, bigger does better
EBITDA Margin % ROCE %
2017 Australian and New Zealand Working Capital Survey | 13

Stepping upHow finance functions are transforming to drive business results.
In our 2017 Finance benchmarking study we saw that less than a quarter of finance time is spent on delivering business insight. In order to help different functions to manage complex trade offs and identify improvement opportunities less time needs to be spent on transactional work, such as sourcing and reconciling data and more on these value adding tasks, including analysing data in order to generate actionable business insights.
To overcome this challenge our clients are investing in emerging technologies to increase process efficiency, upskilling business partners and driving behavioural change across the business.
Stephen Loadsman Partner Financial Management Consulting, PwC Australia
14 | 2017 Australian and New Zealand Working Capital Survey

The role of the finance function in working capital management
The finance function traditionally plays a central role in the coordination of working capital management. In fact, businesses often place an overreliance on finance to solve working capital problems when many of the underlying drivers are operational rather than financial.
Working capital management is a broad topic with commercial and supply chain touch points where the value of cash is not always front of mind. Finance has a big role to play in helping the business to make good decisions in the midst of often competing financial objectives and incentives. The reason that organisations turn to finance to play this central role is that often it’s the finance team who are responsible for sourcing, validating and analysing the disparate data sets and inputs to this complex progress.
The role of the new breed of finance business partner needs to focus on business outcomes. Working capital improvement is one area where positive business outcomes can really benefit the organisation and the finance team can help cross functional stakeholders to understand the cash impact of operational decisions.
Building a clear role for business partners with the right skills to impact business decisions.
Investing in emerging technologies (e.g. data analytics, tailored collections pathways and robotic process automation).
Driving behaviour and cultural change across the organisation.
Driving large scale business transformation based upon sound financial analysis and measurable benefits.
How leading finance functions are pulling ahead:
Only 24% of finance time is spent on insight-generating activities
24%
1
2
3
4
2017 Australian and New Zealand Working Capital Survey | 15

Even in the face of some protectionist sentiment driven from events such as Brexit and the change in the political landscape in the United States, the continued emergence of developing nations and new markets has seen the globalisation of trade and supply chains continue to grow.
This is particularly relevant in our region and to Australia where we see businesses continuing to expand their global footprints. In large part this is fuelled by businesses dispersing their operations around the globe to support strategic growth initiatives in new markets, to source lower cost of goods/materials and to reduce overall operating costs through more efficient supply chains.
Expanding global operating footprints however presents varying tax & regulatory exposures in operating globally and moving goods cross border, all of which can negatively impact cash flows if not managed effectively.
Take the movement of goods and orders across borders for example. The obvious impact of cargo held up at the border is idle inventory. However the inventory planning function of an organisation may react to uncertainty of cross border flow by adding greater days cover to their inventory planning calculations, further pushing up inventories and working capital.
For business that are operating globally it is critical that they first identify the various points in the Supply
Chain where trade barriers, taxes and regulations tie up cash, and then deploy targeted strategies that can eliminate or minimise the impact of these. For example businesses have implemented strategic central or regional buffer stock models to not only provide commercial speed to market advantages but to provide relief from costly additional tax and regulatory imposts where these inventories are distributed.
Further examples of some strategies that Australian business should look to deploy include:
Management of taxes
Understanding fully the various rates, rules, reliefs and regimes set out by the various tax and customs authorities with regard to GST/VAT and customs duty, and ensuring they are fully utilising schemes available that can defer payment of taxes. In Australia for example, importing businesses should look to access the deferred GST scheme which allows businesses to defer payment of GST on all taxable importations. They should also explore options for customs and excise bonded warehousing that can enable the deferral of duty and excise payments. Within corporate taxes, with accurate forecasting there are opportunities to vary corporate tax instalment rates and to reduce the rate of withholding taxes for example by accessing available tax treaties or statutory concessions.
Measuring, monitoring and managing transaction taxes within a working capital strategy
Ben LannanPartner TaxPwC Australia
16 | 2017 Australian and New Zealand Working Capital Survey
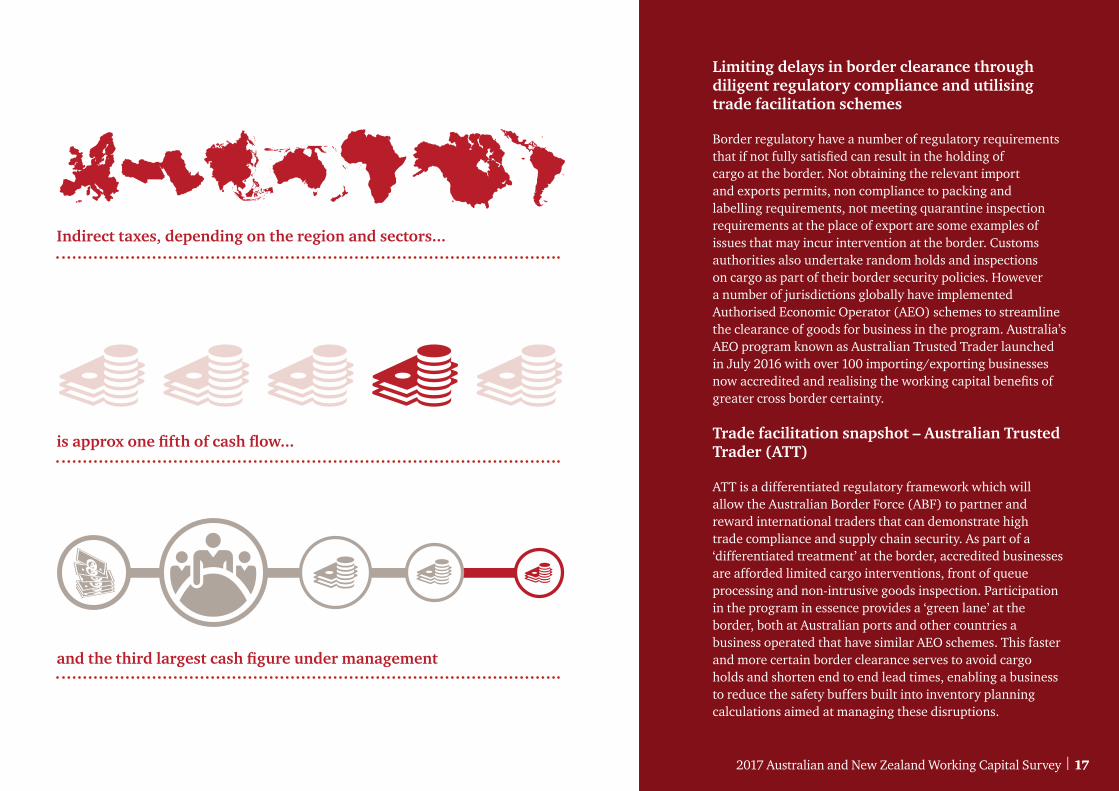
Indirect taxes, depending on the region and sectors...
is approx one fifth of cash flow...
and the third largest cash figure under management
Limiting delays in border clearance through diligent regulatory compliance and utilising trade facilitation schemes
Border regulatory have a number of regulatory requirements that if not fully satisfied can result in the holding of cargo at the border. Not obtaining the relevant import and exports permits, non compliance to packing and labelling requirements, not meeting quarantine inspection requirements at the place of export are some examples of issues that may incur intervention at the border. Customs authorities also undertake random holds and inspections on cargo as part of their border security policies. However a number of jurisdictions globally have implemented Authorised Economic Operator (AEO) schemes to streamline the clearance of goods for business in the program. Australia’s AEO program known as Australian Trusted Trader launched in July 2016 with over 100 importing/exporting businesses now accredited and realising the working capital benefits of greater cross border certainty.
Trade facilitation snapshot – Australian Trusted Trader (ATT)
ATT is a differentiated regulatory framework which will allow the Australian Border Force (ABF) to partner and reward international traders that can demonstrate high trade compliance and supply chain security. As part of a ‘differentiated treatment’ at the border, accredited businesses are afforded limited cargo interventions, front of queue processing and non-intrusive goods inspection. Participation in the program in essence provides a ‘green lane’ at the border, both at Australian ports and other countries a business operated that have similar AEO schemes. This faster and more certain border clearance serves to avoid cargo holds and shorten end to end lead times, enabling a business to reduce the safety buffers built into inventory planning calculations aimed at managing these disruptions.
2017 Australian and New Zealand Working Capital Survey | 17

18 | 2017 Australian and New Zealand Working Capital Survey
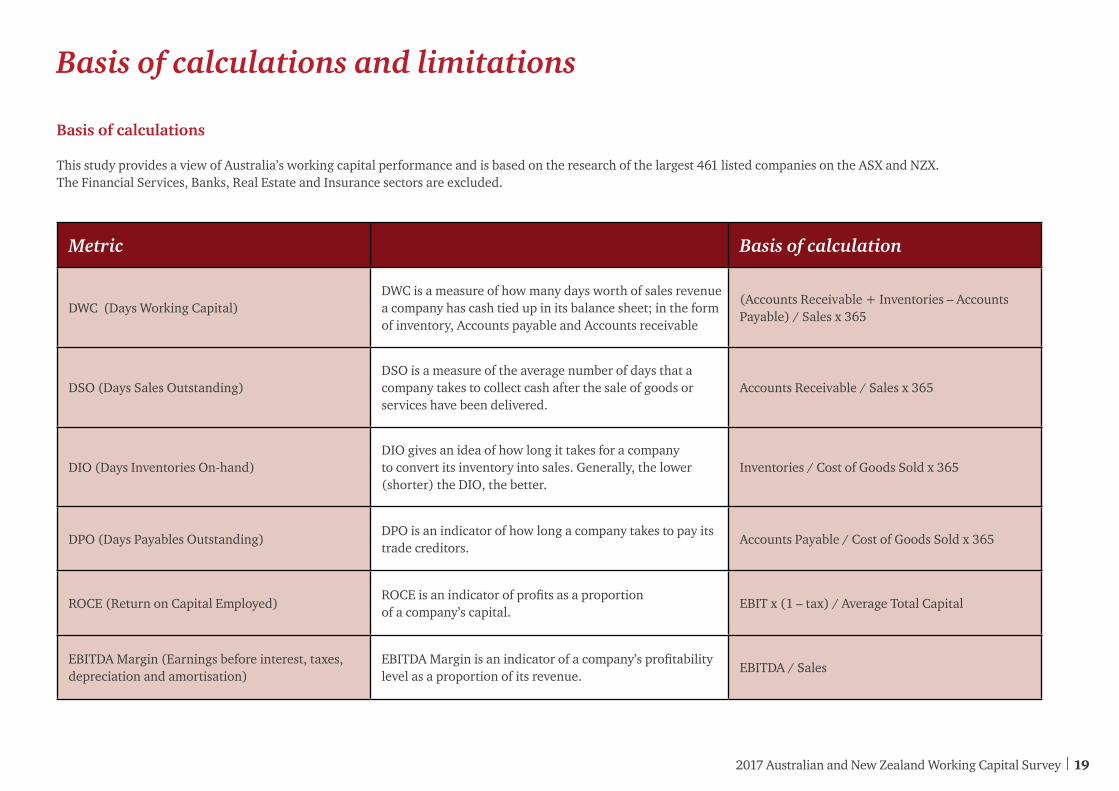
Basis of calculations and limitations
Basis of calculations
This study provides a view of Australia’s working capital performance and is based on the research of the largest 461 listed companies on the ASX and NZX. The Financial Services, Banks, Real Estate and Insurance sectors are excluded.
Metric Basis of calculation
DWC (Days Working Capital)DWC is a measure of how many days worth of sales revenue a company has cash tied up in its balance sheet; in the form of inventory, Accounts payable and Accounts receivable
(Accounts Receivable + Inventories – Accounts Payable) / Sales x 365
DSO (Days Sales Outstanding)DSO is a measure of the average number of days that a company takes to collect cash after the sale of goods or services have been delivered.
Accounts Receivable / Sales x 365
DIO (Days Inventories On-hand)DIO gives an idea of how long it takes for a company to convert its inventory into sales. Generally, the lower (shorter) the DIO, the better.
Inventories / Cost of Goods Sold x 365
DPO (Days Payables Outstanding)DPO is an indicator of how long a company takes to pay its trade creditors.
Accounts Payable / Cost of Goods Sold x 365
ROCE (Return on Capital Employed)ROCE is an indicator of profits as a proportion of a company’s capital.
EBIT x (1 – tax) / Average Total Capital
EBITDA Margin (Earnings before interest, taxes, depreciation and amortisation)
EBITDA Margin is an indicator of a company’s profitability level as a proportion of its revenue.
EBITDA / Sales
2017 Australian and New Zealand Working Capital Survey | 19

Typical Results our Clients Experience:
15-30% Reduction in Days Sales Outstanding. Reduced number of disputes, reduced margin erosion, lower bad debt, faster collection.
10-25% Reduction in Days Inventory on-hand at improved service levels & leadtimes.
30-90% Increase in Days Payables Reduced direct & indirect spend, better transparency, P2P automation & efficiency.
Change mindsets and create a cash culture
20 | 2017 Australian and New Zealand Working Capital Survey
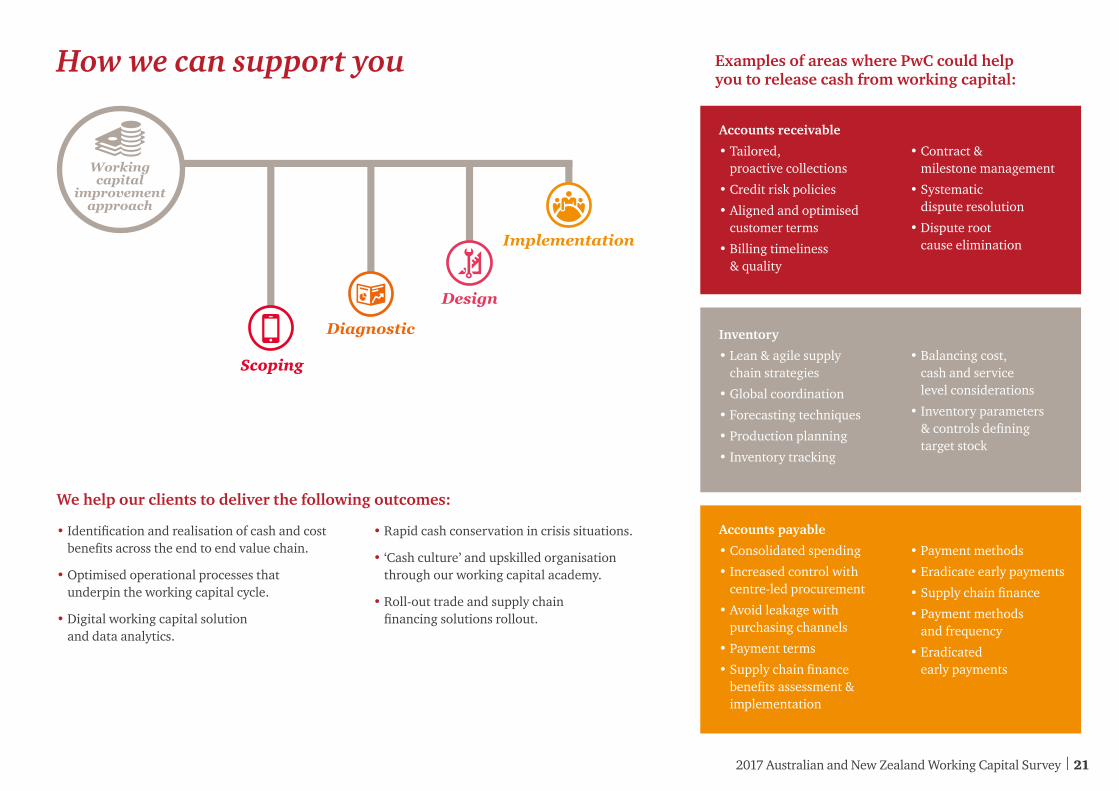
How we can support you
Workingcapital
improvementapproach
Diagnostic
Design
Implementation
Accounts receivable
• Tailored, proactive collections
• Credit risk policies
• Aligned and optimised customer terms
• Billing timeliness & quality
• Contract & milestone management
• Systematic dispute resolution
• Dispute root cause elimination
Inventory
• Lean & agile supply chain strategies
• Global coordination
• Forecasting techniques
• Production planning
• Inventory tracking
• Balancing cost, cash and service level considerations
• Inventory parameters & controls defining target stock
Accounts payable
• Consolidated spending
• Increased control with centre-led procurement
• Avoid leakage with purchasing channels
• Payment terms
• Supply chain finance benefits assessment & implementation
• Payment methods
• Eradicate early payments
• Supply chain finance
• Payment methods and frequency
• Eradicated early payments
Examples of areas where PwC could help you to release cash from working capital:
We help our clients to deliver the following outcomes:
• Identification and realisation of cash and cost benefits across the end to end value chain.
• Optimised operational processes that underpin the working capital cycle.
• Digital working capital solution and data analytics.
• Rapid cash conservation in crisis situations.
• ‘Cash culture’ and upskilled organisation through our working capital academy.
• Roll-out trade and supply chain financing solutions rollout.
Scoping
2017 Australian and New Zealand Working Capital Survey | 21
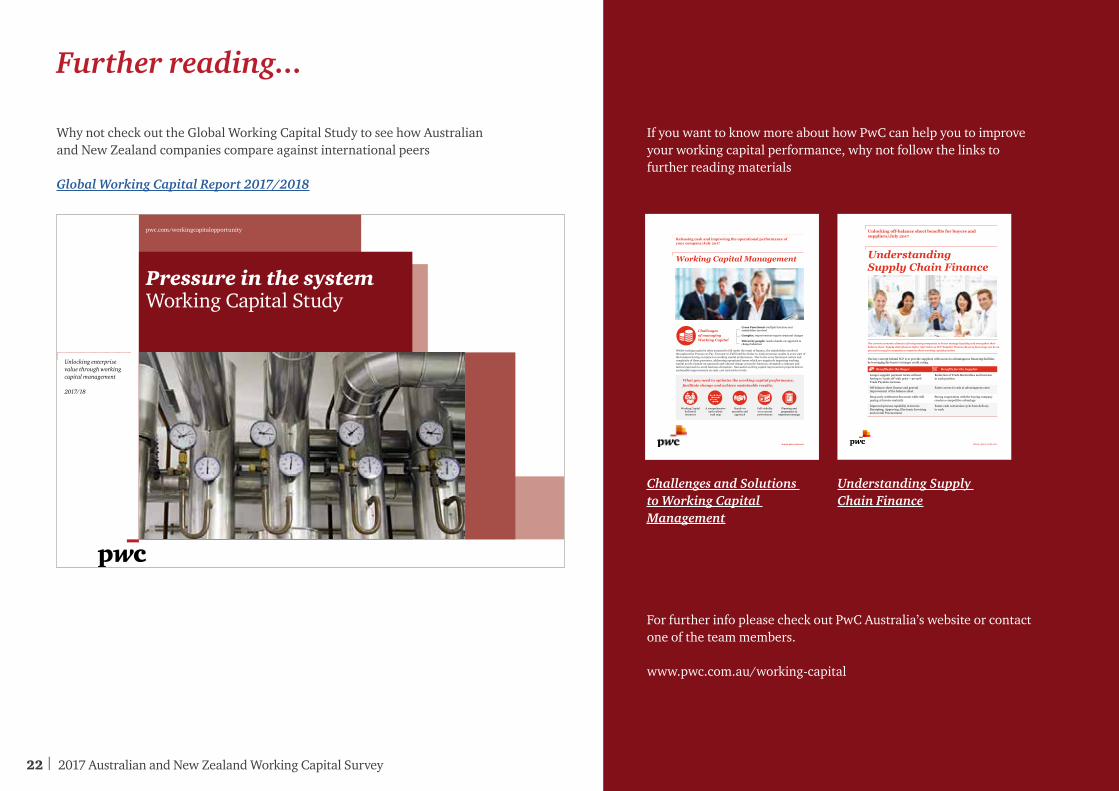
Further reading...
Why not check out the Global Working Capital Study to see how Australian and New Zealand companies compare against international peers
Global Working Capital Report 2017/2018
If you want to know more about how PwC can help you to improve your working capital performance, why not follow the links to further reading materials
Challenges and Solutions to Working Capital Management
Understanding Supply Chain Finance
For further info please check out PwC Australia’s website or contact one of the team members.
www.pwc.com.au/working-capital
Pressure in the systemWorking Capital Study
pwc.com/workingcapitalopportunity
Unlocking enterprise value through working capital management
2017/18
www.pwc.com.au
Releasing cash and improving the operational performance ofyour company/July 2017
Working Capital Management
Challengesof managing Working Capital
Whilst working capital is often assumed to fall under the remit of finance, the stakeholders involved throughout the Procure-to-Pay, Forecast-to-Fulfil and the Order-to-Cash processes results in every part of the business having an impact on working capital performance. Due to the cross functional nature and complexity of these processes, addressing operational issues which are negatively impacting working capital needs a hands-on-approach and cultural change across the business; alongside a strategic and tactical approach to avoid business disruption. Successful working capital improvement projects deliver sustainable improvements on cash, cost and service levels.
What you need to optimise the working capital performance, facilitate change and achieve sustainable results:
Cross Functional: multiple functions andstakeholders involved
Complex: improvements require structural changes
Driven by people: needs a hands-on-approach to change behaviour
Working Capitaldedicatedresources
A comprehensiveand realistic
road map
Hands-onmentality and
approach
Full visibilityover currentperformance
Planning and preparation to
implement change
Unlocking off-balance sheet benefits for buyers and suppliers/July 2017
UnderstandingSupply Chain Finance
The current economic climate is forcing many companies to better manage liquidity and strengthen their balance sheet. Supply chain finance (often referred to as SCF/Supplier Finance/Reverse factoring) can be an attractive way for companies to improve their working capital position.
The key concept behind SCF is to provide suppliers with access to advantageous financing facilities by leveraging the buyer’s stronger credit rating.
www.pwc.com.au
Benefits for the Buyer Benefits for the Supplier
Longer supplier payment terms withouthaving to ‘trade off’ with price – 30-50%Trade Payables increase
Reduction of Trade Receivables and increase in cash position
Off-balance sheet finance and generalimprovement of the balance sheet
Faster access to cash at advantageous rates
Reap early settlement discounts while stillpaying at invoice maturity
Strong cooperation with the buying companycreates a competitive advantage
Improved process capability in InvoiceReceipting, Approving, Electronic Invoicingand overall Procurement
Faster cash conversion cycle from delivery to cash
22 | 2017 Australian and New Zealand Working Capital Survey

Financial Advisory Contacts
Co-authors
Derrick VickersPartnerT: 07 3257 5141E: [email protected]
Ben LannanTax PartnerT: 03 8603 2067E: [email protected]
Sam MarsdenPartnerT: 02 8266 0380E: [email protected]
Stephen LoadsmanPartner Finance TransformationT: 07 3257 8304E: [email protected]
Mark SummersManaging DirectorT: 08 9238 3617E: [email protected]
Chris WarryDirectorT: 03 8603 2868E: [email protected]
Michael FungPartnerT: 03 8603 1147E: [email protected]
Jonas SchoferDirectorWorking Capital ManagementT: 02 8266 4782E: [email protected]
Sam HargreavesSenior ConsultantT: 02 8266 2711E: [email protected]
Alice ThomsonAssociate DirectorT: 02 8266 1831 E: [email protected]
2017 Australian and New Zealand Working Capital Survey | 23

www.pwc.com.au/working-capital
© 2017 PricewaterhouseCoopers. All rights reserved. PwC refers to the Australia member firm, and may sometimes refer to the PwC network. Each member firm is a separate legal entity. Please see www.pwc.com/structure for further details. This content is for general information purposes only, and should not be used as a substitute for consultation with professional advisors. Liability limited by a scheme approved under Professional Standards Legislation. At PwC Australia our purpose is to build trust in society and solve important problems. We’re a network of firms in 157 countries with more than 223,000 people who are committed to delivering quality in assurance, advisory and tax services. Find out more and tell us what matters to you by visiting us at www.pwc.com.au.


