Unterschrift des Betreuers D I P L O M A R B E I T Development of a Mixed-Feed Bioprocess for the Production of rhBMP-2 using an E.coli pBAD Expression System Thema Ausgeführt am Institut für Chemical Engineering der Technischen Universität Wien unter der Anleitung von Prof. Dr. Christoph Herwig durch Magdalena Verena Kment, Bakk. techn. Name Fuchsthallergasse 15/7 1090 WIEN Anschrift 06. Juni 2013 _______________________________ Datum Unterschrift (Student) Die approbierte Originalversion dieser Diplom-/ Masterarbeit ist in der Hauptbibliothek der Tech- nischen Universität Wien aufgestellt und zugänglich. http://www.ub.tuwien.ac.at The approved original version of this diploma or master thesis is available at the main library of the Vienna University of Technology. http://www.ub.tuwien.ac.at/eng
Transcript
Unterschrift des Betreuers
D I P L O M A R B E I T
Development of a Mixed-Feed Bioprocess for the Production of rhBMP-2 using
an E.coli pBAD Expression System
Thema
Ausgeführt am Institut für
Chemical Engineering
der Technischen Universität Wien
unter der Anleitung von Prof. Dr. Christoph Herwig
durch
Magdalena Verena Kment, Bakk. techn.
Name
Fuchsthallergasse 15/7 1090 WIEN
Anschrift
06. Juni 2013 _______________________________
Datum Unterschrift (Student)
Die approbierte Originalversion dieser Diplom-/ Masterarbeit ist in der Hauptbibliothek der Tech-nischen Universität Wien aufgestellt und zugänglich.
http://www.ub.tuwien.ac.at
The approved original version of this diploma or master thesis is available at the main library of the Vienna University of Technology.
http://www.ub.tuwien.ac.at/eng
Master Thesis Production of human Bone Morphogenetic Protein-2 Upstream Design Space Development
Development of a Mixed-Feed Bioprocess for the
Production of rhBMP-2 using an E.coli pBAD
Expression System
Principal Investigator & Head of Laboratory:
Prof. Dr. Christoph Herwig
Supervisor:
DI Patrick Sagmeister
Master Student:
Magdalena Kment, Bakk. techn.
Faculty:
Institute of Chemical Engineering
Technical University of Vienna
Getreidemarkt 9, 1060 Wien
Associated Departments:
RCPE – Research Center Pharmaceutical Engineering
Inffeldgasse 21a/II, A-8010 Graz
BIRD-C Biotech Innovation Research Development & Consulting
Erne-Seder-Gasse 4/ Stiege 2/ Lokal 3
1030 Vienna, Austria
Morphoplant GmbH
Universitätsstrasse 136 ,44799 Bochum
06/06/2013
I
Table of Content Abstract ................................................................................................................................................... 1
PART 1 ................................................................................................................................................... 24
Soft-sensor assisted dynamic investigation of mixed feed bioprocesses ............................................. 24
References of PART 1 .................................................................................................................... 47
PART 2 ................................................................................................................................................... 51
The E. coli pBAD mixed feed platform system: Investigation of temperature on mixed feed metabolic
capabilities, inclusion body purity and product titer using dynamic methods and physiological design
of experiments ...................................................................................................................................... 51
the suboptimal utilization of an abundantly supplied energy source resulting in the
production of an unwanted by-product (for illustration see Figure 4). Examples of the effects
of overflow metabolism are shown in Amribt et al. and Sonnleitner et al. [72], [73].
First insides on the advantages of mixed-feed systems were obtained from the production of
recombinant proteins using P. pastoris as expression system. In 2007, Jungo et al. showed
13
that the production of avidin is superior when using two substrates (sorbitol and methanol)
compared to using methanol alone [68], [69].
Figure 4: Respiratory metabolism: with D-glucose and L-arabinose completely consumed for cell growth.
Critical metabolism (maximum respiratory capacity): with cells maximum specific growth rate. Overflow
metabolism: with D-glucose and L-arabinose excess, and production of the associated metabolites (acetate).
Adapted and modified from Amribt [72].
Our group also extended the approach of mixed-feeding expression platforms to E. coli as
host protein. The pBAD mixed feed system was shown to allow tunable recombinant protein
expression on cellular level, hence is not submitted to “all or none induction” [74]. Two
other successful applications of a mixed-feed system in E. coli producing rhBMP-2 are given
in this thesis (see Part 1 on pg. 22ff and Part 2 on pg. 51ff).
Furthermore this thesis provides valuable information on the mixed-feed system, by using L-
arabinose as inducer (second C-source) while D-glucose serve as energy supply (primary C-
source). The catabolite repressed uptake rates of these two carbon sources represent the
physiological process descriptors, which are critically evaluated in this thesis. It is one
objective to elucidate physiological boundaries for the simultaneous uptake of glucose and
the catabolite repressed secondary carbon source arabinose, during changing cultivation
temperature.
14
Figure 5: Demonstrate the impact of a mixed-feed system on the productivity and the energy supply. This
mixed-feed system utilizes D-glucose as primary and L-arabinose as secondary carbon source. Furthermore,
L-arabinose serves as inducer for the promoter-controlled expression of the recombinant protein of interest.
Hence, this mixed-feed system enables transcription control of the target protein (rhBMP-2).
The advantages of dynamic experimentation
Dynamic experimentation enables bioprocess engineers to study multiple individual process
parameters or multiple levels of process parameters within one fermentation run.
Therefore, dynamic experimentation provides a fast and efficient means to study complex
physiological processes in recombinant expression systems.
First impressing effects of dynamic experimentation were already observed in the 1980s
[14]. In these experiments in yeast, dynamic substrate feeding was primarily used to
decrease heat production. Since these pioneering experiments different dynamic
experiments were successfully developed [14].
On principle dynamic experiments can be grouped into 4 categories: shift, ramp, pulse and
oscillation experiments [14]. Shift experiments are characterized by sudden changes in
process parameters to provoke certain process conditions. These process parameters are
then held constant to monitor adaptation of the system to the new conditions. Shift
experiments can be classified into two groups: shift-up and shift-down experiments [14].
Contrary to this fast and sudden change in process conditions, dynamic ramp experiments
15
are characterized by moderate to slow chances. Usually, in ramp experiments, changes of
the system are slower than the physiological adaptation of the culture under investigation.
Ramp experiments allow the investigation of the system at each single condition. Oscillation
and pulse experiments are characterized by fast changes of process parameters. These
changes are faster than the physiology of the cells can adapt [14].
In 2001, the group of von Stockar successfully applied shift-up and shift-down experiments
for the development of methods for the on-line calculation of conversion rates and yield
coefficients in baker`s yeast [74]. Furthermore, Dietzsch et al., performed dynamic pulse
experiments to produce horseradish peroxidase in P. pastoris [15]. This method was used to
determine the strain-specific substrate uptake rate (qs) in a fast and easy-to-implement
manner. More recently, Zalai et al. extended this approach by combining dynamic fed batch
experiments and mixed feeing strategies [16].
From a methodological viewpoint, the dynamic experiments described in this thesis enclose
pulse and ramp experiments.
Soft sensors to support the control strategy
Specific substrate uptake rates (qs) have emerged as important physiological process
parameters for fermentation [75]. Some authors showed that higher specific substrate
uptake rates have been shown to be associated with increased specific productivity [15].
However, others reported controversial issues on this topic [76], [77]. For control of specific
substrate uptake rates in fermentation experiments, rate-based soft-sensor can be applied.
Soft-Sensors are process analytical technologies that provide access to critical non-measured
process parameters via mathematical processing of readily available process data. Hence,
these mathematical models are based on growth kinetics or multivariate statistical methods
(e.g. PCA, MLR, neural networks) [78]. The structure of such a soft-sensor adapted for
dynamic experiments is depicted in Figure 6. The soft-sensor estimates the biomass
concentration during the fermentation run by using constants (e.g. biomass and substrate
stoichiometries, feed densities and concentrations) and inputs (e.g. O2 and CO2
concentrations derived from off-gas analytics, air concentration as well as extracellular
16
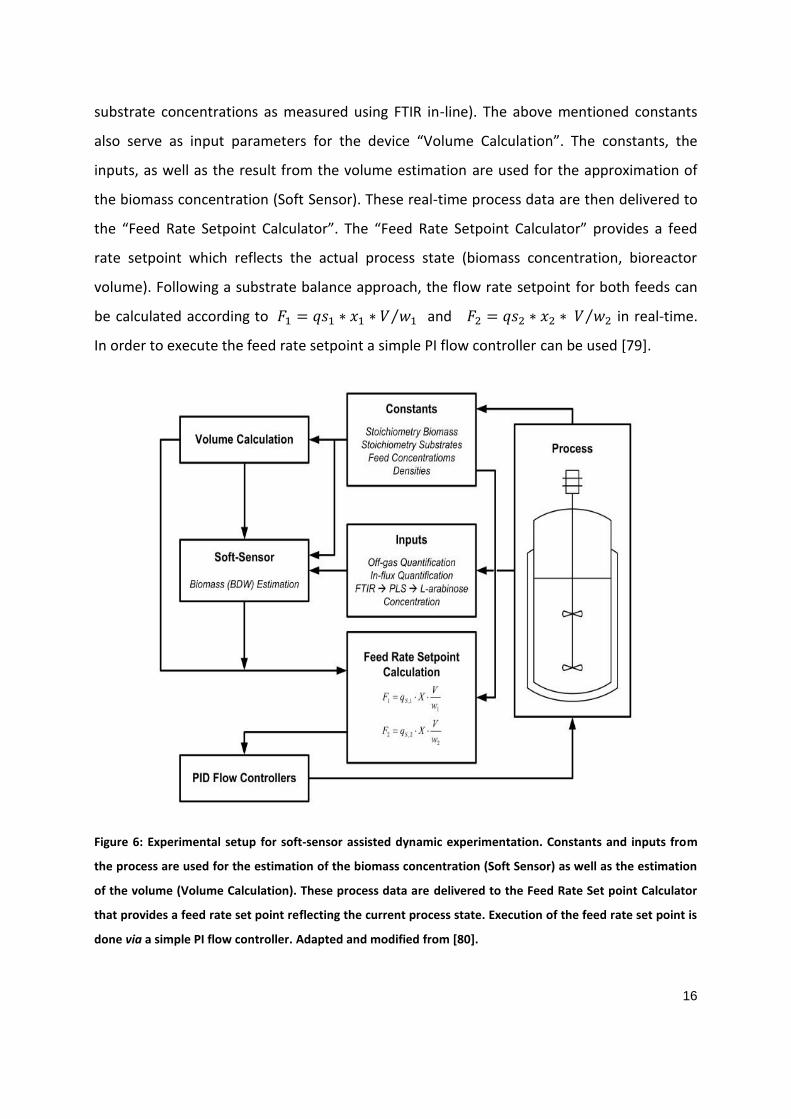
substrate concentrations as measured using FTIR in-line). The above mentioned constants
also serve as input parameters for the device “Volume Calculation”. The constants, the
inputs, as well as the result from the volume estimation are used for the approximation of
the biomass concentration (Soft Sensor). These real-time process data are then delivered to
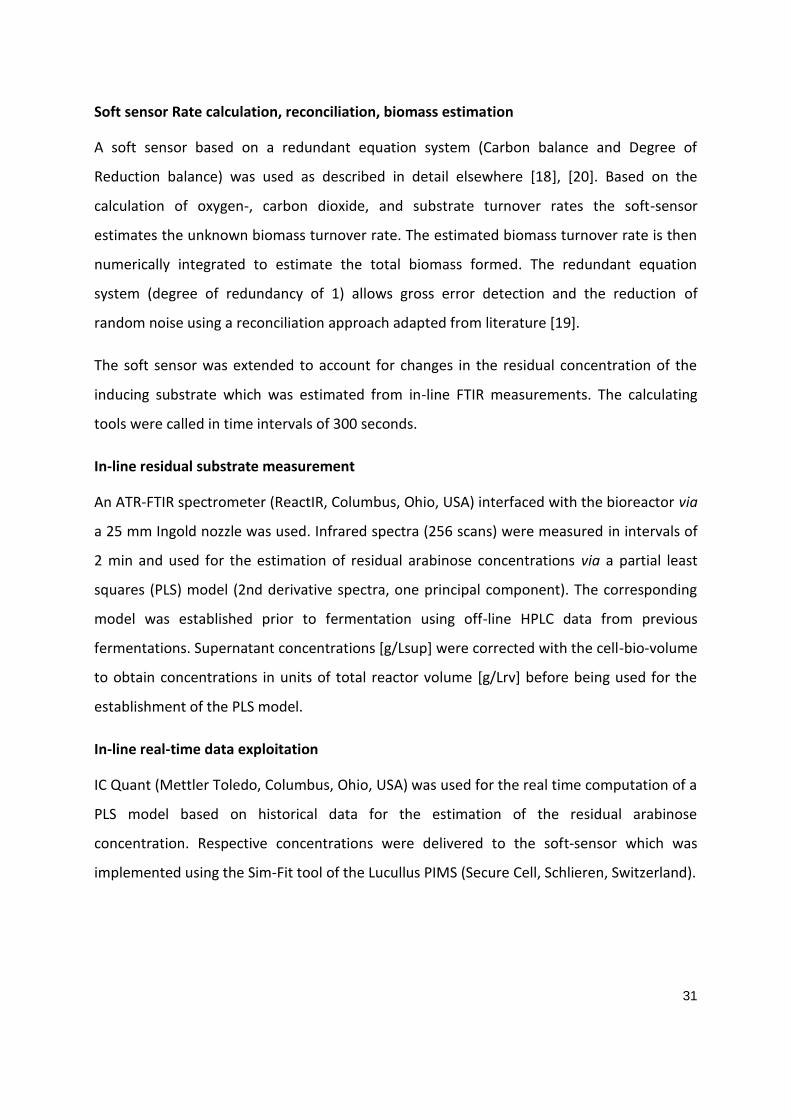
the “Feed Rate Setpoint Calculator”. The “Feed Rate Setpoint Calculator” provides a feed
rate setpoint which reflects the actual process state (biomass concentration, bioreactor
volume). Following a substrate balance approach, the flow rate setpoint for both feeds can
be calculated according to ⁄ and ⁄ in real-time.
In order to execute the feed rate setpoint a simple PI flow controller can be used [79].
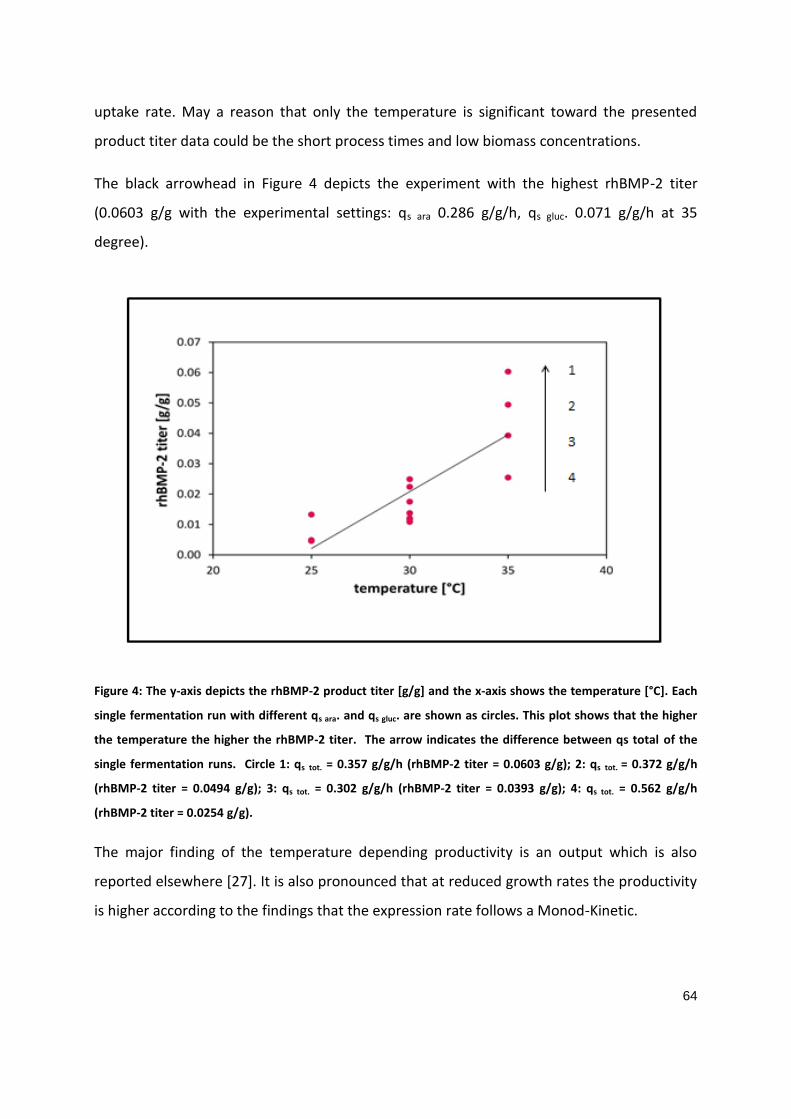
Figure 6: Experimental setup for soft-sensor assisted dynamic experimentation. Constants and inputs from
the process are used for the estimation of the biomass concentration (Soft Sensor) as well as the estimation
of the volume (Volume Calculation). These process data are delivered to the Feed Rate Set point Calculator
that provides a feed rate set point reflecting the current process state. Execution of the feed rate set point is
done via a simple PI flow controller. Adapted and modified from [80].
17
Several authors successfully applied soft-sensor technology for bioprocesses. For example,
Liu et al. proposed a novel soft sensor method based on artificial neural network models for
the estimation of mycelia concentration, sugar concentration and fermentation of macrolide
antibiotics [81]. Additionally, Wechselberger et al. used soft sensors to derive substrate and
metabolite concentrations using a kinetic model based on the respiratory limitations of
baker`s yeast [6], [73]. Furthermore, in 2012, an expert panel provided detailed
recommendations on soft sensor applications [82].
Design of experiments as a process investigation and optimization tool
Due to recent regulatory initiatiatives, the application of design-of-experiments (DoE)
methodology has gained more and more acceptance in the development of biotechnological
processes [4], [83]. DoE provides a versatile tool to optimize fermentation runs using a
reduced number of experiments. On principle, the generic DoE scheme can be rather simple
(see Figure 7). It relates defined input factors of a bioprocess to defined output responses.
Figure 7: Basic scheme of the DoE technology. Input factors and output responses of a bioprocess.
The main advantage is, that fewer experiments are necessary on the one hand and that
interaction effects between different input variables can be elucidated. Furthermore, DoE
allows the signal to be decoupled from background noise and enables an estimation of the
inherent experimental error by including replicate experiments [84].
18
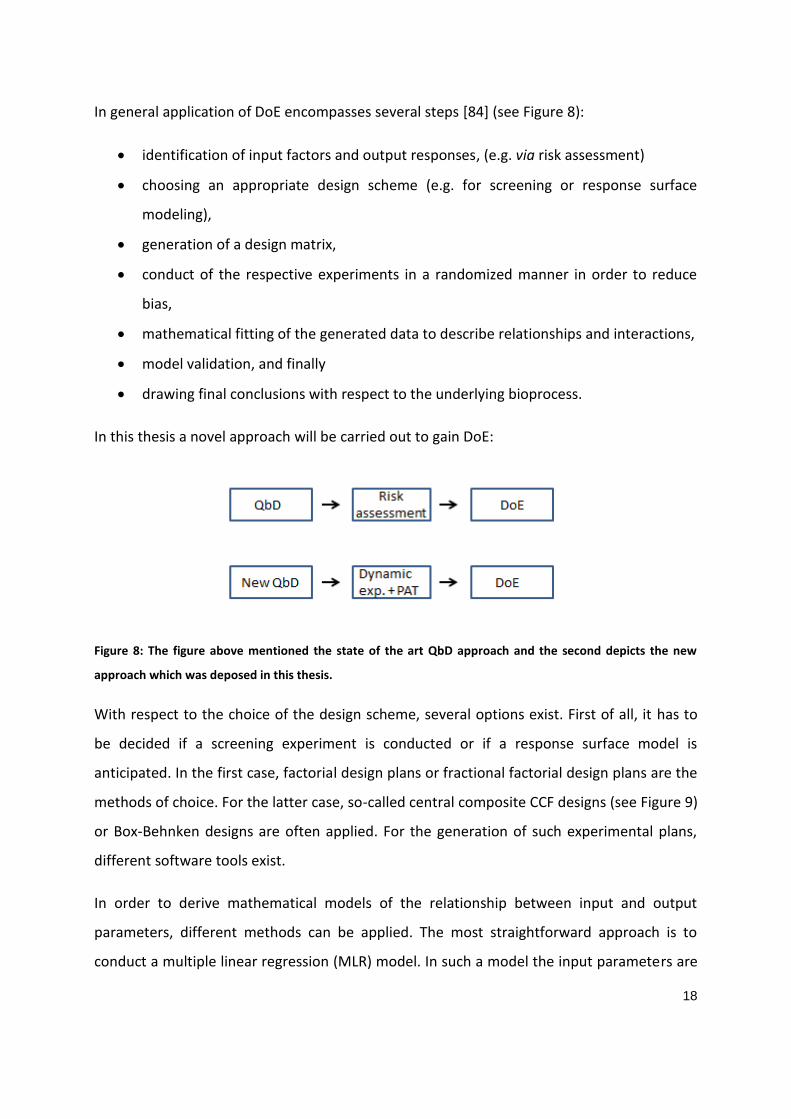
In general application of DoE encompasses several steps [84] (see Figure 8):
identification of input factors and output responses, (e.g. via risk assessment)
choosing an appropriate design scheme (e.g. for screening or response surface
modeling),
generation of a design matrix,
conduct of the respective experiments in a randomized manner in order to reduce
bias,
mathematical fitting of the generated data to describe relationships and interactions,
model validation, and finally
drawing final conclusions with respect to the underlying bioprocess.
In this thesis a novel approach will be carried out to gain DoE:
Figure 8: The figure above mentioned the state of the art QbD approach and the second depicts the new
approach which was deposed in this thesis.
With respect to the choice of the design scheme, several options exist. First of all, it has to
be decided if a screening experiment is conducted or if a response surface model is
anticipated. In the first case, factorial design plans or fractional factorial design plans are the
methods of choice. For the latter case, so-called central composite CCF designs (see Figure 9)
or Box-Behnken designs are often applied. For the generation of such experimental plans,
different software tools exist.
In order to derive mathematical models of the relationship between input and output
parameters, different methods can be applied. The most straightforward approach is to
conduct a multiple linear regression (MLR) model. In such a model the input parameters are
19
termed independent variables (x) and the output parameter of interest is called the
dependent variable (y). The different independent variables constitute the input matrix (X).
In case of MLR, the input matrix X is related to y using the classical linear equation.
Equation 1: General Form of a multiple linear equation
Although, the general multiple linear equation is easy to understand and intuitive only linear
models can be fitted. However, it must be remembered that bioprocesses often show a non-
linear behavior.
The last and final step in conducting DoE is to validate the mathematical model. For
validation, different test statistics can be applied:
R2 = the fraction of the variation of the response variable explained by the model
Q2 = the fraction of the variation of the response variable predicted by the model
In principle, R2 gives information on the internal validity of a model, whereas Q2 provides
information on the external validity (generalizability) of the model; i.e. how well new
experiments with different input parameters can be predicted.
According to Mandenius, a reasonable model should show R2 > 0.75 and Q2 > 0.6, whereas
values below 0.25 should be considered unreliable [85].
For a review of current concepts employing DoE in the context of QbD, the interested reader
is referred to the review articles [7], [8], [86], [87]. Furthermore, Mandenius also gives a
comprehensive overview on the application of DoE for the biotechnological production of
secondary metabolites, the optimization of culture media, and the production of enzymes
and other proteins [85].
20
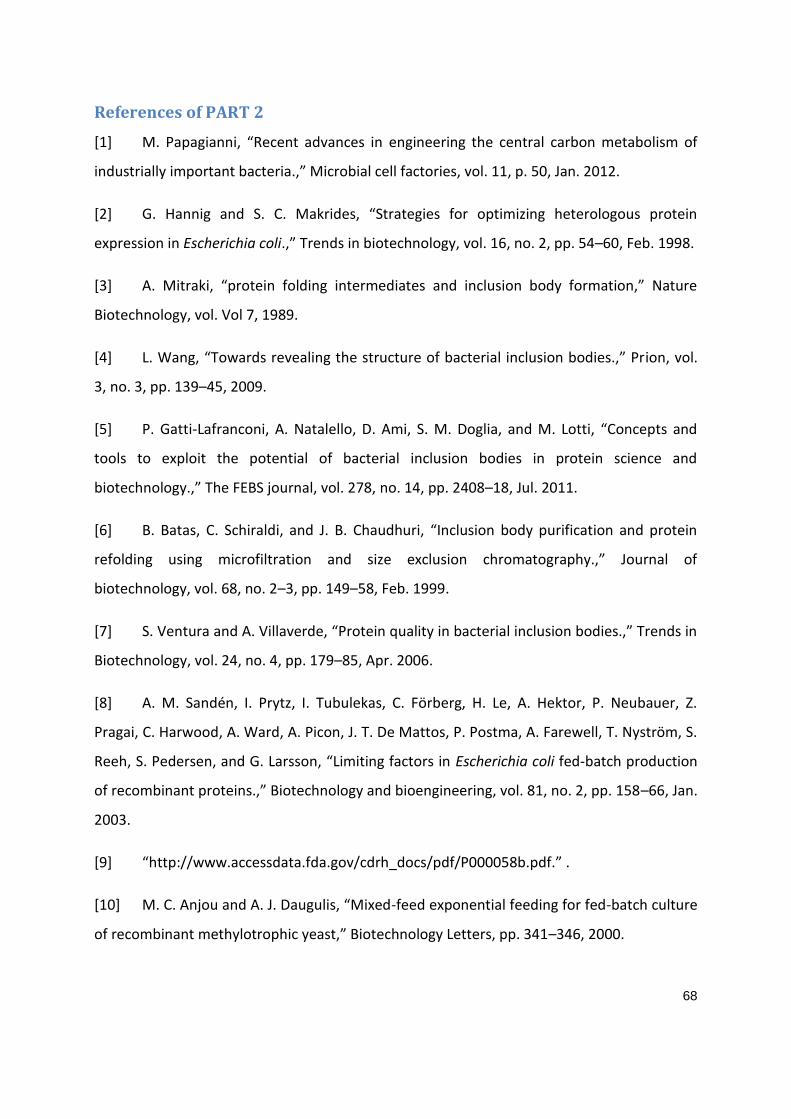
Figure 9: Central Composite CCF Design in three-dimensional input space. The CCF design approximates a
sphere by additionally investigating center points.
21
Goals and key elements
This thesis provides valuable information on the upstream-processing of the production of
the pharmaceutical protein rhBMP-2 expressed in E. coli using the pBAD mixed feed
expression platform.
In order to gain a science and risk-based understanding of the rhBMP-2 production in E. coli,
it is the primary objective of this work to characterize the upstream process. In order to
achieve this primary objective dynamic experimentation (pulse and ramp experiments) are
employed (Part 1) at the one hand, additionally a 3-factor (qs ara, qs gluc. and temperature) DoE
is employed (Part 2).
The specific goals of this thesis are:
Part 1: Dynamic Experimentation for the estimation of the maximum specific uptake rate
for L-arabinose
To Identify physiological boundaries for the rhBMP-2 pBAD mixed-feed system
To determine the maximum specific uptake rate of the pBAD inducer and second C-
source, L-arabinose
To determine the maximum L-arabinose uptake rates as a function of qs and
temperature
Part 2: Application of DoE based on dynamic experiments
Understanding of the interaction between process parameters (qs ara , qs gluc. and
temperature)
Identification of the inclusion body purity
Determination of rhBMP-2 titer and the interaction between (qs ara, qs gluc. and
temperature)
22
Roadmap and structure of the thesis
The first part of the thesis deals with the development and testing of a novel dynamic
method for the physiological investigation of mixed feed systems using a combination of
first-principle soft sensors and in-line Fourier transformation infrared spectroscopy. The
developed method allows the investigation of mixed feed metabolic capabilities; hence how
much inducing substrate and growth substrate a strain is able to simultaneously metabolize.
In the second part of the mixed feed metabolic capabilities are investigated as a function of
temperature for the E. coli pBAD mixed feed expression platform. On the basis of the
physiological information a three factor DoE is designed and performed aiming at the
investigation of mixed feed ratios and temperature on inclusion body purity and final
product titer.
Finally, the general benefits of the applied strategy using dynamic methods, soft-sensor
control strategies and physiological DoE approaches as well as recommendations for further
improvement are summarized in the final Conclusions and Outlook section.
Part 1: Dynamic Experimentation for the estimation of the maximum specific uptake rate
for L-arabinose
Biological System: rhBMP-2 expressing pBAD mixed-feed system
Scientific Question: What is the critical value of the physiological process parameter qs ara max when qs gluc is
constantly controlled via soft-sensors?
Methodological
Approach:
Dynamic experimentation using pulse and ramp experiments using a soft sensor
control strategy applying in-line spectroscopic measurements
Anticipated Added
Value:
Characterization of the system in terms of the maximum specific uptake rate for L-
arabinose
Part 2: Application of DoE based on dynamic experiments
Biological System: rhBMP-2 expressing pBAD mixed-feed system
Scientific Question: the impact of cultivation temperature on inclusion body purity and final product
titer
Methodological
Approach:
3-factor DoE using qs ara, qs gluc and temperature
Anticipated Added Value: optimal conditions in respect to inclusion body purity and final product titer
23
Manuscripts considered for peer-reviewed publication enclosed in
this thesis:
Manuscript I: PART 1 on pg. 22 ff:
Sagmeister P., Kment M., Wechselberger P., Meitz A., Langemann T., and Herwig C*.
Soft-sensor assisted dynamic investigation of mixed feed bioprocesses
Process Biochemistry, currently in review
Indvidual Authorship contributions: PSA designed all the experiments and performed the
experiments, MKM performed all the experiments and was responsible for data analysis, PWE
implemented the soft-sensor technology, AME constructed and provided the E. coli strains, Analytics
(SDS-page, Western blot, RP-HPLC) was done by MKM and AME, TLA assisted in performing the
experiments and revised the manuscript, PSA wrote the manuscript, CHE was the principal
investigator. The manuscript was circulated to all co-authors prior to submission.
Manuscript II: PART 2 on pg. 51 ff:
Kment M.a, Sagmeister P.a, Meitz A., Langemann T., and Herwig C*.
The E. coli pBAD mixed feed platform system: Investigation of temperature on mixed feed
metabolic capabilities, inclusion body purity and product titer using dynamic methods and
physiological design of experiments
Manuscript in preparation.
aboth authors contributed equally to this work
* corresponding author
Individual Authorship contributions: PSA designed all the experiments and assisted in performing the
experiments, MKM performed all the experiments performed the analysis of all data and wrote the
manuscript, AME constructed and provided the E. coli strains, Analytics (SDS-page, RP-HPLC) was
done by MKM and AME, TLA assisted in performing the experiments, CHE was the principal
investigator. This manuscript will be circulated to all co-authors prior to submission.
24
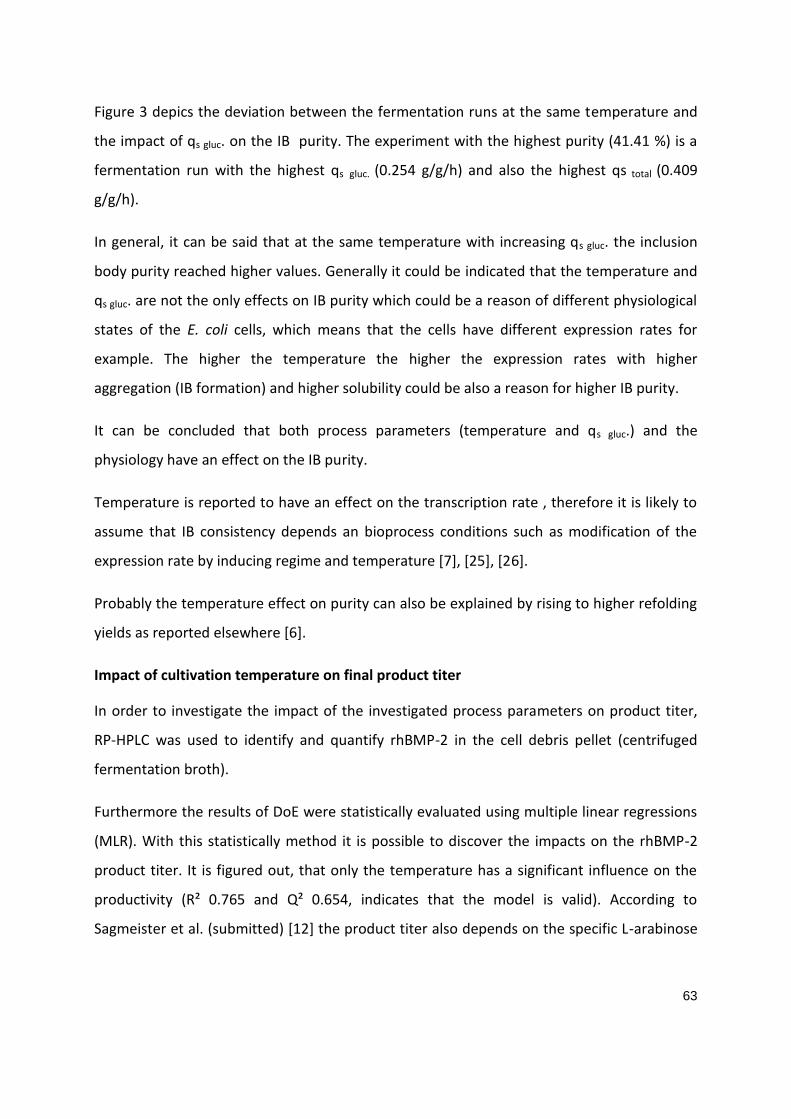
Results
PART 1
Soft-sensor assisted dynamic investigation of mixed feed bioprocesses Patrick Sagmeister1, Magdalena Kment2, Patrick Wechselberger1, Andrea Meitz2, Timo
Langemann2,3 and Christoph Herwig*,1
*to whom the correspondence should be addressed to
1 Institute of Biochemical Engineering, Vienna University of Technology
2 Research Center of Pharmaceutical Engineering (RCPE) GmbH, Graz
3 BIRD-C GmbH, Kritzendorf, Austria
Keywords:
Bioprocess Technology; Mixed Feed, Dynamic Experiments, Physiological Process Control;
[22] M. Carnicer, A. Ten Pierick, J. van Dam, J. J. Heijnen, J. Albiol, W. van Gulik, and P.
Ferrer, “Quantitative metabolomics analysis of amino acid metabolism in recombinant Pichia
pastoris under different oxygen availability conditions.,” Microbial cell factories, vol. 11, no.
1, p. 83, Jan. 2012.
[23] M. Shivhare and G. Mccreath, “Practical Considerations for DoE Implementation in
Quality By Design,” BioProcess International, pp. 22–30, 2010.
[24] M. P. DeLisa, J. Li, G. Rao, W. Weigand, and W. E. Bentley, “Monitoring GFP-operon
fusion protein expression during high cell density cultivation of Escherichia coli using an on-
line optical sensor.,” Biotechnology and Bioengineering, vol. 65, no. 1, pp. 54–64, Oct. 1999.
[25] D. Groot and S. Ventura, “Effect of temperature on protein quality in bacterial
inclusion bodies ´,” vol. 580, pp. 6471–6476, 2006.
[26] A. Villaverde and M. M. Carrió, “Protein aggregation in recombinant bacteria:
biological role of inclusion bodies.,” Biotechnology letters, vol. 25, no. 17, pp. 1385–95, Sep.
2003.
[27] J. Rodriguez, M. Spearman, T. Tharmalingam, K. Sunley, C. Lodewyks, N. Huzel, and
M. Butler, “High productivity of human recombinant beta-interferon from a low-
temperature perfusion culture.,” Journal of biotechnology, vol. 150, no. 4, pp. 509–18, Dec.
2010.
[28] D. Korz, E. A. Sanders, and A. Ror, “High cell density cultivation of Escherichia coli at
controlled specific growth rate,” vol. 20, 1991.
[29] B. Adwn and B. R. Glick, “Pergamon,” vol. 13, no. 2, pp. 247–261, 1995.
71
Conclusion and Outlook
Summary of main findings:
In order to identify physiological boundaries of the pBAD mixed-feed system expressing
rhBMP-2, dynamic experiments (pulse and ramps) and a DoE (3-factor CCF design) were
conducted. The results from the pulse and ramp experiments served as data-driven inputs
for the consecutive planning and design of DoE experiments. Specifically, the experiments
were designed below qs ara max. and the adaptation time (< 10 mins.) were considered.
The main findings from these two approaches can be summarized as follows:
• Dynamic experimentation allowed the detection of the maximum L-arabinose uptake
rates as a function of qs D-glucose and temperature.
In order to understand the interaction between physiological process parameters (qs ara, qs
gluc. and temperature), the application of DoE highlighted that:
• At 30°C temperature IB purity is positively correlated with qs gluc. The higher qs gluc.
(maximum: 0.25 [g/g/h]), the higher the IB purity [%] (maximum: 41.4 %).
• The highest IB purity (48.4 %) was found at a temperature of 35 °C
• Furthermore, the product titer was also found to be positively associated with
the cultivation temperature. Higher product titers (maximum: 1.65 g/L) were
achieved at higher temperatures (35°C).
Limitations of the current work and recommendations for further improvement
The underlying thesis provides important contributions to the upstream processing for the
production of rhBMP-2 in an E. coli mixed-feed system. However, despite the encouraging
results, the current work also suffers from some experimental limitations that offer place for
improvement in future work.
72
• Longer process times to reach higher productivity and higher biomass yields during
longer fed-batch processes
The current work aimed at elucidating the influence of the physiological process parameters
(qs gluc, qs ara, temperature) on product quality (i.e. IB purity and product titer). The
importance of the cultivation temperature and qs gluc was established. However, no
association between the product parameters and qs ara could be found (it must be noted that
others found an impact of qs ara on product titer [16] [88]). A potential reason for this, might
be that the process times in the underlying fermentation experiments were in general too
short to detect the influence of qs ara on product titer. Hence, future experiments might
consider the use of longer process times.
• Additional validation experiment for fine-tuning of qs gluc and temperature
In this thesis the positive association of qs gluc and cultivation temperature was elaborated.
While DoE was a very helpful tool, because it significantly reduced the number of
experiments, consumption of time and costs during formulation development. In order to
confirm the relationship between these physiological process parameters in more detail,
additional a validation experiment (of the optimum space) to elucidate the identified design
space of these parameters in more detail could be conducted.
• DoE: feed-forward feeding strategy vs. soft-sensors
In the current work, the QbD approached DoE-guided fermentations were monitored using a
feed-forward feeding strategy. Soft-sensor assisted control of the process was applied during
the dynamic experiments but not for DoE. Since, the results from dynamic experiments
outlined the usability of soft-sensors, the application of these process analytical tools (PAT)
should also be considered for DoE experiments. Mainly because of the fact that soft-sensors
harbor the potential to adapt feeding rates to different metabolic states.
73
References
[1] S. Lawrence, “Billion dollar babies,” Nature Biotechnology, vol. 25, no. 4, pp. 380–382, 2008.
[2] G. Walsh, “Biopharmaceutical Benchmarks 2010,” Nature Biotechnology, vol. 28, no. 9, pp. 917–24, Sep. 2010.
[3] S. a Berkowitz, J. R. Engen, J. R. Mazzeo, and G. B. Jones, “Analytical tools for characterizing biopharmaceuticals and the implications for biosimilars,” Nature Reviews Drug Discovery, vol. 11, no. 7, pp. 527–40, Jan. 2012.
[4] ICH Q8, “Pharmaceutical Development Q8 (R2),” vol. 8, no. August. 2009.
[5] U. von Stockar, S. Valentinotti, I. Marison, C. Cannizzaro, and C. Herwig, “Know-how and know-why in biochemical engineering,” Biotechnology Advances, vol. 21, no. 5, pp. 417–430, Aug. 2003.
[6] P. Wechselberger, A. Seifert, and C. Herwig, “PAT method to gather bioprocess parameters in real-time using simple input variables and first principle relationships,” Chemical Engineering Science, vol. 65, no. 21, pp. 5734–5746, Nov. 2010.
[7] A. S. Rathore and H. Winkle, “Quality by design for Biopharmaceuticals,” Nature Biotechnology, vol. 27, no. 1, pp. 26–34, 2009.
[8] A. S. Rathore, “Roadmap for implementation of quality by design (QbD) for biotechnology products.,” Trends in Biotechnology, vol. 27, no. 9, pp. 546–53, Sep. 2009.
[9] E. K. Read, R. B. Shah, B. S. Riley, J. T. Park, K. a Brorson, and a S. Rathore, “Process analytical technology (PAT) for biopharmaceutical products: Part I. concepts and applications.,” Biotechnology and Bioengineering, vol. 105, no. 2, pp. 285–95, Feb. 2010.
[10] T. Makino, G. Skretas, and G. Georgiou, “Strain engineering for improved expression of recombinant proteins in bacteria.,” Microbial Cell Factories, vol. 10, no. 1, p. 32, Jan. 2011.
[11] L. Wang, “Towards revealing the structure of bacterial inclusion bodies.,” Prion, vol. 3, no. 3, pp. 139–45, 2009.
[12] B. Batas, C. Schiraldi, and J. B. Chaudhuri, “Inclusion body purification and protein refolding using microfiltration and size exclusion chromatography.,” Journal of Biotechnology, vol. 68, no. 2–3, pp. 149–58, Feb. 1999.
74
[13] D. Gangadharan, K. M. Nampoothiri, and A. Pandey, “a-Amylase Production by Bacillus amyloliquefaciens Using Agro Wastes as Feed Stock,” Food Technol. Biotechnol., vol. 49, no. 3, pp. 336–340, 2011.
[14] O. Spadiut, S. Rittmann, C. Dietzsch, and C. Herwig, “Dynamic process conditions in bioprocess development,” Engineering in Life Sciences, vol. 13, no. 1, pp. 88–101, Jan. 2013.
[15] C. Dietzsch, O. Spadiut, and C. Herwig, “A dynamic method based on the specific substrate uptake rate to set up a feeding strategy for Pichia pastoris.,” Microbial Cell Factories, vol. 10, no. 1, p. 14, Jan. 2011.
[16] D. Zalai, C. Dietzsch, C. Herwig, and O. Spadiut, “A dynamic fed batch strategy for a Pichia pastoris mixed feed system to increase process understanding.,” Biotechnology Progress, vol. 28, no. 3, pp. 878–86, May 2012.
[17] P. Gatti-Lafranconi, A. Natalello, D. Ami, S. M. Doglia, and M. Lotti, “Concepts and tools to exploit the potential of bacterial inclusion bodies in protein science and biotechnology.,” The FEBS journal, vol. 278, no. 14, pp. 2408–18, Jul. 2011.
[18] D. P. Clark and N. J. Pazdernik, Molekulare Biotechnologie. Heidelberg: Spektrum Akademischer Verlag, 2009.
[19] H. E. Kubitschek, “Cell volume increase in Escherichia coli after shifts to richer media,” Journal of Bacteriology, vol. 172, no. 1, pp. 94–101, Jan. 1990.
[20] G. Margreiter, P. Messner, K. D. Caldwell, and K. Bayer, “Size characterization of inclusion bodies by sedimentation field-flow fractionation.,” Journal of Biotechnology, vol. 138, no. 3–4, pp. 67–73, Nov. 2008.
[21] M. Papagianni, “Recent advances in engineering the central carbon metabolism of industrially important bacteria.,” Microbial Cell Factories, vol. 11, p. 50, Jan. 2012.
[22] G. W. Luli and W. R. Strohl, “Comparison of growth, acetate production, and acetate inhibition of Escherichia coli strains in batch and fed-batch fermentations.,” Applied and Environmental Microbiology, vol. 56, no. 4, pp. 1004–11, Apr. 1990.
[23] M. a Eiteman and E. Altman, “Overcoming acetate in Escherichia coli recombinant protein fermentations.,” Trends in Biotechnology, vol. 24, no. 11, pp. 530–6, Nov. 2006.
[24] M. Ignatova and V. Lyubenova, “Control of class bioprocess using on-line information of intermediate metabolite production and consumption rates,” Food Technology, vol. XI, no. 1, pp. 3–16, 2007.
75
[25] S. Y. Lee, “High cell-density culture of Escherichia coli.,” Trends in Biotechnology, vol. 14, no. 3, pp. 98–105, Mar. 1996.
[26] R. Schleif, “AraC protein, regulation of the l-arabinose operon in Escherichia coli, and the light switch mechanism of AraC action.,” FEMS Microbiology Reviews, vol. 34, no. 5, pp. 779–96, Sep. 2010.
[27] L. Gielow, M. Largen, and E. Englesberg, “Initiator constitutive mutants of the L-arabinose operon (OIBAD) of Escherichia coli B/r,” Genetics, vol. 69, pp. 289–302, 1971.
[28] J. Colomé, G. Wilcox, and E. Englesberg, “Constitutive mutations in the controlling site region of the araBAD operon of Escherichia coli B/r that decrease sensitivity to catabolite repression.,” Journal of Bacteriology, vol. 129, no. 2, pp. 948–58, Mar. 1977.
[29] D. Selection and O. F. L. Negative, “Direct selection of l-arabinose negative,” Genetics, vol. 47, no. 2, 1962.
[30] D. E. Sheppard and E. Englesberg, “Further evidence for positive control of the l-arabinose system by gene araC,” J. Mol. Biol., vol. 25, no. 3, pp. 443–454, 1967.
[31] R. B. Helling and R. Weinberg, “Complement studies of arabinose genes in Escherichia Coli,” Genetics, vol. 487, no. October, pp. 1397–1410, 1963.
[32] J. Greenblatt and R. Schleif, “Arabinose C Protein: Regulation of the Arabinose Operon in vitro,” Nature New Biology, vol. 233, pp. 166–170, 1971.
[33] R. Schleif and N. C. St, “Regulation of the L -arabinose operon of Escherichia coli,” Trends in Genetics, vol. 16, no. 2, pp. 559–565, 2000.
[34] C. M. Johnson and R. F. Schleif, “In vivo induction kinetics of the arabinose promoters in Escherichia coli.,” Journal of Bacteriology, vol. 177, no. 12, pp. 3438–42, Jun. 1995.
[35] R. Schleif, “AraC protein: a love-hate relationship.,” BioEssays : news and reviews in molecular, cellular and developmental biology, vol. 25, no. 3, pp. 274–82, Mar. 2003.
[36] T. M. Dunn and R. Schleif, “Deletion analysis of the Escherichia coli ara PC and PBAD promoters,” J. Mol. Biol., vol. 180, no. 1, pp. 201–204, 1984.
[37] D. H. Lee and R. Schleif, “Repression of the araBAD promoter from araO1,” J. Mol. Biol., vol. 224, no. 4, pp. 335–341, 1992.
76
[38] R. B. Lobell and R. F. Schleif, “AraC-DNA looping: orientation and distance-dependent loop breaking by the cyclic AMP receptor protein.,” J. Mol. Biol., vol. 218, no. 1, pp. 45–54, Mar. 1991.
[39] T. Hahn, T. M. Dunn, and R. Schleif, “Upstream repression and CRP stimulation of the Escherichia coli l-arabinose operon,” J. Mol. Biol., vol. 180, no. 1, pp. 61–72, 1984.
[40] C. G. Miyada, L. Stoltzfus, and G. Wilcox, “Regulation of the araC gene of Escherichia coli: catabolite repression, autoregulation, and effect on araBAD expression.,” Proceedings of the National Academy of Sciences of the United States of America, vol. 81, no. 13, pp. 4120–4, Jul. 1984.
[41] A. Mitraki, “protein folding intermediates and inclusion body formation,” Nature Biotechnology, vol. Vol 7, 1989.
[42] V. R. Agashe, S. Guha, H.-C. Chang, P. Genevaux, M. Hayer-Hartl, M. Stemp, C. Georgopoulos, F. U. Hartl, and J. M. Barral, “Function of trigger factor and DnaK in multidomain protein folding: increase in yield at the expense of folding speed.,” Cell, vol. 117, no. 2, pp. 199–209, Apr. 2004.
[43] V. P. Pigiet and B. J. Schuster, “Thioredoxin-catalyzed refolding of disulfide-containing proteins.,” Proceedings of the National Academy of Sciences of the United States of America, vol. 83, no. 20, pp. 7643–7, Oct. 1986.
[44] E. García-Fruitós, “Inclusion bodies: a new concept.,” Microbial Cell Factories, vol. 9, no. 1, p. 80, Jan. 2010.
[45] D. Groot and S. Ventura, “Effect of temperature on protein quality in bacterial inclusion bodies,” FEBS Letters published by Elsevier, vol. 580, pp. 6471–6476, 2006.
[46] Š. Peternel, V. Gaberc-porekar, and R. Komel, “Bacterial Growth Conditions Affect Quality of GFP Expressed Inside Inclusion Bodies,” Acta Chim. Slov, vol. 56, pp. 860–867, 2009.
[47] M. Liovic, M. Ozir, A. B. Zavec, S. Peternel, R. Komel, and T. Zupancic, “Inclusion bodies as potential vehicles for recombinant protein delivery into epithelial cells.,” Microbial Cell Factories, vol. 11, no. 1, p. 67, Jan. 2012.
[48] E. García-Fruitós, N. González-Montalbán, M. Morell, A. Vera, R. M. Ferraz, A. Arís, S. Ventura, and A. Villaverde, “Aggregation as bacterial inclusion bodies does not imply inactivation of enzymes and fluorescent proteins.,” Microbial Cell Factories, vol. 4, p. 27, Sep. 2005.
[49] B. R. . and Deutscher.M.P, “Guide to Protein Purification,” Methodes in Enzymology, vol. 463, 2009.
77
[50] I. Vigentini, A. Merico, M. L. Tutino, C. Compagno, and G. Marino, “Optimization of recombinant human nerve growth factor production in the psychrophilic Pseudoalteromonas haloplanktis.,” Journal of bBotechnology, vol. 127, no. 1, pp. 141–50, Dec. 2006.
[51] P. Li, A. Anumanthan, X.-G. Gao, K. Ilangovan, V. V. Suzara, N. Düzgüneş, and V. Renugopalakrishnan, “Expression of Recombinant Proteins in Pichia Pastoris,” Applied Biochemistry and Biotechnology, vol. 142, no. 2, pp. 105–124, Apr. 2007.
[52] C. Noguère, A. M. Larsson, J. Guyot, and C. Bignon, “Fractional factorial approach combining 4 Escherichia coli strains , 3 culture media , 3 expression temperatures and 5 N-terminal fusion tags for screening the soluble expression of recombinant proteins,” Protein Expression and Purification by Elsevier, vol. 84, pp. 204–213, 2012.
[53] J. M. Song, Y. J. An, M. H. Kang, Y.-H. Lee, and S.-S. Cha, “Cultivation at 6-10°C is an effective strategy to overcome the insolubility of recombinant proteins in Escherichia coli.,” Protein Expression and Purification by Elsevier, vol. 82, no. 2, pp. 297–301, Apr. 2012.
[54] P. Bird, “Production of recombinant serpins in Escherichia coli,” Methods by Elsevier, vol. 32, no. 2, pp. 169–176, Feb. 2004.
[55] G. Georgiou and P. Valaxt, “Expression of correctly folded proteins in Escherichia coil,” Current Opinion in Biotechnology, vol. 7, pp. 190–197, 1996.
[56] H. J. Ihm, S.-J. Yang, J.-W. Huh, S. Y. Choi, and S.-W. Cho, “Soluble expression and purification of synthetic human bone morphogenetic protein-2 in Escherichia coli.,” BMB reports, vol. 41, no. 5, pp. 404–7, May 2008.
[57] J. J. Greene, “Recombinant Gene Expression,” Methodes in Molecular Biology, vol. 267.
[58] M. Dragosits, J. Stadlmann, J. Albiol, K. Baumann, M. Maurer, B. Gasser, M. Sauer, F. Altmann, P. Ferrer, D. Mattanovich, and B. Cerdanyola, “The Effect of Temperature on the Proteome of Recombinant Pichia pastoris research articles,” Journal of Proteome Research, vol. 8, pp. 1380–1392, 2009.
[59] E. Rodríguez-Carmona, O. Cano-Garrido, M. Dragosits, M. Maurer, A. Mader, R. Kunert, D. Mattanovich, A. Villaverde, and F. Vázquez, “Recombinant Fab expression and secretion in Escherichia coli continuous culture at medium cell densities: Influence of temperature,” Process Biochemistry, vol. 47, no. 3, pp. 446–452, Mar. 2012.
78
[60] C. S. Shin, M. S. Hong, C. S. Bae, and J. Lee, “Enhanced production of human mini-proinsulin in fed-batch cultures at high cell density of Escherichia coli BL21(DE3)[pET-3aT2M2].,” Biotechnology Progress, vol. 13, no. 3, pp. 249–57, 1997.
[61] A. K. Patra, R. Mukhopadhyay, R. Mukhija, A. Krishnan, L. C. Garg, and a K. Panda, “Optimization of inclusion body solubilization and renaturation of recombinant human growth hormone from Escherichia coli.,” Protein Expression and Purification, vol. 18, no. 2, pp. 182–92, Mar. 2000.
[62] B. Bragdon, O. Moseychuk, S. Saldanha, D. King, J. Julian, and A. Nohe, “Bone morphogenetic proteins: a critical review.,” Cellular Signalling, vol. 23, no. 4, pp. 609–20, Apr. 2011.
[63] D. Chen, M. Zhao, and G. R. Mundy, “Bone morphogenetic proteins.,” Growth Factors, vol. 22, no. 4, pp. 233–41, Dec. 2004.
[64] C. Scheufler, W. Sebald, and M. Hu, “Crystal Structure of Human Bone Morphogenetic Ê Resolution Protein-2 at 2 . 7 A,” J. Mol. Biol., vol. 287, pp. 103–115, 1999.
[65] S. von Einem, E. Schwarz, and R. Rudolph, “A novel TWO-STEP renaturation procedure for efficient production of recombinant BMP-2.,” Protein Expression and Purification, vol. 73, no. 1, pp. 65–9, Sep. 2010.
[67] M. C. Anjou and A. J. Daugulis, “Mixed-feed exponential feeding for fed-batch culture of recombinant methylotrophic yeast,” Biotechnology Letters, pp. 341–346, 2000.
[68] C. Jungo, J. Schenk, M. Pasquier, I. W. Marison, and U. von Stockar, “A quantitative analysis of the benefits of mixed feeds of sorbitol and methanol for the production of recombinant avidin with Pichia pastoris,” Journal of Biotechnology, vol. 131, no. 1, pp. 57–66, Aug. 2007.
[69] C. Jungo, I. Marison, and U. von Stockar, “Mixed feeds of glycerol and methanol can improve the performance of Pichia pastoris cultures: A quantitative study based on concentration gradients in transient continuous cultures,” Journal of Biotechnology, vol. 128, no. 4, pp. 824–837, Mar. 2007.
[70] E. Bäcklund and M. Sc, “Impact of glucose uptake rate on recombinant protein production in Escherichia coli,” School of Biotechnology, 2011.
[71] G. Striedner, M. Cserjan-Puschmann, F. Pötschacher, K. Bayer, and F. Potschacher, “Tuning the transcription rate of recombinant protein in strong Escherichia coli expression systems through repressor titration.,” Biotechnology Progress, vol. 19, no. 5, pp. 1427–32, 2003.
79
[72] Z. Amribt, H. Niu, and P. Bogaerts, “Macroscopic modelling of overflow metabolism and model based optimization of hybridoma cell fed-batch cultures,” Biochemical Engineering Journal, vol. 70, pp. 196–209, Jan. 2013.
[73] B. Sonnleitner and O. Käpelli, “Growth of Saccharomyces cerevisiae Is Controlled by Its Limited Respiratory Capacity: Formulation and Verification of a Hypothesis,” in Biotechnology and Bioengineering, 1986, pp. 927–937.
[74] C. Herwig, I. Marison, and U. von Stockar, “On-line stoichiometry and identification of metabolic state under dynamic process conditions.,” Biotechnology and Bioengineering, vol. 75, no. 3, pp. 345–54, Nov. 2001.
[75] P. Wechselberger, P. Sagmeister, H. Engelking, T. Schmidt, J. Wenger, and C. Herwig, “Efficient feeding profile optimization for recombinant protein production using physiological information.,” Bioprocess and Biosystems Engineering, Jun. 2012.
[76] N. K. Khatri and F. Hoffmann, “Oxygen-limited control of methanol uptake for improved production of a single-chain antibody fragment with recombinant Pichia pastoris.,” Applied Microbiology and Biotechnology, vol. 72, no. 3, pp. 492–8, Oct. 2006.
[77] N. K. Khatri and F. Hoffmann, “Impact of methanol concentration on secreted protein production in oxygen-limited cultures of recombinant Pichia pastoris.,” Biotechnology and Bioengineering, vol. 93, no. 5, pp. 871–9, May 2006.
[78] K. Kiviharju, K. Salonen, U. Moilanen, and T. Eerikäinen, “Biomass measurement online: the performance of in situ measurements and software sensors.,” Journal of Industrial Microbiology & Biotechnology, vol. 35, no. 7, pp. 657–65, Jul. 2008.
[79] P. Sagmeister, M. Kment, P. Wechselberger, A. Meitz, T. Langemann, and C. Herwig, “Soft-sensor assisted dynamic investigation of mixed feed bioprocesses,” Process Biochemistry - currently in review, pp. 1–26, 2013.
[80] T. L. and C. H. Patrick Sagmeister, Patrick Wechselberger, Andrea Meitz, “Soft-Sensors for Bioprocess Monitoring and Control -manuscript in preparation,” unpublished, 2012.
[81] G. Liu, S. Yu, C. Mei, and Y. Ding, “A novel soft sensor model based on artificial neural network in the fermentation process,” African Journal of Biotechnology, vol. 10, no. 85, pp. 19780–19787, Dec. 2011.
[82] R. Luttmann, D. G. Bracewell, G. Cornelissen, K. V Gernaey, J. Glassey, V. C. Hass, C. Kaiser, C. Preusse, G. Striedner, and C.-F. Mandenius, “Soft sensors in bioprocessing: A status report and recommendations,” Biotechnology Journal, vol. 7, no. 8, pp. 1040–1048, Aug. 2012.
80
[83] FDA, “Guidance for Industry PAT — A Framework for Innovative Pharmaceutical,” no. September. 2004.
[84] H. Tye, “Application of statistical ‘design of experiments’ methods in drug discovery.,” Drug Discovery Today, vol. 9, no. 11, pp. 485–91, Jul. 2004.
[85] C.-F. Mandenius and A. Brundin, “Bioprocess Optimization using Design-of-Experiments Methodology,” Biotechnol. Prog., vol. 24, pp. 1191–1203, 2008.
[86] A. S. Rathore, R. Bhambure, and V. Ghare, “Process analytical technology (PAT) for biopharmaceutical products.,” Analytical and Bioanalytical Chemistry, vol. 398, no. 1, pp. 137–54, Sep. 2010.
[87] C. Herwig, “Prozess Analytische Technologie in der Biotechnologie,” Chemie Ingenieur Technik, vol. 82, no. 4, pp. 405–414, Apr. 2010.
[88] P. Sagmeister, C. Schimek, A. Meitz, C. Herwig, and O. Spadiut, “Design and multivariate investigation of an E . coli pBAD mixed feed fed-batch expression platform capable of tunable recombinant protein expression,” unpublished.
81
Appendix
82
Processed data
Fermentation N2 (DASGIP 11)
Figure 10 (A-D): Fermentation at 25 °C applying an exponential mixed-feed (L-arabinose and D-glucose) A) Gas inlet flow of air (blue) and oxygen (green) over process time.
B) off-gas measurement of CO2 (blue) and O2 (green). C) Signals record from the feed (blue) and base (green) balance. D) extracellular protein concentration (blue square),
rhBMP-2 concentration (green square) and offline biomass (red circle) biomass samples A – C.
83
Fermentation N4 (DASGIP 11)
Figure 11 (A-D): Fermentation at 25 °C applying an exponential mixed-feed (L-arabinose and D-glucose) A) Gas inlet flow of air (blue) and oxygen (green) over process time.
B) off-gas measurement of CO2 (blue) and O2 (green). C) Signals record from the feed (blue) and base (green) balance. D) extracellular protein concentration (blue square),
rhBMP-2 concentration (green square) and offline biomass (red circle) biomass samples A – D.
84
Fermentation N13 (DASGIP 11)
Figure 12 (A-D): Fermentation at 35 °C applying an exponential mixed-feed (L-arabinose and D-glucose) A) Gas inlet flow of air (blue) and oxygen (green) over process time.
B) off-gas measurement of CO2 (blue) and O2 (green). C) Signals record from the feed (blue) and base (green) balance. D) extracellular protein concentration (blue square),
rhBMP-2 concentration (green square) and offline biomass (red circle) biomass samples A –C. The black arrows denote that from this point the data are not included in the
data evaluation.
85
Fermentation N10 (DASGIP 14)
Figure 13 (A-D): Fermentation at 30 °C applying an exponential mixed-feed (L-arabinose and D-glucose) A) Gas inlet flow of air (blue) and oxygen (green) over process time.
B) off-gas measurement of CO2 (blue) and O2 (green). C) Signals record from the feed (blue) and base (green) balance. D) extracellular protein concentration (blue square),
rhBMP-2 concentration (green square) and offline biomass (red circle) biomass samples A –C.
86
Fermentation N14 (DASGIP 14)
Figure 14 (A-D): Fermentation at 25 °C applying an exponential mixed-feed (L-arabinose and D-glucose) A) Gas inlet flow of air (blue) and oxygen (green) over process time.
B) off-gas measurement of CO2 (blue) and O2 (green). C) Signals record from the feed (blue) and base (green) balance. D) extracellular protein concentration (blue square),
rhBMP-2 concentration (green square) and offline biomass (red circle) biomass samples A –B. The black arrows denote that from this point the data are not included in the
data evaluation.
87
Fermentation N7 (DASGIP 14)
Figure 15 (A-D): Fermentation at 35 °C applying an exponential mixed-feed (L-arabinose and D-glucose) A) Gas inlet flow of air (blue) and oxygen (green) over process time.
B) off-gas measurement of CO2 (blue) and O2 (green). C) Signals record from the feed (blue) and base (green) balance. D) extracellular protein concentration (blue square),
rhBMP-2 concentration (green square) and offline biomass (red circle) biomass samples A –C.
88
Fermentation N6 (DASGIP14)
Figure 16 (A-D): Fermentation at 35 °C applying an exponential mixed-feed (L-arabinose and D-glucose) A) Gas inlet flow of air (blue) and oxygen (green) over process time.
B) off-gas measurement of CO2 (blue) and O2 (green). C) Signals record from the feed (blue) and base (green) balance. D) extracellular protein concentration (blue square),
rhBMP-2 concentration (green square) and offline biomass (red circle) biomass samples A –B. The black arrows denote that from this point the data are not included in the
data evaluation.
89
Fermentation N12 (DASGIP 15)
Figure 17 (A-D): Fermentation at 30 °C applying an exponential mixed-feed (L-arabinose and D-glucose) A) Gas inlet flow of air (blue) and oxygen (green) over process time.
B) off-gas measurement of CO2 (blue) and O2 (green). C) Signals record from the feed (blue) and base (green) balance. D) extracellular protein concentration (blue square),
rhBMP-2 concentration (green square) and offline biomass (red circle) biomass samples A –C.
90
Fermentation N16 (DASGIP 15)
Figure 18 (A-D): Fermentation at 30 °C applying an exponential mixed-feed (L-arabinose and D-glucose) A) Gas inlet flow of air (blue) and oxygen (green) over process time.
B) off-gas measurement of CO2 (blue) and O2 (green). C) Signals record from the feed (blue) and base (green) balance. D) extracellular protein concentration (blue square),
rhBMP-2 concentration (green square) and offline biomass (red circle) biomass samples A –B. The black arrows denote that from this point the data are not included in the
data evaluation.
91
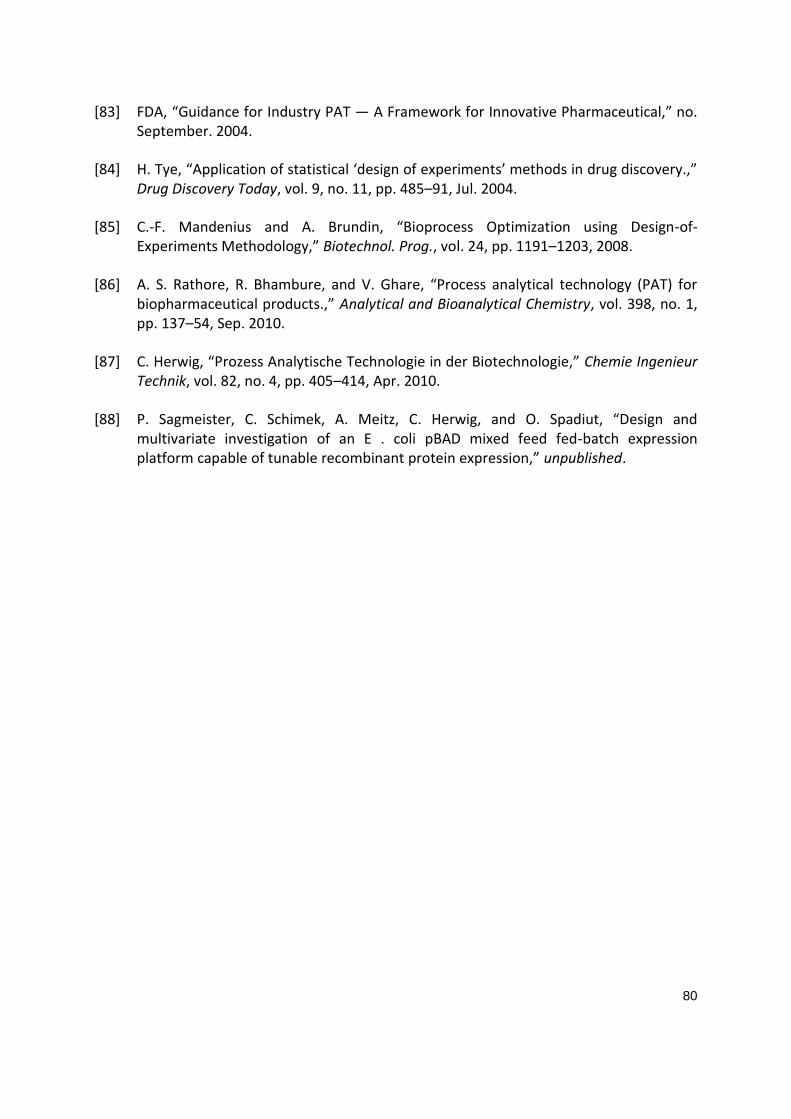
Fermentation N8 (DASGIP 15)
Figure 19 (A-D): Fermentation at 35 °C applying an exponential mixed-feed (L-arabinose and D-glucose) A) Gas inlet flow of air (blue) and oxygen (green) over process time.
B) off-gas measurement of CO2 (blue) and O2 (green). C) Signals record from the feed (blue) and base (green) balance. D) extracellular protein concentration (blue square),
rhBMP-2 concentration (green square) and offline biomass (red circle) biomass samples A –D.
92
Fermentation N15 (DASGIP 15)
Figure 20 (A-D): Fermentation at 30 °C applying an exponential mixed-feed (L-arabinose and D-glucose) A) Gas inlet flow of air (blue) and oxygen (green) over process time.
B) off-gas measurement of CO2 (blue) and O2 (green). C) Signals record from the feed (blue) and base (green) balance. D) extracellular protein concentration (blue square),
rhBMP-2 concentration (green square) and offline biomass (red circle) biomass samples A –C.
93
Fermentation N3 (DASGIP 16)
Figure 21 (A-D): Fermentation at 25 °C applying an exponential mixed-feed (L-arabinose and D-glucose) A) Gas inlet flow of air (blue) and oxygen (green) over process time.
B) off-gas measurement of CO2 (blue) and O2 (green). C) Signals record from the feed (blue) and base (green) balance. D) extracellular protein concentration (blue square),
rhBMP-2 concentration (green square) and offline biomass (red circle) biomass samples A –D.
94
Fermentation N17 (DASGIP 16)
Figure 22 (A-D): Fermentation at 30 °C applying an exponential mixed-feed (L-arabinose and D-glucose) A) Gas inlet flow of air (blue) and oxygen (green) over process time.
B) off-gas measurement of CO2 (blue) and O2 (green). C) Signals record from the feed (blue) and base (green) balance. D) extracellular protein concentration (blue square),
rhBMP-2 concentration (green square) and offline biomass (red circle) biomass samples A –D.
95
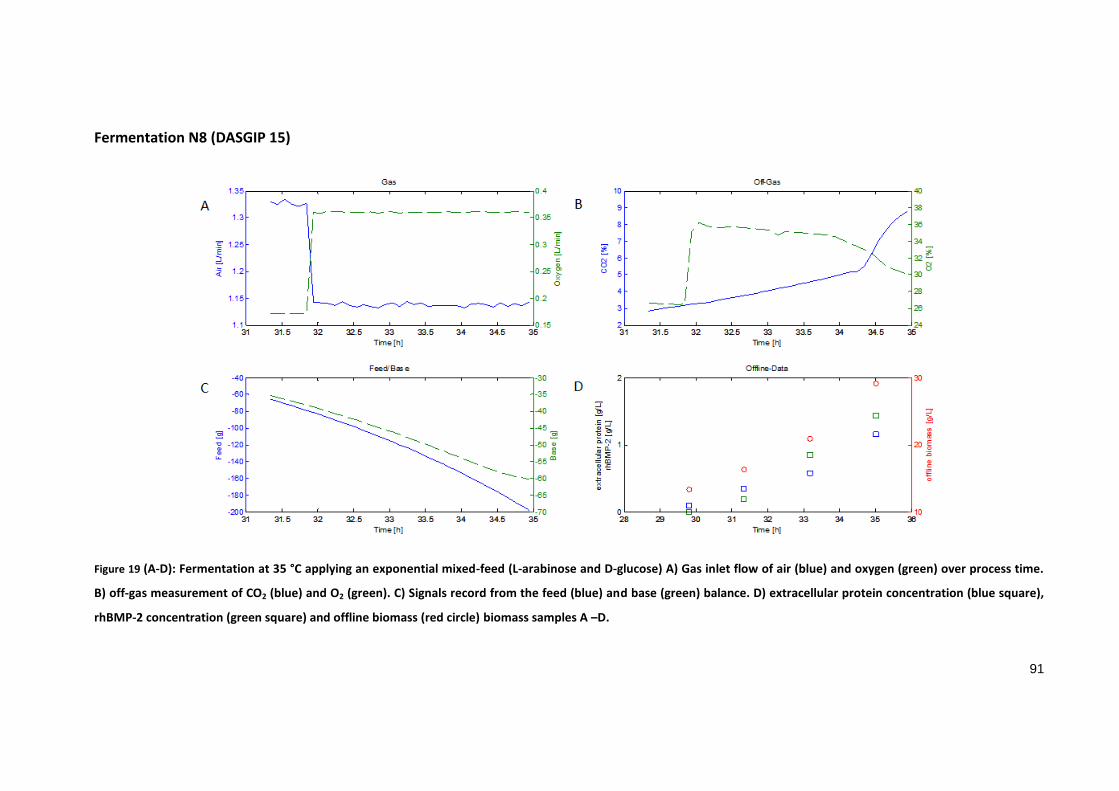
Fermentation N9 (DASGIP 16)
Figure 23 (A-D): Fermentation at 30 °C applying an exponential mixed-feed (L-arabinose and D-glucose) A) Gas inlet flow of air (blue) and oxygen (green) over process time.
B) off-gas measurement of CO2 (blue) and O2 (green). C) Signals record from the feed (blue) and base (green) balance. D) extracellular protein concentration (blue square),
rhBMP-2 concentration (green square) and offline biomass (red circle) biomass samples B –E.
96
Fermentation N11 (DASGIP 16)
Figure 24 (A-D): Fermentation at 30 °C applying an exponential mixed-feed (L-arabinose and D-glucose) A) Gas inlet flow of air (blue) and oxygen (green) over process time.
B) off-gas measurement of CO2 (blue) and O2 (green). C) Signals record from the feed (blue) and base (green) balance. D) extracellular protein concentration (blue square),
rhBMP-2 concentration (green square) and offline biomass (red circle) biomass samples B – E.
97
SDS-PAGE evaluation
Experiments N2; N4; N13 (DASGIP 11)
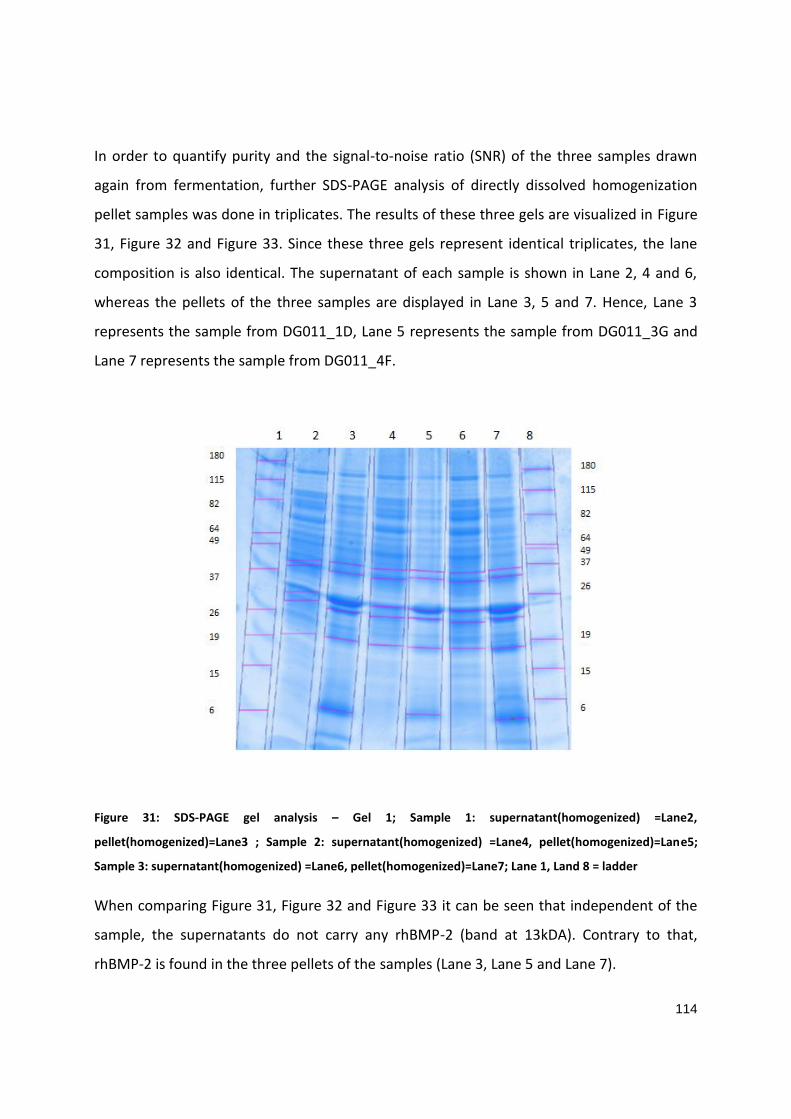
Figure 25 (SDS-PAGE gel analysis: all three gels represent identical triplicates, the lane composition is also identical): Lane 2 (N2 sample C at 25°C), 3 (N4 sample D at 25°C)
and Lane 4 (N13 sample C at 35°C) represent the homogenization pellet sample; Lane 5 (N2 sample C at 25°C), 6 (N4 sample D at 25°C) and 7 (N13 sample C at 35°C)
represent the fermentation supernatant (no soluble rhBMP-2 is detected ), Lane 1, Land 8 = ladder SeeBlue® Plus2 Pre-Stained Standard (4-250 kDa). RhBMP-2 band detect
at approximately ~ 14 kDa (depicts at lane 2,3 and 4 ).
98
Experiments N10; N14; N7; N6 (DASGIP 14)
Figure 26 (SDS-PAGE gel analysis: all three gels represent identical triplicates, the lane composition is also identical): Lane 2 (N10 sample C at 30°C), 3 (N14 sample B at
25°C), Lane 4 (N7 sample C at 35°C) and Lane 5 (N6 sample B at 35°C) represent the homogenization pellet sample; Lane 6 (N10 sample C at 30°C), 7 (N14 sample B at 25°C)
Lane 8 (N7 sample C at 35°C) and Lane 9 (N6 sample B at 35°C) represent the fermentation supernatant (no soluble rhBMP-2 is detected ), Lane 1, Land 10 = ladder
SeeBlue® Plus2 Pre-Stained Standard (4-250 kDa). RhBMP-2 band detect at approximately ~ 14 kDa (depicts at lane 2, 3, 4 and 5).
99
Experiments N12; N16; N8; N15 (DASGIP 15)
Figure 27 (SDS-PAGE gel analysis: all three gels represent identical triplicates, the lane composition is also identical): Lane 2 (N12 sample C at 30°C), 3 (N16 sample B at
30°C), Lane 4 (N8 sample D at 35°C) and Lane 5 (N15 sample C at 30°C) represent the homogenization pellet sample; Lane 6 (N12 sample C at 30°C), 7 (N16 sample B at 30°C)
Lane 8 (N8 sample D at 35°C) and Lane 9 (N15 sample C at 30°C) represent the fermentation supernatant (no soluble rhBMP-2 is detected ), Lane 1, Land 10 = ladder
SeeBlue® Plus2 Pre-Stained Standard (4-250 kDa). RhBMP-2 band detect at approximately ~ 14 kDa (depicts at lane 2, 3, 4 and 5).
100
Experiments N3; N17; N9; N11 (DASGIP 16)
Figure 28 (SDS-PAGE gel analysis: all three gels represent identical triplicates, the lane composition is also identical): Lane 2 (N3 sample D at 25°C), 3 (N17 sample D at
30°C), Lane 4 (N9 sample E at 30°C) and Lane 5 (N11 sample E at 30°C) represent the homogenization pellet sample; Lane 6 (N3 sample D at 25°C), 7 (N17 sample D at 30°C)
Lane 8 (N9 sample E at 30°C) and Lane 9 (N11 sample E at 30°C) represent the fermentation supernatant (soluble rhBMP-2 is detected approximately ~ 14 kDa (Lane 7,8 and
9)), Lane 1, Land 10 = ladder SeeBlue® Plus2 Pre-Stained Standard (4-250 kDa). RhBMP-2 band detect at approximately ~ 14 kDa (depicts at lane 2, 3, 4 and 5).
Analytic Report Production of human Bone Morphogenetic Protein-2
Upstream Design Space Development
Fermentation Analytics for rhBMP-2
Fermentation Processes
Principal Investigator & Head of Laboratory:
Prof. Dr. Christoph Herwig
Supervisor:
DI Patrick Sagmeister
Master Student:
Bakk. tech. Magdalena Kment
Faculty:
Institute of Chemical Engineering
Technical University of Vienna
Getreidemarkt 9
1060 Wien
Associated Departments:
RCPE – Research Center Pharmaceutical Engineering
Inffeldgasse 21a/II
A-8010 Graz
BIRD-C Biotech Innovation Research Development & Consulting
Erne-Seder-Gasse 4/ Stiege 2/ Lokal 3
1030 Vienna, Austria
Morphoplant GmbH
Universitätsstrasse 136
44799 Bochum
102
REPORT WP8 2/2013
project: A2.29
project title: QbD Ghosts for GF
duration:
project leader: Prof. Christoph Herwig
Dr. Stefan Leitgeb
key researcher: Prof. Christoph Herwig
researcher: Timo Langemann
Andrea Meitz
Patrick Sagmeister
project partners: BIRD-C GmbH & Co KG
Morphoplant GmbH
Name Date Signature
author: Magdalena Kment
reviewed by : Patrick Sagmeister
approved by:
distribution:
Reproduction and dissemination of this report only with permission of the management of the RCPE.
103
Abstract / Executive summary
Bioanalytical evaluation of fermentation products is an integral process of the production
and development of recombinant biopharmaceuticals. Furthermore, the characterization of
a biotechnological product by state-of-the-art analytical techniques is necessary to allow
relevant product specifications to be established. Herein, an analytical scheme for the
bioanalytical assessment of rhBMP-2 fermentation processes. RhBMP-2 is expressed under
the control of a L-arabinose specific pBAD-promoter using E.Coli C41 cells, is described. The
analytical methods encompass the assessment of extracellular and also intracellular
analytes.
Presence of extracellular protein indicates cell lysis. Extracellular total protein in the
fermentation supernatant was quantified using BCA (Bichionic Acid) following TCA
(Trichloracetic Acid) precipitation to remove interfering substances.
Quality and quantity of the intracellular inclusion body product, rhBMP-2, is analyzed after
homogenization and solubilization. Homogenized pellets are analyzed using Sodium Dodecyl
Sulphate Polyacrylamide Gel Electrophoresis (SDS-PAGE) to assess the purity of the product
in respect to host cell proteins. After solubilization of homogenized pellets, reverse-phase
high pressure liquid chromatography (RP-HPLC) is used for quantification of rhBMP-2. Both
methods, SDS-Page and RP-HPLC, are assessed for their reproducibility and the obtained
errors in measurement.
Objectives
Primary Objective
The primary objective of this evaluation is to establish an analytical scheme for
bioanalysis of rhBMP-2 fermentation processes.
Secondary Objectives
The following secondary objectives are envisaged:
o assessment of the reproducibility of analytical methods
o assessment of measurement errors of analytical methods
104
o assessment of the comparability/feasibility of RP-HPLC and SDS-Page for the
quantification/ quality assessment of rhBMP-2
Materials and Methods
Extracellular Analytes
Two times 2ml of the cell suspension (from the fermentation broth) were centrifuged (RZB
5171, 10min) and the cell-free supernatant (two times 1ml) frozen (-20°C) and stored for
further analytics.
Extracellular total protein quantification
TCA (Trichloroacetic acid) precipitation:
Media components were detected to interfere with BCA total protein quantification.
Hence, TCA precipitation was used to separate extracellular protein from the
fermentation supernatant from interfering substances before protein quantification.
Therefore, the cell-free supernatant (two times 0.5 ml) was mixed with 0.5 ml 10%
w/v TCA solution and incubated for 10 min on 4°C for precipitation. After
centrifugation (13000 g, 10 min, 4°C) the supernatant was discarded and the pellet of
precipitate was washed with 1 ml -20°C acetone. After a further centrifugation
(13000 g, 10 min, 4°C) the supernatant (containing acetone) was discarded and the
cap of the Eppendorf tubes was left open for a few minutes to allow evaporation of
remaining acetone.
Protein content quantification using the BCA protein assay (incl. sample
preparation):
The sodium salt of Bicinchoninic acid (BCA) in complex with copper ions (Cu1+) is able
to react with protein in an alkaline environment according to the principles of the
biuret reaction [see Smith PK et al, Anal Biochem, 1985]. The BCA method is more
reliable than the method proposed by Lowry [Andrew Wong et al.Application Note –
Industrial BioDevelopment Laboratory (www.ibdl.ca)] Before protein content was
105
measured in a 20 GENESYS SPECTROPHOTOMETER (Thermo Spectronic) at 562nm,
the samples and the necessary working reagent were prepared as follows:
Sample preparation and preparation of the working reagent:
The pellet of the protein precipitate was dissolved in an adequate volume (e.g. 1 ml)
of 0.1 M / 1% NaOH/SDS buffer overnight to allow full solubilization.
For the preparation of the working reagent, 50 parts of BCA reagent A (Bichionic Acid
Solution) and one part of BCA reagent B (Cooper II Solution) were mixed.
Calibration was done using 1 mg BSA/mL as standard (as diluent, the same buffer (0.1
M /1% NaOH/SDS buffer) as in the sample was used). The samples should show
concentrations in the calibration range.
Table 3: Calibration using BSA solution as standard
conc [µg/ml]
Standard [µl] Diluent [µL] (0.1 M / 1% NaOH/SDS
buffer)
50 10 190
100 20 180
200 40 160
400 80 120
600 120 80
BCA measurement:
The measurement was carried out by mixing 50 µl of protein sample with 1 ml BCA working
reagent. Afterwards, the mixture of protein sample and BCA working reagent was incubated.
For incubation, two different protocols were applied:
60 °C using the water bath for 15 minutes
37 °C using the water bath for 30 minutes
After incubation the absorbance of standards and prepared samples was measured at 562
nm using spectrophotometer.
106
Intracellular Analytes
2ml of the cell suspension (from the fermentation broth) were centrifuged (RZB 5171,
10min), washed once with distilled water and the pellets were stored at -20°C until further
analysis.
Homogenization for cell rupture
In order to disrupt cell membranes of fermented E. coli cells, samples were homogenized as
follows: Samples were re-suspended in 20ml of 50mM Tris buffer supplemented with 1mM
EDTA pH 8. Agglomerates of cells can hamper the function of the homogenizer. In case there
were agglomerates present in the sample, samples were pretreated with an Ultra-Turax®
(IKA® T10-basic) for 1 min. at level 6. The obtained slurry was pumped six times at 1500 bar


![LES AFFECTIONS DU REVÊTEMENT CUTANÉ DES PAUPIÈRES …I – Anatomie générale des paupières p.21 A ] ... Les tumeurs cutanées des paupières p.87 I - Classification p.89 A ]](https://static.documents.pub/doc/80x56/5f08e9367e708231d42451e3/les-affections-du-revtement-cutan-des-paupires-i-a-anatomie-gnrale-des.jpg)


