Round 9.0 Forecast Research and Special Projects Division March 17 , 2016 Round 9.0 Cooperative Forecast Results and Methods By Robert Ruiz, Research Manager and Pamela Zorich, Planner Coordinator
Transcript
Round 9.0 ForecastResearch and Special Projects Division
March 17, 2016
Round 9.0 Cooperative Forecast
Results and Methods
By Robert Ruiz, Research Manager and
Pamela Zorich, Planner Coordinator
Round 9.0 ForecastResearch and Special Projects Division
Round 9.0 ForecastResearch and Special Projects Division
March 17, 2016
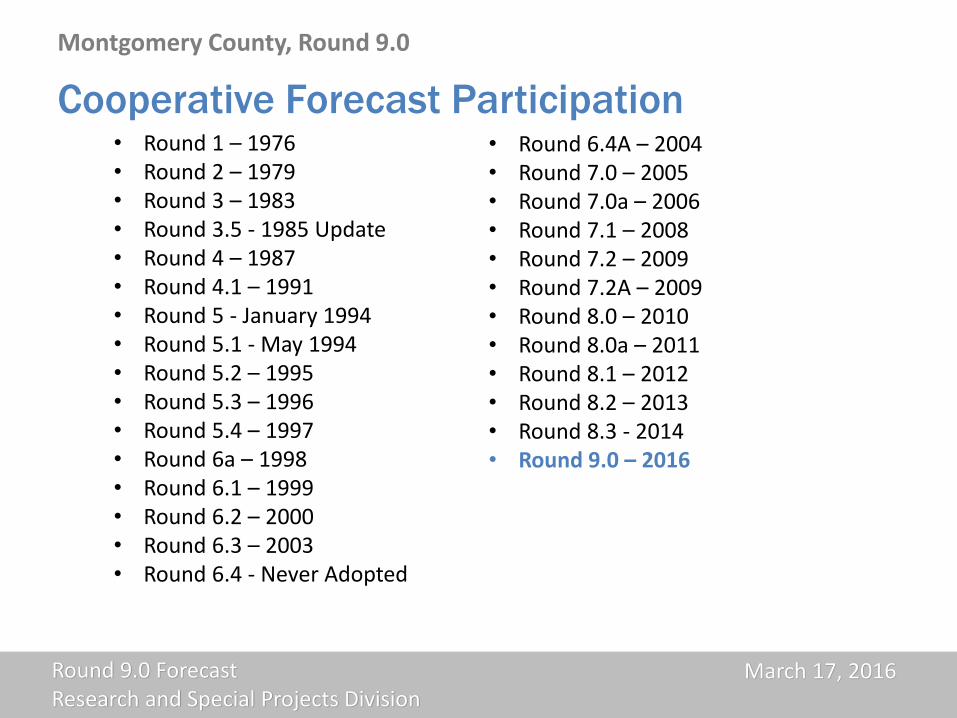
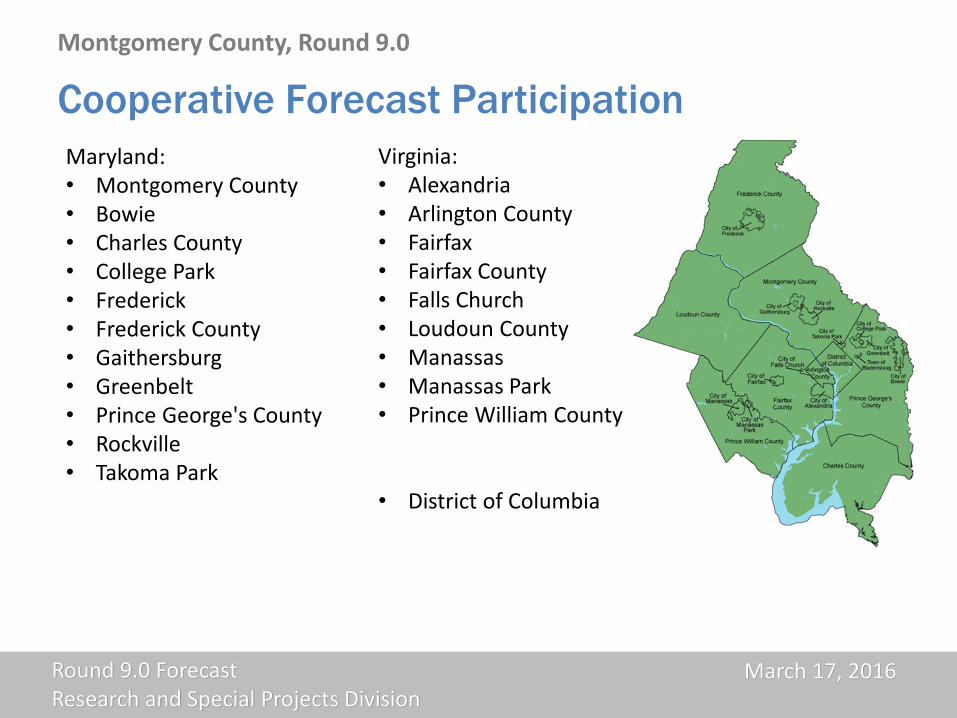
Montgomery County, Round 9.0
Maryland:• Montgomery County• Bowie• Charles County• College Park• Frederick• Frederick County• Gaithersburg• Greenbelt• Prince George's County• Rockville• Takoma Park
Cooperative Forecast Participation
Virginia:• Alexandria• Arlington County• Fairfax• Fairfax County• Falls Church• Loudoun County• Manassas• Manassas Park• Prince William County
• District of Columbia
Round 9.0 ForecastResearch and Special Projects Division
March 17, 2016
Montgomery County, Round 9.0
Cooperative Forecasting Process
Regional
Forecast
Jurisdictional
Small Area
(TAZ)
Reconciliation
Regional Econometric
Model Projections
• Employment
• Population
• Households
Local Forecasts
• Employment
• Population
• Households
Source: MWCOG, “ROUND 9.0 COOPERATIVE FORECASTS OF FUTURE GROWTH”, March 9, 2016.
Round 9.0 ForecastResearch and Special Projects Division
March 17, 2016
MONTGOMERY COUNTY
Population and Household
Cooperative Forecasts
Round 9.0
Round 9.0 ForecastResearch and Special Projects Division
March 17, 2016
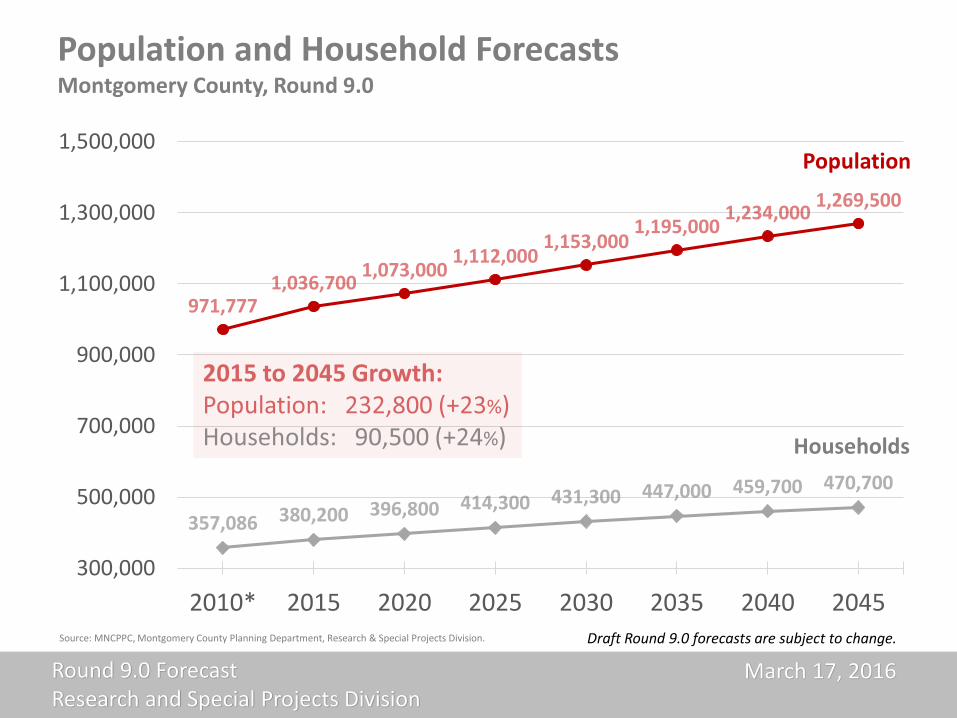
Population and Household ForecastsMontgomery County, Round 9.0
300,000
500,000
700,000
900,000
1,100,000
1,300,000
1,500,000
2010* 2015 2020 2025 2030 2035 2040 2045Source: MNCPPC, Montgomery County Planning Department, Research & Special Projects Division.
Population
Households
Draft Round 9.0 forecasts are subject to change.
Round 9.0 ForecastResearch and Special Projects Division
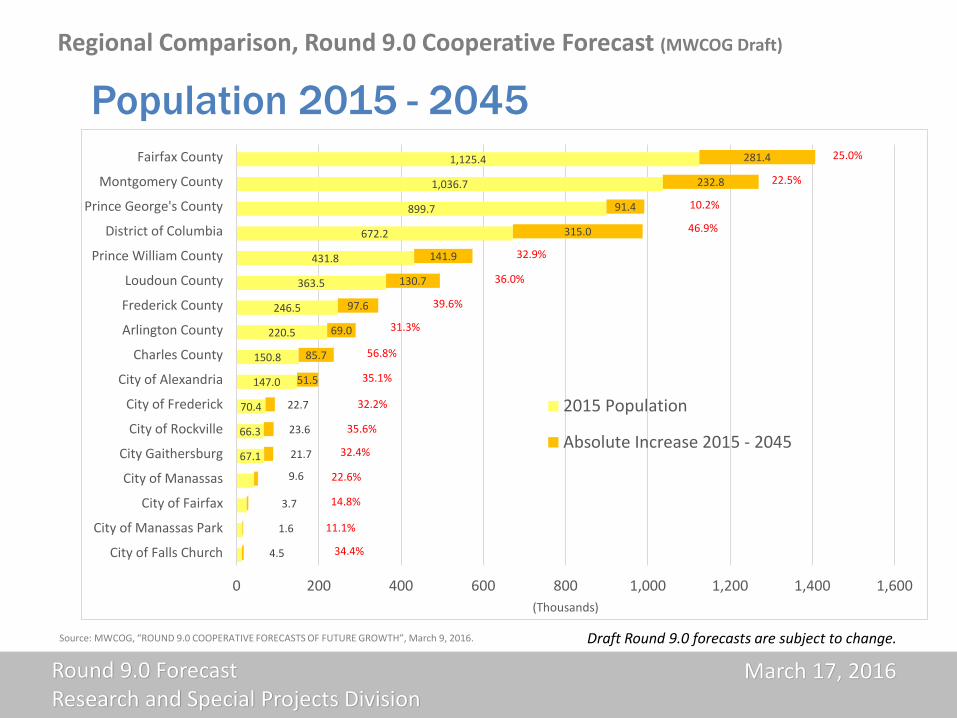
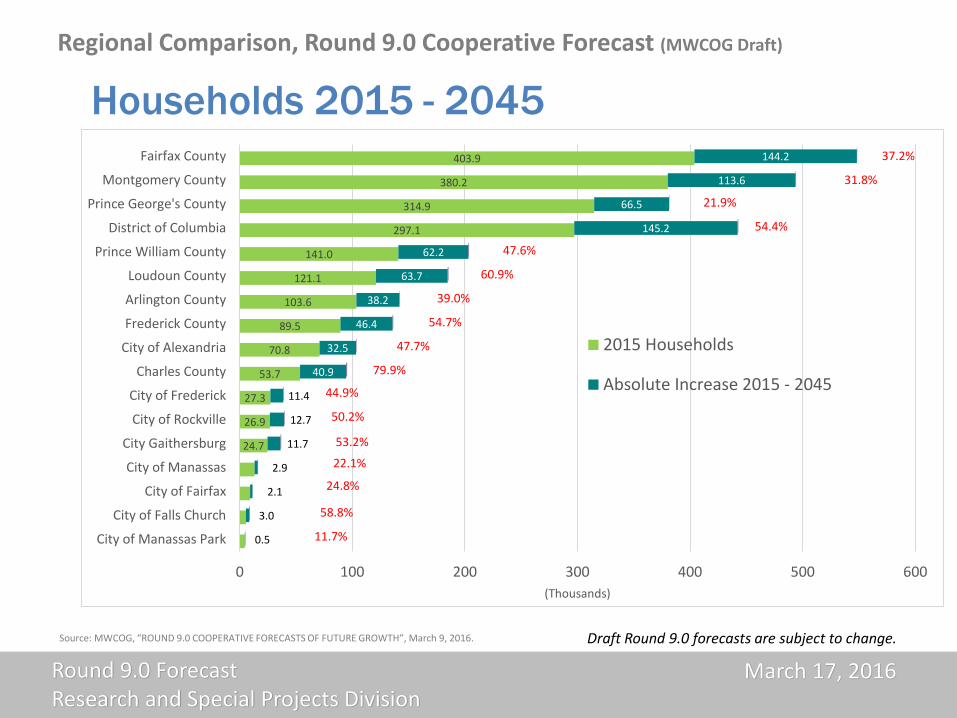
Source: MWCOG, “ROUND 9.0 COOPERATIVE FORECASTS OF FUTURE GROWTH”, March 9, 2016. Draft Round 9.0 forecasts are subject to change.
Round 9.0 ForecastResearch and Special Projects Division
March 17, 2016
Population Forecast Methodology
AGE COHORT-COMPONENT MODEL
County Cohort Component Model
Projections 2025-2030
Females
NUMBER FEMALES
AGE FEMALES SURV RATES AGE SURVIVORS MIGRATION POPULATION
INTERVALS (t) IN 2020 2020 INTERVALS (t) 2025 RATES 2025
0-4 34,333 2.35% 35,140
0-4 33,229 0.999089 5-9 33,199 -2.18% 32,474
5-9 32,262 0.999495 10-14 32,246 2.98% 33,207
10-14 34,537 0.998988 15-19 34,502 -6.87% 32,132
15-19 30,956 0.998128 20-24 30,898 -0.69% 30,686
20-24 30,260 0.997476 25-29 30,184 37.48% 41,497
25-29 38,478 0.996775 30-34 38,354 10.93% 42,545
30-34 37,784 0.995631 35-39 37,619 3.43% 38,908
35-39 38,137 0.993624 40-44 37,894 0.15% 37,950
40-44 36,708 0.989902 45-49 36,337 -0.05% 36,319
45-49 37,552 0.984393 50-54 36,966 -1.90% 36,262
50-54 37,749 0.977735 55-59 36,909 -4.00% 35,433
55-59 38,174 0.967934 60-64 36,950 -6.07% 34,706
60-64 34,634 0.951412 65-69 32,951 -5.25% 31,220
65-69 28,820 0.924681 70-74 26,650 -0.70% 26,463
70-74 23,119 0.881485 75-79 20,379 2.95% 20,980
75-79 15,949 0.809356 80-84 12,908 4.10% 13,438
80-84 10,593 0.690046 85+ 12,492 1.41% 12,668
85+ 12,336 0.420138
TOTALS 551,277 572,027
2020 to 2025
Add BIRTHS
Steps in Age Cohort-Component Model:
Age cohorts by sex
Apply survival rates
“Age” survivors by 5 years
Add births
Apply migration rates
Forecasts age by sex for next 5 years
Repeat for 5-year increments until 2045
Round 9.0 ForecastResearch and Special Projects Division
March 17, 2016
Source: 2000-2014 Population Estimates Program, U.S. Census
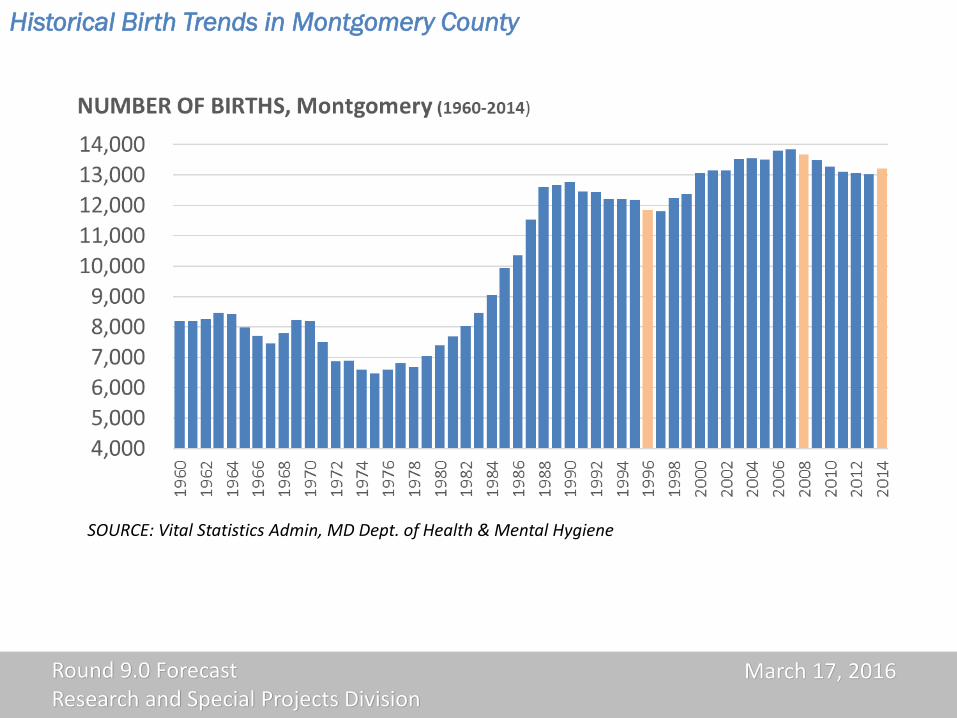
Natural Increase, Largest Component of Montgomery’s Population Growth
Round 9.0 ForecastResearch and Special Projects Division
March 17, 2016
SOURCE: Vital Statistics Admin, MD Dept. of Health & Mental Hygiene
Historical Birth Trends in Montgomery County
Round 9.0 ForecastResearch and Special Projects Division
March 17, 2016
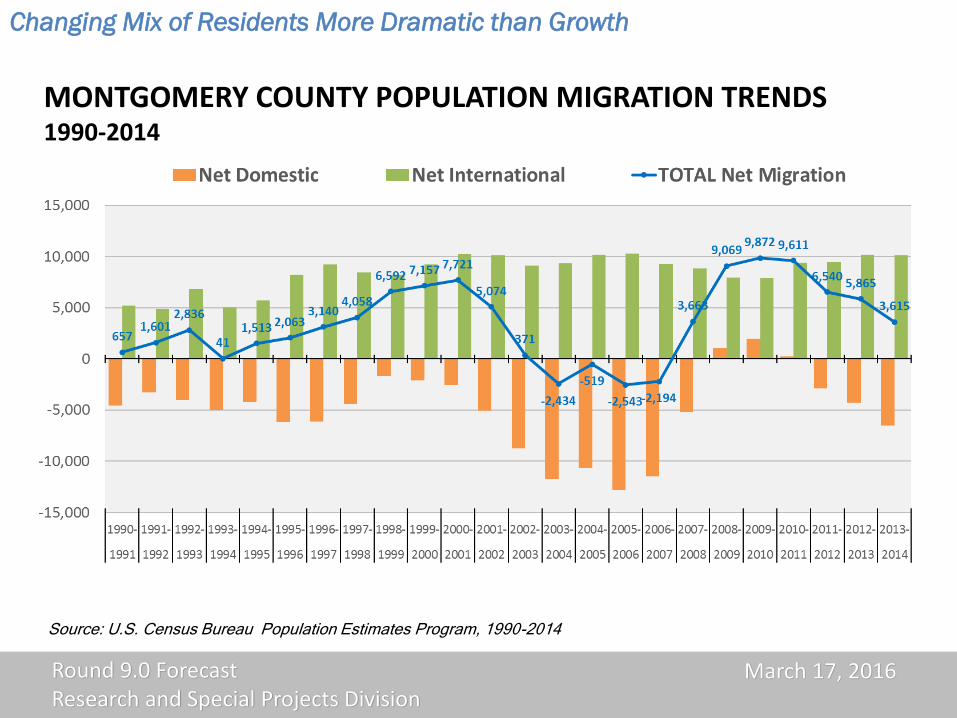
Changing Mix of Residents More Dramatic than Growth
MONTGOMERY COUNTY POPULATION MIGRATION TRENDS1990-2014
Source: U.S. Census Bureau Population Estimates Program, 1990-2014
Round 9.0 ForecastResearch and Special Projects Division
March 17, 2016
Montgomery: Magnet for Foreign Born
Source: 1980-2000 U.S. Census, 2010 & 2014 American Community Survey, 1 year estimate
12%
5%
8%6%
19%
7%
12%
9%
27%
10%
16%
11%
32%
14%
22%
13%
33%
15%
23%
13%
Montgomery County Maryland Washington Region United States
1980 1990 2000 2010 2014
Foreign born percent of population
342,900
Round 9.0 ForecastResearch and Special Projects Division
March 17, 2016
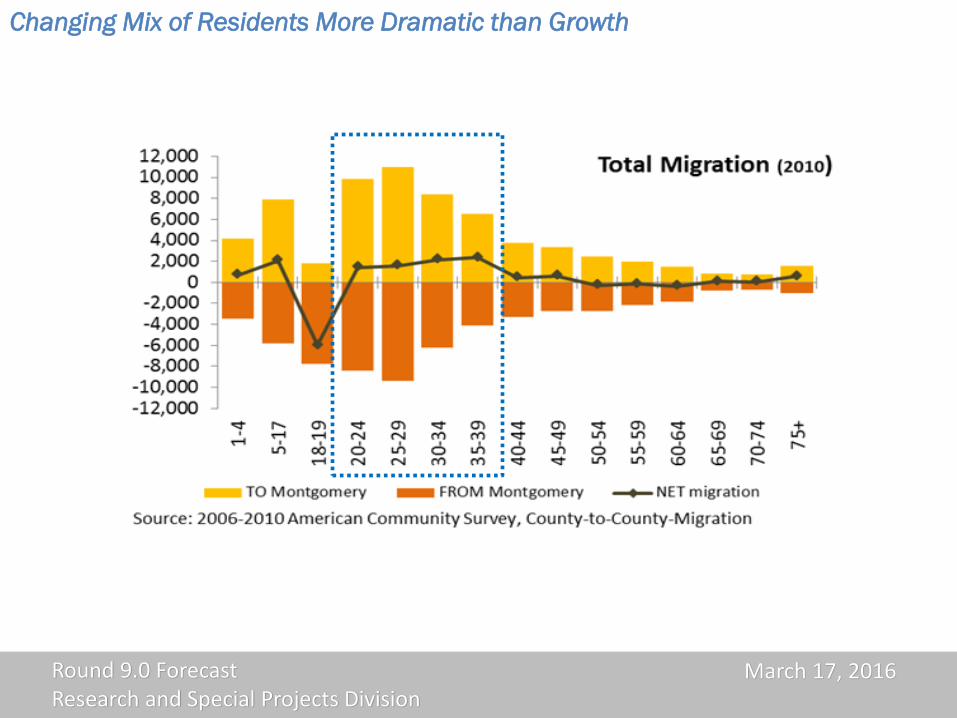
Changing Mix of Residents More Dramatic than Growth
Round 9.0 ForecastResearch and Special Projects Division
March 17, 2016
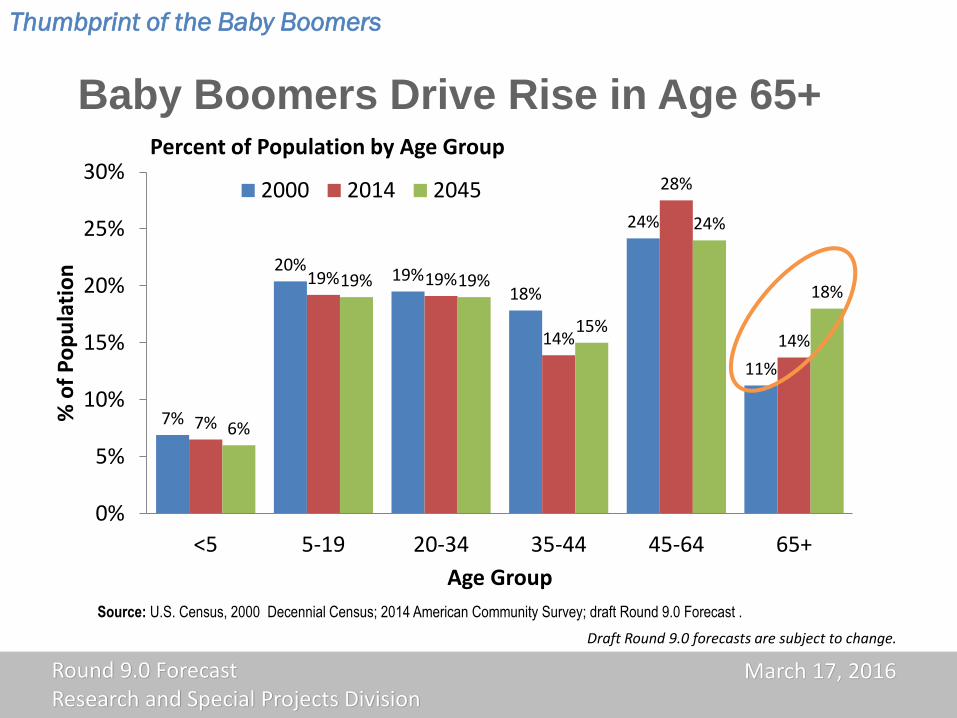
7%
20%19%
18%
24%
11%
7%
19% 19%
14%
28%
14%
6%
19% 19%
15%
24%
18%
0%
5%
10%
15%
20%
25%
30%
<5 5-19 20-34 35-44 45-64 65+
% o
f P
op
ula
tio
n
Age Group
2000 2014 2045
Percent of Population by Age Group
Source: U.S. Census, 2000 Decennial Census; 2014 American Community Survey; draft Round 9.0 Forecast .
Baby Boomers Drive Rise in Age 65+
Thumbprint of the Baby Boomers
Draft Round 9.0 forecasts are subject to change.
Round 9.0 ForecastResearch and Special Projects Division
March 17, 2016
Household Forecast Methodology
HEADSHIP RATES by HOUSEHOLDER AGE 2015-2045
Average Headship Rate
2005-2014
Age
Headship
rate
15 to 24 years 0.068
25 to 34 years 0.405
35 to 44 years 0.507
45 to 54 years 0.557
55 to 64 years 0.567
65 to 74 years 0.581
75 and over 0.644
Households:
Households are calculated by applying a “headship rate” to the household population by age. The “headship rate” is the percent of persons in an age group that are householders.
The household forecast uses average headship rates from 2005 to 2014 from the U.S. Census Bureau’s American Community Survey.
Round 9.0 ForecastResearch and Special Projects Division
March 17, 2016
Employment Forecast
Round 9.0 ForecastResearch and Special Projects Division
March 17, 2016
Employment Forecasts in Context, Montgomery County
A 2010 to 2045 gain of 188,000 jobs or 38% for Round 9.0
Round 9.0 ForecastResearch and Special Projects Division
March 17, 2016
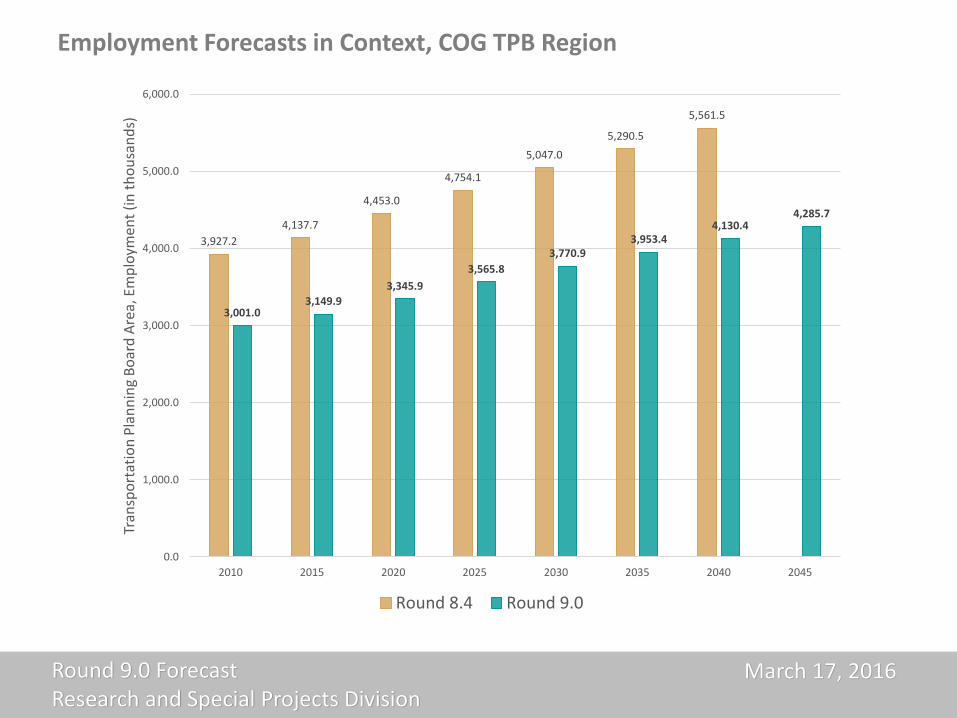
Employment Forecasts in Context, COG TPB Region
3,927.2
4,137.7
4,453.0
4,754.1
5,047.0
5,290.5
5,561.5
3,001.03,149.9
3,345.9
3,565.8
3,770.93,953.4
4,130.44,285.7
0.0
1,000.0
2,000.0
3,000.0
4,000.0
5,000.0
6,000.0
2010 2015 2020 2025 2030 2035 2040 2045
Tran
spo
rtat
ion
Pla
nn
ing
Bo
ard
Are
a, E
mp
loym
ent
(in
th
ou
san
ds)
Round 8.4 Round 9.0
Round 9.0 ForecastResearch and Special Projects Division
March 17, 2016
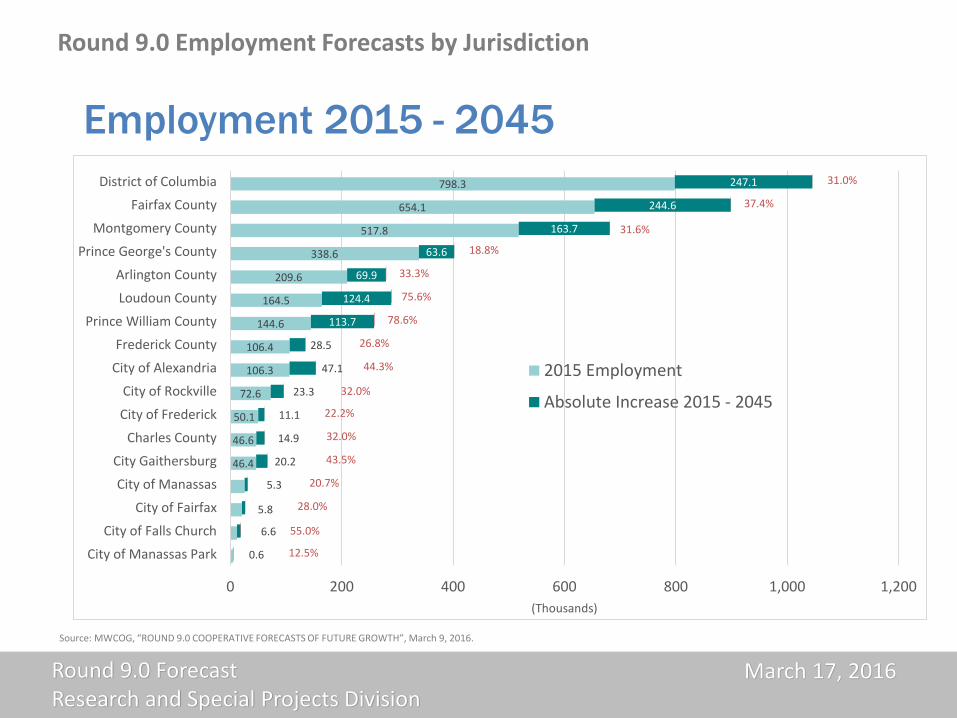
Round 9.0 Employment Forecasts by Jurisdiction
Source: MWCOG, “ROUND 9.0 COOPERATIVE FORECASTS OF FUTURE GROWTH”, March 9, 2016.
Employment 2015 - 2045
46.4
46.6
50.1
72.6
106.3
106.4
144.6
164.5
209.6
338.6
517.8
654.1
798.3
0.6
6.6
5.8
5.3
20.2
14.9
11.1
23.3
47.1
28.5
113.7
124.4
69.9
63.6
163.7
244.6
247.1
12.5%
55.0%
28.0%
20.7%
43.5%
32.0%
22.2%
32.0%
44.3%
26.8%
78.6%
75.6%
33.3%
18.8%
31.6%
37.4%
31.0%
0 200 400 600 800 1,000 1,200
City of Manassas Park
City of Falls Church
City of Fairfax
City of Manassas
City Gaithersburg
Charles County
City of Frederick
City of Rockville
City of Alexandria
Frederick County
Prince William County
Loudoun County
Arlington County
Prince George's County
Montgomery County
Fairfax County
District of Columbia
(Thousands)
2015 Employment
Absolute Increase 2015 - 2045
Round 9.0 ForecastResearch and Special Projects Division
March 17, 2016
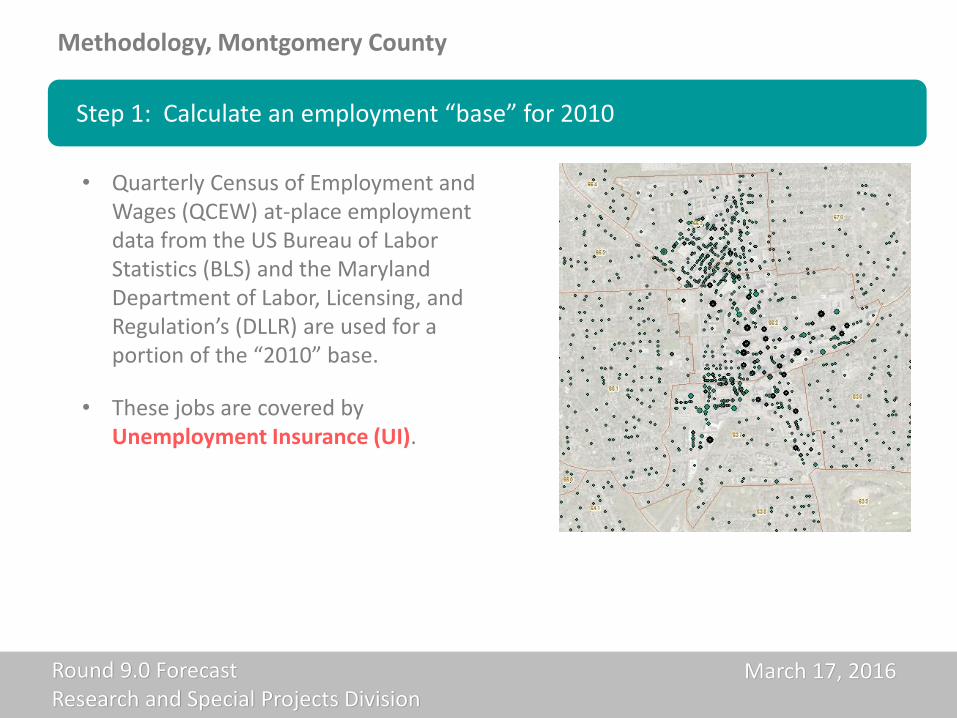
Methodology, Montgomery County
Step 1: Calculate an employment “base” for 2010
• Quarterly Census of Employment and Wages (QCEW) at-place employment data from the US Bureau of Labor Statistics (BLS) and the Maryland Department of Labor, Licensing, and Regulation’s (DLLR) are used for a portion of the “2010” base.
• These jobs are covered by Unemployment Insurance (UI).
Round 9.0 ForecastResearch and Special Projects Division
March 17, 2016
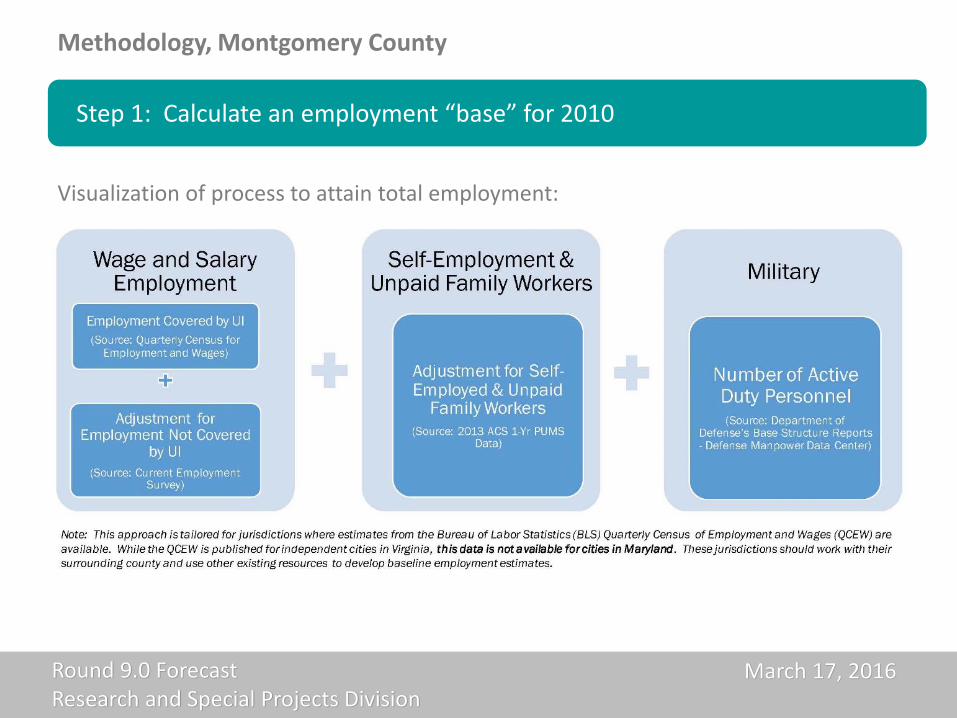
Methodology, Montgomery County
Visualization of process to attain total employment:
Step 1: Calculate an employment “base” for 2010
Round 9.0 ForecastResearch and Special Projects Division
March 17, 2016
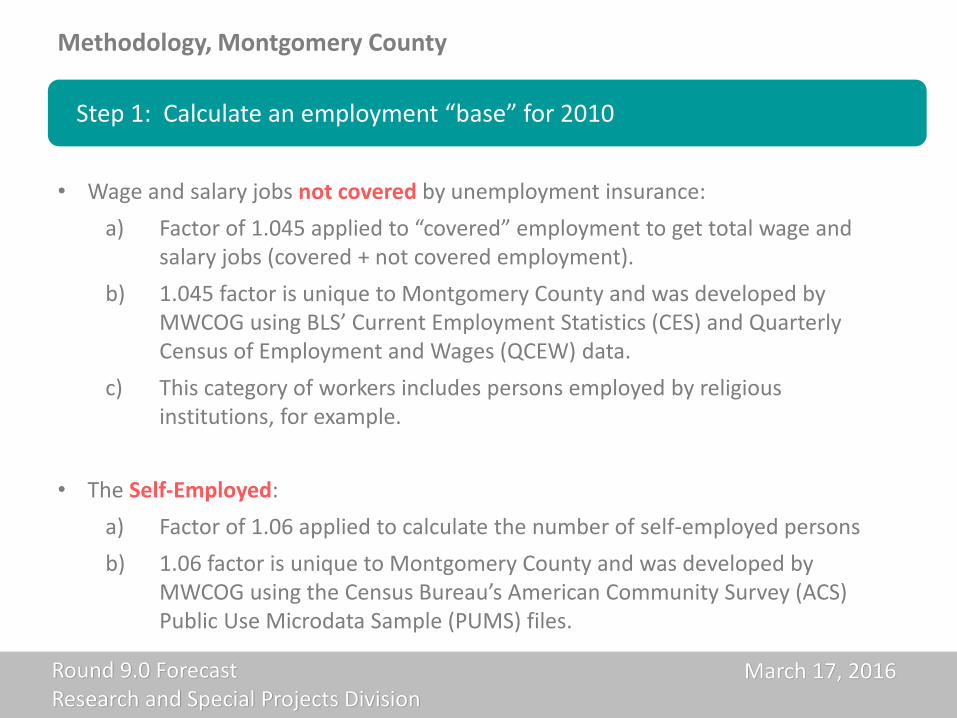
Methodology, Montgomery County
• Wage and salary jobs not covered by unemployment insurance:
a) Factor of 1.045 applied to “covered” employment to get total wage and salary jobs (covered + not covered employment).
b) 1.045 factor is unique to Montgomery County and was developed by MWCOG using BLS’ Current Employment Statistics (CES) and Quarterly Census of Employment and Wages (QCEW) data.
c) This category of workers includes persons employed by religious institutions, for example.
• The Self-Employed:
a) Factor of 1.06 applied to calculate the number of self-employed persons
b) 1.06 factor is unique to Montgomery County and was developed by MWCOG using the Census Bureau’s American Community Survey (ACS) Public Use Microdata Sample (PUMS) files.
Step 1: Calculate an employment “base” for 2010
Round 9.0 ForecastResearch and Special Projects Division
March 17, 2016
Methodology, Montgomery County
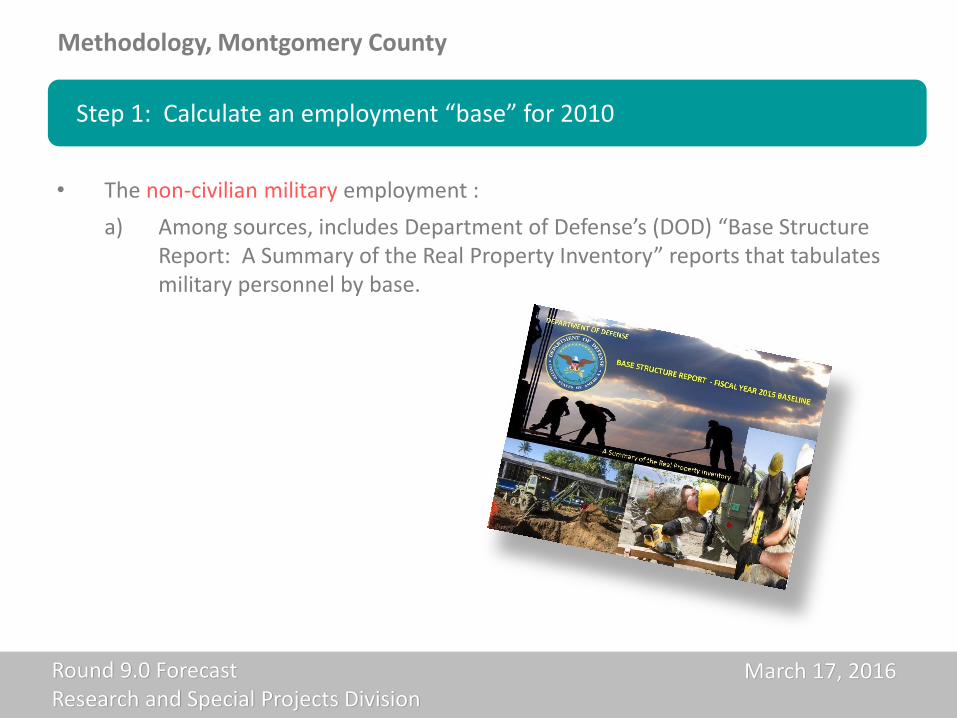
• The non-civilian military employment :
a) Among sources, includes Department of Defense’s (DOD) “Base Structure Report: A Summary of the Real Property Inventory” reports that tabulates military personnel by base.
Step 1: Calculate an employment “base” for 2010
Round 9.0 ForecastResearch and Special Projects Division
March 17, 2016
Methodology, Montgomery County
• The forecast of future wage and salary jobs covered by unemployment insurance (UI) is calculated using shift-share analysis
a) What is shift-share method:
i. The shift-share method assumes that a local employment industry’s growth is affected by its own local industry trends, as well as by that industry’s historical and expected regional or national dynamics.
ii. The shift-share method includes a “shift-term” that “account[s] for [the] differences between local and reference region growth rates that cause an industry’s employment to shift into or out of a region” (Klosterman, “Community Analysis and Planning Techniques”, 1990).
Step 2: Forecast Wage and Salary Jobs Covered by UI
Round 9.0 ForecastResearch and Special Projects Division
March 17, 2016
Methodology, Montgomery County
b) What assumptions and inputs were used in the shift-share analysis
i. Key assumption is that in the thirty-five year forecast horizon we will have cyclical booms and busts, but that none of these will be as exceptionally prolonged and as deep as the 2007 to 2009 recession.
ii. Inputs include employment estimates change by industry at the Montgomery County-level and Transportation Planning Board (TPB) regional-level from 1991 to 2000.
i. More recent employment data by industry that included the lead up to, and actual, 2007 to 2009 “great recession” were not used since this recession was assessed to be an anomaly.
ii. Inputs also include TPB regional industry forecasts from IHS Global Insight
Step 2: Forecast Wage and Salary Jobs Covered by UI
Round 9.0 ForecastResearch and Special Projects Division
March 17, 2016
Methodology, Montgomery County
Step 2: Forecast Wage and Salary Jobs Covered by UI
366,107
464,833
455,343
340,000
360,000
380,000
400,000
420,000
440,000
460,000
480,000
An
nu
al A
vera
ge W
age
and
Sal
ary
Emp
loym
ent
(UI C
ove
red
)
Payroll Employment (Yearly Avg.)
Recession,4Q2007 to 2Q2009,18 months
Recession,1Q2001 to 4Q2001,8 months
Recession,3Q1990 to 1Q1991,8 months
Wage and Salary Employment trends are improving:- Avg. Annual Job Growth ’91 to ’96: 4,325 jobs- Avg. Annual Job Growth ’09 to ‘14: 2,408 jobs
Historical growth:- Avg. Annual Job Growth ‘83 to ‘87: 22,600 jobs
Source: Maryland Department of Labor, Licensing & Regulation. Tabulated by MNCPPC, Montgomery County Planning Department, Research & Special Projects Division.
Round 9.0 ForecastResearch and Special Projects Division
March 17, 2016
Methodology, Montgomery County
c) Wage and salary jobs covered by unemployment outputs:
Step 2: Forecast Wage and Salary Jobs Covered by UI
Round 9.0 ForecastResearch and Special Projects Division
March 17, 2016
Methodology, Montgomery County
c) Wage and salary jobs covered by unemployment outputs:
Step 2: Forecast Wage and Salary Jobs Covered by UI
-43,796
-3,488
5,915
8,395
14,467
50,178
82,153
80,582
49,022
91,927
601,995
-100,000 100,000 300,000 500,000 700,000
Federal Government
Manufacturing
Transp., Trade, & Utilities
Financial Activities
Other Services
Leisure & Hospitality
Educational & Health Services
State & Local Government
Information
Construction, Natural Resources,…
Professional & Business Services
Employment Change by Sector 2015 – 2045,
COG / TPB Planning Area
Employment Change by Sector 2015 – 2045,
Montgomery County
-5,200
14,300
29,600
16,400
1,400
20,400
35,400
33,300
-10,000
400
61,000
-20,000 0 20,000 40,000 60,000
Federal Government
Manufacturing
Trade, Transportation, and…
Financial Activities
Other Services
Leisure & Hospitality
Educational & Health Services
State Government + Local…
Information
Natural Resources and Mining…
Professional and Bus. Services
Round 9.0 ForecastResearch and Special Projects Division
March 17, 2016
Methodology, Montgomery County
Visualization of process to attain total employment:
Step 3: Calculate Non UI, Self-Employed, and Military for Future Years
Round 9.0 ForecastResearch and Special Projects Division
March 17, 2016
Methodology, Montgomery County
Step 4: Reconciliation with MWCOG’s Econometric Model
Source: MWCOG Department of Community Planning & Services, “Round 8.3 Cooperative Forecasts: Process and Review” presentation, January 17, 2014.
Round 9.0 ForecastResearch and Special Projects Division
March 17, 2016
Methodology, Montgomery County
Step 4: Reconciliation with MWCOG’s Econometric Model
728,900
493,500
681,500
0
100,000
200,000
300,000
400,000
500,000
600,000
700,000
800,000
2,010 2,015 2,020 2025 2030 2035 2040 2045
At-
Pla
ce E
mp
loym
ent
Round 9.0 Draft Round 9.0
16.5% 16.5%16.0% 16.1%
16.4% 16.4% 16.4% 16.4%
10.0%
11.0%
12.0%
13.0%
14.0%
15.0%
16.0%
17.0%
18.0%
19.0%
20.0%
2010 2015 2020 2025 2030 2035 2040 2045
Shar
e o
f th
e M
WC
OG
Eco
no
met
ric
Mo
del
Draft and submitted forecast Montgomery County’s share of Econometric Model
Round 9.0 ForecastResearch and Special Projects Division
March 17, 2016
Allocation
Round 9.0 ForecastResearch and Special Projects Division
March 17, 2016
• Allocation of Households, Population, and Employment are done at the Transportation Analysis Zone (TAZ) level.
• Planning performs allocations for 321 TAZs
• Rockville and Gaithersburg perform their own allocations
Forecast Allocation of Households, Population, and Employment
Round 9.0 ForecastResearch and Special Projects Division
March 17, 2016
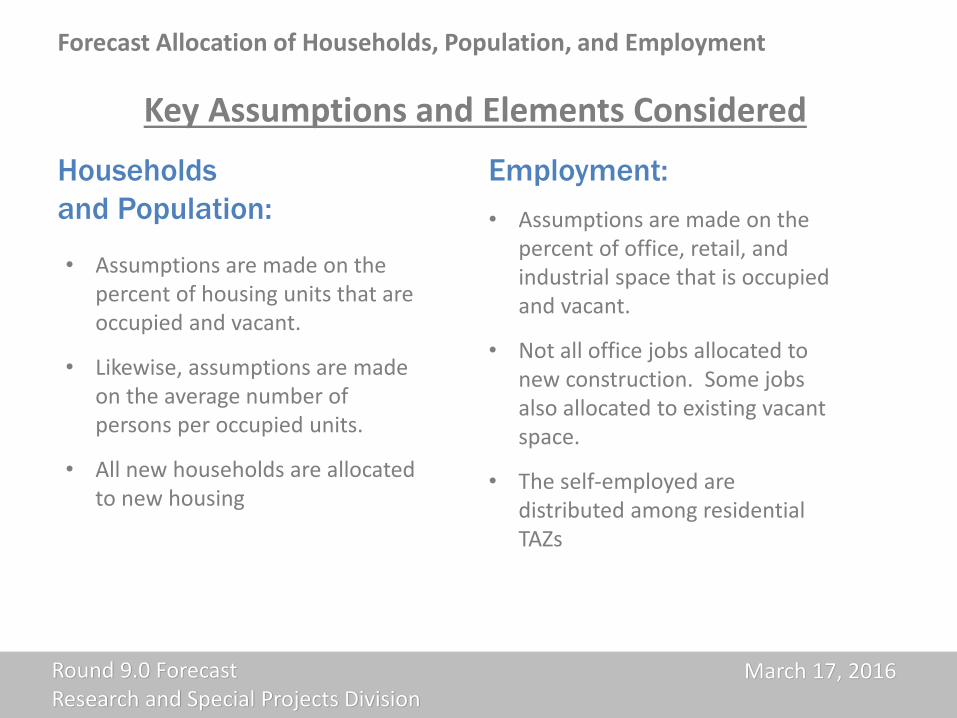
Key Assumptions and Elements Considered
Forecast Allocation of Households, Population, and Employment
Households
and Population:
Employment:
• Assumptions are made on the percent of housing units that are occupied and vacant.
• Likewise, assumptions are made on the average number of persons per occupied units.
• All new households are allocated to new housing
• Assumptions are made on the percent of office, retail, and industrial space that is occupied and vacant.
• Not all office jobs allocated to new construction. Some jobs also allocated to existing vacant space.
• The self-employed are distributed among residential TAZs
Round 9.0 ForecastResearch and Special Projects Division


![Untitled-1 [] · Title: Untitled-1 Created Date: 20110827203248Z](https://static.documents.pub/doc/80x56/5e5c37ba4f4d7a6137230a3c/untitled-1-title-untitled-1-created-date-20110827203248z.jpg)
![Untitled-5 [] · Title: Untitled-5 Created Date: 20010118111809Z](https://static.documents.pub/doc/80x56/5f88abbf1b028837b776432c/untitled-5-title-untitled-5-created-date-20010118111809z.jpg)
![Untitled-2 [] · Untitled-2 Author: Carsten Roggon Subject: Untitled-2 Keywords: Untitled-2 Created Date: 20110220145933 ...](https://static.documents.pub/doc/80x56/605a049a597af41a6973e7e0/untitled-2-untitled-2-author-carsten-roggon-subject-untitled-2-keywords-untitled-2.jpg)
![(UNTITLED) []...Title (UNTITLED) Subject (UNTITLED)](https://static.documents.pub/doc/80x56/5e75d9c1b01cbe739756294f/-untitled-title-untitled-subject-untitled.jpg)
![Untitled-8 []...Title: Untitled-8 Created Date: 20181121103711Z](https://static.documents.pub/doc/80x56/5f535b10acd546526243f6d6/-untitled-8-title-untitled-8-created-date-20181121103711z.jpg)
![Untitled-2 [] · Title: Untitled-2 Author: Stephen Created Date: 20171024133120Z](https://static.documents.pub/doc/80x56/6058a18f609ada773a727a4e/untitled-2-title-untitled-2-author-stephen-created-date-20171024133120z.jpg)


![Untitled-8 [interket.co.uk] · Title: Untitled-8 Created Date: 20190111130116Z](https://static.documents.pub/doc/80x56/5f535d8fe9ce7627b31125e1/untitled-8-title-untitled-8-created-date-20190111130116z.jpg)
![Untitled-1 [] · Untitled-1 Subject: Untitled-1 Keywords: Untitled-1 Created Date: 20110513150011 ...](https://static.documents.pub/doc/80x56/60436b02647e0d00c02c5ab3/untitled-1-untitled-1-subject-untitled-1-keywords-untitled-1-created-date.jpg)
![Untitled document [] · 2017. 6. 11. · Untitled document](https://static.documents.pub/doc/80x56/60b5fa1afeb575185d5dfee6/untitled-document-2017-6-11-untitled-document.jpg)
![Untitled Document []€¦ · Title: Untitled Document Created Date: 191000309095417](https://static.documents.pub/doc/80x56/600101983d1deb13132b1db7/untitled-document-title-untitled-document-created-date-191000309095417.jpg)
![(UNTITLED) [ ] · PDF fileTitle (UNTITLED) Subject (UNTITLED) Keywords](https://static.documents.pub/doc/80x56/5a7ca10e7f8b9ae9398d019f/untitled-untitled-subject-untitled-keywords.jpg)
![Untitled-5 [unstats.un.org]...Title Untitled-5 Created Date 20010118111809Z](https://static.documents.pub/doc/80x56/60389b95586a40652f159b99/-untitled-5-title-untitled-5-created-date-20010118111809z.jpg)
![Untitled-5 []Title Untitled-5 Created Date 20140415073242Z](https://static.documents.pub/doc/80x56/5ffd33023c19df0499476daa/-untitled-5-title-untitled-5-created-date-20140415073242z.jpg)
![Untitled-3 []Title: Untitled-3 Created Date: 20050330105657Z](https://static.documents.pub/doc/80x56/60347471aeac2f25265309a6/-untitled-3-title-untitled-3-created-date-20050330105657z.jpg)
![Untitled Document [] · Title: Untitled Document Created Date: 191050201155549](https://static.documents.pub/doc/80x56/5fb77709eb118919875133dc/untitled-document-title-untitled-document-created-date-191050201155549.jpg)