Unveiling Regional Preferences for Biological Diversity in Central Sulawesi: A Choice Experiment Approach Klaus Glenk, Jan Barkmann & Rainer Marggraf STORMA Discussion Paper Series Sub-program A on Social and Economic Dynamics in Rain Forest Margins No. 16 (February 2006) Research Project on Stability of Rain Forest Margins (STORMA) Funded by the Deutsche Forschungsgemeinschaft under SFB 552 Participating institutions: Institut Pertanian Bogor Universitas Tadulako University of Göttingen University of Kassel
Transcript
Unveiling Regional Preferences for Biological Diversity in
Central Sulawesi: A Choice Experiment Approach
Klaus Glenk, Jan Barkmann & Rainer Marggraf
STORMA Discussion Paper Series Sub-program A on
Social and Economic Dynamics in Rain Forest Margins
No. 16 (February 2006)
Research Project on Stability of Rain Forest Margins (STORMA)
Funded by the Deutsche Forschungsgemeinschaft under SFB 552
Participating institutions: Institut Pertanian Bogor
Universitas Tadulako University of Göttingen
University of Kassel
The Editorial Board
Prof. Dr. Michael Fremerey Institute of Socio-cultural and Socio-economic
Studies, University of Kassel, Germany Prof. Dr. Bunasor Sanim Faculty of Economics, Bogor Agricultural
University, Indonesia Dr. M.T. Felix Sitorus Department of Socio-Economic Sciences, Bogor
Agricultural University, Indonesia Prof. Dr. Manfred Zeller Institute of Agricultural Economics and Social
Sciences in the Tropics and Subtropics, University of Hohenheim, Germany
Managing Editors Dr. Siawuch Amini Institute of Socio-cultural and Socio-economic
Studies, University of Kassel, Germany Dr. Regina Birner Institute of Rural Development, University of
Göttingen, Germany Dr. Günter Burkard Institute of Socio-cultural and Socio-economic
Studies, University of Kassel, Germany Dr. Heiko Faust Department of Geography, Division of Cultural
and Social Geography, University of Göttingen, Germany
Dr. Teunis van Rheenen Institute of Rural Development, University of Göttingen, Germany
1
Summary:
Knowledge on preferences for ecosystem services at the rainforest margin can facilitate the
development of economically sound conservation strategies as claimed by the Convention on
Biological Diversity. Applying an ecosystem service approach, a choice experiment was
employed in Central Sulawesi/Indonesia around the Lore Lindu National Park to elicitate
values for rattan availability, water supply for irrigation, population size of anoa as well as
types of cocoa cultivation along a shade tree gradient. While on average a willingness to
contribute to the maintenance of the resource base was found for the first three attributes,
respondents had preferences for more intensive ways of cocoa cultivation. Interactions with
socio-demographic variables help to obtain a more distinct view on the choice behaviour of
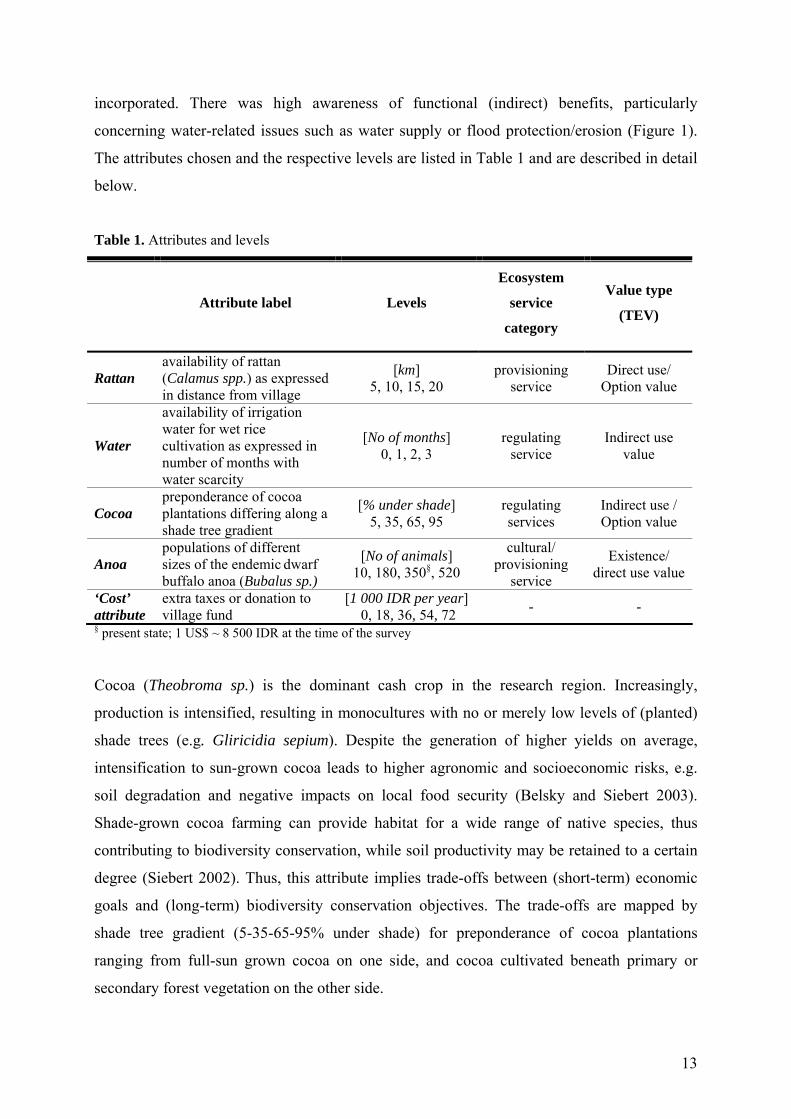
(2004) showed that perceptional data on irrigation water fits quite well to the related
measured precipitation. Thus, an attribute was created relating effects of land conversion on
slopes to the provision of irrigation water. The levels were described as the perceived months
with water shortage for irrigation purposes8.
Rattan (Calamus spp.) is the most important marketed forest product and serves as a
secondary income source for locals, particularly at the poorer margin of the population
(Maertens 2004, Schwarze 2004). If harvests fail, e.g., as a cause of natural disasters
(droughts, flooding), rattan can serve an additional income alternative, and thus has an
‘option’ or insurance value component. In accordance with results from our pre-study
investigations, previous research of Zeller and Birner (2003) showed that the encounter
distance from the forest edge to harvesting locations increased from 4.4 km on average in
1990 to 14.5 km in 2001, indicating an overuse of rattan resources. Rattan supplies are in
decline, while market demand remains strong. This suggests that rattan resources will become
increasingly scarce, particularly affecting large-diameter canes (Siebert 2001). The rattan
attribute was operationalized by the encounter distance to the nearest extracting location (5,
10, 15, 20 km).
An important issue for the biodiversity debate is the loss of species. The Sulawesi region is an
important centre for species endemism, and the Lore Lindu National Park harbours many of
Sulawesi’s endemic mammals and birds (Waltert et al. 2004, Whitten et al. 1987). Thus,
conservation of the park’s species is in line with global conservation objectives. However,
large forest clearings inside the National Park show that the forest frontier in the research
region is by no means secured (Weber 2005). To find out how conservation objectives are
supported by the local population around the National Park, different population sizes of the
dwarf-buffalo anoa (Bupalus depressicornis, B. quarlesi) were included as an attribute
exemplarily for an endemic species. Population sizes in the research region are in decline
(Zeller and Birner 2003, Burton et al. 2005). Burton et al. (2005) identified the Lore Lindu
National Park as one of the areas on which to focus conservation efforts of this animal.
15
Individual interviews showed that anoa was a widely known forest species. As a result of
discussions with locals and experts, the present state was estimated as 350 individuals living
in the forests of the Lore Lindu region. Anoa populations provide a mixture of different TEV
value categories. One is ‘existence’ value, e.g. the “… concern to protect […] although he or
she has never seen one and is never likely to …” (Pearce and Moran 1994: 12). However,
interactions between the living environment and the population are common, implying that
other value components such as direct use value (e.g. hunting) or existence value (e.g.
intergenerational aspects) have to be considered as well. The latter ones might even be of
greater importance (see Burton et al. 2005). It was found in pre-tests and numerous
conversations with the locals that the relationship towards anoa is ambiguous: although most
people value anoa for the different reasons listed above, many also perceive anoa as a
ferocious and wild animal, and thus as a threat if encountered9. If the latter aspect dominates
the attitude of individuals, it may also happen that those may prefer smaller over larger
populations.
A negative sign of the utility coefficient was expected for ‘water’, ‘rattan’ and ‘cocoa’. A
positive one for ‘anoa’, assuming that value aspects are more important on average.10
The ‘cost’ attribute was split-sampled as (i) a rise in “house- and land” tax (Pajak Bumi
Bangunan (PBB)) or a donation to a village fund (Iuran dana pembangunan desa) affecting
every household of the research region as well as (ii) a monthly or yearly payment scheme11.
According to Whittington (1998), the highest price should be rejected by 90 % - 95 % of the
respondents in CVM studies. The levels were derived following this rule of thumb by using
different ‘prices’ in pre-tests additional to information obtained by a payment-ladder approach
for the subjectively ‘best’ option (e.g. Bateman et al. 2002). The income distribution in the
study region is highly skewed: Some people live in concrete houses, have satellite television
and sometimes even own a car. Others share a wooden hut without electricity. Some of the
first group didn’t hesitate to express a willingness to pay exceeding double the highest amount
finally offered in the choice experiment (12.000 IDR per month, about 1,4 US$), whereas
some members of the second group were virtually struck by the same amount. Offering the
highest price to the poor could embarrass them, and could make “... the interviewers look
insensitive and/or uninformed” (Whittington 1998:8). Hence, the range of ‘price’ levels was
cut at the high end, accepting an underestimation of WTP and other welfare-theoretic
measures by ignoring the higher WTP of a low percentage of rather well-situated people. As
16
no specific or unique time period could be defined to achieve a proposed improvement (and
time-preferences respectively interest rates for continuous payment are unknown), WTP
values are calculated on a one years’ basis.
It is suggesting to use monetary ‘cost’ terms, as it is the ‘universal’ medium for exchange.
However, it might be useful in so-called developing countries and semi-subsistence
economies to employ other forms of payment. Shyamsundar and Kramer (1996), for example,
use rice quantities in a case study on Madagascar, Mekonen (2000) offers payment in cash or
kind for management of community woodland in rural Ethiopia, both using CV methods.
Although rice is a staple food in the study region, it does not seem appropriate to use it for the
‘cost’ attribute. People may value a specific quantity of rice differently due to the following
reasons: (i) varying breeds of rice are planted and sold with differing prices. (ii) There is a
disparity between people owning rice fields and others, who do not own but work on rice
fields as seasonal farm hands and finally those, who are not engaged in rice cultivation at all.
This – in addition to fluctuating market prices - would result in a wide range of uncertainties
for an ex post translation of rice quantities into monetary units. Another alternative payment
method especially addressing the poorer parts of the population could be ‘wage labour’
(compare to Adamowicz et al. 1997a). However, it seems to be (i) morally questionable to ‘let
the poor work’, and (ii) hard to find a specific and appropriate purpose for the work.
Exploratory studies have shown that all people are familiar with monetary issues, though
some were hardly able to pay some of the offered amounts. Therefore, following Whittington
(1998), the use and interpretation of stated preference values will be bounded by respondents’
ability to pay and by their willingness to pay. Before making their choices, respondents were
reminded emphatically of their budget constraints in order to reduce bias resulting from
strategic behaviour or interviewer compliance.
Bias may also arise from the order in which the attributes appear on the choice cards. In order
to minimize such effects, a second version of choice sets has been created with an inverting
order of the attributes. The two versions were randomly assigned to respondents in a way that
approximately each half of the respondents received one of the versions.
All attributes entered the analysis as continuous attributes ‘anoa’, ‘water’, ‘cocoa’ and ‘rattan’
using actual values. It is assumed that attribute levels reflect an individual’s utility in a linear
fashion. For the amount of shade in cocoa, a quadratic utility surface was included in the
17
analysis because an (inverted) unimodal preference curve appeared likely (i.e. we assumed a
threshold for intensification).
5.2 Framing
“The questionaire must strive to establish the frame in respondents’ minds which is
appropriate to the circumstances of the [...] decision being made” (Bennett 1999: 9). This step
is called ‘framing’. An appropriate context must be developed, in which the hypothetical
scenarios are presented to the respondent. If the context is misleading or not credible, there is
little incentive for respondents to take the choice task seriously. At the beginning of the
questionaire, respondents were sensitized to potential changes in the future by letting them
recall past changes in the fields of agriculture, infrastructure and living conditions. Thereafter,
they were supposed to choose those 3 out of 6 competing development issues, which they
thought should have priority for spending public money. Besides contributing to establish “a
frame of reference for respondents”, this question also served as a “‘warm-up’ exercise” for
the choice task (Bennett & Adamowicz 2001: 52).
In the study, the 5 attributes were defined as results a government development program on a
village scale. Multi-level development programs that address many different aspects are not
unfamiliar to the locals. One example is the CSIADP (Central Sulawesi Integrated Area and
Development Program, ANZDEC 1997). Intentions to link such a program to an actual policy
process taking place in the Lore Lindu region in order to enhance credibility were abandoned.
Rather than concentrating on impacts of attribute changes on their life, respondents tended to
exhaustively discuss issues of e.g. property rights, or the management of the National Park
area in pre-tests. Hence, it was not the question whether people took the informational context
and therefore the choice task seriously. Instead, it was a problem that people took it too
serious. Under such circumstances, choices could be increasingly biased by strategic
behaviour (e.g. with respect to property rights) or be perceived as some kind of ‘referendum’
about policy measures described. A referendum-type frame can be desirable in a different
context. In our case, however, we primarily focus on preferences for ecosystem services. In
order to minimize strategic behaviour and accentuate neutrality, the program was not
specified in detail. Respondents were repeatedly reminded that this research is not part of any
NGO or governmental activity, and that there are no pre-defined interests regarding the future
of the National Park and its surroundings. Further, people were sensitized to changes that
18
occurred in the past and the desired direction of changes for the future by several questions
addressing these issues prior to the choice experiment.
Presented orally only, the provision of the information regarding the attributes caused some
fatigue and confusion among the respondents, indicating a high cognitive demand. The
education of 53 % of the respondents did not transcend elementary school, indicating a rather
low level of literacy. Jae and Delvecchio (2004) found that the presence of a visual decision
aid can improve choice by reducing task complexity and facilitating the mediation of
information for low-literacy consumers. Thus, pictures containing the main information were
painted in discussion with the local farmers in order to meet their perception. Painting was
preferred to photographs as people’s interest in the latter mainly consisted of the specific
location shown on the picture, and in what differed from the conditions in their village. The
paintings allowed for a more generalized visualization of the issues (attributes) in which
village-specific details are less important. The pictures were collected in a picture book12. The
pictures and their respective informational background were simultaneously presented to the
respondent during the explanation of the attributes. Visualizations were also included in the
choice cards (see appendix 1).
Often, the first language of the respondents was not Indonesian (Bahasa Indonesia), but their
local language. Every ethnicity again has its own language. Additionally, English is a
secondary language for both the first author and his assistant. Furthermore, there are
differences in the urban and rural use of Bahasa Indonesia. Understandably, special attention
had to be paid on the wording during several pre-tests to avoid misunderstandings. For final
refinement of the questionaire, a pilot study was conducted (n = 96).
5.3 Experimental design and status quo
Out of the 45 possible combinations of attribute levels, an orthogonal fraction of 16 was
selected by means of experimental design techniques (Louviere et al. 2001) and combined
into choice scenarios that consisted of two (generic) alternatives A and B and a status-quo
option presented on choice cards. The computed design was further improved following the
design principles mentioned by Huber and Zwerina (1996), particularly with respect to level
balance and minimal overlap. The sets of the main-effects experimental design were blocked
into 4 versions, so that each respondent faced 4 choices.
19
Inclusion of a status quo option allows for economic welfare measures (e.g. Louviere et al.
2001). The status quo (‘do-nothing’) option is the reference point from which the scenarios
the researcher offers to the respondents diverge (Bennett 1999). “Selection of a base may have
an important influence on CM results by affecting the utility of the base option relative to
others, and by influencing the framing of outcomes, for example, as gains or losses” (Blamey
et al. 1997: 14). The status-quo was described as the present situation, because future attribute
level changes could not easily be predicted and may differ in discrete villages. Particularly
due to the heterogeneity concerning the environmental and socio-economic conditions of the
villages, it would have been plainly unrealistic to define one common base for all villages.
Therefore, the respondents were directly asked which attribute level was most similar to their
perception of the present situation (cocoa, water, rattan)13. By this means, respondents created
their ‘individual’ status-quo or “…’self-explicated’ alternative” (Bennet and Blamey 2001:
138). This approach is consistent with choice theory (Louviere et al. 2001). It is expected that
such an approach improves the predictive properties of the model for the following reasons.
(i) It addresses local heterogeneity better than a ‘constant base reference’. (ii) Prior to the
choice task, the respondents had to intensively engage themselves with the present state
regarding the attributes. As a result, respondents are expected to be more certain about their
choices. (iii) Involving respondents in the preparation for the choice experiment could
suspend some ‘disbelief’ about the choice task and the survey. However, there might be some
implications for welfare analysis if actual and perceived values diverge (Adamowicz et al.
1997b). A typical choice set is shown in appendix 1.
5.4 Data Collection
In order to maximise the benefits of data exchange with other projects in STORMA and to
enable aggregation of the (perceived) values for ecosystem services by a sampled population
on a regional level in congruency with the STORMA research region, the common sampling
frame of STORMA was adopted (for details, see Zeller et al. 2002). The choice experiment
survey was administered to 301 randomly selected households in 12 villages of the research
region. In-person interviews were conducted by 6 well-trained and graduated (B.Sc.
UNTAD/Palu) local enumerators. To minimize potential interviewer effects, enumerators
were randomly assigned to the households.
20
Additional data was collected including data related to the choice task (e.g. difficulty,
confusion), background data concerning the attributes (e.g. past experience, present use) as
well as several socio-economic characteristics (e.g. age, education, wealth status). The socio-
demographic variables listed in table 2 are used in the succeeding analysis. Additionally,
attitude items on value, risk and coping issues were included (for analysis see Barkmann et al.
subm. a/b)
Table 2. Socio-demographic Variables
Variable Description Mean Interaction
edu Years in school (respondent) 7.68 ASC,Cost
imppay 5 point Likert score for importance ascribed to paying tax / village fund on household well-being [1: not important; 5: very important]
3.03 ASC
KL Dummy variable showing whether respondent is from Lore or Kulawi districts 0.52 ASC
colrat Dummy variable showing if a respondent is collecting rattan 0.13 Rattan
invwat Dummy variable showing if a household is involved in wet rice cultivation 0.60 Water
agecoc Maximum age of cocoa plantations owned by respondent 4.46 Cocoa povind Relative poverty index comprising a set of welfare indicators§ 0.02 Cocoa
anohappy 5 point score (pictures) to express general attitude towards Anoa [1 complies with “unhappy”, 5 with “very happy”] 3.05 Anoa
anosurv 5 point Likert score to express impacts expected when Anoa population is reduced to 10 individuals [1: surely will survive; 5: surely become extinct]
2.99 Anoa
prisec Indicator for perceived discretionary income: share of total household income spend on primary needs (rather than secondary) [1: 3/4 to everything; 3: 1/4 up to ½]
2.05 Cost
depch Dependency rate adults vs. children§ 0.54 Cost § Data from subproject A4 (see Schwarze 2004); missing values replaced by the mean
All 301 households completed the choice task, and 235 made choices which included either
option A or B at least once. 66 respondents always chose the status quo. 80 % of them
reported that they (i) could not afford the payment (3 respondents) or (ii) they perceived the
present situation to be “better” than the offered alternatives (36 respondents), or a
combination of both (27 respondents). The first aspect underlines that WTP measures have to
be interpreted as a combination of people’s willingness and their ability to pay. The remaining
13 respondents (20%) were classified as “…essentially not responding to the CE task.”
(Adamowicz et al. 1998b: 68) and were omitted14, leaving 288 responses for further analysis.
21
6. Results and Discussion
6.1 Overall model results
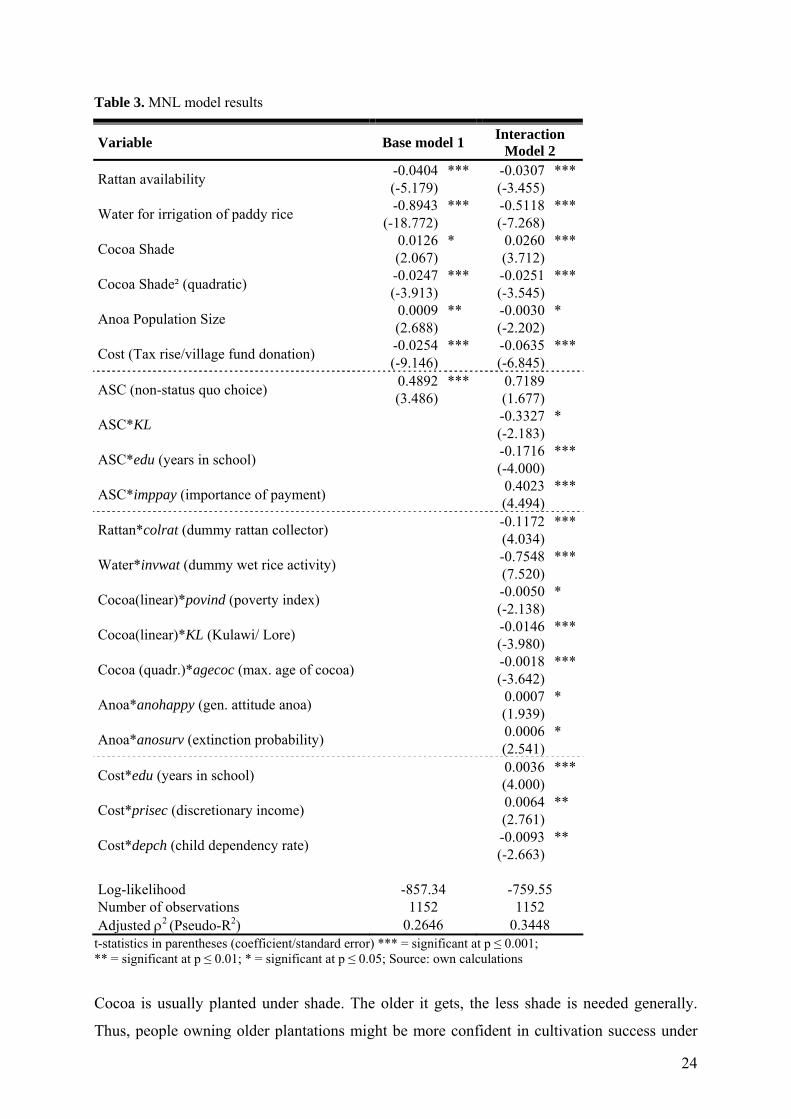
We report the results from two multinomial logit models here: attributes only (model 1) and
attributes and interactions with socioeconomic variables (model 2). Overall, models 1 and 2
were highly significant at the 99 % level. As expected, we find a significant improvement of
the interaction model 2 as compared to the base model 1 (LR test: χ2 = 211.10; 14 d.f.). The
overall model fit increases from the base model 1 (Adjusted ρ2 (Pseudo-R2) = 0.258) to the
interaction model 2 (ρ2 = 0.345). These pseudo-R2 values can be compared with values of R2
as in OLS regression models. A ρ2 between 0.2 and 0.4 corresponds to R2 values of 0.7 to 0.9,
indicating very good fit (Hensher et al. 2005).
In order to test whether the MNL model is the appropriate model, Hausman-McFadden tests
(Hausman and McFadden 1974) were performed to test for violations of the Independence of
Irrelevant Alternatives (IIA) assumption that is implicit in MNL models. The results for the
basic model were somehow inconclusive, i.e. violations were found for dropping one
alternative, and the assumption could not be rejected when dropping the other two
alternatives. No violations were found in the interaction model, however. This result is in line
with Morrison et al. (1998), where the inclusion of SDCs helped to minimise IIA violations.
All attribute coefficients are significant and have the expected sign. I.e., disutility was
observed for more months with water scarcity, with a greater distance to rattan harvesting
locations and with paying tax or donating to a village fund. A utility gain is observed for
bigger population sizes of the endemic dwarf buffalo Anoa. Concerning cocoa, the results
indicate on average higher preferences for less shade in cocoa, implicitly having lower species
diversity. Model results are listed in table 3.
6.2 ASC and interactions
The ASC is positive and significant in model 1. It is not significant; however, in model 2,
indicating that much of the variation in choice is already explained by the attributes or
interactions. This suggests that there is no particular propensity to choose the status quo
option relative to the alternatives as more commonly reported in literature (e.g. Adamowicz
1998a). One exception are Mogas et al. (2002), who report a positive ASC in a study on
22
afforestation in Catalonia. A preference for the status quo, all else equal, was often related to
what is referred to as ‘status-quo bias’ (Samuelson and Zeckhauser 1988). One reason for
status quo bias can be that the status quo is used as an ‘easy way out’, e.g., in case of decision
difficulty and/or limited cognitive capability (e.g. Luce 1998, Kontoleon and Yabe 2003). The
positive ASC gives some evidence that this strategy was not particularly important in our
study. People receive on average – everything else held constant – more utility from departing
from the present situation than from keeping it. This could be due to a number of reasons such
as, inter alia, that respondents include unobserved attributes associated with a governmental
programme or task compliance. According to the high rate of status quo choices among all
choices (53.2 %) it is unlikely, however, that the respondents felt ‘forced’ to choose among
the alternatives of change as a consequence of a falsely perceived compliance with the
intentions of this research.
The interactions of the ASC with SDC can shed some light on potential reasons and their
heterogeneous distribution among the sample population (model 2 in table 3). The tendency to
choose the management alternatives rather than the status quo decreases with increasing years
in school (ASC*edu), and if the respondent is from Kulawi or Lore districts (ASC*KL). The
education variable is positively correlated with the relative poverty index and with a dummy
variable taking 1 if the respondent is involved in non-farm income activities (Pearsons R2:
0.256 respectively 0.362, both significant at the 99 % level). Thus, respondents that are less
poor and respondents that derive non-farm related income might be more satisfied with the
current situation or may perceive to obtain less benefit from changes in mainly farming
related attributes. On the other hand, better educated respondents may make less use of
unobserved attributes when making their decision, which results in lower values for the ASC.
Finding an interpretation for the negative coefficient for the interaction ASC*KL is far from
straightforward. This dummy was created as Kulawi and Lore (comprising the districts Lore
Utara and Lore Tengah) are – on the whole - still less intensively used agriculturally
compared to Palolo and Sigi Biromaru districts, and farther from the urban capital Palu.
Environmental degradation is more obvious here, resulting, e.g., in water shortages for
irrigation as well as household usage. In Palolo district, deforestation of a large forest area
named Dongi-Dongi was followed by a devastating flood event in December 2003. Hence, the
threat imposed by environmental degradation could be felt more directly than in the Kulawi or
Lore districts. This could increase the likelihood that respondents include unobserved
23
attributes of environmental change for their choice. The positive and significant interaction
ASC*imppay shows that respondents who give higher scores for the importance of paying tax
on household well-being have higher preferences for a change away from the status quo. This
could be due to the fact that these respondents expect higher utility from governmental
programs.
Making sense intuitively, disutility for an impairment of rattan provision and water
availability increases significantly if respondents are involved in either collecting rattan or
cultivating wet rice. Large parts of a utility gain from an improved provision of rattan and
water services can be explained by the involvement of respondents in these activities.
However, involvement is not the only source that can explain people’s preferences regarding
the rattan and water attributes. This may lead to the assumption that these two activities are
not easily substitutable for other income generating activities because they fulfil purposes
other than related to the actual generation of income in cash or kind (i.e. for subsistence). In
this context, rattan e.g. provides security as an alternative income source in the case of
economic failure for vulnerable households. During our field work it became clear that in the
perception of locals who were not involved in wet rice cultivation, the most important benefit
from sustained wet rice cultivation in their region is to maintain a local market for the most
important staple food which can be obtained at rather low prices. Due to improved access in
most parts of the research region to the urban market of Palu, this aspect may actually be less
important than perceived. Besides, there may be an array of social and cultural factors
associated with wet rice cultivation that have influence on the life within local village
communities. Some aspects are pointed out in Burkard (2002a), who also vividly shows the
complexity and heterogeneity of such factors in the research region.
The quadratic term for cocoa is negative and significant, indicating that there is some
threshold for intensification which would not have been detected in the basic linear model. At
mean level for the socio-demographic characteristics and cocoa age interacted with cocoa,
utility peaks at a level of shading of approximately 28 %. As the interactions with cocoa
show, the likelihood is higher that the peak is reached at lower levels of shading if the
maximum age of cocoa plantations increases and the respondent is less poor according to a
relative poverty index measure.
24
Table 3. MNL model results
Variable Base model 1 Interaction Model 2
Rattan availability -0.0404(-5.179)
*** -0.0307(-3.455)
***
Water for irrigation of paddy rice -0.8943(-18.772)
*** -0.5118(-7.268)
***
Cocoa Shade 0.0126(2.067)
* 0.0260(3.712)
***
Cocoa Shade² (quadratic) -0.0247(-3.913)
*** -0.0251(-3.545)
***
Anoa Population Size 0.0009(2.688)
** -0.0030(-2.202)
*
Cost (Tax rise/village fund donation) -0.0254(-9.146)
Log-likelihood -857.34 -759.55 Number of observations 1152 1152 Adjusted ρ2 (Pseudo-R2) 0.2646 0.3448
t-statistics in parentheses (coefficient/standard error) *** = significant at p ≤ 0.001; ** = significant at p ≤ 0.01; * = significant at p ≤ 0.05; Source: own calculations
Cocoa is usually planted under shade. The older it gets, the less shade is needed generally.
Thus, people owning older plantations might be more confident in cultivation success under
25
less shade as a result of longer experience. The less poor people are, the more agronomic risk
they may be willing to take, and the more disposable capital they may have to invest in
fertilizer or pesticides. Additionally, respondents living in Lore or Kulawi districts have
higher preferences for more intensive cocoa cultivation compared to those living in Sigi-
Biromaru and Palolo. This may at least partially be explained by a longer establishment of
cocoa cultivation in these districts.
The results of the interactions show that it is likely that further intensification will take place
in the future. Thus, biodiversity conservation measures aiming at more sustainable ways of
cocoa cultivation (measured here by a shade tree gradient) will be unlikely to be successful
without creating incentives for the cocoa farmers such as, e.g., price premiums. However,
cocoa intensification can be very beneficial from a development economics standpoint: Keil
(2004) has shown that there is still much potential for increasing the technical efficiency and
therefore the benefits obtained from cocoa cultivation. Despite the risks, the spread of cocoa
and its intensification has improved welfare not only for migrants from South Sulawesi, who
have a longer tradition in cocoa cultivation, but also for many “locals”. For an example that
cocoa cultivation does not necessarily lead to an improvement of the living conditions for
locals see Sitorus (2002). Weber (2005) has discussed the risks associated with the rising
dependency on (world market) prices for cocoa. He concluded that a severe price crash would
mean the end of cocoa as a driving force for improved welfare, but that it is likely that welfare
would not drop below the state before the beginning of the cocoa boom. It is a matter of
dispute whether intensification can help to mitigate encroachment in the forest or whether it
may actually enhance it (see Keil 2004), while it can generally be assumed that the emergence
of cocoa in the Lore Lindu region in the course of the cocoa boom has promoted forest
encroachment (e.g. Maertens 2004).
In general, not much is known about specific ecological and economic short and long term
implications resulting from cocoa cultivation. Hence, it is in the realm of speculation to judge
whether the (private) net benefits of cocoa cultivation and its intensification exceed the
(social) cost, particularly in the long run. Still, the demand of people for further intensification
should seriously be considered by decision makers. As an aside, we could not find any
significant differences of preferences regarding the cocoa attribute between “locals” and
migrants15 as well as between households with an indigenous or non-indigenous head of
household (data not shown). This finding gives rise to the hypothesis that (i) there are no
26
differences in the preferred way of cocoa cultivation between these groups and (ii) that the
key factor influencing the cultivation decision is profit maximization. This does not mean that
there are no actual differences between cocoa plots. However, these differences could be the
result of e.g. different general cropping strategies, which are outlined in e.g. Burkard (2002a)
and Weber (2005), different knowledge about cultivation practices or the access to the latter
(Weber 2005).
Surprisingly, the sign of the coefficient (significant at the 5 % level) for the anoa attribute
changes in model 2 and is negative contrarily to prior expectation. The two interactions
included are both positive and significant at 5 % or lower. The more positive people felt about
anoa, and the more likely they find it that a population of 10 remaining individuals will
become extinct, the higher the utility they get from maintaining larger population sizes in the
Lore Lindu area. If an individual’s attitude is rather negative and/or it thinks that it is more
likely that a population of 10 will survive, however, it will receive disutility from anoa
conservation efforts. By calculating individual utilities based on model estimates and SDC,
about one fifth of the respondents prefer smaller population sizes of anoa. When asked about
negative and positive aspects associated with anoa, about one third (32 %) of the respondents
could not mention any positive aspects, while more than half of the respondents (53 %)
reported potential or actual problems. 51 % stated to obtain benefits mostly related to the
protection of a species which is ‘special’ (khas) to Sulawesi (including bequest motives). On
the other hand, about 14 % can name benefits from the direct use of anoa (meat, horns, skin
etc.).
Results from population models reported by Manansang et al. (1996) indicate that anoa
populations may only be able to survive a hunting rate of 2-3 % of the total population
number each year. Despite the fact that not every respondent of the 14 % mentioning hunting-
related benefits might actually hunt anoa16, it is not unlikely, on the other hand, that hunting
rates may actually exceed 2-3 % of the total anoa population. Burton et al. (2005: 42) suggest
education and training of people as a measure for an anoa conservation programme: “It is
necessary to explain to people living around protected areas why their activities need to be
controlled and why wildlife, which they might otherwise utilize, should be conserved. The
fact that anoas, along with many other species, do not occur outside Sulawesi should be
stressed because many people on the island are unaware of their heritage […]”.
27
The model results suggest that educational efforts can contribute to anoa conservation by
altering people’s attitude and their knowledge about anoa: further decline of the population
would very likely lead to anoa becoming extinct in the National Park area. Thus, Burton et al.
(2005: 40) conclude that “Law enforcement should be combined with an environmental
education campaign that stresses that the anoas are unique to Sulawesi and in danger of being
lost forever”.
All included interactions of socioeconomic variables with the cost attribute were significant,
and marginal WTP is a function of these variables. Individuals with higher education and a
higher perceived discretionary (short-term) income are less responsive to increases of the cost
attribute (thus having positive effect on WTP), whereas individuals with higher child
dependency rates are more concerned about tax rise or village donation (thus having negative
impact on WTP). As an aside, we did not find a significant influence of relative poverty on
the cost attribute (data not shown). In addition to the documented linear influence on cocoa
shading, relative poverty may have a systematically non-linear influence on preferences for
anoa, rattan and water (Glenk et al. accepted). However, as relative poverty is a composite
mid-term welfare measure, it does not directly reflect the current buying power or cash
availability of respondents. These aspects are more likely to be determinants of sensitivity for
changes in the cost attribute as indicated by the interaction with the perceived discretionary
income mentioned above.
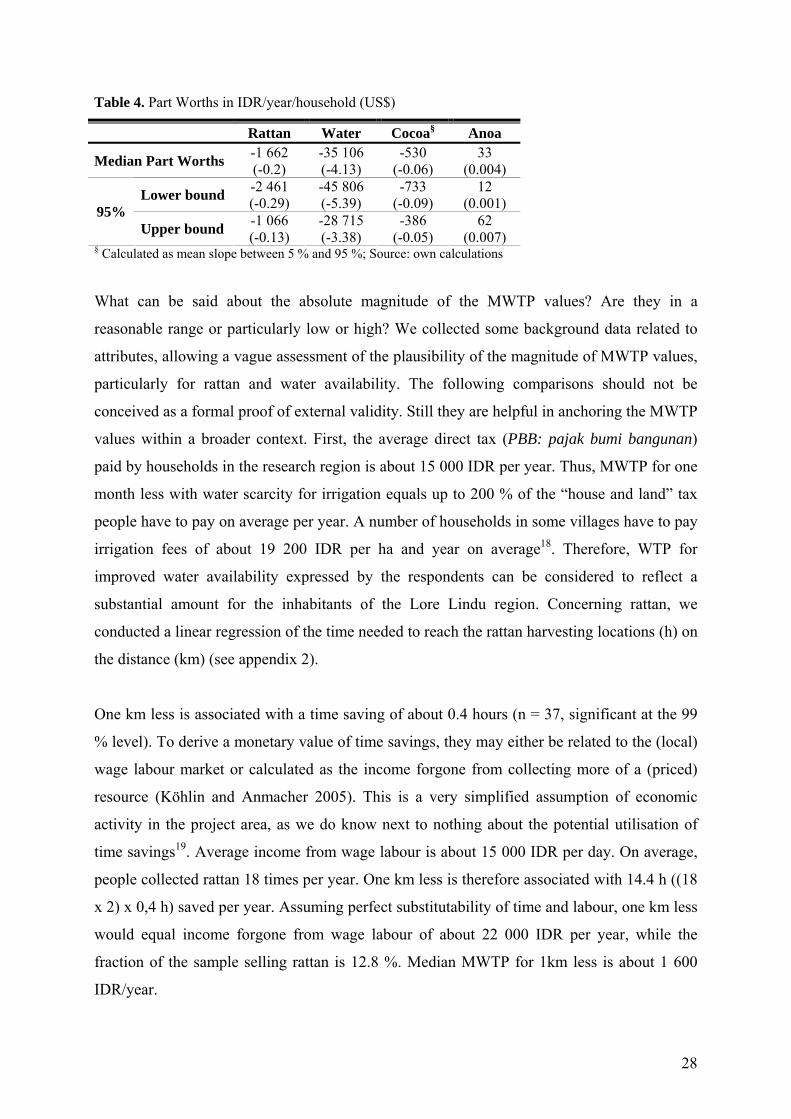
6.3 Part Worths
Marginal WTP values or implicit prices for the ecosystem services included in the choice
experiment can be calculated by dividing the attribute coefficient with the coefficient of the
cost attribute. For the interactions with SDC, mean values were used. Implicit prices “… can
be used by policy makers to assign more resources to improving those attributes that have
higher prices…” (Colombo et al. 2005:89). However, care must be taken when comparing the
implicit prices as the attribute units differ. Results are listed in table 4. Most impressively,
median MWTP to avoid 1 month of water scarcity for irrigation is about 35 000 IDR (4.1
US$) per year, 100 individuals more of anoa are still worth about 3 300 IDR (0.39 US$) per
year. Confidence intervals were calculated by using a Krinsky and Robb (1986) procedure
with 1000 random draws17.
28
Table 4. Part Worths in IDR/year/household (US$)
Rattan Water Cocoa§ Anoa
Median Part Worths -1 662 (-0.2)
-35 106 (-4.13)
-530 (-0.06)
33 (0.004)
Lower bound -2 461 (-0.29)
-45 806 (-5.39)
-733 (-0.09)
12 (0.001) 95%
Upper bound -1 066 (-0.13)
-28 715 (-3.38)
-386 (-0.05)
62 (0.007)
§ Calculated as mean slope between 5 % and 95 %; Source: own calculations
What can be said about the absolute magnitude of the MWTP values? Are they in a
reasonable range or particularly low or high? We collected some background data related to
attributes, allowing a vague assessment of the plausibility of the magnitude of MWTP values,
particularly for rattan and water availability. The following comparisons should not be
conceived as a formal proof of external validity. Still they are helpful in anchoring the MWTP
values within a broader context. First, the average direct tax (PBB: pajak bumi bangunan)
paid by households in the research region is about 15 000 IDR per year. Thus, MWTP for one
month less with water scarcity for irrigation equals up to 200 % of the “house and land” tax
people have to pay on average per year. A number of households in some villages have to pay
irrigation fees of about 19 200 IDR per ha and year on average18. Therefore, WTP for
improved water availability expressed by the respondents can be considered to reflect a
substantial amount for the inhabitants of the Lore Lindu region. Concerning rattan, we
conducted a linear regression of the time needed to reach the rattan harvesting locations (h) on
the distance (km) (see appendix 2).
One km less is associated with a time saving of about 0.4 hours (n = 37, significant at the 99
% level). To derive a monetary value of time savings, they may either be related to the (local)
wage labour market or calculated as the income forgone from collecting more of a (priced)
resource (Köhlin and Anmacher 2005). This is a very simplified assumption of economic
activity in the project area, as we do know next to nothing about the potential utilisation of
time savings19. Average income from wage labour is about 15 000 IDR per day. On average,
people collected rattan 18 times per year. One km less is therefore associated with 14.4 h ((18
x 2) x 0,4 h) saved per year. Assuming perfect substitutability of time and labour, one km less
would equal income forgone from wage labour of about 22 000 IDR per year, while the
fraction of the sample selling rattan is 12.8 %. Median MWTP for 1km less is about 1 600
IDR/year.
29
Comparisons like that are more difficult for cocoa and particularly anoa due to the complexity
of the benefits associated with those attributes on one hand, and to a lack of data available on
those benefits on the other hand. For the water and rattan attributes, however, there is
indication that the MWTP values are in a reasonable range. Furthermore, Pattanayak and
Kramer (2001) report a WTP of 2-3 US$ for drought mitigation services by watershed
protection on Flores/ Indonesia derived by contingent valuation method. Although not directly
comparable, their result for a similarly framed ecosystem service can provide some weak
evidence that MWTP for water as calculated in this study seems to be neither completely
over- or underestimated.
7. Conclusion
With a carefully adjusted instrument, the choice experiment could be conducted successfully
on one of Indonesia’s outer islands. Model performance was quite good. The MNL model
results provide some evidence that the choice experiment can be applied to complex
ecological services in an ecologically and socially diverse rural area and in a developing
country setting. The design strategies to adjust the status-quo scenario to the individual
respondents and the translation of biodiversity values into ecosystem services contributed
essentially to this result. Concerning the first, one of the major advantages of using
individual-specific perceived levels for the status-quo is the availability to account for
heterogeneous environmental conditions in an on-site study, therefore enhancing credibility
among respondents as well as framing choices properly as gains and losses.
Using the ecosystem service approach and translating ecosystem functions into concepts that
correspond to and interact with peoples life may contribute to reduce potential problems
arising from the divergence of perceived and actual values for welfare analysis. The
ecosystem approach proved to be a successful instrument to be used for the valuation of
ecosystem services in general and for ecosystem services provided by complex ecosystem
functions in particular. However, the link between ecosystem services as described in this
study and the underlying ecosystem structures, functions and processes is not well established
(also see Barkmann et al. subm. a). It is for instance neither known, what management
practices would be necessary to reduce the encounter distance to the harvesting locations for
rattan by 5 km, nor is it clear, what kind of quantitative and qualitative land use change would
result in a water shortage for irrigation of one month more. Thus, one of the major challenges
30
for future applications of the ecosystem service approach is to improve the ‘tuning’ with
ecological sciences to achieve that data is produced in a form that is translatable into
ecosystem services for the assessment of (welfare) implications of human-induced changes.
The task for economists, on the other hand, is to identify the values of ecosystem services for
consideration in decision-making processes. By combining the impacts on human-wellbeing
with ecological background data and other societal aspects, a useful policy/management tool
could arise. Hence, further efforts are needed to improve the communication between the two
disciplines.
Measures of MWTP for an improved provision of ecosystem services (‘water’, ‘rattan’,
‘anoa’) were documented. We outlined that the magnitude of MWTP is quite substantial
considering the living conditions of the inhabitants of the Lore Lindu region. Furthermore, we
provided some indication that MWTP values calculated in this study are neither completely
over- nor underestimated. There is a willingness of local respondents to contribute actively to
the maintenance of their resource base concerning water availability and rattan provision. This
could also be beneficial from a biodiversity conservation standpoint. On average, residents
even have small MWTP for maintaining viable population sizes of the local endemic dwarf
buffalo anoa. By taking a closer look, we found a substantial amount of respondents who
either don’t care or even have preferences for smaller populations, which is of concern for the
conservation of that species. This shows the importance of accounting for heterogeneity of
tastes by interactions. In the fast growing sector of cocoa agroforestry systems, the
respondents indicated an unexpectedly clear preference for more intensively managed
plantations with fewer shade trees. Benefits due to increased welfare are opposed by negative
impacts on biodiversity. However, the relationship between private net benefits and social
costs is not clear for neither short nor longer terms.
Overall, the conflict between locally predominant objectives of economic development and
more globally defined conservation objectives is clearly reflected in people’s preferences for
the range of ecosystem services observed. MWTP figures reflecting net benefits can serve as a
benchmark for future research and may be utilized as measures of Hicksian compensating
variation (e.g. Bennett and Blamey 2001) in a cost-benefit framework, which addresses all
relevant costs and benefits, associated with a development program. It is the results from
interactions with socio-demographic variables, however, which contribute to a more
distinguished understanding of people’s preferences.
31
8. References
Adamowicz, W., Luckert, M. and M. Veeman, 1997a. Issues in using valuation techniques
cross-culturally: three cases in Zimbabwe using contingent valuation, observed
behaviour and derived demand techniques. Commonwealth Forestry Review,
76(3):194-97. Adamowicz, W., Swait, J., Boxall, P., Louviere, J. and M. Williams, 1997b. Perceptions
versus Objective Measures of Environmental Quality in Combined Revealed and
Stated Preference Models of Environmental Valuation. Journal of Environmental
Economics and Management, 32: 65-84.
Adamowicz, W., Louviere, J. and J. Swait, 1998a. Introduction to Attribute-Based Stated
Choice Methods. Prepared by Advanis Inc. for the National Oceanic and Atmospheric
Administration, US Departement of Commerce.
Adamowicz, W., Boxall, P., Williams, M. and J. Louviere, 1998b. Stated preference
approaches to measuring passive use values. American Journal of Agricultural
Economics, 80: 64-75.
Akiyama, T. and A. Nishio, 1996. Indonesia’s Cocoa Boom. Hands-off Policy Encourages
Smallholder Dynamism. Policy Research Working Paper 1580. Washington, D.C.:
World Bank.
Alpizar, F., Carlsson, F. and P. Martinsson, 2001. Using Choice Experiments for Non-Market
Valuation. Economic Issues, 8: 83-110.
ANZDEC, 1997. Central Sulawesi Integrated Area Development and Conservation Project.
TA NO 2518 - INO. Draft Final Report - Annex (Working Papers). Indonesia.
Barkmann, J., Dietrich, N., de Vries, K., Gerold, G., Glenk, K., Keil, A., Faust, H., Leemhuis,
C. and R. Marggraf, (submitted a). Confronting unfamiliarity with ecosystem
functions: The case for an ecosystem service approach to environmental valuation
with stated preference methods. Submitted to Ecological Economics.
Barkmann, J., Glenk, K., Marggraf, R. (submitted b): Assessing economic preferences for
biological diversity and ecosystem services at the Central Sulawesi Rainforest Margin
– a choice experiment approach. Guhardja, Leuschner and Tscharntke (Eds): The
stability of rainforest margins: linking ecological, economic and social constraints of
land use and conservation.
Bateman, I.J., Carson, R.T., Day, B., Hanemann, M., Hanley, N., Hett, T., Jones-Lee, M.,
Loomes, G., Monrato, S., Ozdemiroglu, E., Pearce, D., Sugden, R. and J. Swanson,
32
2002. Economic Valuation with Stated Preference Techniques – A Manual.
Cheltenham, UK: Edward Elgar.
Belsky, J.M. and F.S. Siebert, 2003. Cultivating Cocoa: Implications of sun-grown cocoa on
local food security and environmental sustainability. Agriculture and Human Values,
20: 277-85.
Ben-Akiva, M. and M. Bierlaire, 1999. Discrete Choice Methods and Their Applications to
Short Term Travel Decisions, in R.W. Hall (Ed.): Handbook of Transportation
Science: 5-33. USA: Kluwer Academic Publishers.
Bennett, J., 1999. Some Fundamentals of Environmental Choice Modelling. Research
Report No.11. Canberra, Australia: School of Economics and Management, The
University of New South Wales.
Bennett, J. and W. Adamowicz (2001), ’Some Fundamentals of Environmental Choice
Modelling‘, in J. Bennett and R. Blamey, (Eds), The Choice Modelling Approach to
Environmental Valuation. Cheltenham, UK: Edward Elgar.
Bennett, J. and R. Blamey (Eds), 2001. The Choice Modelling Approach to Environmental
Valuation. Edward Elgar, Cheltenham, UK.
Bingham, G., Bishop, R., Brody, M., Bromley, D., Clark, E., Cooper, W., Constanza, R.,
Hale, T., Hayden, G., Kellert, S., Norgaard, R., Norton, B., Payne, J., Russell, C. and
G. Suter, 1995. Issues in ecosystem valuation: improving information for decision
making. Ecological Economics, 14: 73-90.
Blamey, R., Rolfe, J., Bennett, J. and M. Morrison, 1997. Environmental Choice Modelling:
Issues and Qualitative Insights. Research Report No. 4. Canberra, Australia: School
of Economics and Management, The University of New South Wales.
Blamey, R., J. Bennett, M. Morrison, J. Louviere and J. Rolfe, 1998. Attribute Selection in
Environmental Choice Modelling Studies: The Effect of Causally Prior Attributes.
Research Report No. 7. Canberra, Australia: School of Economics and Management,
The University of New South Wales.
Burkard, G., 2002a. Stability or Sustainability? Dimensions of Socio-economic Security in a
Rainforest Margin. STORMA Discussion Paper Series No. 7, Universities of
Göttingen and Kassel, Germany and the Institut Pertanian Bogor and Universitas
Tadulako, Indonesia.
Burkard, G. 2002b. Natural Resource Management in Central Sulawesi: Past Experience and
33
Future Prospects. STORMA Discussion Paper Series No. 8, Universities of Göttingen
and Kassel, Germany and the Institut Pertanian Bogor and Universitas Tadulako,
Indonesia.
Burton, J.A., Hedges, S. and A.H. Mustari, 2005. The taxonomic status, distribution and
conservation of the lowland anoa Bubalus depressicornis and mountain anoa Bubalus
quarlesi. Mammal Review, 35(1): 25-50.
Colombo, S., Calatrava-Requena, J. and N. Hanley, 2005. Designing Policy for Reducing the
Off-farm Effects of Soil Erosion Using Choice Experiments. Journal of Agricultural
Economics, 56(1): 81-95.
De Groot, R., Wilson, M. and R. Boumans, 2002. A typology for the classification,
description and valuation of ecosystem functions, goods and services. Ecological
Economics, 41: 393-408.
Faust, H., Maertens, M., Weber, R., Nuryartono, N., van Rheenen, T. and R. Birner, 2003.
Does Migration lead to Destabilization of Forest Margins? Evidence from an
interdisciplinary field study in Central Sulawesi. STORMA Discussion Paper Series
No. 11, Universities of Göttingen and Kassel, Germany and the Institut Pertanian
Bogor and Universitas Tadulako, Indonesia.
Glenk, K., Barkmann, J., Schwarze, S., Zeller, M. and R. Marggraf, (accepted). Differential
influence of relative poverty on preferences for ecosystem services: Evidence from
rural Indonesia. Brisbane Conference on Environment and Development, 2006.
Greene, W.H., 2003. LIMDEP Version 8.0 NLogit Version 3.0. Plainview, N.Y.:
Econometric Software, Inc.
Hausman, J. and D. McFadden, 1984. Specification Tests for the Multinomial Logit Model.
Econometrica, 52(5): 1219-40.
Hensher, D.A., Rose, J.M., and W.H. Greene 2005. Applied choice analysis: a primer.
Cambridge University Press, Cambridge, U.K.
Horne, P. and L. Petäjistö, 2003. Preferences for Alternative Moose Management Regimes
among Finnish Landowners: A Choice Experiment Approach. Land Economics, 79(4):
472-82.
Huber, J. and K. Zwerina, 1996. The Importance of Utility Balance in Efficient Choice
Designs. Journal of Marketing Research, 33: 307-17.
Jae, H. and D. del Vecchio, 2004. Decision Making by Low-Literacy Consumers in the
Presence of Point-of-Purchase Information. The Journal of Consumer Affairs, 38(2):
342-54.
34
Kahneman, D. and J.L. Knetsch, 1992. Valuing Public Goods. The Purchase of Moral
Satisfaction. Journal of Environmental Economics and Management, 22: 57-70.
Keil, A., 2004. The socio-economic impact of ENSO-related drought on farm households in
Central Sulawesi, Indonesia. Ph.D. thesis, Institute of Rural Development, University
of Goettingen.
Kemper, D. 2005. Die Bedeutung von „Wissen“ für Landnutzungsentscheidungen - eine
kulturgeographische Untersuchung in zwei Dörfern am Rande des Lore Lindu
Nationalpark, Indonesien. M.Sc. Thesis, Institute of Geography, University of
Goettingen.
Köhlin, G. and G.S. Amacher, 2005. Welfare Implications of Community Forest Plantations
in Developing Countries: The Orissa Social Forestry Project. American Journal of
Agricultural Economics, 87(4): 823-1096.
Kontoleon, A. and M. Yabe, 2004. Assessing the Impacts of Alternative ‘Opt-out’ Formats
in Choice Experiment Studies. Journal of Agricultural Policy Research, 5: 1-32.
Krinsky, I., and A. L. Robb, 1986. On approximating the statistical properties of elasticities.
Review of Economics and Statistics, 68: 715–719.
Krutilla, J. V., 1967. Conservation Reconsidered. American Economic Review, 57(4): 777-
786.
Lancaster, K., 1966. A New Approach to Consumer Theory. Journal of Political Economy,
74: 132-157.
Lancaster, K., 1991. Modern Consumer Theory. Brookfield VT: Edward Elgar.
Louviere, J., Hensher, D. and J. Swait 2001. Stated Choice Methods – Analysis and
Application. Cambridge, UK: Cambridge University Press.
Luce, R.D., 1959. Individual choice behaviour. New York: Wiley.
Luce, M.F., 1998. Choosing to Avoid: Coping with Negatively Emotion-Laden Consumer
Decisions. Journal of Consumer Research, 24: 409-33.
Maertens, M., 2004. Economic Modelling of Agricultural Land-Use Patterns in Forest
Frontier Areas. Ph.D. thesis, Institute of Rural Development, University of
Goettingen.
Manski, C., 1977. The Structure of Random Utility Models. Theory and Decision, 8: 229-54.
Marggraf, R. and R. Birner, 1998. The Conservation of Biological Diversity from an
Economic Point of View. Theory in Biosciences, 117: 238-55.
McFadden, D., 1973. Conditional Logit Analysis of Qualitative Choice Behavior. In P.
Zarembka (Ed.): Frontiers in Econometrics. New York: Academic Press.105-42.
35
Mekonnen, A., 2000.Valuation of Community Forestry in Ethiopia: a Contingent valuation
Study of Rural Households. Environment and Development Economics, 5: 289-308.
Millennium Ecosystem Assessment, 2003. Ecosystems and human well-being: A framework
for assessment. Washington, District of Columbia: Island Press.
Mogas, J., Riera, P. and J. Bennett, 2002. A comparison of contingent valuation and choice
modelling: Estimating the environmental values of Catalonian forests. Occasional
paper no. 1, National Centre for Development Studies, Australian National University.
Morrison M., Blamey, R. Bennett, J. and J. Louviere, 1996. A Comparism of Stated
Preference Techniques for Estimating Environmental Values. Research Report No.1.
Canberra, Australia: School of Economics and Management. The University of New
South Wales.
Morrison, M., Bennett, J., and R. Blamey, 1998. Valuing improved wetland quality using
choice modelling. Research Report No.6. Canberra, Australia: School of Economics
and Management, The University of New South Wales.
Myers, N., Russel, A., Mittermeier, R., Mittermeier, C., da Fonseca, G. and J. Kent, 2000.
Biodiversity hotspots for conservation priorities. Nature, 403:853-58.
Nunes, P. and J. v.d. Bergh, 2001. Economic valuation of biodiversity: sense or nonsense?.
Ecological Economics, 39: 203-22.
Olson, D.M. and E. Dinerstein, 1998. The Global 200: a representation approach to
conserving the Earth's most biologically valuable ecoregions. Conservation Biology,
12: 502.
Pattanayak, K. and R. Kramer, 2001. Pricing ecological services: Willingness to pay for
drought mitigation from watershed protection in eastern Indonesia. Water Resources
Research, 37(3): 771-78.
Pearce, D.W. and D. Moran, 1994. The economic Value of Biodiversity. IUCN – The World
Randall, A. and J. Stoll, 1983. Existence Values in a Total Valuation Framework. In: Row, R.
D. and L.G. Chestnut: Managing Air Quality and Scenic Resources at National Parks
and Wilderness Areas. Boulder, Colorado: Westview Press.
Sagoff, M., 1996. On the Value of Endangered and Other Species. Environmental
Management, 20(6): 897-911.
Samuelson, W. and R. Zeckhauser, 1988. Status Quo Bias in Decision Making. Journal of
Risk and Uncertainty, 1: 7-59.
Schwarze, S., 2004. Determinants of Income Generating Activities of Rural Households, A
36
Quantitative Study in the Vicinity of the Lore-Lindu National Park in Central
Sulawesi/Indonesia. Ph.D. thesis, Institute of rural Development, University of
Goettingen.
Shyamsundar, P. and R. Kramer, 1996. Tropical Forest Protection: An empirical analysis of
the costs borne by local people. Journal of Environmental Economics and
Management, 31: 129-44.
Siebert, F.S., 2001. Sustainable harvesting of wild rattan: viable concept or ecological
oxymoron? Unasylva, 52: 36-45.
Siebert, F.S., 2002. From shade to sun-grown perennial crops in Sulawesi, Indonesia:
implications for biodiversity conservation and soil fertility. Biodiversity and
Conservation, 11: 1889-1902.
Sitorus, F. 2002. Land, ethnicity and the competing power. Agrarian dynamics in forest
margin communities in Central Celebes, Indonesia. STORMA Discussion Paper Series
No. 6, Universities of Göttingen and Kassel, Germany and the Institut Pertanian
Bogor and Universitas Tadulako, Indonesia.
Slovic, P. and S. Lichtenstein, 1971. Comparison of Bayesian and Regression Approaches to
the Study of Information Processing in Judgment. Organizational behavior and Human
Performance, 6: 649-744.
Suryahadi, A. and S. Sumarto, 2001. The chronic poor, the transient poor, and the vulnerable
in Indonesia before and after the crisis. SMERU working paper. Jakarta: SMERU
Research Institute.
Swait, J. and W. Adamowicz, 1996. The Effect of Choice Experiments and Task Demands on
Consumer Behavior: Discriminating Between Contribution and Confusion. Staff Paper
96-09. Edmonton, Canada: Departement of rural Economy, University of Alberta.
Thurstone, L.L., 1927. A Law of Comparative Judgment. Psychological Review, 4: 273-86.
Train, K., 1986. Qualitative Choice Analysis, Theory, Econometrics and an Application to
Automobile Demand, MIT Press, London.
Train, K., 1998. Recreation demand models with taste differences over people. Land
Economics, 74(2): 230 – 40.
Turner, R., Paavola, J., Cooper, P., Faber, S., Jessamy, V. and S. Georgiou, 2002. Valuing
Nature: Lessons Learned and Future Research Directions. CSERGE Working Paper
EDM 02-05. Norwich, UK: University of East Anglia.
Waltert, M., Mardiastuti, A. and M. Mühlenberg, 2004. Effects of land use on bird species
richness in Sulawesi, Indonesia. Conservation Biology, 18: 1339-46.
37
Weber, R., 2005. Kulturlandschaftswandel während des 20. Jh. in Zentralsulawesi – eine
historisch-geographische Analyse der Lore-Lindu-Bergregenwaldregion. Ph.D. thesis,
Institute of Geography, University of Goettingen.
Whitten, A.J., Henderson, G.S. and M. Mustafa, 1987. The Ecology of Sulawesi. Yogyakarta,
Indonesia: Gadjah Mada University Press.
Whittington, D., 1998. Administering contingent valuation surveys in developing countries.
Environmental Economics Program for Southern and Eastern Asia Working Paper.
Zeller, M., Schwarze, S. and T. van Rheenen, 2002. Statistical Sampling Frame and Methods
Used for the Selection of Villages and Households in the Scope of the Research
Programme on Stability of Rainforest Margins in Indonesia (STORMA). STORMA
Discussion Paper Series No. 1, Universities of Göttingen and Kassel, Germany and the
Institut Pertanian Bogor and Universitas Tadulako, Indonesia.
Zeller, M. and R. Birner, 2003. Teilprojekt A3. Der Einfluss von Märkten und
Politikmaßnahmen auf die Ressourcennutzung. in: Sonderforschungsbereich 552
“Stability of Rainforest Margins in Indonesia“ der Deutschen
Froschungsgemeinschaft. Ergebnisbericht über die 1. Förderungsphase 2000/2-
2003/1. Georg-August-University Goettingen and University of Kassel.
Notes: 1 Particularly from South Sulawesi many ‚cocoa migrants’ were attracted by the availability of land (Faust et al 2003). 2 “Existence value” can be defined to be the value arising merely from the information that a resource exists regardless of whether this asset now or in the future generates a productive, recreational or aesthetic use for the person holding the preferences (e.g. Bingham et al. 1995, Fromm 2000). In this sense, there is a notion that the resource or asset has a value of its own, which is of anthropocentric intrinsic nature. Intrinsic values, however, are not consistent with conventional economic thought (Turner et al. 2002). 3 There is no need to distinguish between ecosystem goods and services if the provision of goods within an ecosystem is being classified as an ecosystem service itself. The distinction between production and consumption values (Marggraf and Birner 1998) as well as direct and indirect values within the TEV concept suggests that it may be appropriate to separate goods (production value, often direct use) and services (consumption value, often indirect use) conceptually from an economic point of view. 4 We do not subscribe to extreme interpretations of this way to model actual human decision-making. Namely, we do not assume that actual individuals have perfect information. Our analytic paradigm models individuals ‘as if’ they have perfect information, however. 5 According to the standard model, εij remains perfectly deterministic from an individuals’ point of view. 6 Many CE case studies use “focus groups” for that purpose. It was hardly possible to conduct focus groups without the attendance of the most influential inhabitants of a village. The opinion of those people (e.g. village head) often dominated the sessions. Understandably, they wanted to shed the village into a favourable light. Therefore, it seemed appropriate to focus on individual interviews and use the peer-groups to obtain further information mainly about prevailing policy issues.
38
7 E.g. in one village, one of the streams providing water for irrigation dried up, in another the water declined to such an extend that irrigation is hardly possible any more. 8 This description implicitly entails that perceived effects of irrigation technology on irrigation water supply cannot be separated from the effects of land use. 9 According to Kemper (2005) one inhabitant stated: “If I encounter anoa in the forest, either I kill it, or it will kill me”. 10 I.e. more months with water scarcity and more km to the rattan harvesting locations are expected to be associated with disutility. 11 The split-samples are not analysed in this paper. 12 The Indonesian version of the picture book, the text book and the questionaire can be seen at www.storma.de/DPS/pdf/SDP16b.pdf 13 Present population sizes of anoa cannot possibly be known. Hence, a common reference point was defined (see table 1). 14 Reasons for choosing always the status quo were ‘protest’ answers, payment aversion, and exceeding the cognitive capability to complete the choice task (one respondent). 15 In this case, migrants were defined as households where the head of household or his/her father has moved to the village. 16 On the other hand, not all respondents might have reported benefits from hunting as it is an illegal activity. 17 A large number of random draws from a multivariate normal distribution with mean and variance of parameter estimates and a variance-covariance matrix from the estimated model. 18 Mean value over four planting seasons from 2003 - 2004 for households that paid irrigation fees in 6 of the sample villages. Data from Alwin Keil (IMPENSO/ University of Hohenheim). 19 The income from rattan per day is invariant on the distance of the rattan harvesting locations. Rattan collectors always look for locations where there are still enough large diameter canes, as they are far better priced than smaller diameters. Hence, it is justified to use time savings rather than changes in income in order to derive an estimate of the marginal economic impact of the distance of rattan harvesting locations.


![HackersinYourPocket:ASurveyof …webdoc.sub.gwdg.de/ebook/serien/ah/AIB/2012-07.pdf · 2014-08-27 · phone [36]. [OT-3] Denial of Service: Especially in time-critical appliances,](https://static.documents.pub/doc/80x56/5f0a49477e708231d42ae9f3/hackersinyourpocketasurveyof-2014-08-27-phone-36-ot-3-denial-of-service.jpg)


