journal homepage: http: / /www.elsevier .com/locate/ jas
Unveiling the prehistoric landscape at Stonehenge throughmulti-receiver EMI
Philippe De Smedt a, *, Marc Van Meirvenne a, Timothy Saey a, Eamonn Baldwin b,Chris Gaffney c, Vince Gaffney b
a Research Group Soil Spatial Inventory Techniques, Department of Soil Management, Ghent University, Coupure 653, 9000 Ghent, Belgiumb Department of Classics, Ancient History and Archaeology/Hub for Digital Humanities, University of Birmingham, Edgbaston, Birmingham B15 2TT, UKc Archaeological Sciences, School of Applied Sciences, University of Bradford, Bradford, West Yorkshire, BD7 1DP, UK
a r t i c l e i n f o
Article history:Received 30 January 2014Received in revised form4 June 2014Accepted 28 June 2014Available online 5 July 2014
Archaeological research at Stonehenge (UK) is increasingly aimed at understanding the dynamic of thewider archaeological landscape. Through the application of state-of-the-art geophysical techniques,unprecedented insight is being gathered into the buried archaeological features of the area. However,applied survey techniques have rarely targeted natural soil variation, and the detailed knowledge of thepalaeotopography is consequently less complete. In addition, metallic topsoil debris, scattered overdifferent parts of the Stonehenge landscape, often impacts the interpretation of geophysical datasets. Theresearch presented here demonstrates how a single multi-receiver electromagnetic induction (EMI)survey, conducted over a 22 ha area within the Stonehenge landscape, offers detailed insight into naturaland anthropogenic soil variation at Stonehenge. The soil variations that were detected through recordingthe electrical and magnetic soil variability, shed light on the genesis of the landscape, and allow for abetter definition of potential palaeoenvironmental and archaeological sampling locations. Based on themulti-layered dataset, a procedure was developed to remove the influence of topsoil metal from thesurvey data, which enabled a more straightforward identification of the detected archaeology. The resultsprovide a robust basis for further geoarchaeological research, while potential to differentiate betweenmodern soil disturbances and the underlying sub-surface variations can help in solving conservation andmanagement issues. Through expanding this approach over the wider area, we aim at a fuller under-standing of the humanelandscape interactions that have shaped the Stonehenge landscape.
The archaeological landscape of the Stonehenge (UK) resultsfrom at least 12 000 years of human occupation, during whichprehistoric societies transformed the area into a ritual landscape.An abundance of prehistoric monuments, with the standing stonemonument as the most iconic example, are distributed overapproximately 25 km2 and are witness to such prehistorichumanelandscape interactions. Human action continues to influ-ence this archaeological complex, with notable examples includingthe militarisation of the wider area starting in the end of the 19thcentury, along with conservation and management measures, and
32 92646247.e Smedt).
the designation of Stonehenge as a UNESCO World Heritage Site(WHS) (ICOMOS, 1986).
Stonehenge has attracted research interest from scholars overcenturies (Darvill, 2006) and this has made it one of the mostinvestigated archaeological landscapes in the world. Whereas theindividual monuments have been the focal point of most earlyresearch at the site, landscape archaeological approaches and cur-rent research perspectives, such as those set out in the Archaeo-logical Research Framework (Darvill et al., 2005), emphasise thegeography and archaeology of thewider area. In linewith the statusof Stonehenge as a World Heritage Site, this has stimulated a non-invasive approach, and geophysical and remote sensing methodsare increasingly being applied to tackle current gaps in knowledgeconcerning the archaeological landscape. The most recent in a se-ries of research projects is the Stonehenge Hidden Landscapes Project(SHLP), which aims to study the archaeological landscape, ratherthan the individual monuments (Gaffney et al., 2012).
P. De Smedt et al. / Journal of Archaeological Science 50 (2014) 16e23 17
Along with other non-invasive mapping using, for example,Light Detection and Ranging (LiDAR) (Bewley et al., 2005;Crutchley, 2002), extensive geophysical surveying significantlyenhances our archaeological insight into the Stonehenge landscape(Underhill, 2011). Understanding the detailed pedological varia-tions in the area, however, is less developed. Geological surveys(e.g. Hopson et al., 2006) have characterized the general stratig-raphy of the Salisbury Plain, and soil micromorphological analyseshave supported the identification of prehistoric soil profiles(Macphail and Crowther, 2008). Past research campaigns havealready recognized the importance of soil survey at Stonehenge, assome of these have focussed on the detection of colluvial depositsthat potentially seal archaeological features and contain palae-oenvironmental information (Richards, 1990). However, to dateonly a limited number of depositional environments in the areahave been detected and made available for study (Leivers andMoore, 2008).
The geology of the Stonehenge landscape consists of UpperChalk covered with calcareous drift deposits, loess and occasionalclay-with-flint patches (Canti et al., 2013; Richards, 1990). On top ofthese sediments the most widely present soil types are rendzinas,and silty soils with occasional clay enrichment (argillic brownearths and brown calcareous earths (Richards, 1990)). In these welldrained soils the preservation of sealed or waterlogged deposits isscarce (French, 2003), and within WHS the soil depth is generallylimited. This makes locating colluvial deposits and deeper soilprofiles a methodological challenge, but essential to further un-derstanding of the prehistoric Stonehenge environment.
The more recent land-use at Stonehenge poses a specific set ofproblems when working with geophysical survey data from thesite. In large areas of the landscape, military activities, mainlydating to the first half of the twentieth century, have significantlydisturbed the soil. From firing ranges to the Stonehenge Downairfield south east of Stonehenge, these activities have left behind alarge amount of metal debris in the soil that can ‘pollute’geophysical data (Darvill et al., 2013; Gaffney et al., 2012). Addi-tional magnetic material left behind during music festivals thattook place in the 1970's and�80's, further contributes to such noisein geophysical data (Darvill et al., 2013).
To respond to these site-specific issues, we propose to carry outarea-wide multi-receiver electromagnetic induction (EMI) surveyacross of the Stonehenge landscape. While small scale tests withEMI instruments have been conducted over individual monuments
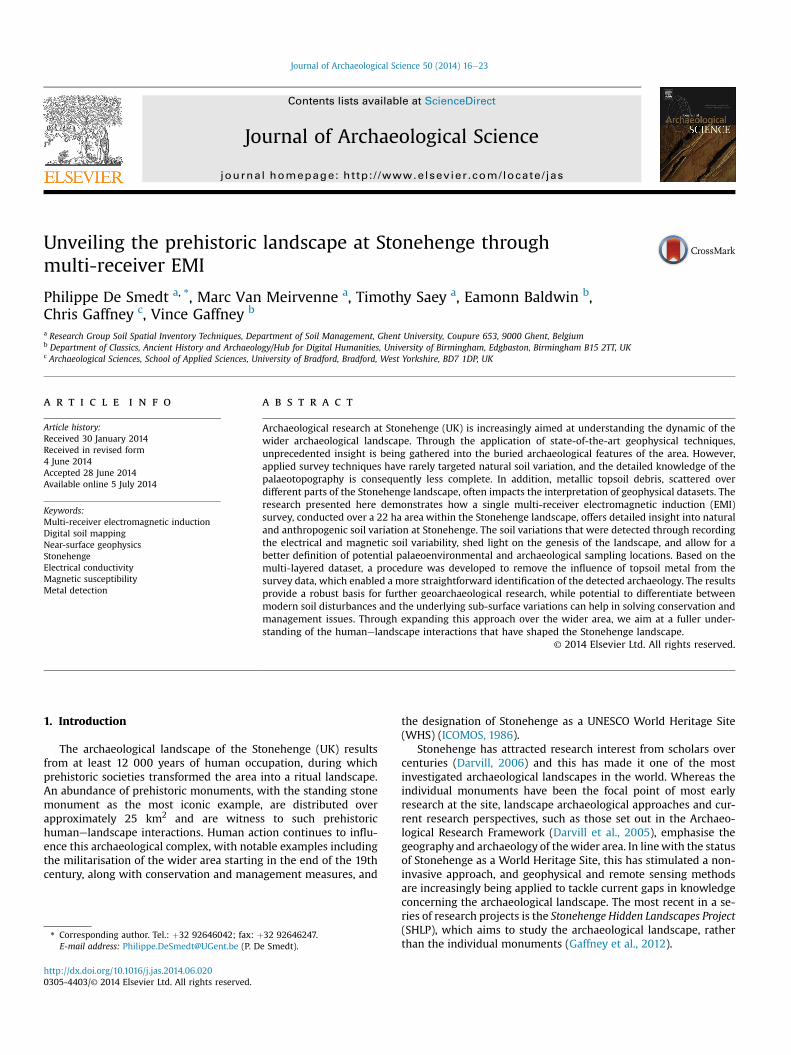
Fig. 1. Satellite image of the core of the Stonehenge World Heritage Site (source: Google EaStonehenge Cursus (B) and the Stonehenge monument (C).
at Stonehenge (Bonsall et al., 2013; Gaffney et al., 2012), large-areaEMI survey has not yet been taken undertaken. Through advancesin soil science and proximal soil sensing (Rossel et al., 2010), EMIsensors have become a very effective tool for mapping soil variationby recording the soil apparent electrical conductivity (sa) (Corwinand Lesch, 2005; Rhoades et al., 1976; Sudduth et al., 2005). Thestrong relationship between sa and soil texture is of particular in-terest as it allows the creation of detailed soil maps based on EMIdata (Saey et al., 2009a). At Stonehenge, this use of geophysical soilmapping can help provide the detailed information needed toreconstruct the palaeotopography of the area, and pinpoint bothpalaeoenvironmental and archaeological sampling locations.
Whereas themain geophysical survey techniques that are used inarchaeology (magnetometry, electrical resistivity and groundpenetrating radar (GPR)) each target only one specific variable, EMIoffers the potential to measure both sa and apparent magneticsusceptibility (ka) simultaneously. This combined registration ofdifferent physical soil variables allows broad insight into theanthropogenic and natural soil variations, thus facilitating an inte-gral geoarchaeological reconstruction (e.g. De Smedt et al., 2013a).Multi-receiver EMI soil sensors further add the potential todiscriminate changes in sa and ka in three dimensions by simulta-neously measuring multiple soil volumes (Saey et al., 2009b). Thishas already enabled the visualization of vertical sa-variations toreconstruct past landforms (De Smedt et al., 2013b; Saeyet al., 2008)and past human environments (De Smedt et al., 2013c).
In September 2012, a multi-receiver EMI survey was undertakento evaluate the technique's potential for mapping anthropogenicand natural subsurface variationswithin the Stonehenge landscape.An area of 22 ha was selected near the western extent of theStonehenge Cursus, where in the 1970s and 1980s camps werepositioned for Stonehenge Free music festival (Fig. 1). The magneticdebris from these festivals leaves magnetometry data plotspeppered with small metallic anomalies that limit the archaeo-logical interpretation of the images (Darvill et al., 2013; Gaffneyet al., 2012). While the use of a multi-receiver instrument offersinsight into the lateral and vertical soil variability, we furtherexamined how the multi-layered EMI dataset can aid in discrimi-nating between recent topsoil debris and the underlying archae-ology. The presented research forms the start of a large-scale EMImapping programme at Stonehenge, whereby a core area of2.5 km2 will be surveyed withmulti-receiver EMI over the course ofthe next three years. In this paper, we present the first survey
P. De Smedt et al. / Journal of Archaeological Science 50 (2014) 16e2318
results with particular focus on the soil variation and the potentialto discriminate recent disturbances from the underlying archae-ology in the study area.
2. Multi-receiver electromagnetic induction
2.1. Instrumentation
We used a multi-receiver EMI instrument that combines onetransmitter coil with four receiver coils that simultaneously recordthe soil sa and ka (Dualem-21S, Dualem, Canada). The receiver coilsare placed in two orientations (horizontal coplanar (HCP) andperpendicular (PRP)) at both 1 m and 2 m from the transmitter(Simpson et al., 2009). Through using different coil orientationswith the same intercoil separation different parts of the mediumunder study can be targeted. Whenmeasuring the soil sa, a PRP coilconfiguration with an intercoil separation of 1 m, will obtain mostinfluence from the upper 30 cm of the measured medium. On theother hand, measuring sa with a HCP coil pair with the sameintercoil separation, the upper part of the medium will affect therecorded signal response in a different manner (McNeill, 1980;Wait, 1962).
While the coil orientationmainly influences the shape of the soilvolume that is taken into account, the separation between trans-mitter and receiver coil influences the size of the measured soilvolume. For sa, a HCP coil pair with a 1 m intercoil separation has adepth of investigation (DOI, defined as the 70% response depth) of1.5 m, an intercoil separation of 2 m increases the DOI of such a coilpair down to 3.2 m below the sensor (Saey et al., 2009b). The depthresponse of the EMI signal differs for the quadrature-phase signalresponse (representative for the sa) and the in-phase signalresponse (proportional to the soil ka), resulting in ka data thatrepresentative for a differently shaped soil volume than sa data ofthe same coil pair (De Smedt et al., 2014; Simpson et al., 2010).Furthermore, in most field conditions the ka data from PRP coilpairs suffer from high-frequency noise, making them difficult tointerpret (De Smedt et al., 2014). For this reason, the PRP ka datahave not been used in this study. The EMI survey thus results in asix-layered dataset where the maximum depth penetration of thesa measurements reaches 3.2 m below the sensor, while the HCP kameasurements have maximum depth response of approximately1.5 m below the sensor.
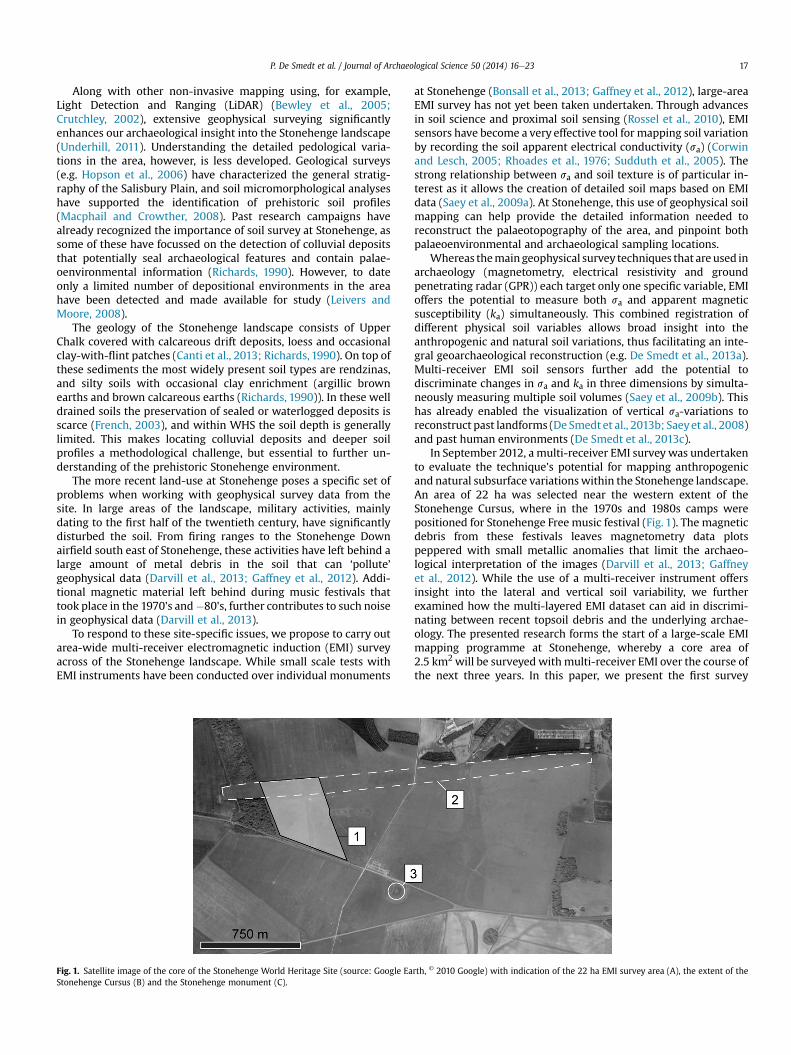
Fig. 2. a) sa data from the 1 m HCP coil configuration showing numerous negative anomalies1 m HCP sa data (Coordinates in metres UTM 30N, WGS 84). The arrows in (a) indicate the
2.2. Survey strategy and data processing
The study area (Fig. 1) was surveyed between the 17th and 21stof September 2012, using a mobile configuration, whereby the EMIsensor was towed behind a quad bike. The use of a differential GPS(dGPS) with an accuracy � 10 cm allowed for real-time georefer-encing, and for the registration of the terrain elevation. EMI mea-surements were taken along parallel lines, 1.2 m apart and driven inalternating directions, with one sampling cycle every 0.25 m. Withthis sampling resolution larger archaeological features were tar-geted, along with the small-scale pedological and geomorpholog-ical variations. Each day, soil temperature was recorded at 30 cmbelow the surface to account for temperature differences in the sadata between survey days (Slavich and Petterson, 1990). Beforeevery survey, a calibration line was driven across the area to correctfor potential measurement drift following Simpson et al. (2009). Ina final step, ordinary kriging (Goovaerts, 1997) was performed tointerpolate the survey data to 0.1 m by 0.1 m raster images.
3. Survey results
3.1. Filtering out metallic topsoil debris
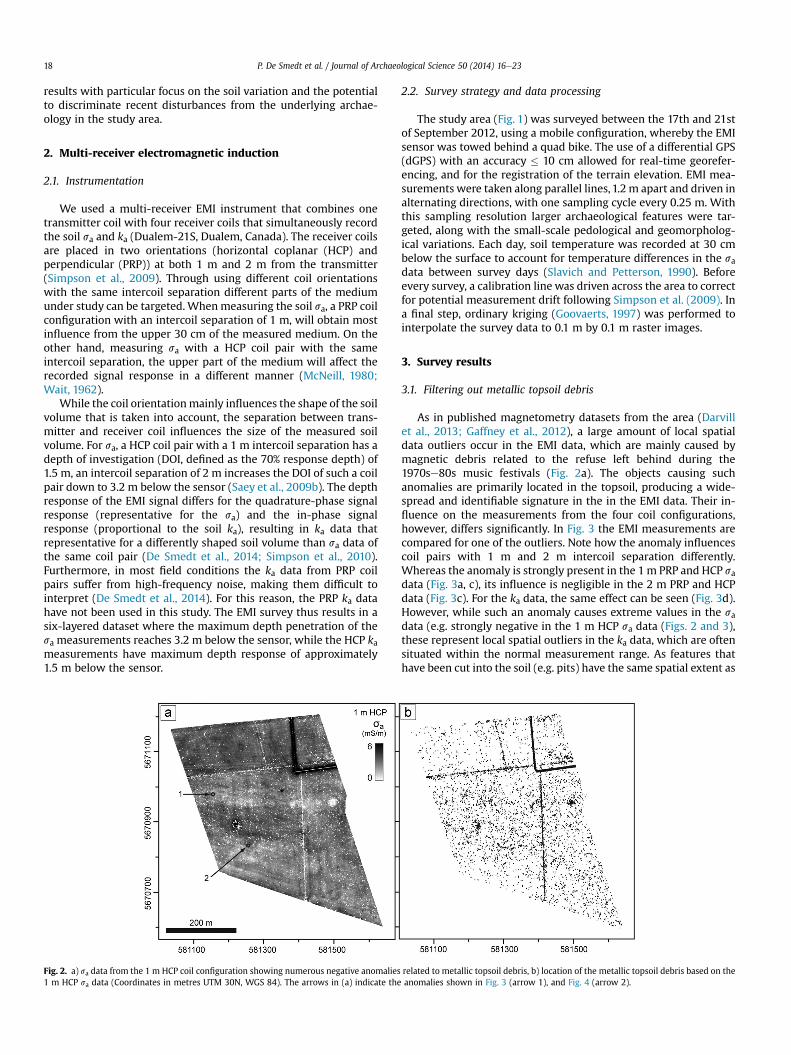
As in published magnetometry datasets from the area (Darvillet al., 2013; Gaffney et al., 2012), a large amount of local spatialdata outliers occur in the EMI data, which are mainly caused bymagnetic debris related to the refuse left behind during the1970se80s music festivals (Fig. 2a). The objects causing suchanomalies are primarily located in the topsoil, producing a wide-spread and identifiable signature in the in the EMI data. Their in-fluence on the measurements from the four coil configurations,however, differs significantly. In Fig. 3 the EMI measurements arecompared for one of the outliers. Note how the anomaly influencescoil pairs with 1 m and 2 m intercoil separation differently.Whereas the anomaly is strongly present in the 1m PRP and HCP sadata (Fig. 3a, c), its influence is negligible in the 2 m PRP and HCPdata (Fig. 3c). For the ka data, the same effect can be seen (Fig. 3d).However, while such an anomaly causes extreme values in the sadata (e.g. strongly negative in the 1 m HCP sa data (Figs. 2 and 3),these represent local spatial outliers in the ka data, which are oftensituated within the normal measurement range. As features thathave been cut into the soil (e.g. pits) have the same spatial extent as
related to metallic topsoil debris, b) location of the metallic topsoil debris based on theanomalies shown in Fig. 3 (arrow 1), and Fig. 4 (arrow 2).
Fig. 3. Comparison of the influence of a metal-induced anomaly on the EMI mea-surements. The position of the transect is shown over the 1 m HCP sa data (a) and kadata (b) plots. In (c) the sa data from each coil configuration are compared along thistransect, d) shows the ka data from the 1 m and 2 m HCP coil pairs along the transect.The location of the anomaly is indicated on Fig. 2a (arrow 1).
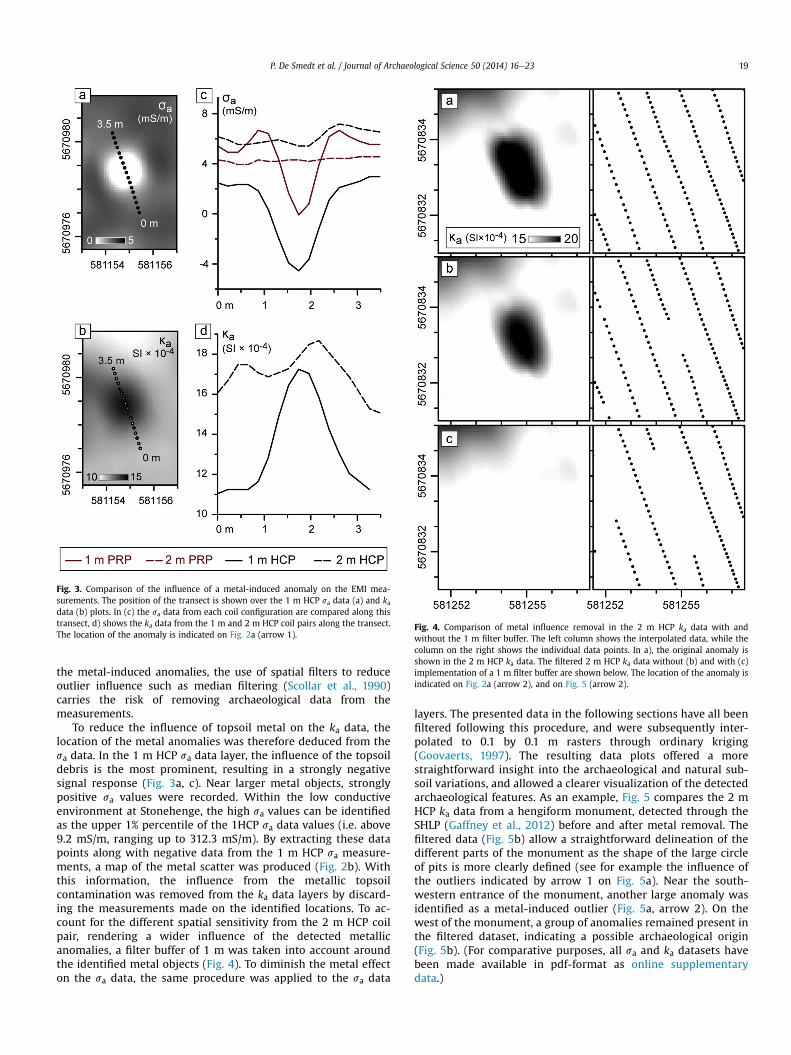
Fig. 4. Comparison of metal influence removal in the 2 m HCP ka data with andwithout the 1 m filter buffer. The left column shows the interpolated data, while thecolumn on the right shows the individual data points. In a), the original anomaly isshown in the 2 m HCP ka data. The filtered 2 m HCP ka data without (b) and with (c)implementation of a 1 m filter buffer are shown below. The location of the anomaly isindicated on Fig. 2a (arrow 2), and on Fig. 5 (arrow 2).
P. De Smedt et al. / Journal of Archaeological Science 50 (2014) 16e23 19
the metal-induced anomalies, the use of spatial filters to reduceoutlier influence such as median filtering (Scollar et al., 1990)carries the risk of removing archaeological data from themeasurements.
To reduce the influence of topsoil metal on the ka data, thelocation of the metal anomalies was therefore deduced from thesa data. In the 1 m HCP sa data layer, the influence of the topsoildebris is the most prominent, resulting in a strongly negativesignal response (Fig. 3a, c). Near larger metal objects, stronglypositive sa values were recorded. Within the low conductiveenvironment at Stonehenge, the high sa values can be identifiedas the upper 1% percentile of the 1HCP sa data values (i.e. above9.2 mS/m, ranging up to 312.3 mS/m). By extracting these datapoints along with negative data from the 1 m HCP sa measure-ments, a map of the metal scatter was produced (Fig. 2b). Withthis information, the influence from the metallic topsoilcontamination was removed from the ka data layers by discard-ing the measurements made on the identified locations. To ac-count for the different spatial sensitivity from the 2 m HCP coilpair, rendering a wider influence of the detected metallicanomalies, a filter buffer of 1 m was taken into account aroundthe identified metal objects (Fig. 4). To diminish the metal effecton the sa data, the same procedure was applied to the sa data
layers. The presented data in the following sections have all beenfiltered following this procedure, and were subsequently inter-polated to 0.1 by 0.1 m rasters through ordinary kriging(Goovaerts, 1997). The resulting data plots offered a morestraightforward insight into the archaeological and natural sub-soil variations, and allowed a clearer visualization of the detectedarchaeological features. As an example, Fig. 5 compares the 2 mHCP ka data from a hengiform monument, detected through theSHLP (Gaffney et al., 2012) before and after metal removal. Thefiltered data (Fig. 5b) allow a straightforward delineation of thedifferent parts of the monument as the shape of the large circleof pits is more clearly defined (see for example the influence ofthe outliers indicated by arrow 1 on Fig. 5a). Near the south-western entrance of the monument, another large anomaly wasidentified as a metal-induced outlier (Fig. 5a, arrow 2). On thewest of the monument, a group of anomalies remained present inthe filtered dataset, indicating a possible archaeological origin(Fig. 5b). (For comparative purposes, all sa and ka datasets havebeen made available in pdf-format as online supplementarydata.)
Fig. 5. Comparison of the anomalies detected at the hengiform monument (seeGaffney et al., 2012) as seen in the 2 m HCP ka data before (a) and after (b) metalremoval. In (a), two anomalies are indicated that were related to the metal topsoildebris, in (b) a group of anomalies are indicated that remained present in the filtereddata, which suggest the presence of pits.
Fig. 6. The 2 m PRP sa data, representative for the soil variation between 0 me1 mbelow the sensor (a). The variation shows a central chalk ridge (A) bordered by moreconductive soil in the north and south. In the north two circular anomalies are indi-cated (B) that are related to grassland fungi. In (b) the 1 m HCP ka data are shown,revealing possible palaeochannel deposits in the south of the area (C). Further mag-netic anomalies include large linear features within the boundaries of the Cursus (D),and two circular anomalies that possibly indicate ploughed barrow monuments (E).
P. De Smedt et al. / Journal of Archaeological Science 50 (2014) 16e2320
3.2. Natural soil variation and modern soil disturbance
The natural subsurface variations are most clearly visible in the2mPRPsa data, representing a soil volumebetween0me1mbelowthe sensor, indicating that most variability is situated within thisdepth range. As sa informsmainly on soil texture (Saeyet al., 2009a),the variations seenhere canbe attributed to thedepthof the shallowchalk bedrock, visible as resistive zones, and the overlying moreconductive silty soil. Where soil thickness increases, a higher sa isattested.Most prominent is the broad band of low sa values runningeast-west through the area, indicating a shallow chalk ridge (A onFig. 6a). In the south, low sa values also show shallow bedrock, buthere an irregular pattern of high and low conductivities further in-dicates chalk weathering patterns and the infilling of cracks anddepressions in the chalk bedrock with more conductive soil. Inaddition to the large-scale variability, two circular anomalies weredetected inside the Cursus (B on Fig. 6a). Thesewere identified as thesubsurface expression of naturally formed rings of grassland fungi(‘fairy rings’) resulting in a detectable increase in soil organicmattercontent or aggregate formation.
The chalk morphology and soil variation have almost no influ-ence in the ka data. However, in the south of the study area, a bandof increased magnetic susceptibility indicates magnetic sedimentsthat are likely related to accumulated organic matter (C on Fig. 6b).
The topographical position of this anomaly points to a fluvial origin,suggesting that these sediments are organic enriched palae-ochannel infillings.
The ka data further show the impact of modern land-use on thepreservation of the Stonehenge heritage. Numerous lines run in aneast-west and north-south direction through the area, some ofwhich were already located through Ordnance Survey maps and
P. De Smedt et al. / Journal of Archaeological Science 50 (2014) 16e23 21
historical aerial photography (Amadio and Bishop, 2010), and mostlikely testify of former ploughing and field drains. These mainlyseem to affect the subsurface archaeology as the lines do not crossthe monuments that remain present above ground level.
3.3. Archaeology
Anomalies indicating archaeological features are attested inboth the sa and ka data, and can be discerned the clearest in the 1 mPRP sa and 2 m HCP ka measurements (Fig. 7). Features that aremost apparent in the sa data include the Cursus ditch in the north ofthe site, and the annular anomalies related to known crop marksand barrow monuments (Crutchley, 2002; Gaffney et al., 2012). Inthe south of the survey area, a number of small conductiveanomalies of unknown origin were detected. However, for sometheir location suggests a correlation to known monuments (seebelow). Within the boundaries of the Cursus, strongly conductiveanomalies indicate pits and linear features (Figs. 6a and 7a B), anumber of which were attested in previous geophysical surveys(Darvill et al., 2013; Gaffney et al., 2012).
The soil perturbations inside the Cursus are clearly visible in theka data, where apart from the various pit-like anomalies (Figs. 6band 7b C), the linear traces show as non-magnetic anomalies(Figs. 6b and 7b C). Overall, the ka data allow for the moststraightforward interpretation of the archaeological variationswithin the area. The 2 m HCP ka data allow the clearest delineationof the detected anomalies. As an example we present the hengi-form monument that was detected at monument Amesbury 50(Figs. 5 and 7b F) (Gaffney et al., 2012). Even with the rather coarsesampling density, the interior structure of the feature can be dis-cerned. Traces of at least one ring of pits can be identified, encircledby a large segmented ditch. Additional variationwas detected in thecentre of the feature, but further analysis of this variation requires adenser sampling resolution. Throughout the area, the knownbarrowmonuments are clearly defined in the ka data. For some, theinternal structure becomes apparent, along with smaller featuressurrounding the monuments. Examples include three small mag-netic anomalies around the central barrow (known as Amesbury49) (Fig. 7b E), and the magnetic anomaly in the middle of thecircular barrow ditch.
Fig. 7. The 1 m PRP sa data (a), and the 2 m HCP ka data (b) with a detail of the small causenorth of the area the different barrow monuments can clearly be discriminated in the centrein the south of the field (A), and within the Cursus boundaries (e.g. B). In (b), the most characinside the Cursus monument, the annular and round anomalies related to barrowmonumentmonuments (G) and the hengiform monument (F) located at the site of Amesbury 50.
Between the two southernmost barrows two large magneticanomalies can be seen in alignment with these monuments (Fig. 7bG). As the anomalies occur in several of the EMI datasets (e.g. 1 mHCP sa (Fig. 2a), 1 m HCP ka (Fig. 6b)), these could indicate severelyploughed-out barrows. This hypothesis is supported by the inter-section of the westernmost anomaly by one of the linear soil dis-turbances, which shows that the anomaly predates this modern soilfeature.
In the south of the study area, a segmented ditch, known asAmesbury 115, shows up as a concentration of highly susceptibleanomalies (Fig. 7c). This annular feature, which has been identifiedin the 1940s through aerial photography (Amadio and Bishop,2010), can be seen in the ka data as a six-segment causewayed ditch.
4. Discussion
4.1. Discriminating recent soil alterations and metal removal
The procedure to remove the signal produced by topsoil metalfrom the EMI datasets presented here, offers a straightforwardmeans to discriminate between recent metallic topsoil debris andunderlying soil variability. This method provides a solution in areaswhere similar metallic debris is present in the topsoil from recentactivities (see for example the issue ofmetal contamination in greenwaste compost raised by former UK environment minister Benyon(Quinault, 2012)), which are often deemed unsuited for geophysicalprospecting due to the large amount of metallic anomalies. AtStonehenge, the resultingmapof themetallic anomalies can be usedto improve the discrimination of targeted features in the magne-tometry datasets that are already available (Darvill et al., 2013;Gaffney et al., 2012). Through combining the topsoil metal loca-tions with the linear modern soil intrusions that were attestedthroughout the entire survey area, a map can be produced of themodern subsurface disturbances (Fig. 8). Such information can thenbe used in solving site management and conservation issues.
4.2. Geoarchaeological soil variation
The combined analysis of current elevation and the natural soilvariation of the study area (Fig. 9a), indicates a palaeotopography
wayed ditch (Amesbury 115) shown in (c). In (a), apart from the Cursus ditches in theof the field. Small conductive anomalies that could be related to archaeology are foundteristic ka-anomalies are; the pit-like anomalies (C) and the linear features (D) detectedAmesbury 49 (E), two traces of possible ploughed barrows aligned between the known
Fig. 8. Modern soil disturbance and metal contamination within the survey area basedon the EMI data.
P. De Smedt et al. / Journal of Archaeological Science 50 (2014) 16e2322
that differs from the current relief. The central shallow chalk ridge,bordered in the north and south by thicker layers of silty soiloverlying the chalk bedrock, is a witness to the erosion of overlyingsilty soil. In the south of the site, the chalk again becomes moredominant as the steep southern slope boosts soil erosion. At thebottom of this hillside, the palaeochannel segment further in-dicates past transportation of runoff and eroded sediments towardsthe east. This southern part of the study area is a potential samplinglocation for deposits harbouring palaeoenvironmental information.However, coring would be required to verify the hypothesis anddetermine the detailed stratigraphy of the feature.
Adding the detected archaeological variation to the soil mapallows a preliminary overview of the geoarchaeological soil
Fig. 9. a) Soil map derived from the sa data with indication of the palaeochannel (black dash84). b) Overview of the detected geoarchaeological variability, showing the soil variation andknown barrow monuments Amesbury 48 (A) and 49 (B), two possible ploughed barrowmoninside the Cursus, a causewayed ditch and adjoining anomalies near the south-west of thAmesbury 50 (I).
variation (Fig. 9b). The most prominently situated features withinthe area are the central barrows (Amesbury 48 and 49; A and B onFig. 9b), with two possible ploughed-out barrow monuments(Fig. 9b, C) aligned between them, following the central chalk ridgeand the current topography. The presence of ploughed-out barrowsat these locations is further supported by the slight elevation thatwas attested at the location of each anomaly. In addition, the ex-istence of one such feature has already been suggested through theStonehenge WHS Landscape Project (Amadio and Bishop, 2010).
The Cursus ditches and associated banks are recurrent featuresthroughout the EMI data layers (D on Fig 9b). Through reducing theinfluence of metal in the EMI survey data, a better distinction couldbe made between the topsoil noise and anomalies indicating pastsoil intrusions (pits). The location of themost characteristic of thesepits is shown in Fig. 9b (E). The linear anomalies within the Cursusboundaries (F on Fig. 9) seem to be associated with some of thedetected pits and intersect the Cursus bank. However, the origin ofthese features remains unknown.
In the southern part of the study area, the combination of sa andka data over Amesbury 115 supports the presumed existence of asouth-western entrance of the monument (Amadio and Bishop,2010), as conductive anomalies suggest the presence of associatedfeatures adjoining the segmented ditch (Fig. 9b, G). Through vali-dation of these anomalies and detailed analysis of the bedrockmorphology, the presence of a south-eastern entrance for Ames-bury 115 could be investigated further. In addition, the presence ofthe nearby palaeochannel segment could prove to have beeninstrumental in choosing the location of this monument.
5. Conclusions
The results presented here demonstrate how a wealth of infor-mation on past and present soil variations at Stonehenge can beobtained through a single multi-receiver EMI survey. In addition,the methodology to remove the influence of topsoil metal on theEMI data overcame the masking effect of topsoil debris on sub-surface features. This provides a solution to outstanding issues ingeophysical surveying within the Stonehenge landscape (Darvillet al., 2013; Gaffney et al., 2012), as this procedure can be imple-mented when using or interpreting other geophysical datasets. The
ed line) attested in the ka data, and plotted elevation contours (elevation in metres WGSthe location of the most characteristic anomalies indicating archaeology. These include;uments (C), the Cursus ditches and adjacent banks (D), pits (E) and linear anomalies (F)e structure (G), several small ditch-like anomalies (H), the hengiform monument at
P. De Smedt et al. / Journal of Archaeological Science 50 (2014) 16e23 23
multi-layered EMI dataset also enabled discriminating betweendifferent types of natural and anthropogenic soil variation withinthe study area. In this respect, the potential to identify the mostsignificant data layers from this dataset, based on specific researchquestions, makes multi-receiver EMI a particularly versatile tool ingeoarchaeological research. The mapped natural soil variabilityprovides an insight into the palaeotopography of the area, whichwill facilitate the identification of potential archaeological andpalaeoenvironmental sampling locations. Modern soil disturbanceswere also identified, along with the remnants of flattened earth-works, showing how EMI can contribute to unveiling andmanagingthe archaeology within the Stonehenge landscape. The simulta-neous investigation of shallow and deeper soil layers through amulti-receiver EMI instrument has further allowed for the clearerdelineation of archaeological features in the chalkland environ-ment, and emphasises the value of discriminating betweendifferent soil volumes.
It has been proven that detailed geophysical soil mapping im-proves our knowledge of the Stonehenge environment, and offersan insight into the genesis of the current landscape. While invasivevalidation (e.g. coring) remains necessary, the results provide arobust basis for further geoarchaeological research. Throughexpanding this approach over a wider area, another significant stepcan be taken towards understanding the complex humaneland-scape interactions that have shaped the Stonehenge landscape.
Acknowledgements
The presented research was partly conducted in the frameworkof a post-doctoral research grant (number: FWO13/PDO/046) pro-vided to Philippe De Smedt by the Research Foundation Flanders(FWO). The research was carried out in collaboration with the UKteam of the Ludwig Boltzmann Institute for Archaeological Pro-spection and Virtual Archaeology (archpro.lbg.ac.at), which isbased on an international cooperation of the Ludwig BoltzmannGesellschaft (A), the University of Vienna (A), the Vienna Universityof Technology (A), ZAMG-the Austrian Central Institute for Mete-orology and Geodynamic (A), the Province of Lower Austria (A),RGZM-the Roman-Germanic Central Museum Mainz (D), RA€A-Swedish National Heritage Board (S), IBM VISTAeUniversity ofBirmingham (UK) and NIKU-Norwegian Institute for Cultural Her-itage Research (N). We would like to thank the landowners of thearea we surveyed, the National Trust. We would also like to thankValentijn Van Parys for his invaluable contribution to the fieldwork.
Appendix A. Supplementary data
Supplementary data related to this article can be found at http://dx.doi.org/10.1016/j.jas.2014.06.020.
References
Amadio, L., Bishop, S., 2010. Stonehenge World Heritage Site Landscape Project. TheCursus Barrows & Surrounding Area (English Heritage Archaeological Report85). English Heritage, Portsmouth.
Bewley, R., Crutchley, S.P., Shell, C.A., 2005. New light on an ancient landscape; lidarsurvey in the Stonehenge World Heritage Site. Antiquity 79, 636e647.
Bonsall, J., Fry, R., Gaffney, C., Armit, I., Beck, A., Gaffney, V., 2013. Assessment of theCMD Mini-Explorer, a new low-frequency multi-coil electromagnetic Device,for archaeological investigations. Archaeol. Prospect. 20, 219e231.
Canti, M., Campbell, G., Greaney, S., 2013. Stonehenge, Wiltshire. Stonehenge WorldHeritage Site Synthesis: Prehistoric Landscape, Environment and Economy(English Heritage Archaeological Report 45). English Heritage, Portsmouth.
Crutchley, S.P., 2002. Stonehenge Word Heritage Site Mapping Project (EnglishHeritage Aerial Survey Report Series 15). English Heritage, Swindon.
Darvill, T., 2006. Stonehenge. The Biography of a Landscape. Tempus PublishingLimited, Gloucestershire.
Darvill, T., Constant, V., Milner, E., Bender, B., Chan, B., Chandler, J., Crutchley, S.,David, A., Field, D., Pearson, M.P., Ruggles, C., Woodward, A., 2005. StonehengeWorld Heritage Site: an Archaeological Research Framework. English Heritageand Bournemounth University, London and Bournemouth.
Darvill, T., Lüth, F., Rassmann, K., Fischer, A., Winkelmann, K., 2013. Stonehenge,Wiltshire, UK: high resolution geophysical surveys in the surrounding land-scape, 2011. Eur. J. Archaeol. 16, 63e93.
De Smedt, P., Saey, T., Lehouck, A., Stichelbaut, B., Meerschman, E., Islam, M.M., VanDe Vijver, E., Van Meirvenne, M., 2013a. Exploring the potential of multi-receiver EMI survey for geoarchaeological prospection: a 90 ha dataset. Geo-derma 40, 1260e1267.
De Smedt, P., Van Meirvenne, M., Davies, N.S., Bats, M., Saey, T., De Reu, J.,Meerschman, E., Gelorini, V., Zwertvaegher, A., Antrop, M., Bourgeois, J., DeMaeyer, P., Finke, P.A., Verniers, J., Cromb�e, P., 2013b. A multidisciplinaryapproach to reconstructing Late Glacial and Early Holocene landscapes.J. Archaeol. Sci. 40, 1260e1267.
De Smedt, P., Van Meirvenne, M., Herremans, D., De Reu, J., Saey, T., Meerschman, E.,Cromb�e, P., De Clercq, W., 2013c. The 3-D reconstruction of medieval wetlandreclamation through electromagnetic induction survey. Sci. Rep. 3, 1e5.
De Smedt, P., Saey, T., Meerschman, E., De Reu, J., De Clercq, W., Van Meirvenne, M.,2014. Comparing apparent magnetic susceptibility measurements of a multi-receiver EMI sensor to topsoil and profile magnetic susceptibility data overweak magnetic anomalies. Archaeol. Prospect. 21, 103e112.
French, C., 2003. Geoarchaeology in Action. Studies in Soil Micromorphology andLandscape Evolution. Routledge, New York.
Gaffney, C., Gaffney, V., Neubauer, W., Baldwin, E., Chapman, H., Garwood, P.,Moulden, H., Sparrow, T., Bates, R., L€ocker, K., Hinterleitner, A., Trinks, I., Nau, E.,Zitz, T., Floery, S., Verhoeven, G., Doneus, M., 2012. The stonehenge hiddenlandscapes project. Archaeol. Prospect. 19, 147e155.
Goovaerts, P., 1997. Geostatistics for Natural Resources Evaluation. Applied Geo-statistics Series. Oxford University Press, New York, USA.
ICOMOS, 1986. World Heritage List N� 373. International Council on Monumentsand Sites, Paris.
Leivers, M., Moore, C., 2008. Archaeology on the A303 Stonehenge Improvement.Trust for Wessex Archaeology Ltd.
Macphail, R.I., Crowther, J., 2008. Appendix 1: soil. In: Leivers, M., Moore, C. (Eds.),Archaeology on the A303 Stonehenge Improvement. Wessex Archaeology,Wessex, pp. 1e24.
Saey, T., Simpson, D., Vitharana, U.W.A., Vermeersch, H., Vermang, J., VanMeirvenne, M., 2008. Reconstrucing the paleotopography beneath the loesscover with the aid of an electromagnetic induction sensor. Catena 74, 58e64.
Saey, T., Van Meirvenne, M., Vermeersch, H., Ameloot, N., Cockx, L., 2009a.A pedotransfer function to evaluate the soil profile textural heterogeneity usingproximally sensed apparent electrical conductivity. Geoderma 150, 389e395.
Saey, T., Simpson, D., Vermeersch, H., Cockx, L., Van Meirvenne, M., 2009b.Comparing the EM38DD and Dualem-21S sensors for depth-to-clay mapping.Soil. Sci. Soc. Am. J. 73, 7e12.
Scollar, I., Tabbag, A., Hesse, A., Herzog, I., 1990. Archaeological Prospecting andRemote Sensing. Topics in Remote Sensing. Cambridge University Press,Cambridge.
Simpson, D., Van Meirvenne, M., Lück, E., Rühlmann, J., Saey, T., Bourgeois, J., 2010.Sensitivity of multi-coil frequency domain electromagnetic induction sensors tomap soil magnetic susceptibility. Eur. J. Soil. Sci. 61, 469e478.
Simpson, D., Van Meirvenne, M., Saey, T., Vermeersch, H., Bourgeois, J., Lehouck, A.,Cockx, L., Vitharana, U.W.A., 2009. Evaluating the multiple coil configurations ofthe EM38DD and DUALEM-21S sensors to detect archaeological anomalies.Archaeol. Prospect. 16, 91e102.
Slavich, P., Petterson, G., 1990. Estimating average rootzone salinity from electro-magnetic induction (EM-38) measurements. Aust. J. Soil. Res. 28, 453e463.
Sudduth, K.A., Kitchen, N.R., Wiebold, W.J., Batchelor, W.D., Bollero, G.A.,Bullock, D.G., Clay, D.E., Palm, H.L., Pierce, F.J., Schuler, R.T., Thelen, K.D., 2005.Relating apparent electrical conductivity to soil properties across the north-central USA. Comput. Electron. Agric. 46, 263e283.
Underhill, W., 2011. Putting Stonehenge in its place. Sci. Am. 304, 48e53.Wait, J.R., 1962. A note on the electromagnetic response of a stratified earth.