Received: 30 May 2012 – Published in Atmos. Chem. Phys. Discuss.: 24 July 2012Revised: 13 October 2012 – Accepted: 5 November 2012 – Published: 26 November 2012
Abstract. China is the largest anthropogenic mercury emitterin the world, where primary nonferrous metal smelting is re-garded as one of the most significant emission sources. In thisstudy, atmospheric mercury emissions from primary zinc,lead and copper smelters in China between 2000–2010 wereestimated using a technology-based methodology with com-prehensive consideration of mercury concentration in con-centrates, smelting processes, mercury removal efficienciesof air pollution control devices (APCDs) and the applica-tion percentage of a certain type of APCD combinations. Ourstudy indicated that atmospheric mercury emissions fromnonferrous metal smelters in 2000, 2003, 2005, 2007 and2010 were 67.6, 100.1, 86.7, 80.6 and 72.5 t, respectively. In2010, the amounts of mercury emitted into atmosphere were39.4 ± 31.5, 30.6 ± 29.1, and 2.5 ± 1.1 t from primary zinc,lead and copper smelters, respectively. The largest amountof mercury was emitted from the Gansu province, followedby Henan, Yunnan, Hunan, Inner Mongolia and Shaanxiprovinces. Hg2+, Hg0 and Hgp emissions from zinc smelterswere 25.6, 11.8 and 1.97 t, respectively. The emissions per-centages of Hg2+ and Hg0 were almost the same from leadand copper smelters. The average mercury removal efficiencywas 90.5 ± 52.5 %, 71.2 ± 63.7 % and 91.8 ± 40.7 % in zinc,lead, and copper smelters, respectively.
1 Introduction
Studies on atmospheric mercury emissions from majorsources have been intensively carried out in the past severalyears due to the worldwide concern about mercury contam-ination (Strode et al., 2009; Li et al., 2009, 2010; Lin et al.,
2010; Wu et al., 2010; Tian et al., 2010, Kocman and Pacyna,2011; Fukuda et al., 2011). Nonferrous metal smelting is be-lieved to be one of the most significant anthropogenic mer-cury emission sources. Global atmospheric mercury emis-sions from nonferrous metal smelters in 2007 reached 310 t,of which about 203 t were emitted from China. Atmosphericmercury emission from Chinese nonferrous metal smelterswas estimated to be 9 % of the total global anthropogenicemissions (Streets et al., 2005; Wu et al., 2006; Hylander andHerbert, 2008; Pirrone et al., 2010; Wang et al., 2010).
The main factors affecting atmospheric mercury emissionsfrom nonferrous metal smelters include the mercury concen-tration in ore concentrate, smelting technology, the type ofAPCD combination applied and the application percentageof a certain type of APCD combinations. Current inventoriesreflecting atmospheric mercury emissions from China’s zinc,lead and copper smelters are subject to high uncertainty dueto the following reasons: first, the range of mercury contentof global ore concentrates was reported too vague and thereare few data about mercury concentration in Chinese concen-trates. Global results concerning mercury content in concen-trates from Brook Hunt and Associates Ltd. indicated thatthe maximum concentrations are 6000, 325 and 1500 g t−1
for zinc, lead and copper concentrates, respectively, whilethe minima are all less than 1 g t−1 (Hylander and Herbert,2008). However, no data about China’s mines were noted inthis report. Streets et al. (2005) reported that mercury con-centration in Chinese zinc concentrates varied from less than1 g t−1 to more than 1000 g t−1. Yin et al. (2012) pointed outthat such a wide range depended on the ore types and theirgeneses. Data about mercury concentration in Chinese leadand copper concentrates are scarce.
Published by Copernicus Publications on behalf of the European Geosciences Union.
11154 Q. R. Wu et al.: Update of mercury emissions
Secondly, in most previous studies, an average emissionfactor was used to estimate emissions, which did not con-sider the removal effect of APCDs. Hylander and Herbert(2008) pointed out the synergic effect of APCDs, but themercury removal efficiencies in their paper were estimatedon the basis of sulfur abatement technology. About 95 % ofgaseous mercury was removed from flue gas in zinc/leadsmelters with sulfuric acid plants, and no mercury removaltower (Hylander and Herbert, 2008). However, such kind ofassumption neglected the different removal efficiencies ofvarious types of sulfuric acid plant. Field measurements con-ducted in China’s zinc, lead and copper smelters indicatedthe total mercury removal efficiency for zinc/lead smelterswith double-contact sulfuric acid plants and no mercury re-moval tower is over 99 % while mercury removal efficiencyis only 89 % for Zn/Pb smelters with single-contact sulfuricacid plants (Li et al., 2010; Wang et al., 2010; Zhang et al.,2012). In this study, these updated removal efficiencies ofAPCDs will be used for emission estimation.
Thirdly, various smelting processes and APCDs are usedin China’s smelters and they have been improved in the pastdecade because of the stringent regulations for environmen-tal protection. Therefore, the emission factors used in pre-vious studies will not apply to the current situation sincethe application percentage of the types of APCD combi-nations in smelters has been undergoing change. Streets etal. (2005) adopted the average mercury emission factors of86.6, 43.6 and 9.6 g t−1 for zinc, lead and copper, respec-tively, mainly based on the average mercury concentrationin concentrates without consideration of APCDs. Hylanderand Herbert (2008) estimated the emission factors of 16.61,14.91 and 6.72 g t−1 for zinc, lead and copper smelters, re-spectively, in the global inventory of 2005 for China’s non-ferrous metal smelters. However, the increased applicationpercentage of acid plants after 2005 indicates that these emis-sion factors are not presently applicable to China.
In this paper, nationwide as well as imported concentrateshave been sampled and analyzed for mercury content. Up-to-date mercury removal efficiencies in the existing literaturehave been summarized and applied. Moreover, informationon smelting technologies as well as APCDs has been inves-tigated throughout China. A technology-based method withcomprehensive consideration of the above factors is used toestimate atmospheric mercury emissions from primary zinc,lead and copper smelters in China between 2000–2010.
2 Methodology
Various smelting processes are used in China’s nonferrousmetal smelters. Zinc smelting processes include oxygen pres-sure leaching process (OPLP), electrolytic process (EP),imperial smelting process (ISP), retort zinc smelting pro-cess (RZSP), electric zinc furnace (EZF), and artisanal zincsmelting process (AZSP). There is no atmospheric mer-
cury emission from OPLP since it is a hydrometallurgicalprocess and mercury in ore concentrates is released intowater or solid waste. Lead smelting processes can be di-vided into four major types: rich-oxygen pool smelting pro-cess (RPSP), imperial sinter process (ISP), sinter machineprocess (SMP), and sinter pan or pot process (SPP). Cop-per smelting processes include flash furnace smelting pro-cess (FFSP), rich-oxygen pool smelting process (RPSP), im-perial furnace smelting process (IFSP), roasting-leaching-electrolyzing process (RLEP) as well as the outdated tech-nologies that were forbidden by the Chinese governmentsuch as electric furnace smelting process (EF) and the rev-elatory furnace smelting process (RF).
In all the above processes, although additives such asquartz stone and limestone also contain limited mercury, oreconcentrate is the main source of mercury input. Mercury in-put Q for smelters withj technology ini province can becalculated using the following equations.
Qij = [Hg]com,ijCcom,ij (1)
[Hg]com,ij =
∑k [Hg]su,k→ijCsu,k→ij∑
k Csu,k→ij
(2)
Ccom,ij =
∑kCsu,k→ij (3)
where [Hg]com,ij and Ccom,ij are mercury content andamount of the ore concentrates consumed byj technology ini province. [Hg]com,ij is calculated based on mercury contentin the concentrates supplied byk province and concentratestrade between provinces (see Eq. 2). In Eq. (2), [Hg]su,k→ij
andCsu,k→ij are mercury content and supply of ore concen-trates produced ink province that are transported toj tech-nology in i province for smelting. The value of [Hg]su,k→ij
is from our own survey results. The survey was conducted inChina’s main ore mineral and smelting plants. The numberof sampling mines (see Table S1), and sampling, preparationand analysis methods are described in the supplementary ma-terial. Geometric mean of all mines was used to represent na-tional mercury content since the distribution of mercury con-tent meets the skewed distribution (see Table 1 and Fig. S1).Most concentrates have low mercury content, typically lessthan 10 g mercury t−1 copper concentrates, or 20 g mercuryt−1 zinc/lead concentrates (see Table 1 and Fig. S1). Thetransportation dataCsu,k→ij between provinces were basedon the trade between ore mineral plants and 244 smeltersin our investigation (see Tables S2, S3, S4). The value of[Hg]com,ij is listed in Table 1, and Fig. 1.Ccom,ij is calcu-lated according to Eq. (3). The value ofCcom,ij is shown inTables S2, S3, and S4.
Based on the mercury content and amount of concentratesconsumed in each province, the weighted national average ofmercury content of zinc, lead and copper concentrates con-sumed by China’s smelters in 2010 was 40.27, 20.03 and
Q. R. Wu et al.: Update of mercury emissions 11155
Fig. 1. Mercury concentration in concentrates consumed bysmelters.
2.25 g t−1, respectively, according to Eq. (4), while the corre-sponding results are 47.02, 16.81 and 2.82 g t−1, respectively,in 2005.
[Hg] =
∑i
∑j [Hg]com,ijCcom,ij∑
i
∑j Ccom,ij
(4)
Mercury in ore concentrates is released in the form ofgaseous mercury during pyrometallurgical extraction pro-cessing ,and a portion is captured by APCDs and trans-ferred to waste water, acid or fly ash. Usually, pyromet-allurgical extraction of nonferrous metals from concentraterequires dehydration, smelting/roasting, extraction and re-claiming/refining (Fig. 2). Total atmospheric mercury emis-sions from one smelter include the sum of emissions fromthe above four procedures. Mercury emission from smeltingflue gas, excluding overflow flue gas, is termed as the pri-mary flue gas emission (Ep). Mercury emission from dehy-dration, overflow, extraction and refining/reclaiming flue gasis regarded as other emissions (Eo). The atmospheric mer-cury emissions for smelters withj technology ini provincecan be calculated with the following equation.
Eij = Ep,ij + Eo,ij (5)
The mercury removal effect of APCDs has been proved inprevious studies (Wang et al., 2010; Li et al., 2010; Zhanget al., 2012). Generally, APCDs for primary flue gas in mostnonferrous metal smelters consist of dust collectors (DC) in-cluding cyclone dust collector, waste heat boiler, electrostaticprecipitator and fabric filter (or their combination), flue gasscrubber (FGS), electrostatic demister (ESD), mercury re-claiming tower (MRT), and conversion and absorption tower(CAT). The CAT may be a double conversion double absorp-tion (DCDA) tower or a single conversion single absorption(SCSA) tower. Usually, the above APCDs combined into 7
Fig. 2.Flow diagram for nonferrous metal smelters.
types used in smelters (Table 2). The information about thetype APCD combinations in most smelters is based on ourinvestigation of 244 nonferrous metal smelters. For smelterswithout APCD combination information but with acid mak-ing, we assumed that the type 1 of APCD combinations(DC+FGS+ESD+DCDA) was adapted. For smelters with-out any information about acid production or APCDs, type7 (none APCDs) was adapted. The proportion of metal pro-duction from smelters with different types of APCDs is givenin Table 2. Combining the effect of APCDs and the mercuryflow diagram in smelters (Fig. 2), atmospheric mercury emis-sion from primary flue gas is calculated with the followingequation.
Ep,ij =
∑l
θl,ijQij (1− γd,j )γs,j (1− ξof,j )(1− ηl) (6)
whereE is atmospheric Hg emission (kg);p refers to pri-mary smelting flue gas;i refers to province;j refers to tech-nology. θ is the application percentage of a certain type ofAPCD combinations; information aboutθ is obtained fromour investigation of 244 smelters and China’s NonferrousMetal Industry Association (Table S3). “l” is the type ofAPCD combinations (Table 2).Q is mercury input (kg).γis the mercury release rate; the value ofγ was based onour field experiments in Chinese smelters (Li et al., 2007;Wang et al., 2010; Zhang et al., 2012). For technology with-out field experiment, the median value of the results fromother technologies was applied. Mercury release rates in var-ious smelting process,γs, are in the range of 97.7–99.4 %(Table S6). “d” refers to dehydration sector; “of” refers tooverflow flue gas.ξ is called as distribution coefficient (Ta-ble S6).ξof refers to the proportion of gaseous mercury emit-ted into atmosphere as overflow flue gas. The value of dis-tribution coefficient was calculated from the mercury massbalance of field experiment result (Li et al., 2007; Wang etal., 2010; Zhang et al., 2012). Mercury distribution rate fordehydration is 0.1–1.0 % (Table S6).η is mercury removalefficiency of APCD, the value of which was based on fieldexperiment (Li et al., 2007; Wang et al., 2010; Zhang et al.,2012). The value ofη is shown in Table 3.
11156 Q. R. Wu et al.: Update of mercury emissions
Table 1.Mercury content in ore concentrates supplied and consumed by province in 2010.
Province Mercury content in ore concentrates Mercury content in ore concentratessupplied byk province [Hg]su,k→ij , (g t−1) consumed byi province [Hg]com,ij , (g t−1)
where “o” refers to other flue gas; “d”, “s”, “e”, and “r”refer to dehydration, smelting/roasting, extraction and re-fining/reclaiming, respectively.ξss and ξse here refer to theproportion of mercury entering into the solid waste in thesmelting and extraction sector, respectively. The values ofξss and ξse are 0.02–20.6 %, and 2.4–14.4 %, respectively(Table S6).γd, γe, andγr are mercury release rate in hydra-tion, extraction and refining/reclaiming process. The value ofthese three parameters is shown in Table S6.ηo is the mer-cury removal efficiency for other flue gases (Table S6). For
most processes, dust collectors are widely installed for de-hydration, overflow, extraction and refining/reclaiming fluegas. In several large smelters with advanced smelting pro-cesses, flue gas desulfurization (FGD) devices are installed.No APCDs are installed for the flue gas from the out-of-date processes such as AZSP, RZSP and EF/RF. Thereforemercury removal efficiencies for other flue gas depend onthe APCD applied. The mercury removal efficiencies of dustcollector and FGD were 12.5 % and 34.7 %, respectively (Ta-ble S6).
Atmospheric mercury emissions fromi province is calcu-lated by
Ei =
∑jEij . (8)
Atmospheric mercury emissions fromj process is calculatedby
whereα is metal concentration and the values for zinc, leadand copper concentrates were 50.5, 62.85 and 21.7 %, re-spectively (Table S6) (CNMIA, 2011).ϕ is metal recoveryrate of smelting process. For most zinc smelting process, themetal recovery rate was 95.5 % while for EP it was 94 %. Forthe lead and copper smelting processes, the metal recoveryrate was 96.8 % and 97.8 %, respectively (Table S6).
3 Results and discussion
3.1 Regional atmospheric mercury emissions fromprimary smelters in 2010
In 2010, total mercury input into China’s primary nonferrousmetal smelters with the consumption of ore concentrates in2010 was 543 t, of which 74.8 %, 19.5 % and 5.7 % was in-put into zinc, lead and copper smelters, respectively. How-ever, mercury emitted into the atmosphere was about 72.5 tfrom China’s primary nonferrous metal smelters. Emissionsfrom primary zinc, lead and copper smelters were 39.4, 30.6and 2.5 t, respectively. The largest mercury emitter was theGansu province, followed by Henan, Yunnan, Hunan, InnerMongolia and Shaanxi provinces. Summation of the emis-sions from these six provinces accounted for 87.9 % of thenational emissions (Fig. 3).
China’s zinc smelters emitted 39.4 t of mercury into at-mosphere in 2010. Gansu, Yunnan, Shaanxi and Henanprovinces were the top four emitters. For zinc smelters, sum-mation of mercury emissions from these four provinces ac-counted for 80.5 % of national amount. The high mercurycontent of the zinc concentrate consumed was the main rea-son for the elevated mercury emissions in Gansu and Shaanxiprovince. For example, the mercury concentration in the con-centrates consumed by zinc smelters in the Gansu provincewas as high as 403.4 g t−1, which is about 10 times higherthan the national average. Thus, the total mercury input intozinc smelters reached 181 t in the Gansu province. If thenational average was used, this value would be only 18 t.High mercury emissions in Yunnan and Henan are caused bythe low application percentage of acid plants, which is only79.3 % and 48.5 %, respectively.
Atmospheric mercury emission from lead smelters wasabout 30.6 t. Mercury emissions from China’s lead smelterscame mainly from Henan, Hunan, Yunnan and Inner Mon-golia. The emissions of these four provinces accounted for89.6 % of total emissions from lead smelters. Huge consump-tion of concentrates, more than 60 % of national consump-tion, was the most important factor for the high mercuryemissions from lead smelters in Hunan and Henan. High
Q. R. Wu et al.: Update of mercury emissions 11159
mercury concentration in the concentrates consumed in In-ner Mongolia contributed to its high emissions while lowmercury removal efficiency led to the elevated emissions inYunnan’s lead smelters.
Copper smelters emitted 2.5 t of mercury in 2010, andnearly half was emitted in the Yunnan province. High mer-cury content of copper concentrates consumed in localsmelters was the main reason for the large mercury emissionsin this province. Mercury content in the ore concentrates con-sumed by smelters in the Yunnan province was 8.7 g t−1,about four times of the national average (2.3 g t−1).
The mercury speciation profile was assumed to be 80 %Hg0, 15 % Hg2+ and 5 % Hgp for nonferrous metal smelt-ing in previous estimate (Pacyna and Pacyna, 2002). Thefield experiments in Chinese nonferrous smelters provideda very different speciation profile (Wang et al., 2010; Zhanget al., 2012). In this study, the median of the results fromfield experiments was used to estimate mercury speciationemissions. For zinc smelters, the percentage of Hg2+, Hg0
and Hgp in emitted flue gas emitted to the atmosphere was65 %, 30 % and 5 %, respectively. The Hg2+, Hg0 and Hgp
emissions from zinc smelters were 25.6, 11.8 and 1.97 t, re-spectively. Using the same speciation profile, the Hg2+, Hg0
and Hgp emissions from lead smelters were 11.5, 17.6 and1.53 t, respectively, and those for copper smelters were 1.19,1.16 and 0.12 t, respectively.
3.2 Atmospheric mercury emissions from varioussmelting processes in 2010
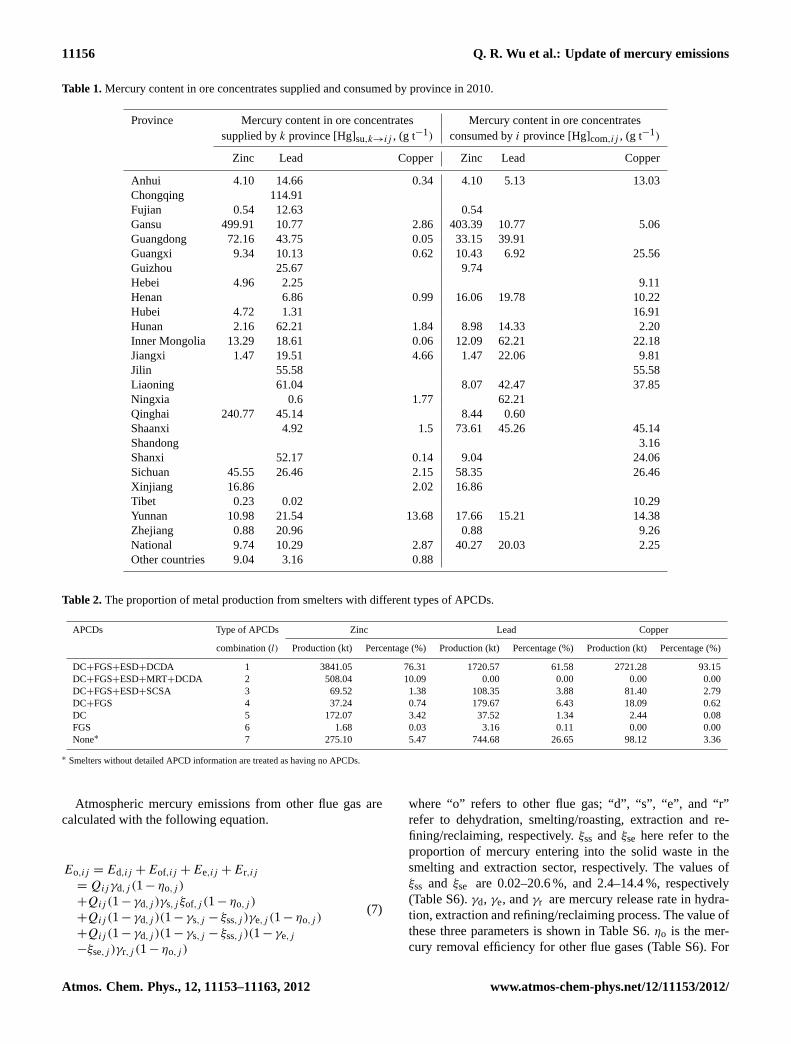
In 2010, China’s production of zinc, lead and copper fromprimary smelters reached 5033, 2794 and 2921 kt, respec-tively. For primary zinc smelters, about 2.5 % of refined zincis produced by hydrometallurgical process. The rest was pro-duced by EP, ISP, RZSP, EZF and others, accounting for78.7 %, 7.1 %, 7.9 %, 1.3 % and 2.5 % of total zinc produc-tion, respectively. For primary lead smelters, the percentagesof lead produced by RPSP, ISP, SMP and SPP were 47.3 %,5.1 %, 20.2 % and 27.4 %, respectively. Refined copper pro-duced by FFSP, RPSP, IFSP, RLEP and EF/RF, accounted for34.2 %, 52.4 %, 9.8 %, 0.2 % and 3.4 %, respectively.
For zinc smelters, most of mercury is emitted fromsmelters with EP. Mercury emissions from RZSP, EZF, ISPand AZSP were 6.3 %, 2.4 %, 5.4 % and 14.4 %, respec-tively. For lead and copper smelters, more than half of themercury was emitted from smelters with out-of-date tech-nologies (Fig. 4). The average mercury removal efficiencyof air pollution control devices in the zinc, lead and coppersmelters was 90.5 ± 52.5 %, 71.2 ± 63.7 % and 91.8 ± 40.7 %.The mercury emissions can be further reduced by improv-ing the mercury removal efficiencies of current APCDs or byinstalling mercury reclaiming tower.
31
Fig. 4. Atmospheric mercury emissions from zinc, lead and copper smelters by
process, 2010
6.28%
5.45%
2.35%
71.55%
14.36%
Zinc smelters
AZSP
EP
EZF
ISP
RZSP
18.74%
5.11%2.8%
73.35%
Lead smelters
SPP
ISP
RPSP
SMP
17.45%
0.09%
12.45%10.69%
59.33%
Copper Smelters
EF/RF
FFSP
IFSP
RLEP
RPSP
31
Fig. 4. Atmospheric mercury emissions from zinc, lead and copper smelters by
process, 2010
6.28%
5.45%
2.35%
71.55%
14.36%
Zinc smelters
AZSP
EP
EZF
ISP
RZSP
18.74%
5.11%2.8%
73.35%
Lead smelters
SPP
ISP
RPSP
SMP
17.45%
0.09%
12.45%10.69%
59.33%
Copper Smelters
EF/RF
FFSP
IFSP
RLEP
RPSP
31
Fig. 4. Atmospheric mercury emissions from zinc, lead and copper smelters by
process, 2010
6.28%
5.45%
2.35%
71.55%
14.36%
Zinc smelters
AZSP
EP
EZF
ISP
RZSP
18.74%
5.11%2.8%
73.35%
Lead smelters
SPP
ISP
RPSP
SMP
17.45%
0.09%
12.45%10.69%
59.33%
Copper Smelters
EF/RF
FFSP
IFSP
RLEP
RPSP
Fig. 4. Atmospheric mercury emissions from zinc, lead and coppersmelters by process, 2010.
3.3 Uncertainty analysis
The uncertainty of this inventory was estimated by combin-ing the coefficients of variation (CV, or the standard deviationdivided by the mean) of the contributing factors according tothe detailed methodology for uncertainty analysis describedin Streets et al. (2003). The relative 95 % confidence intervalsfor emissions are calculated as 1.96× CV. Thus, atmosphericmercury emission from zinc, lead and copper smelters was39.4 ± 31.5, 30.6 ± 29.1, and 2.5 ± 1.1 t in 95 % relative con-fidence and the uncertainty is ±80 %, ±95 % and ±45 %, re-spectively. In previous studies, the uncertainty for these threesources reached 100 %, 200 % and 100 %, respectively. Theimprovement in this study was contributed by better knowl-edge on the mercury content of ore concentrates and mer-cury removal efficiency of APCDs. However, more field ex-periments are still important to better understand the mer-cury fate in smelters. Besides, high uncertainties exist for theemissions from small-scale smelters.
11160 Q. R. Wu et al.: Update of mercury emissions
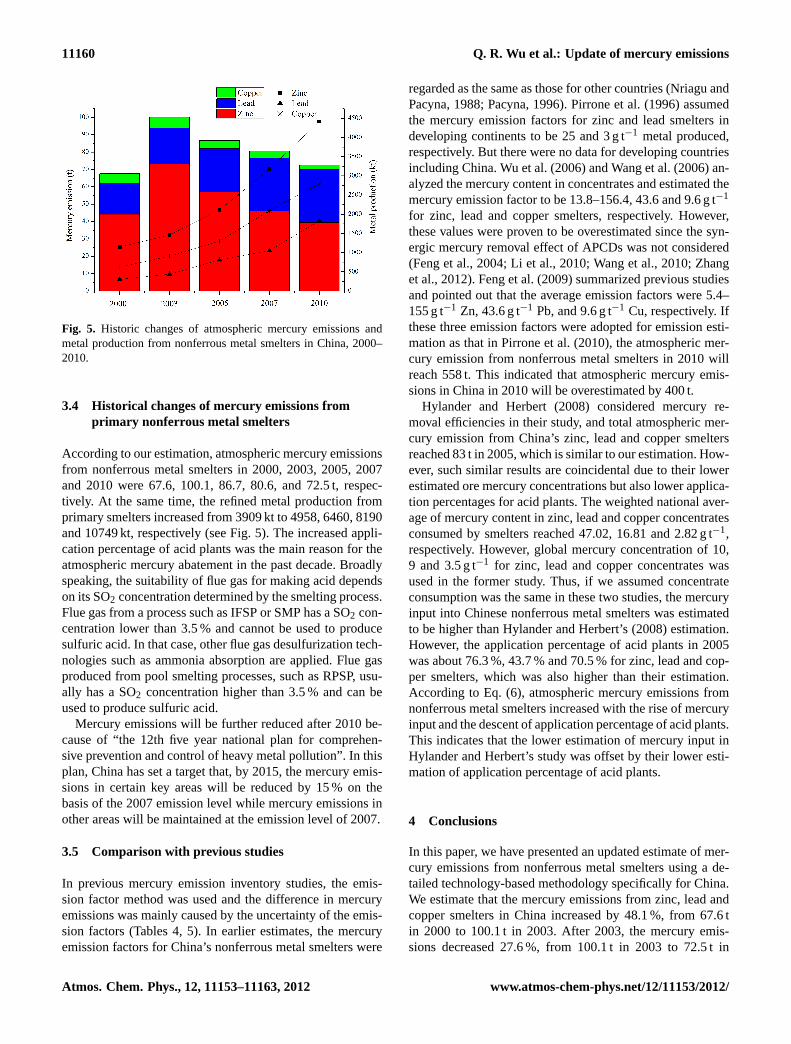
Fig. 5. Historic changes of atmospheric mercury emissions andmetal production from nonferrous metal smelters in China, 2000–2010.
3.4 Historical changes of mercury emissions fromprimary nonferrous metal smelters
According to our estimation, atmospheric mercury emissionsfrom nonferrous metal smelters in 2000, 2003, 2005, 2007and 2010 were 67.6, 100.1, 86.7, 80.6, and 72.5 t, respec-tively. At the same time, the refined metal production fromprimary smelters increased from 3909 kt to 4958, 6460, 8190and 10749 kt, respectively (see Fig. 5). The increased appli-cation percentage of acid plants was the main reason for theatmospheric mercury abatement in the past decade. Broadlyspeaking, the suitability of flue gas for making acid dependson its SO2 concentration determined by the smelting process.Flue gas from a process such as IFSP or SMP has a SO2 con-centration lower than 3.5 % and cannot be used to producesulfuric acid. In that case, other flue gas desulfurization tech-nologies such as ammonia absorption are applied. Flue gasproduced from pool smelting processes, such as RPSP, usu-ally has a SO2 concentration higher than 3.5 % and can beused to produce sulfuric acid.
Mercury emissions will be further reduced after 2010 be-cause of “the 12th five year national plan for comprehen-sive prevention and control of heavy metal pollution”. In thisplan, China has set a target that, by 2015, the mercury emis-sions in certain key areas will be reduced by 15 % on thebasis of the 2007 emission level while mercury emissions inother areas will be maintained at the emission level of 2007.
3.5 Comparison with previous studies
In previous mercury emission inventory studies, the emis-sion factor method was used and the difference in mercuryemissions was mainly caused by the uncertainty of the emis-sion factors (Tables 4, 5). In earlier estimates, the mercuryemission factors for China’s nonferrous metal smelters were
regarded as the same as those for other countries (Nriagu andPacyna, 1988; Pacyna, 1996). Pirrone et al. (1996) assumedthe mercury emission factors for zinc and lead smelters indeveloping continents to be 25 and 3 g t−1 metal produced,respectively. But there were no data for developing countriesincluding China. Wu et al. (2006) and Wang et al. (2006) an-alyzed the mercury content in concentrates and estimated themercury emission factor to be 13.8–156.4, 43.6 and 9.6 g t−1
for zinc, lead and copper smelters, respectively. However,these values were proven to be overestimated since the syn-ergic mercury removal effect of APCDs was not considered(Feng et al., 2004; Li et al., 2010; Wang et al., 2010; Zhanget al., 2012). Feng et al. (2009) summarized previous studiesand pointed out that the average emission factors were 5.4–155 g t−1 Zn, 43.6 g t−1 Pb, and 9.6 g t−1 Cu, respectively. Ifthese three emission factors were adopted for emission esti-mation as that in Pirrone et al. (2010), the atmospheric mer-cury emission from nonferrous metal smelters in 2010 willreach 558 t. This indicated that atmospheric mercury emis-sions in China in 2010 will be overestimated by 400 t.
Hylander and Herbert (2008) considered mercury re-moval efficiencies in their study, and total atmospheric mer-cury emission from China’s zinc, lead and copper smeltersreached 83 t in 2005, which is similar to our estimation. How-ever, such similar results are coincidental due to their lowerestimated ore mercury concentrations but also lower applica-tion percentages for acid plants. The weighted national aver-age of mercury content in zinc, lead and copper concentratesconsumed by smelters reached 47.02, 16.81 and 2.82 g t−1,respectively. However, global mercury concentration of 10,9 and 3.5 g t−1 for zinc, lead and copper concentrates wasused in the former study. Thus, if we assumed concentrateconsumption was the same in these two studies, the mercuryinput into Chinese nonferrous metal smelters was estimatedto be higher than Hylander and Herbert’s (2008) estimation.However, the application percentage of acid plants in 2005was about 76.3 %, 43.7 % and 70.5 % for zinc, lead and cop-per smelters, which was also higher than their estimation.According to Eq. (6), atmospheric mercury emissions fromnonferrous metal smelters increased with the rise of mercuryinput and the descent of application percentage of acid plants.This indicates that the lower estimation of mercury input inHylander and Herbert’s study was offset by their lower esti-mation of application percentage of acid plants.
4 Conclusions
In this paper, we have presented an updated estimate of mer-cury emissions from nonferrous metal smelters using a de-tailed technology-based methodology specifically for China.We estimate that the mercury emissions from zinc, lead andcopper smelters in China increased by 48.1 %, from 67.6 tin 2000 to 100.1 t in 2003. After 2003, the mercury emis-sions decreased 27.6 %, from 100.1 t in 2003 to 72.5 t in
a (A) Nriagu et al. (1988); (B) Pirrone et al. (1996); (C) Pacyna et al. (2002); (D) Feng et al. (2004); (E) Streets et al. (2005); Wu et al. (2006); (F) Pacyna et al. (2006); (G) Hylanderand Herbert (2008); (H) Pacyna et al. (2010); (I) Feng et al. (2009); (J) Li et al. (2010); (K) Wang et al. (2010); (L) Zhang et al. (2012); (M) This study.b Not specific value for each process.
2010 although the production of zinc, lead and copper in-creased 116.7 % in the same period. The mercury reductionis mainly due to the improvement of the smelting processand the increase of the application percentage of acid plants,from 60.9 %, 30.7 % and 61.0 % in 2003 to 87.8 %, 65.5 %
and 95.6 % in 2010 for zinc, lead and copper smelters, re-spectively.
In 2010, atmospheric mercury emissions from zinc, leadand copper smelters were 39.4 ± 31.5, 30.6 ± 29.1, and2.5 ± 1.1 t at relative 95 % confidence and the uncertainty is±80 %, ±95 % and ±45 %, respectively. Hg2+, Hg0 and Hgp
11162 Q. R. Wu et al.: Update of mercury emissions
emitted from zinc smelters were 25.6, 11.8 and 1.97 t, respec-tively. Hg2+, Hg0 and Hgp emissions were 11.64, 17.74 and1.53 t for lead smelters, respectively, while they were 1.19,1.16 and 0.12 t for copper smelters, respectively. The aver-age mercury removal efficiency of air pollution control de-vices in zinc, lead and copper smelters was 90.5 ± 52.5 %,71.2 ± 63.7 % and 91.8 ± 40.7 %, respectively.
With better understanding of mercury fate in nonfer-rous metal smelters, atmospheric mercury emission estimatesbased on smelting processes and mercury abatement deviceslower the estimation uncertainty. However, mercury removalefficiency estimates from current studies cover a broad rangeand the mercury removal mechanism of APCDs is still un-clear.
Supplementary material related to this article isavailable online at:http://www.atmos-chem-phys.net/12/11153/2012/acp-12-11153-2012-supplement.pdf.
Acknowledgements.This work was financially supported by theNatural Science Foundation of China (No. 20 937 002), MEP’sSpecial Funds for Research on Public Welfares (201209015), andGovernment of Norway.
Edited by: R. Cohen
References
CNMIA (Chinese Nonferrous Metal Industry Association): Theyearbook of nonferrous metals industry of China (2011), Chi-nese nonferrous metal industry association publications, Beijing,China, 2011.
Feng, X. B., Li, G. H., and Qiu, G. L.: A preliminary study onmercury contamination to the environment from artisanal zincsmelting using indigenous methods in Hezhang county, Guizhou,China – Part 1: Mercury emission from zinc smelting and its in-fluences on the surface waters, Atmos. Environ., 38, 6223–6230,2004.
Feng, X., Streets, D., Hao, J., Wu, Y., and Li, G.: Mercury emissionsfrom industrial sources in China, Springer, New York, USA,chap. 3, 67–79, 2009.
Fukuda, N., Takaoka, M., Doumoto, S., Oshita, K., Morisawa, S.,and Mizuno, T.: Mercury emission and behavior in primary fer-rous metal production, Atmos. Environ., 45, 3685–3691, 2011.
Hylander, L. D. and Herbert, R. B.: Global emission and productionof mercury during the pyrometallurgical extraction of nonferroussulfide ores, Environ. Sci. Technol., 42, 5971–5977, 2008.
Kocman, D. and Horvat, M.: Non-point source mercury emissionfrom the Idrija Hg-mine province: Gis mercury emission model,J. Environ. Manage., 92, 2038–2046, 2011.
Li, G. H., Feng, X. B., Li, Z. G., Qiu, G. L., Shang, L. H., Liang, P.,Wang, D. Y., and Yang, Y. K.: Mercury emission to atmospherefrom primary Zn production in China, Sci. Total Environ., 408,4607–4612, 2010.
Li, P., Feng, X. B., Qiu, G. L., Shang, L. H., and Li, Z. G.: Mercurypollution in Asia: A review of the contaminated sites, J. Hazard.Mater., 168, 591–601, 2009.
Lin, C.-J., Pan, L., Streets, D. G., Shetty, S. K., Jang, C., Feng, X.,Chu, H.-W., and Ho, T. C.: Estimating mercury emission out-flow from East Asia using CMAQ-Hg, Atmos. Chem. Phys., 10,1853–1864,doi:10.5194/acp-10-1853-2010, 2010.
Nriagu, J. O. and Pacyna, J. M.: Quantitative assessment of world-wide contamination of air, water and soils by trace-metals, Na-ture, 333, 134–139, 1988.
Pacyna, J. M.: Emission inventories of atmospheric mercury fromanthropogenic sources, in: Global and regional mercury cycles:sources, fluxes and mass balances, Nato science partnership sub-series 2, edited by: Baeyens, W., Ebinghaus, R., and Vasiliev, O.,Reidel publishing company, Dordrecht, The Netherlands, 123–136, 1996.
Pacyna, E. G. and Pacyna, J. M.: Global emission of mercury fromanthropogenic sources in 1995, Water Air Soil Pollut., 137, 149–165, 2002.
Pacyna, E. G., Pacyna, J. M., Steenhuisen, F., and Wilson, S.: Globalanthropogenic mercury emission inventory for 2000, Atmos. En-viron., 40, 4048–4063, 2006.
Pacyna, E. G., Pacyna, J. M., Sundseth, K., Munthe, J., Kindbom,K., and Wilson, S.: Global emission of mercury to the atmo-sphere from anthropogenic sources in 2005 and projections to2020, Atmos. Environ., 44, 2487–2499, 2010.
Pirrone, N., Keeler, G. J., and Nriagu, J. O.: Regional differencesin worldwide emissions of mercury to the atmosphere, Atmos.Environ., 30, 2981–2987, 1996.
Pirrone, N., Cinnirella, S., Feng, X., Finkelman, R. B., Friedli,H. R., Leaner, J., Mason, R., Mukherjee, A. B., Stracher, G.B., Streets, D. G., and Telmer, K.: Global mercury emissionsto the atmosphere from anthropogenic and natural sources, At-mos. Chem. Phys., 10, 5951–5964,doi:10.5194/acp-10-5951-2010, 2010.
Streets, D. G., Bond, T. C., Carmichael, G. R., Feamdes, S. D., Fu,Q., He, D., Klimont, Z., Nelson, S. M., Tsai, N. Y., Wang, M.Q., Woo, J.-H., and Yarber, K. F.: An inventory of gaseous andprimary aerosol emissions in Asia in the year 2000, J. Geophys.Res., 108, 8809–8831, 2003.
Streets, D. G., Hao, J. M., Wu, Y., Jiang, J. K., Chan, M., Tian, H.Z., and Feng, X. B.: Anthropogenic mercury emissions in China,Atmos. Environ., 39, 7789—7806, 2005.
Strode, S., Jaegle, L., and Selin, N. E.: Impact of mercury emissionsfrom historic gold and silver mining: global modeling, Atmos.Environ., 43, 2012–2017, 2009.
The State Council of the People’s Republic of China: Notice on fur-ther strengthening the work of eliminating out-of-date productioncapacity, online available at:http://www.gov.cn/zwgk/2010-04/06/content1573880.htm, 2010.
Tian, H. Z., Wang, Y., Xue, Z. G., Cheng, K., Qu, Y. P., Chai, F. H.,and Hao, J. M.: Trend and characteristics of atmospheric emis-sions of Hg, As, and Se from coal combustion in China, 1980–2007, Atmos. Chem. Phys., 10, 11905–11919,doi:10.5194/acp-10-11905-2010, 2010.
Wang, S. X., Liu, M., Jiang, J. K., Hao, J. M., Wu, Y., and Streets,D. G.: Estimate the mercury emissions from non-coal sources inchina, Chinese Environ. Sci., 27, 2401–2406, 2006.
Q. R. Wu et al.: Update of mercury emissions 11163
Wang, S. X., Song, J. X., Li, G. H., Wu, Y., Zhang, L., Wan, Q.,Streets, D. G., Chin, C. K., and Hao, J. M.: Estimating mercuryemissions from a Zinc smelter in relation to China’s mercurycontrol polices, Environ. Pollut., 158, 3347–3353, 2010.
Wu, C. L., Cao, Y., Dong, Z. B., Cheng, C. M., Li, H. X., and Pan,W. P.: Evaluation of mercury speciation and removal through airpollution control devices of a 190 MW boiler, J. Environ. Sci.,22, 277–282, 2010.
Wu, Y., Wang, S. X., Streets, D. G., Hao, J. M., Chan, M., and Jiang,J. K.: Trends in anthropogenic mercury emissions in China from1995 to 2003, Environ. Sci. Technol., 40, 5312–5318, 2006.
Yin, R. S., Feng, X. B., Li, Z. G., Zhang, Q., Bi, X. W., Li, G. H.,Liu, J. L., Zhu, J. J., and Wang, J. X.: Metallogeny and environ-mental impact of Hg in Zn deposits in China, Appl. Geochem.,27, 151–160, 2012.
Zhang, L., Wang, S. X., Wu, Q. R., Meng, Y., Yang, H., Wang, F.Y., and Hao, J. M.: Were mercury emission factors for Chinesenon-ferrous metal smelters overestimated? Evidence from onsitemeasurements in six smelters, Environ. Pollut., 171C, 109–117,2012.