respec.com UPDATE OF TOTAL SUSPENDED SOLIDS TOTAL MAXIMUM DAILY LOAD FOR THE BIG SIOUX RIVER MINNEHAHA COUNTY, SOUTH DAKOTA TOPICAL REPORT RSI-2806 PREPARED FOR South Dakota Department of Environment and Natural Resources 523 East Capitol Joe Foss Building Pierre, South Dakota 57501 JUNE 2019
Transcript
respec.com
UPDATE OF TOTAL SUSPENDED SOLIDS TOTAL MAXIMUM DAILY LOAD FOR THE BIG SIOUX RIVER MINNEHAHA COUNTY, SOUTH DAKOTA TOPICAL REPORT RSI-2806
PREPARED FOR South Dakota Department of Environment
and Natural Resources
523 East Capitol
Joe Foss Building
Pierre, South Dakota 57501
JUNE 2019
respec.com
UPDATE OF TOTAL SUSPENDED SOLIDS TOTAL MAXIMUM DAILY LOAD FOR THE BIG SIOUX RIVER MINNEHAHA COUNTY, SOUTH DAKOTA TOPICAL REPORT RSI-2806
PREPARED BY
RESPEC
3824 Jet Drive
Rapid City, South Dakota 57703
PREPARED FOR South Dakota Department of Environment
and Natural Resources
523 East Capitol
Joe Foss Building
Pierre, South Dakota 57501
JUNE 2019
Project Number 3344
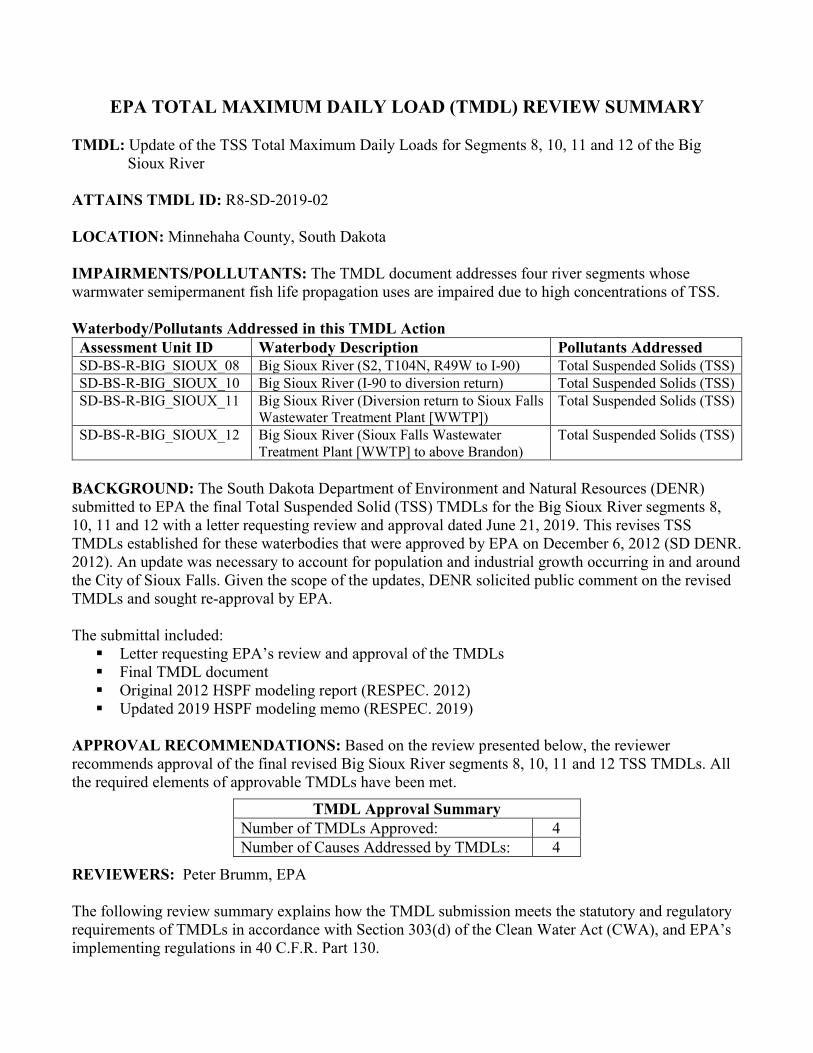
EPA TOTAL MAXIMUM DAILY LOAD (TMDL) REVIEW SUMMARY TMDL: Update of the TSS Total Maximum Daily Loads for Segments 8, 10, 11 and 12 of the Big
Sioux River ATTAINS TMDL ID: R8-SD-2019-02 LOCATION: Minnehaha County, South Dakota IMPAIRMENTS/POLLUTANTS: The TMDL document addresses four river segments whose warmwater semipermanent fish life propagation uses are impaired due to high concentrations of TSS. Waterbody/Pollutants Addressed in this TMDL Action Assessment Unit ID Waterbody Description Pollutants Addressed SD-BS-R-BIG_SIOUX_08 Big Sioux River (S2, T104N, R49W to I-90) Total Suspended Solids (TSS) SD-BS-R-BIG_SIOUX_10 Big Sioux River (I-90 to diversion return) Total Suspended Solids (TSS) SD-BS-R-BIG_SIOUX_11 Big Sioux River (Diversion return to Sioux Falls
Wastewater Treatment Plant [WWTP]) Total Suspended Solids (TSS)
SD-BS-R-BIG_SIOUX_12 Big Sioux River (Sioux Falls Wastewater Treatment Plant [WWTP] to above Brandon)
Total Suspended Solids (TSS)
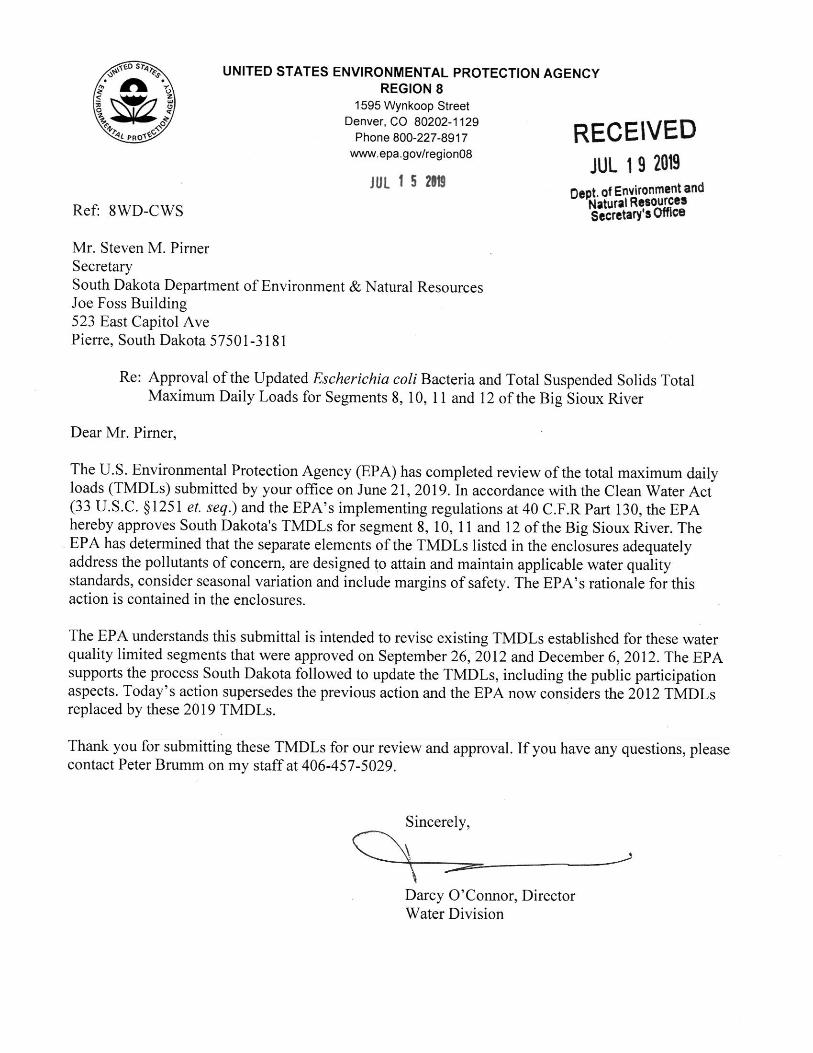
BACKGROUND: The South Dakota Department of Environment and Natural Resources (DENR) submitted to EPA the final Total Suspended Solid (TSS) TMDLs for the Big Sioux River segments 8, 10, 11 and 12 with a letter requesting review and approval dated June 21, 2019. This revises TSS TMDLs established for these waterbodies that were approved by EPA on December 6, 2012 (SD DENR. 2012). An update was necessary to account for population and industrial growth occurring in and around the City of Sioux Falls. Given the scope of the updates, DENR solicited public comment on the revised TMDLs and sought re-approval by EPA. The submittal included: Letter requesting EPA’s review and approval of the TMDLs Final TMDL document Original 2012 HSPF modeling report (RESPEC. 2012) Updated 2019 HSPF modeling memo (RESPEC. 2019)
APPROVAL RECOMMENDATIONS: Based on the review presented below, the reviewer recommends approval of the final revised Big Sioux River segments 8, 10, 11 and 12 TSS TMDLs. All the required elements of approvable TMDLs have been met.
TMDL Approval Summary Number of TMDLs Approved: 4 Number of Causes Addressed by TMDLs: 4
REVIEWERS: Peter Brumm, EPA The following review summary explains how the TMDL submission meets the statutory and regulatory requirements of TMDLs in accordance with Section 303(d) of the Clean Water Act (CWA), and EPA’s implementing regulations in 40 C.F.R. Part 130.
2
EPA TMDL REVIEW FOR REVISIONS TO THE BIG SIOUX RIVER SEGMENTS 8, 10, 11 AND 12 TSS TMDLS This TMDL review document includes EPA’s guidelines that summarize the currently effective statutory and regulatory requirements relating to TMDLs (CWA Section 303(d) and 40 C.F.R. Part 130). These TMDL review guidelines are not themselves regulations. Any differences between these guidelines and EPA's regulations should be resolved in favor of the regulations themselves. The italicized sections of this document describe the information generally necessary for EPA to determine if a TMDL submittal fulfills the legal requirements for approval. The sections in regular type reflect EPA's analysis of the state’s compliance with these requirements. Use of the verb “must” below denotes information that is required to be submitted because it relates to elements of the TMDL required by the CWA and by regulation.
1. Identification of Waterbody, Pollutant of Concern, Pollutant Sources, and Priority Ranking
The TMDL submittal must clearly identify (40 C.F.R. §130.7(c)(1)): • the waterbody as it appears on the State’s/Tribe’s 303(d) list; • the pollutant for which the TMDL is being established; and • the priority ranking of the waterbody.
The TMDL submittal must include (40 C.F.R. §130.7(c)(1); 40 C.F.R. §130.2):
• an identification of the point and nonpoint sources of the pollutant of concern, including location of the source(s) and the quantity of the loading (e.g., lbs. per day);
• facility names and NPDES permit numbers for point sources within the watershed; and • a description of the natural background sources, and the magnitude and location of the sources, where
it is possible to separate natural background from nonpoint sources. This information is necessary for EPA’s review of the load and wasteload allocations, which are required by regulation. The TMDL submittal should also contain a description of any important assumptions made in developing the TMDL, such as:
• the spatial extent of the watershed in which the impaired waterbody is located; • the assumed distribution of land use in the watershed (e.g., urban, forested, agriculture); • population characteristics, wildlife resources, and other relevant information affecting the
characterization of the pollutant of concern and its allocation to sources; • present and future growth trends, if taken into consideration in preparing the TMDL (e.g., the TMDL
could include the design capacity of a wastewater treatment facility); and • an explanation and analytical basis for expressing the TMDL through surrogate measures, if
applicable. Surrogate measures are parameters such as percent fines and turbidity for sediment impairments; chlorophyll a and phosphorus loadings for excess algae; length of riparian buffer; or number of acres of best management practices.
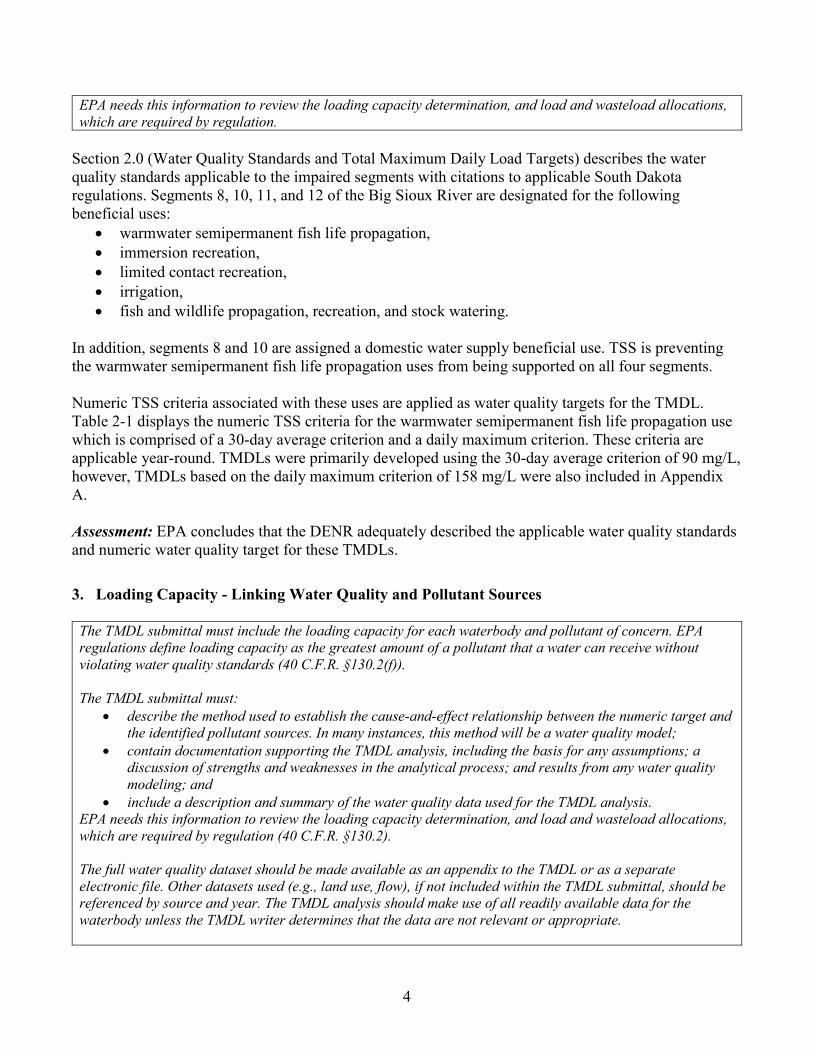
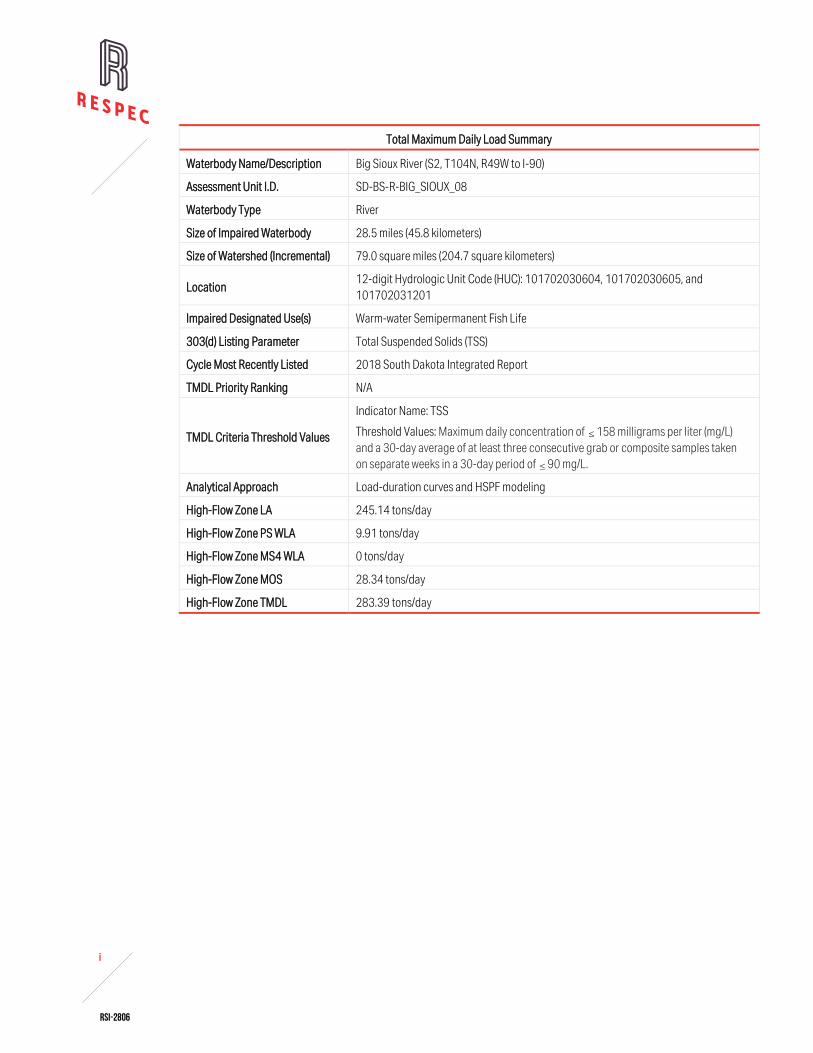
Impaired waterbody segments subject to these TMDLs are located in south-eastern South Dakota and are part of the larger Missouri River basin. This TMDL document covers four listed segments of the Big Sioux River (HUC 10170203) including: 1) Big Sioux River from S2, T104N, R49W to I-90 (28.5 miles, SD-BS-R-BIG_SIOUX_08); 2) Big Sioux River from I-90 to the diversion return (15.8 miles, SD-BS-R-BIG_SIOUX_10); 3) Big Sioux River from diversion return to Sioux Falls wastewater treatment plant (WWTP) (4.7 miles, SD-BS-R-BIG_SIOUX_11); and 4) Big Sioux River from Sioux Falls WWTP to above Brandon, SD (4.2 miles, SD-BS-R-BIG_SIOUX_12). Figure 1-1 displays the
3
project area that shows the general location of the Big Sioux River and major tributaries within the project area, including the impaired segments. These segments have an extensive 303(d) listing and TMDL history:
• 2004 – Segments 8, 9, 10, 11 and 12 first listed for fecal coliform impairments. • 2008 – EPA approved a fecal coliform TMDL for segment 8 (SD-BS-R-BIG_SIOUX_08, from
near Dell Rapids to below Baltic). • 2010 – DENR re-defined segment boundaries by dissolving segment 9 into segments 8 and 10.
Segment 8’s description expanded to: S2, T104N, R49W to I-90. Segments 8, 10, 11 and 12 first listed for E. coli and TSS impairments.
• 2012 – EPA approved fecal coliform, E. coli and TSS TMDLs for segments 8, 10, 11 and 12. This action replaced segment 8’s 2008 fecal coliform TMDL.
• 2019 – DENR submitted revised E. coli and TSS TMDLs for segments 8, 10, 11 and 12. Once approved, this action will replace the 2012 TMDLs.
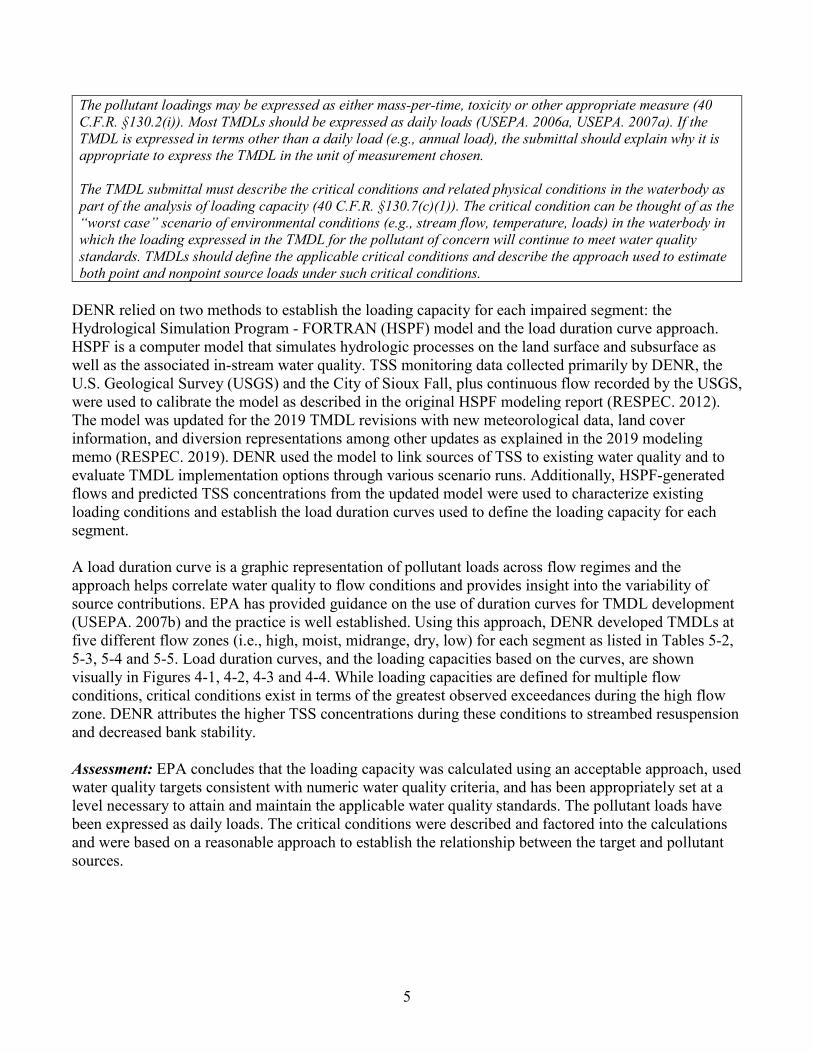
None of these impairments were included on South Dakota’s 2018 303(d) List nor were they given a priority ranking for TMDL development because they were assigned Integrated Reporting Category 4a – Water impaired but has an approved TMDL. Prior to initial TMDL development they were considered high priorities. This information is contained in Section 1.0 (Introduction) and Section 1.2 (Clean Water Act Section 303(d) Listing Information). Table 1-1 characterizes land uses draining into impaired segments and Section 3.2 discusses nonpoint sources of TSS such as surface runoff, bed and bank erosion, cropland erosion, and construction erosion. The pie charts in Figures 3-3, 3-4, 3-5 and 3-6 summarize Hydrological Simulation Program - FORTRAN (HSPF) model results and show the relative contribution from existing TSS sources categorized as local or upstream Municipal Separate Storm Sewer System (MS4), Big Sioux boundary conditions, Skunk Creek, Slip-up Creek, local bed and bank erosion, and upstream bed and bank erosion. Point sources are identified by facility name and permit number in Table 3-1. Additionally, Figure 3-1 shows the location of point sources within the project area including the MS4 boundary. Assessment: EPA concludes that the DENR adequately identified the impaired waterbodies, the pollutant of concern, the priority ranking, the identification, location and magnitude of the pollutant sources, and the important assumptions and information used to develop the TMDLs. 2. Description of the Applicable Water Quality Standards and Numeric Water Quality Target
The TMDL submittal must include: • a description of the applicable State/Tribal water quality standard, including the designated use(s) of
the waterbody, the applicable numeric or narrative water quality criterion, and the antidegradation policy (40 C.F.R. §130.7(c)(1)); and
• a numeric water quality target for each TMDL. If the TMDL is based on a target other than a numeric water quality criterion, then a numeric expression must be developed from a narrative criterion and a description of the process used to derive the target must be included in the submittal (40 C.F.R. §130.2(i)).
4
EPA needs this information to review the loading capacity determination, and load and wasteload allocations, which are required by regulation.
Section 2.0 (Water Quality Standards and Total Maximum Daily Load Targets) describes the water quality standards applicable to the impaired segments with citations to applicable South Dakota regulations. Segments 8, 10, 11, and 12 of the Big Sioux River are designated for the following beneficial uses:
• warmwater semipermanent fish life propagation, • immersion recreation, • limited contact recreation, • irrigation, • fish and wildlife propagation, recreation, and stock watering.
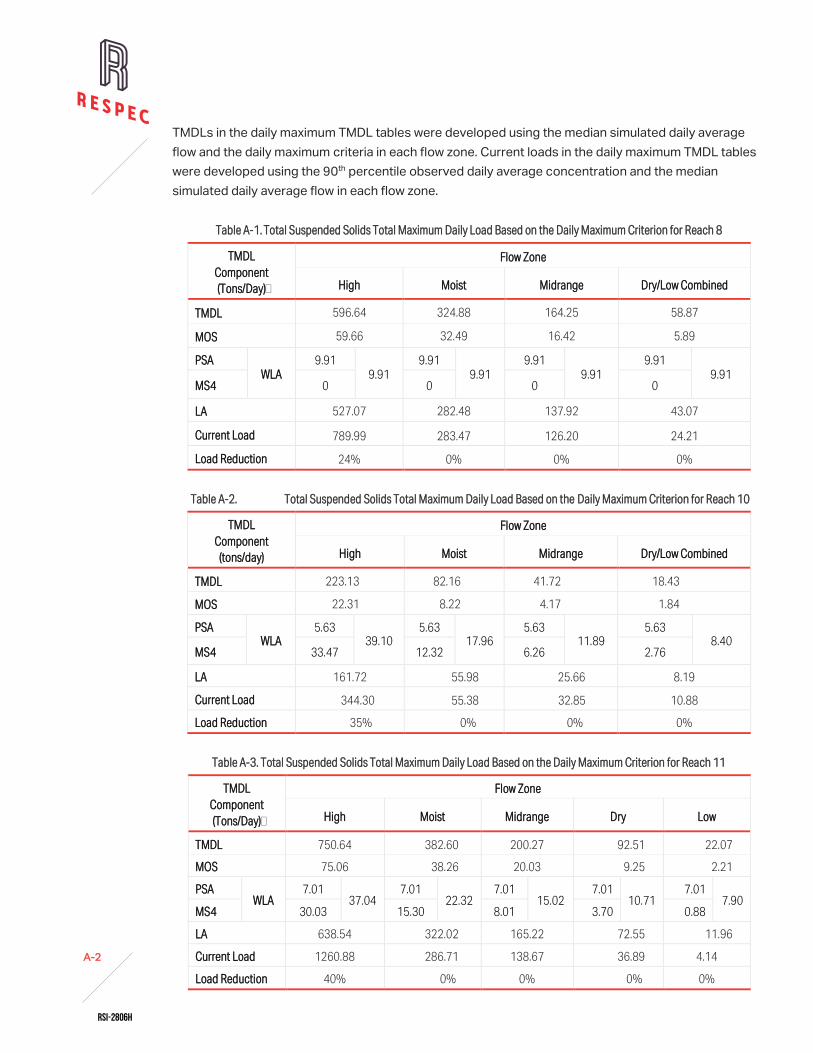
In addition, segments 8 and 10 are assigned a domestic water supply beneficial use. TSS is preventing the warmwater semipermanent fish life propagation uses from being supported on all four segments. Numeric TSS criteria associated with these uses are applied as water quality targets for the TMDL. Table 2-1 displays the numeric TSS criteria for the warmwater semipermanent fish life propagation use which is comprised of a 30-day average criterion and a daily maximum criterion. These criteria are applicable year-round. TMDLs were primarily developed using the 30-day average criterion of 90 mg/L, however, TMDLs based on the daily maximum criterion of 158 mg/L were also included in Appendix A. Assessment: EPA concludes that the DENR adequately described the applicable water quality standards and numeric water quality target for these TMDLs. 3. Loading Capacity - Linking Water Quality and Pollutant Sources
The TMDL submittal must include the loading capacity for each waterbody and pollutant of concern. EPA regulations define loading capacity as the greatest amount of a pollutant that a water can receive without violating water quality standards (40 C.F.R. §130.2(f)). The TMDL submittal must:
• describe the method used to establish the cause-and-effect relationship between the numeric target and the identified pollutant sources. In many instances, this method will be a water quality model;
• contain documentation supporting the TMDL analysis, including the basis for any assumptions; a discussion of strengths and weaknesses in the analytical process; and results from any water quality modeling; and
• include a description and summary of the water quality data used for the TMDL analysis. EPA needs this information to review the loading capacity determination, and load and wasteload allocations, which are required by regulation (40 C.F.R. §130.2). The full water quality dataset should be made available as an appendix to the TMDL or as a separate electronic file. Other datasets used (e.g., land use, flow), if not included within the TMDL submittal, should be referenced by source and year. The TMDL analysis should make use of all readily available data for the waterbody unless the TMDL writer determines that the data are not relevant or appropriate.
5
The pollutant loadings may be expressed as either mass-per-time, toxicity or other appropriate measure (40 C.F.R. §130.2(i)). Most TMDLs should be expressed as daily loads (USEPA. 2006a, USEPA. 2007a). If the TMDL is expressed in terms other than a daily load (e.g., annual load), the submittal should explain why it is appropriate to express the TMDL in the unit of measurement chosen. The TMDL submittal must describe the critical conditions and related physical conditions in the waterbody as part of the analysis of loading capacity (40 C.F.R. §130.7(c)(1)). The critical condition can be thought of as the “worst case” scenario of environmental conditions (e.g., stream flow, temperature, loads) in the waterbody in which the loading expressed in the TMDL for the pollutant of concern will continue to meet water quality standards. TMDLs should define the applicable critical conditions and describe the approach used to estimate both point and nonpoint source loads under such critical conditions.
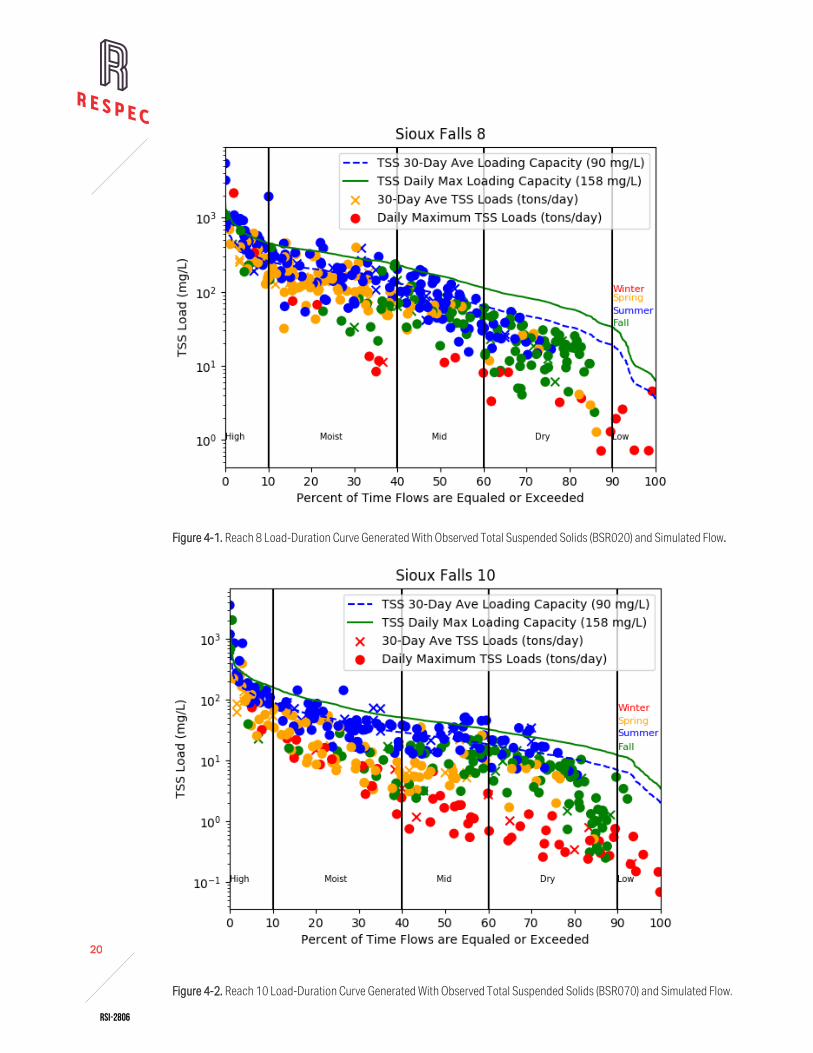
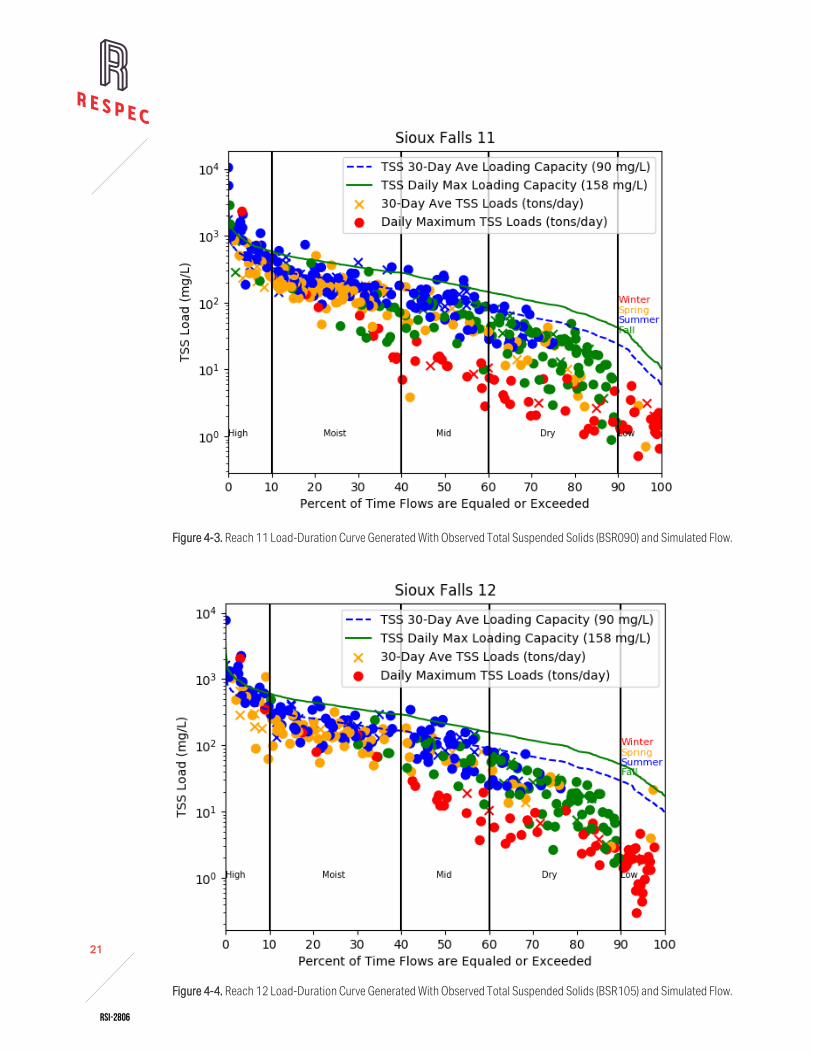
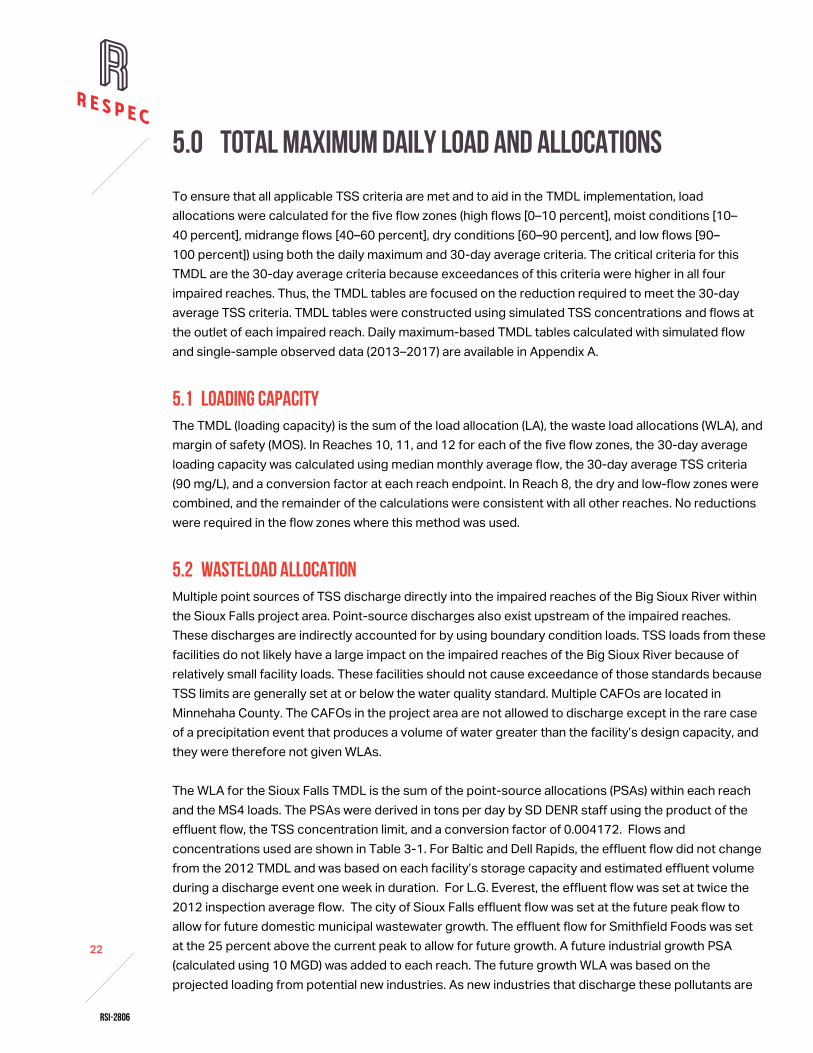
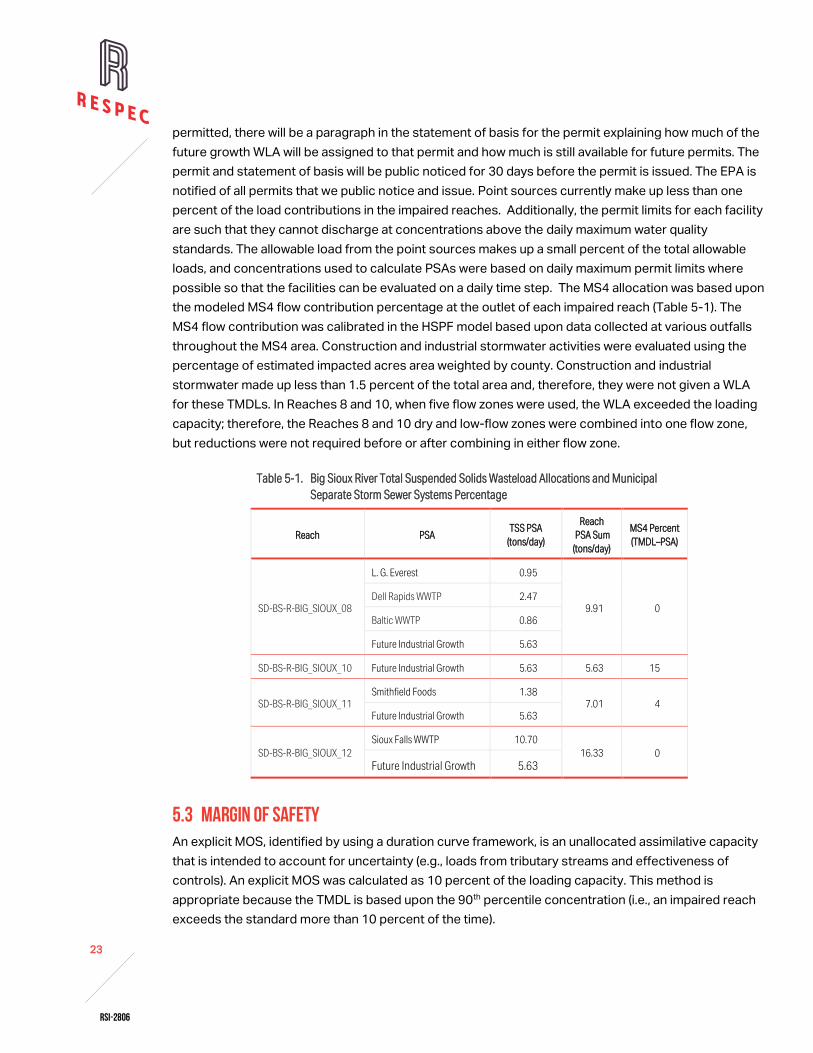
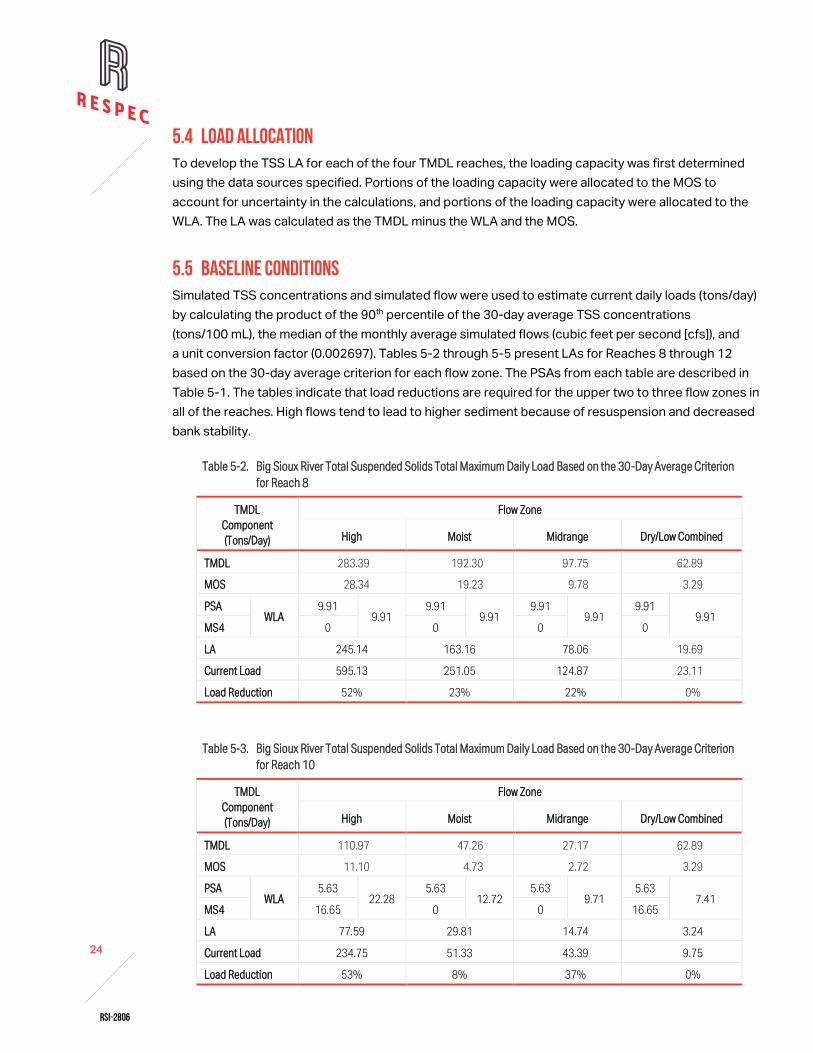
DENR relied on two methods to establish the loading capacity for each impaired segment: the Hydrological Simulation Program - FORTRAN (HSPF) model and the load duration curve approach. HSPF is a computer model that simulates hydrologic processes on the land surface and subsurface as well as the associated in-stream water quality. TSS monitoring data collected primarily by DENR, the U.S. Geological Survey (USGS) and the City of Sioux Fall, plus continuous flow recorded by the USGS, were used to calibrate the model as described in the original HSPF modeling report (RESPEC. 2012). The model was updated for the 2019 TMDL revisions with new meteorological data, land cover information, and diversion representations among other updates as explained in the 2019 modeling memo (RESPEC. 2019). DENR used the model to link sources of TSS to existing water quality and to evaluate TMDL implementation options through various scenario runs. Additionally, HSPF-generated flows and predicted TSS concentrations from the updated model were used to characterize existing loading conditions and establish the load duration curves used to define the loading capacity for each segment. A load duration curve is a graphic representation of pollutant loads across flow regimes and the approach helps correlate water quality to flow conditions and provides insight into the variability of source contributions. EPA has provided guidance on the use of duration curves for TMDL development (USEPA. 2007b) and the practice is well established. Using this approach, DENR developed TMDLs at five different flow zones (i.e., high, moist, midrange, dry, low) for each segment as listed in Tables 5-2, 5-3, 5-4 and 5-5. Load duration curves, and the loading capacities based on the curves, are shown visually in Figures 4-1, 4-2, 4-3 and 4-4. While loading capacities are defined for multiple flow conditions, critical conditions exist in terms of the greatest observed exceedances during the high flow zone. DENR attributes the higher TSS concentrations during these conditions to streambed resuspension and decreased bank stability. Assessment: EPA concludes that the loading capacity was calculated using an acceptable approach, used water quality targets consistent with numeric water quality criteria, and has been appropriately set at a level necessary to attain and maintain the applicable water quality standards. The pollutant loads have been expressed as daily loads. The critical conditions were described and factored into the calculations and were based on a reasonable approach to establish the relationship between the target and pollutant sources.
6
4. Load Allocation
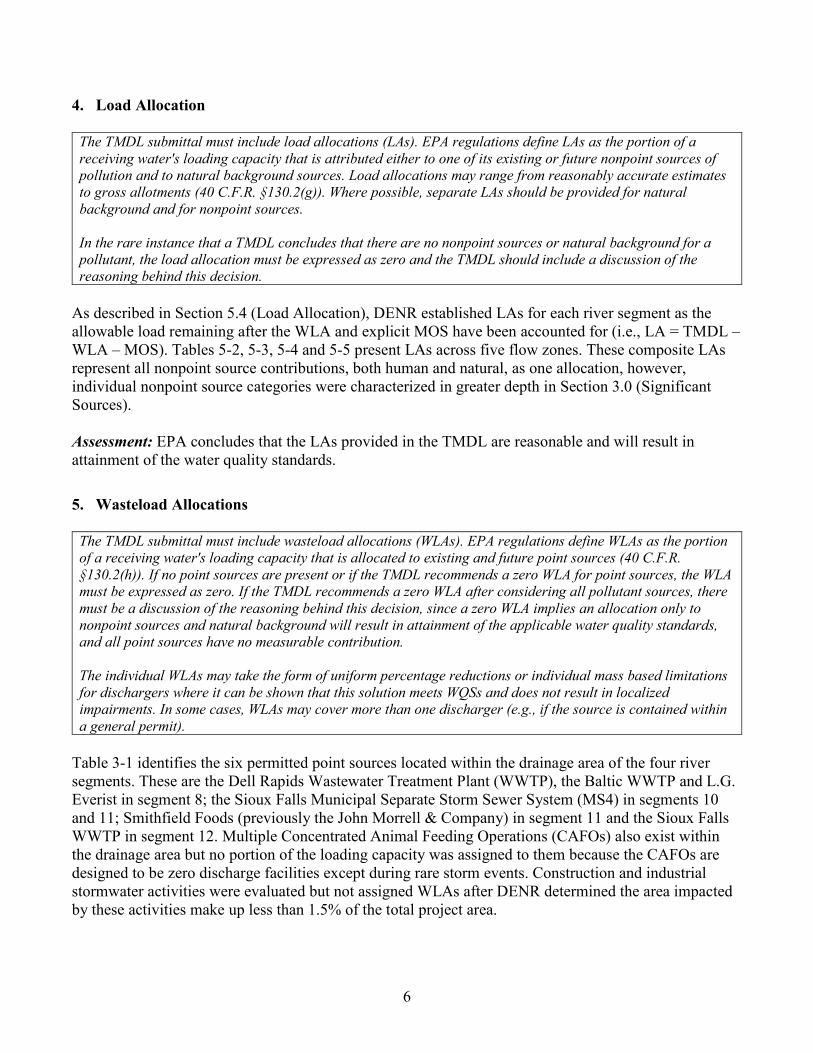
The TMDL submittal must include load allocations (LAs). EPA regulations define LAs as the portion of a receiving water's loading capacity that is attributed either to one of its existing or future nonpoint sources of pollution and to natural background sources. Load allocations may range from reasonably accurate estimates to gross allotments (40 C.F.R. §130.2(g)). Where possible, separate LAs should be provided for natural background and for nonpoint sources. In the rare instance that a TMDL concludes that there are no nonpoint sources or natural background for a pollutant, the load allocation must be expressed as zero and the TMDL should include a discussion of the reasoning behind this decision.
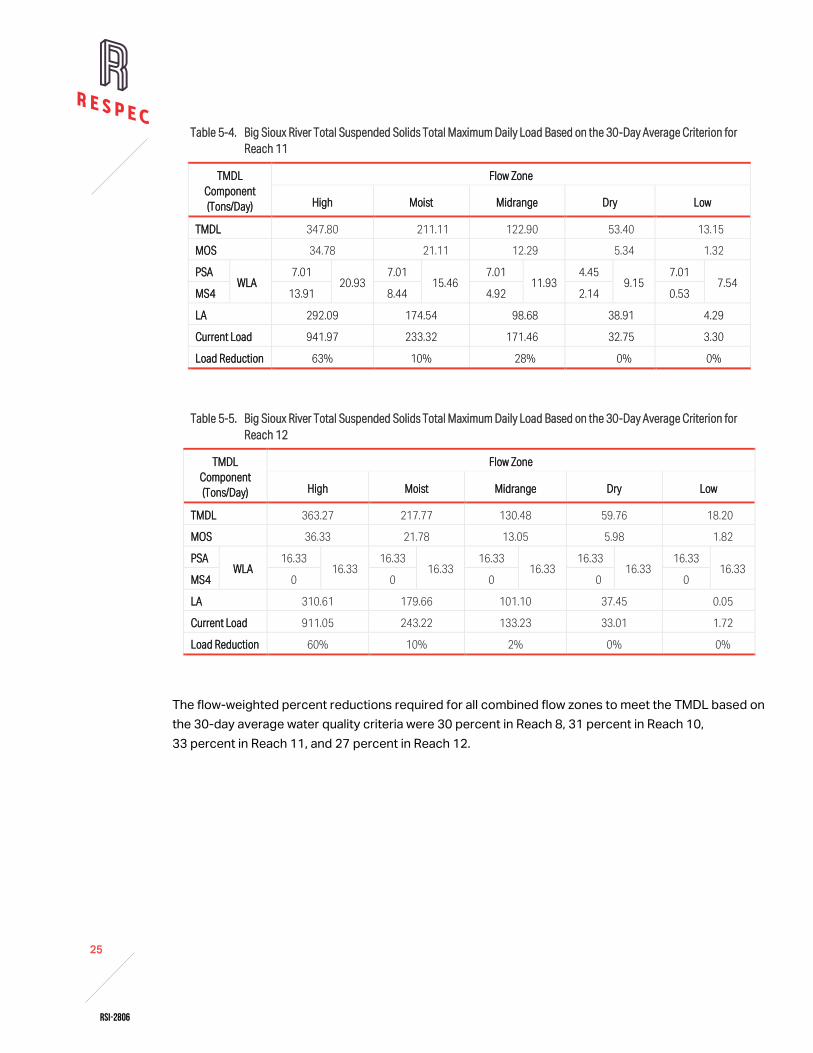
As described in Section 5.4 (Load Allocation), DENR established LAs for each river segment as the allowable load remaining after the WLA and explicit MOS have been accounted for (i.e., LA = TMDL – WLA – MOS). Tables 5-2, 5-3, 5-4 and 5-5 present LAs across five flow zones. These composite LAs represent all nonpoint source contributions, both human and natural, as one allocation, however, individual nonpoint source categories were characterized in greater depth in Section 3.0 (Significant Sources). Assessment: EPA concludes that the LAs provided in the TMDL are reasonable and will result in attainment of the water quality standards. 5. Wasteload Allocations
The TMDL submittal must include wasteload allocations (WLAs). EPA regulations define WLAs as the portion of a receiving water's loading capacity that is allocated to existing and future point sources (40 C.F.R. §130.2(h)). If no point sources are present or if the TMDL recommends a zero WLA for point sources, the WLA must be expressed as zero. If the TMDL recommends a zero WLA after considering all pollutant sources, there must be a discussion of the reasoning behind this decision, since a zero WLA implies an allocation only to nonpoint sources and natural background will result in attainment of the applicable water quality standards, and all point sources have no measurable contribution. The individual WLAs may take the form of uniform percentage reductions or individual mass based limitations for dischargers where it can be shown that this solution meets WQSs and does not result in localized impairments. In some cases, WLAs may cover more than one discharger (e.g., if the source is contained within a general permit).
Table 3-1 identifies the six permitted point sources located within the drainage area of the four river segments. These are the Dell Rapids Wastewater Treatment Plant (WWTP), the Baltic WWTP and L.G. Everist in segment 8; the Sioux Falls Municipal Separate Storm Sewer System (MS4) in segments 10 and 11; Smithfield Foods (previously the John Morrell & Company) in segment 11 and the Sioux Falls WWTP in segment 12. Multiple Concentrated Animal Feeding Operations (CAFOs) also exist within the drainage area but no portion of the loading capacity was assigned to them because the CAFOs are designed to be zero discharge facilities except during rare storm events. Construction and industrial stormwater activities were evaluated but not assigned WLAs after DENR determined the area impacted by these activities make up less than 1.5% of the total project area.
7
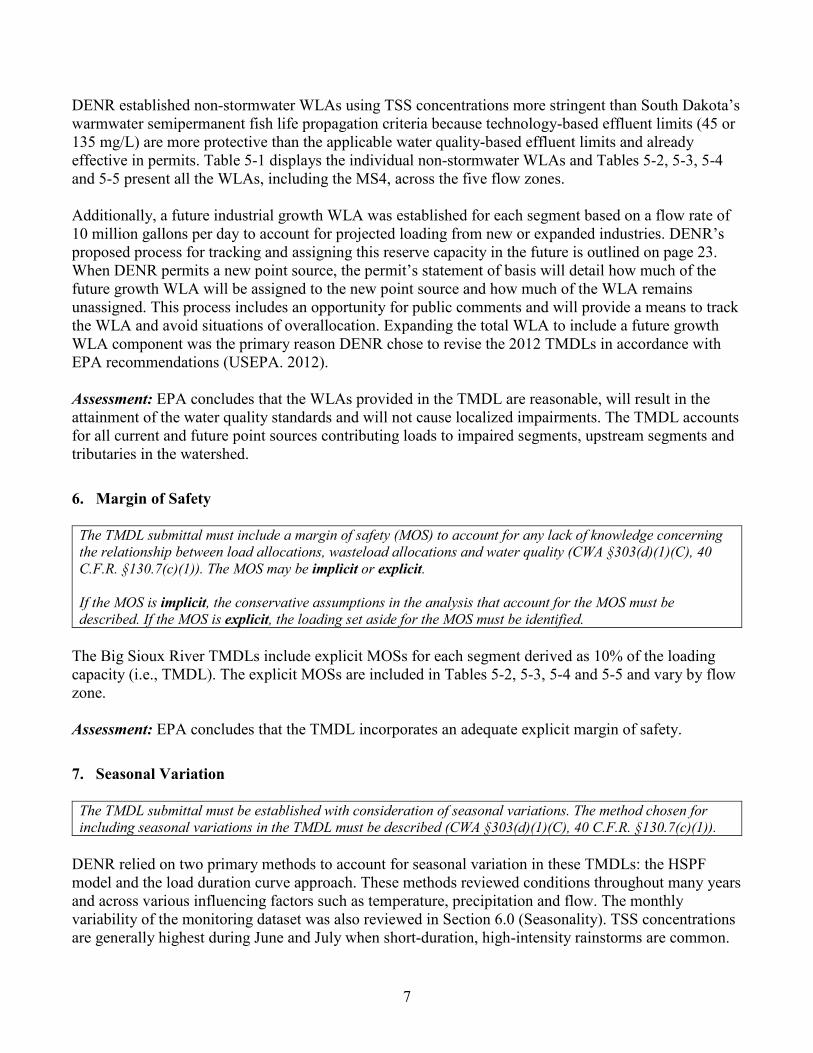
DENR established non-stormwater WLAs using TSS concentrations more stringent than South Dakota’s warmwater semipermanent fish life propagation criteria because technology-based effluent limits (45 or 135 mg/L) are more protective than the applicable water quality-based effluent limits and already effective in permits. Table 5-1 displays the individual non-stormwater WLAs and Tables 5-2, 5-3, 5-4 and 5-5 present all the WLAs, including the MS4, across the five flow zones. Additionally, a future industrial growth WLA was established for each segment based on a flow rate of 10 million gallons per day to account for projected loading from new or expanded industries. DENR’s proposed process for tracking and assigning this reserve capacity in the future is outlined on page 23. When DENR permits a new point source, the permit’s statement of basis will detail how much of the future growth WLA will be assigned to the new point source and how much of the WLA remains unassigned. This process includes an opportunity for public comments and will provide a means to track the WLA and avoid situations of overallocation. Expanding the total WLA to include a future growth WLA component was the primary reason DENR chose to revise the 2012 TMDLs in accordance with EPA recommendations (USEPA. 2012). Assessment: EPA concludes that the WLAs provided in the TMDL are reasonable, will result in the attainment of the water quality standards and will not cause localized impairments. The TMDL accounts for all current and future point sources contributing loads to impaired segments, upstream segments and tributaries in the watershed. 6. Margin of Safety
The TMDL submittal must include a margin of safety (MOS) to account for any lack of knowledge concerning the relationship between load allocations, wasteload allocations and water quality (CWA §303(d)(1)(C), 40 C.F.R. §130.7(c)(1)). The MOS may be implicit or explicit. If the MOS is implicit, the conservative assumptions in the analysis that account for the MOS must be described. If the MOS is explicit, the loading set aside for the MOS must be identified.
The Big Sioux River TMDLs include explicit MOSs for each segment derived as 10% of the loading capacity (i.e., TMDL). The explicit MOSs are included in Tables 5-2, 5-3, 5-4 and 5-5 and vary by flow zone. Assessment: EPA concludes that the TMDL incorporates an adequate explicit margin of safety. 7. Seasonal Variation
The TMDL submittal must be established with consideration of seasonal variations. The method chosen for including seasonal variations in the TMDL must be described (CWA §303(d)(1)(C), 40 C.F.R. §130.7(c)(1)).
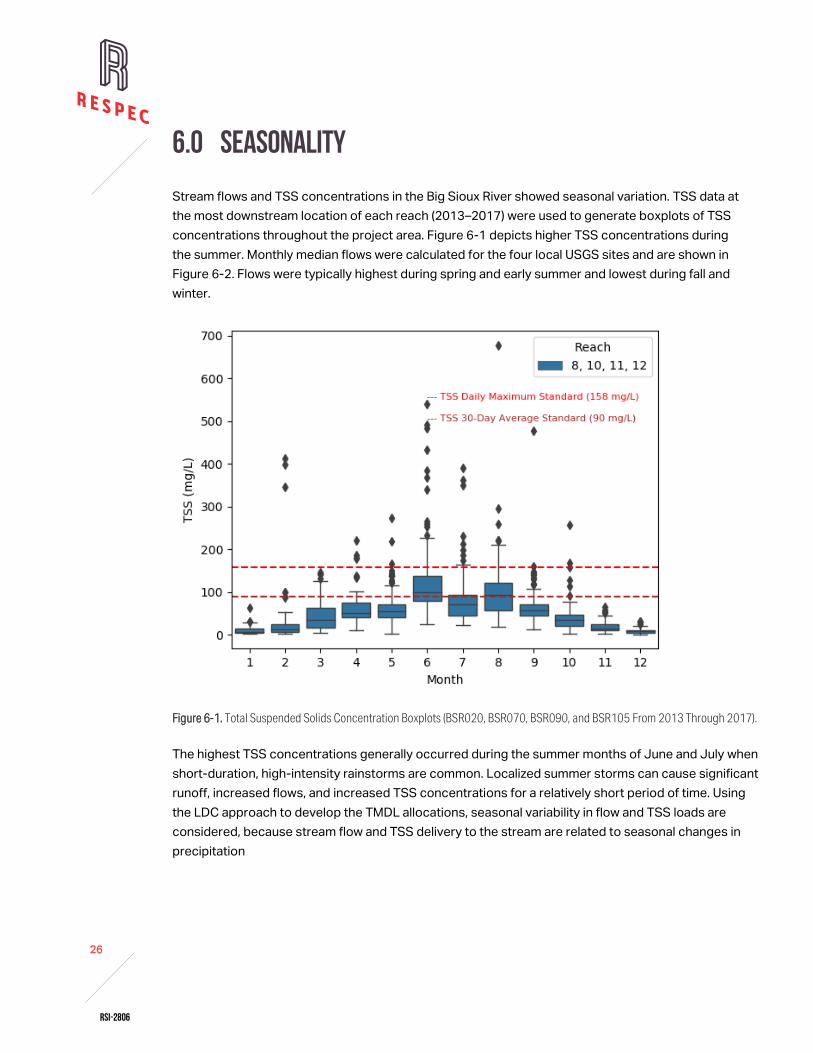
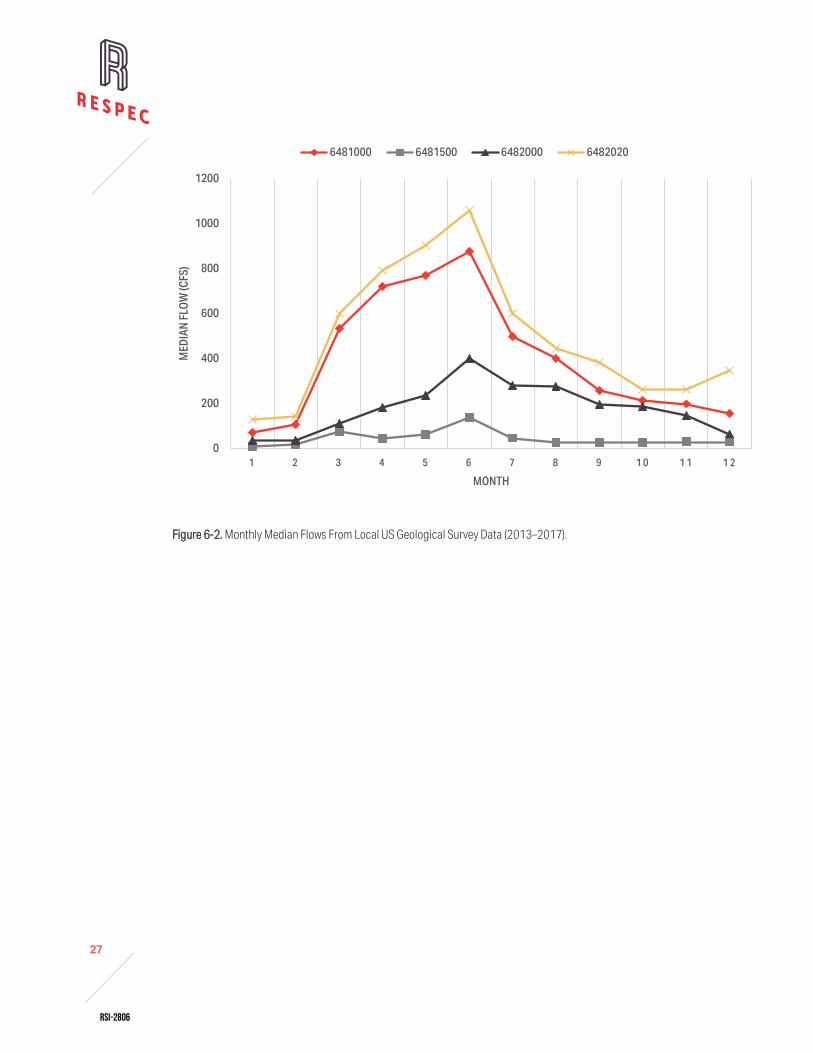
DENR relied on two primary methods to account for seasonal variation in these TMDLs: the HSPF model and the load duration curve approach. These methods reviewed conditions throughout many years and across various influencing factors such as temperature, precipitation and flow. The monthly variability of the monitoring dataset was also reviewed in Section 6.0 (Seasonality). TSS concentrations are generally highest during June and July when short-duration, high-intensity rainstorms are common.
8
Localized summer storms can cause significant runoff, increased flows, and increased TSS concentrations for a relatively short period of time. Assessment: EPA concludes that seasonal variations were adequately described and considered to ensure the TMDL allocations will be protective of the applicable water quality standards throughout any given year. 8. Reasonable Assurances
When a TMDL is developed for waters impaired by both point and nonpoint sources, EPA guidance (USEPA. 1991) and court decisions say that the TMDL must provide reasonable assurances that nonpoint source control measures will achieve expected load reductions in order for the TMDL to be approvable. This information is necessary for EPA to determine that the TMDL, including the load and wasteload allocations, has been established at a level necessary to implement the applicable water quality standards (CWA §303(d)(1)(C), 40 C.F.R. §130.7(c)(1)). EPA guidance (USEPA. 1997) also directs Regions to work with States to achieve TMDL load allocations in waters impaired only by nonpoint sources. However, EPA cannot disapprove a TMDL for nonpoint source-only impaired waters, which do not have a demonstration of reasonable assurance that LAs will be achieved, because such a showing is not required by current regulations.
As verified through the TMDL analysis, segments 8, 10, 11 and 12 of the Big Sioux River are impaired by both point and nonpoint sources of TSS therefore reasonable assurances must be provided. DENR has done so in Section 9.3 (Reasonable Assurance). The City of Sioux Falls led the development of the Draft Central Big Sioux River Watershed Water Quality Master Plan (City of Sioux Falls. 2013) to guide implementation efforts after the 2012 TMDLs were written. It addresses all nine key elements of a watershed plan as described by EPA’s CWA Section 319 guidance (USEPA. 2008b). Within this plan, a watershed-scale, decision-support framework based on cost optimization was developed to support government and local planning agencies as they considered watershed-scale investments to improve water quality. This decision-support framework assisted in developing a more detailed TMDL implementation plan, identifying management practices to achieve pollutant reductions under the MS4 stormwater permit, and developing a phased BMP installation plan that is optimized for both cost and water quality effectiveness. Section 9.1 (Recent Implementation) summarizes the quantity, location and costs of all installed BMPs known to DENR at this time. These activities are grouped into categories of agricultural waste systems, bank stabilization, cropland BMPs, grazing management and riparian restoration/protection, and city BMPs. For example, over $2.5 million dollars have been spent on grazing management and riparian restoration/protection BMPs in the project area; over $139 thousand of that came from EPA CWA Section 319 grants. Reductions necessary to meet LAs are expected to occur through the continued implementation of BMPs as described in existing planning documents (City of Sioux Falls. 2013) and local partnerships that support voluntary actions to address nonpoint sources. WLAs were established based on facilities meeting technology-based effluent limits which are more stringent than South Dakota’s TSS water quality criteria. Existing NPDES permit requirements are sufficient to be consistent with WLAs in the TMDL. Concerning MS4 controls, five stormwater BMPs
9
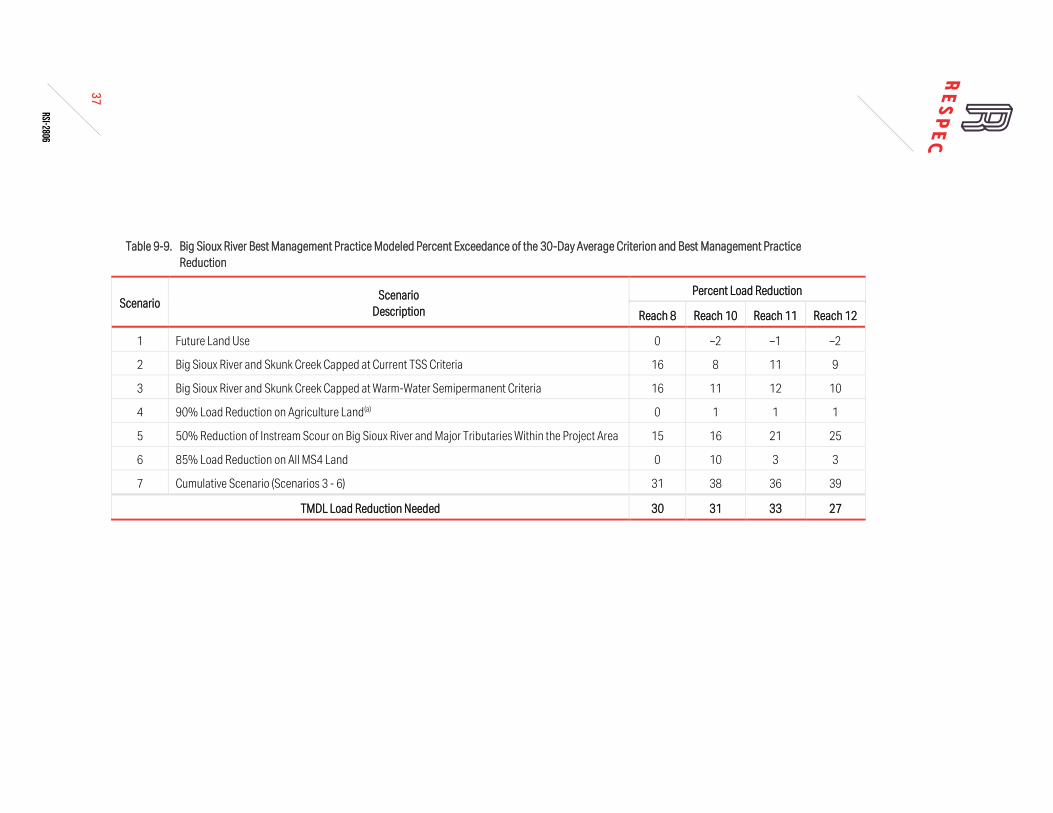
have been installed since 2012 and Table 9-8 lists the planned location and date of future stormwater BMPs extending out till 2026. Lastly, DENR compared the potential reductions realized under various HSPF modeling scenarios to the total TMDL reductions in order to demonstrate that the reductions called for are possible. This comparison is summarized in Table 9-9. Assessment: EPA considered the reasonable assurances contained in the TMDL submittal and concludes that they are adequate to meet the load reductions. 9. Monitoring Plan
The TMDL submittal should include a monitoring plan for all: • Phased TMDLs; and • TMDLs with both WLA(s) and LA(s) where reasonable assurances are provided.
Under certain circumstances, a phased TMDL should be developed when there is significant uncertainty associated with the selection of appropriate numeric targets, estimates of source loadings, assimilative capacity, allocations or when limited existing data are relied upon to develop a TMDL. EPA guidance (USEPA. 2006b) recommends that a phased TMDL submittal, or a separate document (e.g., implementation plan), include a monitoring plan, an explanation of how the supplemental data will be used to address any uncertainties that may exist when the phased TMDL is prepared and a scheduled timeframe for revision of the TMDL. For TMDLs that need to provide reasonable assurances, the monitoring plan should describe the additional data to be collected to determine if the load reductions included in the TMDL are occurring and leading to attainment of water quality standards. EPA guidance (USEPA. 1991, USEPA. 2008a) recommends post-implementation monitoring for all TMDLs to determine the success of the implementation efforts. Monitoring plans are not a required part of the TMDL and are not approved by EPA but may be necessary to support the decision rationale for approval of the TMDL.
DENR recently initiated a rotating basin approach to revisit established ambient water quality monitoring stations on a regular basis. With help from local DENR partners, like the East Dakota Water Development District, the Big Sioux River Basin will experience a comprehensive monitoring campaign in 2019. One aspect of this larger strategy involves collecting additional TSS samples from stations on segments 8, 10, 11, and 12 of the Big Sioux River. This information, and data collected in future years, will help gage the success of restoration efforts and provide insight into what actions still need to occur. Assessment: Monitoring plans are not a required element of EPA’s TMDL review and decision-making process. The TMDLs submitted by DENR include a monitoring strategy (Section 8.0) written to encourage future monitoring to measure progress toward attainment of water quality standards. The rotating basin approach is not mentioned in the TMDL, but EPA was aware of the effort and thought it noteworthy to mention. EPA is taking no action on the monitoring strategy included in the TMDL submittal.
10
10. Implementation
EPA policy (USEPA. 1997) encourages Regions to work in partnership with States/Tribes to achieve nonpoint source load allocations established for 303(d)-listed waters impaired by nonpoint sources. Regions may assist States/Tribes in developing implementation plans that include reasonable assurances that nonpoint source LAs established in TMDLs for waters impaired solely or primarily by nonpoint sources will in fact be achieved. The policy recognizes that other relevant watershed management processes may be used in the TMDL process. EPA is not required to and does not approve TMDL implementation plans. EPA encourages States/Tribes to include restoration recommendations (e.g., framework) in all TMDLs for stakeholder and public use to guide future implementation planning. This could include identification of a range of potential management measures and practices that might be feasible for addressing the main loading sources in the watershed (see USEPA. 2008b, Chapter 10). Implementation plans are not a required part of the TMDL and are not approved by EPA but may be necessary to support the decision rationale for approval of the TMDL.
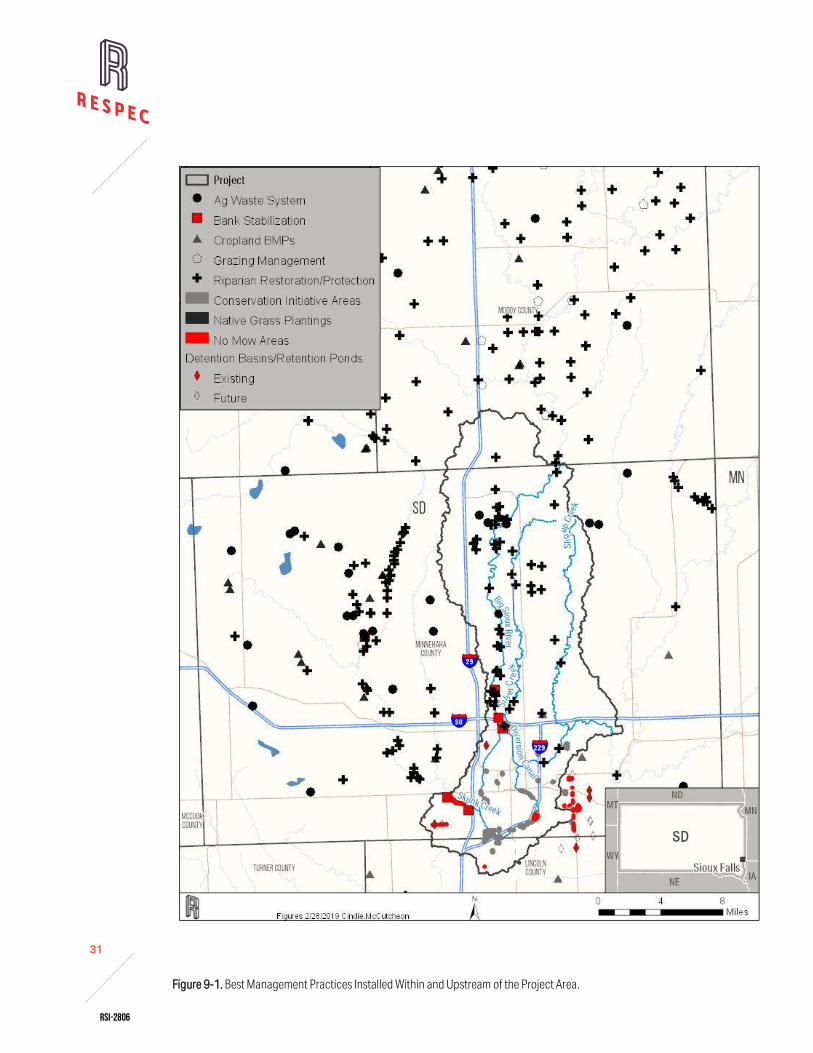
Section 9.0 (Restoration Strategy) summarizes implementation activities that have already occurred, discusses future management scenarios simulated by the HSPF model and outlines DENR’s adaptive approach to TMDL implementation. The locations of existing best management practices are shown on a map (Figure 9-1) and quantified by category in term of the number of practices and the money spent to implement them. The HSPF model was used to better understand what additional actions must occur in order to meet water quality standards in each river segment. DENR simulated the following scenarios:
1. Future land use (e.g., agricultural lands converted into residential), 2. Upstream boundary conditions meet local upstream criteria (e.g., Big Sioux River above segment
8 meets 90 mg/L TSS and Skunk Creek meets 150 mg/L TSS), 3. Upstream boundary conditions meet warmwater semipermanent fish life propagation criteria
(e.g. Big Sioux River above segment 8 and Skunk Creek both meet 90 mg/L TSS), 4. Loading from agricultural lands above Sioux Falls reduced by 90%, 5. Loading from instream scour on the Big Sioux River and major tributaries within the project area
reduced by 50%, 6. Loading from the MS4 reduced by 85%, 7. Combined scenarios 3, 4, 5 and 6.
Simulated load reductions are presented for each scenario and segment in Table 9-9 and compared to the load reductions called for by the TMDL. Scenario 7 is the only scenario shown to consistently meet TMDL reduction goals. Lastly, DENR commits to an iterative implementation process that makes progress toward achieving water quality goals by using new data and information whenever available to reduce uncertainty and adjust implementation activities accordingly. Assessment: Although not a required element of the TMDL approval, DENR discussed how information derived from the TMDL analysis process can be used to support implementation of the TMDLs. EPA is taking no action on the implementation portion of the TMDL submittal.
11
11. Public Participation
EPA policy is that there must be full and meaningful public participation in the TMDL development process. Each State/Tribe must, therefore, provide for public participation consistent with its own continuing planning process and public participation requirements (40 C.F.R. §25.3 and §130.7(c)(1)(ii)). The final TMDL submittal must describe the State/Tribe’s public participation process, including a summary of significant comments and the State/Tribe’s responses to those comments (40 C.F.R. §25.3 and §25.8). Inadequate public participation could be a basis for disapproving a TMDL; however, where EPA determines that a State/Tribe has not provided adequate public participation, EPA may defer its approval action until adequate public participation has been provided for, either by the State/Tribe or by EPA.
Section 7.0 (Public Participation) revisits the public engagement process DENR followed for the original 2012 TMDLs and summarizes what occurred for the revisions. DENR held a public meeting at the City of Sioux Falls Environmental Office on November 26, 2018. Subsequently, a draft of the updated TMDL report was made available for download and public review on DENR’s website from May 16 to June 17, 2019. The public review period was announced in several area newspapers published on May 13 including the Sioux Falls Argus Leader, the Madison Daily Leader, and the Moody County Enterprise. DENR received no public comments on the revised TMDLs. Assessment: EPA has reviewed the state’s public participation process and concludes that the state involved the public during the development of the TMDLs and provided adequate opportunities for the public to comment on the draft report. 12. Submittal Letter
The final TMDL submittal must be accompanied by a submittal letter that explicitly states that the submittal is a final TMDL submitted under Section 303(d) of the Clean Water Act for EPA review and approval. This clearly establishes the State’s/Tribe’s intent to submit, and EPA’s duty to review, the TMDL under the statute (40 C.F.R. §130.7(d)(1)). The final submittal letter should contain such identifying information as the waterbody name, location, assessment unit number and the pollutant(s) of concern.
A transmittal letter with the appropriate information was included with the final TMDL report submission from DENR, dated June 21, 2019, and signed by Paul Lorenzen, Environmental Scientist Manager 1, Water Protection Program. Two technical reports further documenting how the HSPF model was applied to this project were also shared as attachments (RESPEC. 2012, RESPEC. 2019). Assessment: EPA concludes that the state’s submittal package clearly and unambiguously requested EPA to act on the TMDLs in accordance with the Clean Water Act and the submittal contained all necessary supporting information.
12
References RESPEC. 2012. Sioux Falls Total Maximum Daily Load Model Application, Development, Calibration, and Validation. Topical Report RSI-2272. Prepared for SD DENR by RESPEC Consulting & Services, Rapid City, SD. RESPEC. 2019. External Memorandum: Sioux Falls 2018 Total Maximum Daily Load Update, Changes to HSPF Model Application and Total Maximum Daily Load Documents. Prepared for SD DENR by RESPEC Consulting & Services, Rapid City, SD. SD DENR. 2012. Total Suspended Solids Total Maximum Daily Load for the Big Sioux River, Minnehaha County South Dakota. Topical Report RSI-2182. Prepared for SD DENR by RESPEC Consulting & Services, Rapid City, SD. USEPA. 1991. Guidance for water quality-based decisions: The TMDL process. EPA 440-4-91-001. Office of Water, Assessment and Watershed Protection Division and Office of Wetlands, Oceans, and Watersheds, U.S. Environmental Protection Agency, Washington, DC. USEPA. 1997. New policies for establishing and implementing Total Maximum Daily Loads (TMDLs). Office of Water, U.S. Environmental Protection Agency, Washington, DC. USEPA. 2006a. Establishing TMDL "Daily" Loads in Light of the Decision by the U.S. Court of Appeals for the D.C. Circuit. Office of Water, Office of Wetlands, Oceans, and Watersheds, U.S. Environmental Protection Agency, Washington, DC. USEPA. 2006b. Clarification Regarding “Phased” Total Maximum Daily Loads. Office of Water, Office of Wetlands, Oceans, and Watersheds, U.S. Environmental Protection Agency, Washington, DC. USEPA. 2007a. Options for Expressing Daily Loads in TMDLs - DRAFT. Office of Water, Office of Wetlands, Oceans, and Watersheds, U.S. Environmental Protection Agency, Washington, DC. USEPA. 2007b. An Approach for Using Load Duration Curves in the Development of TMDLs. EPA-841-B-07-006. Office of Water, Office of Wetlands, Oceans and Watersheds, U.S. Environmental Protection Agency, Washington, DC. USEPA. 2008a. Handbook for Developing Watershed TMDLs – DRAFT. Office of Water, Office of Wetlands, Oceans, and Watersheds, U.S. Environmental Protection Agency, Washington, DC. USEPA. 2008b. Handbook for Developing Watershed Plans to Restore and Protect our Waters. EPA-841-B-08-002. Office of Water, Environmental Protection Agency, Washington, DC. USEPA. 2010. National Pollutant Discharge Elimination System (NPDES) Permit Writers’ Manual, Chapter 6, Water Quality-Based Effluent Limitations. EPA-833-K-10-001. Office of Water, Office of Wastewater Management, Water Permits Division, Washington, DC. USEPA. 2012. Considerations for Revising and Withdrawing TMDLs – DRAFT. Office of Water, Office of Wetlands, Oceans, and Watersheds, U.S. Environmental Protection Agency, Washington, DC. USEPA. 2014. Water Quality Standards Handbook: Chapter 1: General Provisions. EPA-820-B-14-008. EPA Office of Water, Office of Science and Technology, Washington, DC.
13
USEPA. 2017. Water Quality Standards Handbook: Chapter 3: Water Quality Criteria. EPA-823-B-17-001. EPA Office of Water, Office of Science and Technology, Washington, DC.
RSI-2806
i
2
Total Maximum Daily Load Summary
Waterbody Name/Description Big Sioux River (S2, T104N, R49W to I-90)
Assessment Unit I.D. SD-BS-R-BIG_SIOUX_08
Waterbody Type River
Size of Impaired Waterbody 28.5 miles (45.8 kilometers)
Size of Watershed (Incremental) 79.0 square miles (204.7 square kilometers)
Location 12-digit Hydrologic Unit Code (HUC): 101702030604, 101702030605, and
101702031201
Impaired Designated Use(s) Warm-water Semipermanent Fish Life
303(d) Listing Parameter Total Suspended Solids (TSS)
Cycle Most Recently Listed 2018 South Dakota Integrated Report
TMDL Priority Ranking N/A
TMDL Criteria Threshold Values
Indicator Name: TSS
Threshold Values: Maximum daily concentration of 158 milligrams per liter (mg/L)
and a 30-day average of at least three consecutive grab or composite samples taken
on separate weeks in a 30-day period of 90 mg/L.
Analytical Approach Load-duration curves and HSPF modeling
High-Flow Zone LA 245.14 tons/day
High-Flow Zone PS WLA 9.91 tons/day
High-Flow Zone MS4 WLA 0 tons/day
High-Flow Zone MOS 28.34 tons/day
High-Flow Zone TMDL 283.39 tons/day
RSI-2806
ii
2
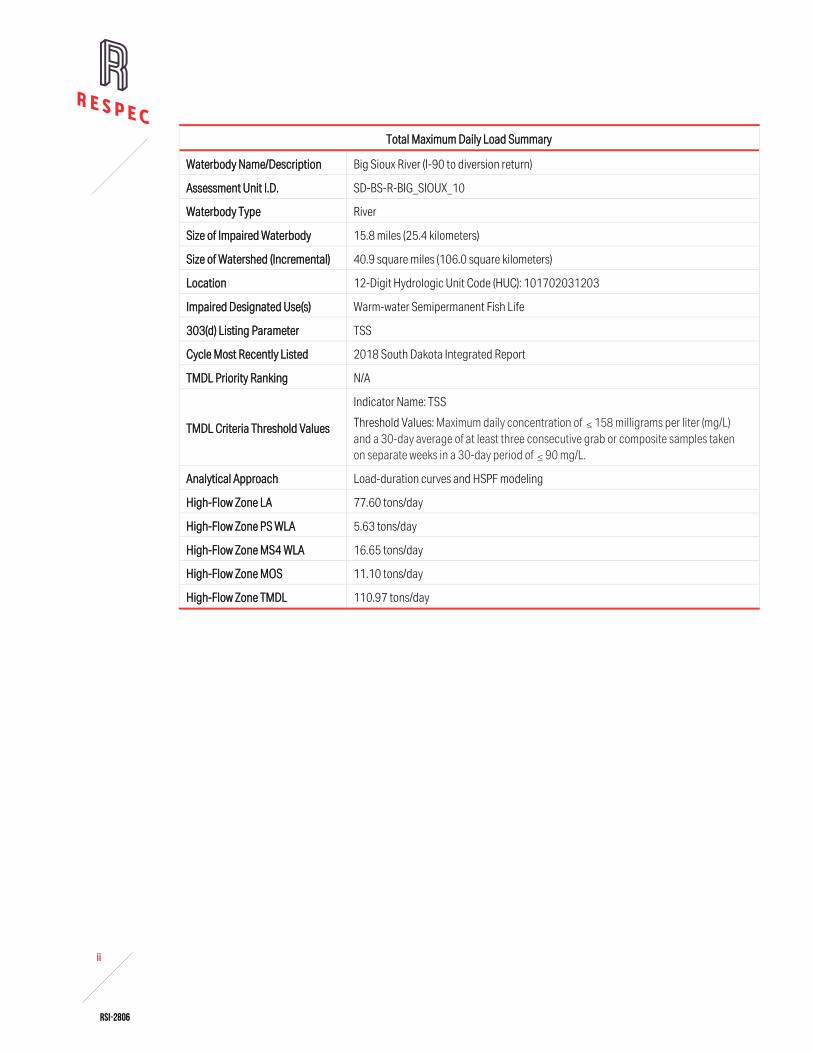
Total Maximum Daily Load Summary
Waterbody Name/Description Big Sioux River (I-90 to diversion return)
Assessment Unit I.D. SD-BS-R-BIG_SIOUX_10
Waterbody Type River
Size of Impaired Waterbody 15.8 miles (25.4 kilometers)
Size of Watershed (Incremental) 40.9 square miles (106.0 square kilometers)
Location 12-Digit Hydrologic Unit Code (HUC): 101702031203
Impaired Designated Use(s) Warm-water Semipermanent Fish Life
303(d) Listing Parameter TSS
Cycle Most Recently Listed 2018 South Dakota Integrated Report
TMDL Priority Ranking N/A
TMDL Criteria Threshold Values
Indicator Name: TSS
Threshold Values: Maximum daily concentration of 158 milligrams per liter (mg/L)
and a 30-day average of at least three consecutive grab or composite samples taken
on separate weeks in a 30-day period of 90 mg/L.
Analytical Approach Load-duration curves and HSPF modeling
High-Flow Zone LA 77.60 tons/day
High-Flow Zone PS WLA 5.63 tons/day
High-Flow Zone MS4 WLA 16.65 tons/day
High-Flow Zone MOS 11.10 tons/day
High-Flow Zone TMDL 110.97 tons/day
RSI-2806
iii
2
Total Maximum Daily Load Summary
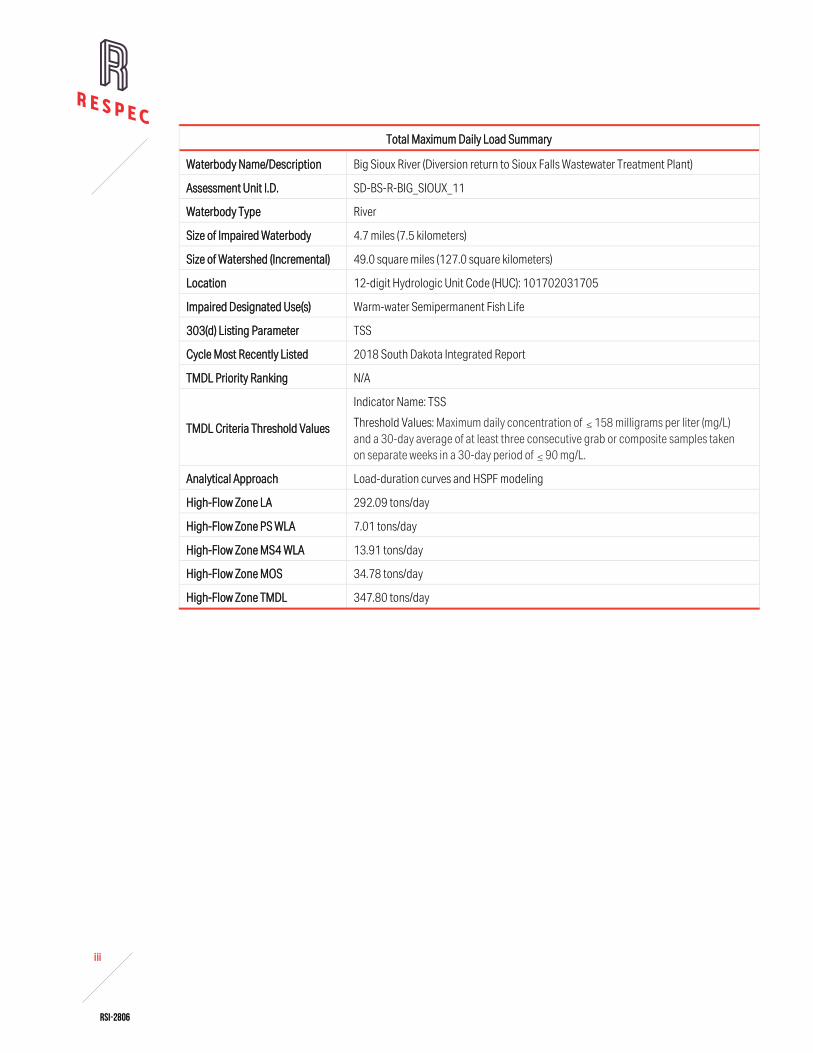
Waterbody Name/Description Big Sioux River (Diversion return to Sioux Falls Wastewater Treatment Plant)
Assessment Unit I.D. SD-BS-R-BIG_SIOUX_11
Waterbody Type River
Size of Impaired Waterbody 4.7 miles (7.5 kilometers)
Size of Watershed (Incremental) 49.0 square miles (127.0 square kilometers)
Location 12-digit Hydrologic Unit Code (HUC): 101702031705
Impaired Designated Use(s) Warm-water Semipermanent Fish Life
303(d) Listing Parameter TSS
Cycle Most Recently Listed 2018 South Dakota Integrated Report
TMDL Priority Ranking N/A
TMDL Criteria Threshold Values
Indicator Name: TSS
Threshold Values: Maximum daily concentration of 158 milligrams per liter (mg/L)
and a 30-day average of at least three consecutive grab or composite samples taken
on separate weeks in a 30-day period of 90 mg/L.
Analytical Approach Load-duration curves and HSPF modeling
High-Flow Zone LA 292.09 tons/day
High-Flow Zone PS WLA 7.01 tons/day
High-Flow Zone MS4 WLA 13.91 tons/day
High-Flow Zone MOS 34.78 tons/day
High-Flow Zone TMDL 347.80 tons/day
RSI-2806
iv
2
Total Maximum Daily Load Summary
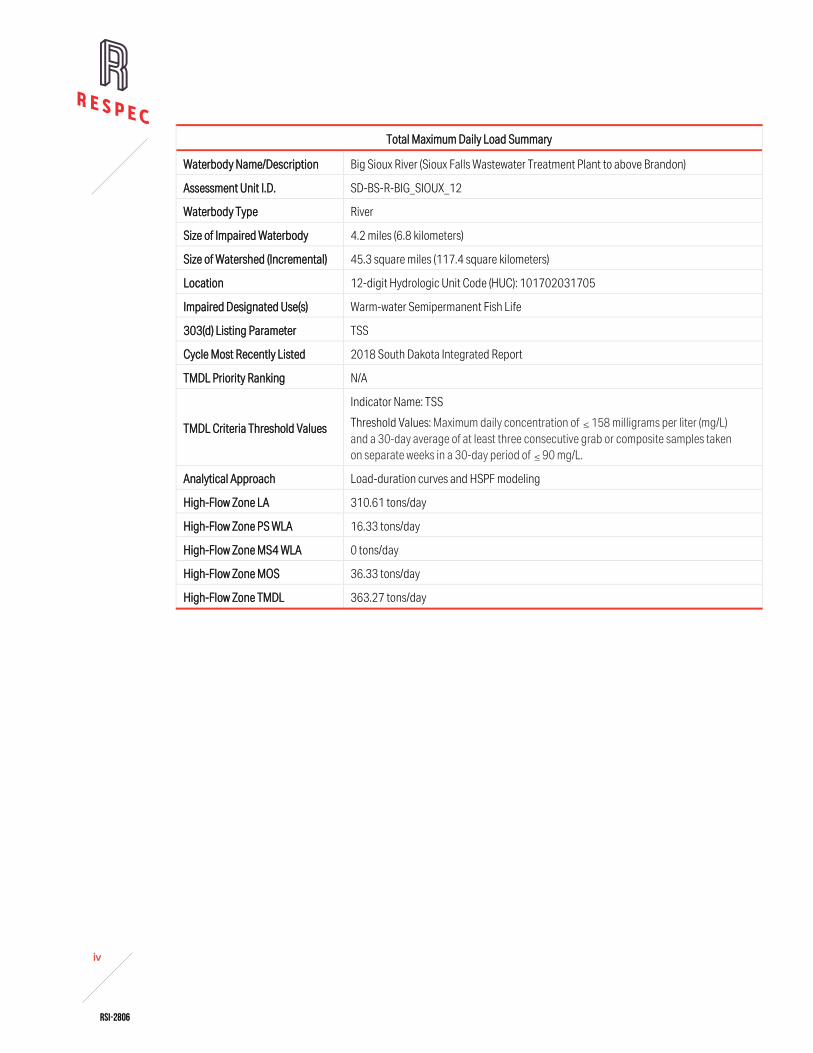
Waterbody Name/Description Big Sioux River (Sioux Falls Wastewater Treatment Plant to above Brandon)
Assessment Unit I.D. SD-BS-R-BIG_SIOUX_12
Waterbody Type River
Size of Impaired Waterbody 4.2 miles (6.8 kilometers)
Size of Watershed (Incremental) 45.3 square miles (117.4 square kilometers)
Location 12-digit Hydrologic Unit Code (HUC): 101702031705
Impaired Designated Use(s) Warm-water Semipermanent Fish Life
303(d) Listing Parameter TSS
Cycle Most Recently Listed 2018 South Dakota Integrated Report
TMDL Priority Ranking N/A
TMDL Criteria Threshold Values
Indicator Name: TSS
Threshold Values: Maximum daily concentration of 158 milligrams per liter (mg/L)
and a 30-day average of at least three consecutive grab or composite samples taken
on separate weeks in a 30-day period of 90 mg/L.
Analytical Approach Load-duration curves and HSPF modeling
High-Flow Zone LA 310.61 tons/day
High-Flow Zone PS WLA 16.33 tons/day
High-Flow Zone MS4 WLA 0 tons/day
High-Flow Zone MOS 36.33 tons/day
High-Flow Zone TMDL 363.27 tons/day
RSI-2806
v
2
EXECUTIVE SUMMARY
This Total Maximum Daily Load (TMDL) assessment was completed as an update to an existing TMDL
assessment for Big Sioux River impaired waterbodies near the city of Sioux Falls. The assessment
addresses E. coli impairments in four river and stream reaches. A second TMDL assessment and TMDL
assessment update was completed in the same four river and stream reaches for total suspended
solids impairments. The goal of these TMDL updates was to quantify the pollutant reductions needed to
meet the state water quality standards for E. coli and TSS in more recent years (i.e., 2013–2017).
Reserve capacity was also added to the point source portion of the wasteload allocations to
accommodate inevitable growth within the city of Sioux Falls. Because the point sources currently
contribute less than one percent of the overall E. coli and TSS load, the point-source concentrations
must remain below the water quality standards, and the point-source allocations are generally less than
the margin of safety; thereby, the increased point-source allocations are not a water quality concern.
TMDLs described herein were derived from output of an HSPF model and observed data collected from
2013–2017. This model was calibrated to available flows (2005–2017), monitored water quality, and the
latest National Land Cover Database and City of Sioux Falls Parcel Data. HSPF-estimated runoff and
pollutant characterizations were employed to assess TMDLs for stream E. coli and TSS. HSPF-
generated flows and outputs were used to establish load-duration curves for the E. coli and TSS
impairments with wasteload allocations and load allocations established for five flow duration curve
categories: high, moist, mid, low, and dry conditions. Reductions required to achieve state bacteria
standards range from 0 percent to 96 percent by TMDL duration curve category. The reductions that
are required to achieve state TSS standards range from 0 percent to 63 percent by TMDL duration
curve category.
Restoring water quality will continue to be aided by the interdependent and cooperative efforts of the
local communities, counties, state, and federal partners via leveraged management actions phased
over budgetary cycles regarding the largest pollutant sources. Of the best management practices
(BMPs), widespread adoption of buffers and streambank stabilization should proceed as a high priority
and will assist in reducing bacteria and TSS. Knowing dominant bacteria and TSS sources to each
impaired stream will help prioritize and guide implementation with agricultural producers and municipal
storm sewer system areas. The findings from this TMDL study will assist in selecting implementation
and monitoring activities.
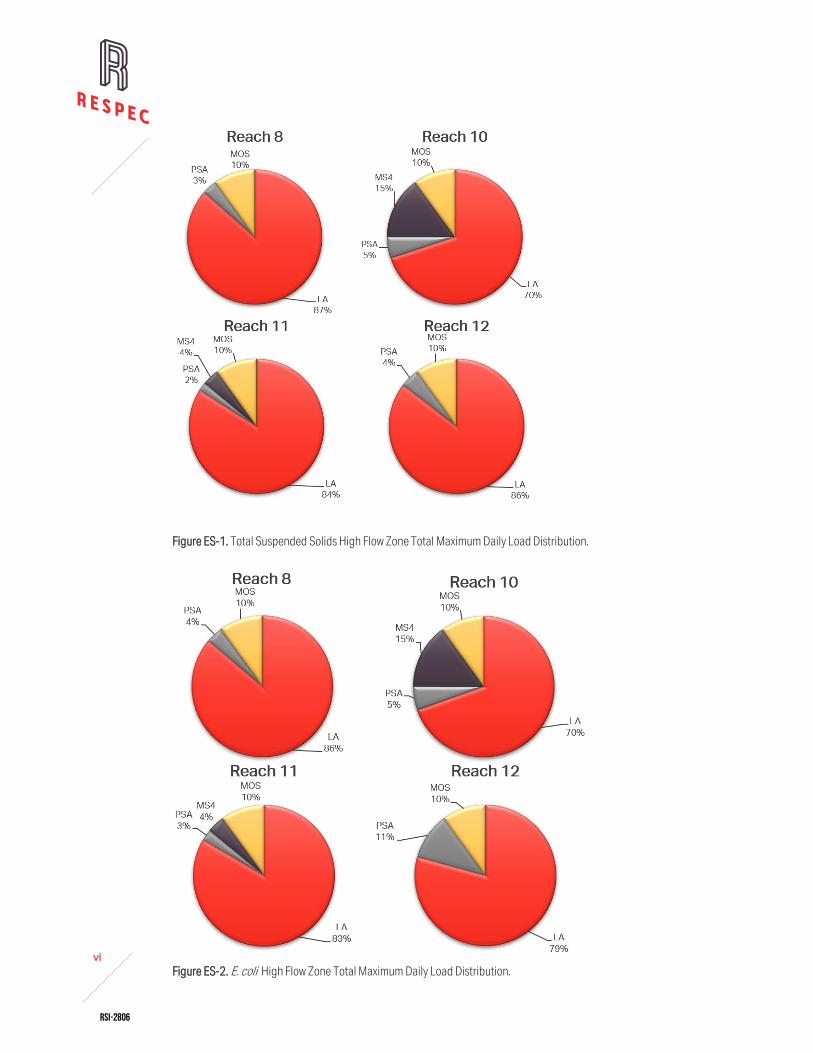
The high flow zone distribution of the E. coli and TSS TMDL allocations for each reach are illustrated in
figures ES-1 and ES-2, respectively.
RSI-2806
vi
2
Figure ES-1. Total Suspended Solids High Flow Zone Total Maximum Daily Load Distribution.
Figure ES-2. E. coli High Flow Zone Total Maximum Daily Load Distribution.
1.2 CLEAN WATER ACT SECTION 303(D) LISTING INFORMATION ............................................................................................... 3
1.3 AVAILABLE WATER QUALITY AND WATER-QUANTITY DATA .................................................................................................. 3
2.0 WATER QUALITY STANDARDS AND TOTAL MAXIMUM DAILY LOAD TARGETS ........................................................ 12
3.1 POINT SOURCES ................................................................................................................................................................................. 13
7.0 PUBLIC PARTICIPATION ................................................................................................................................................ 28
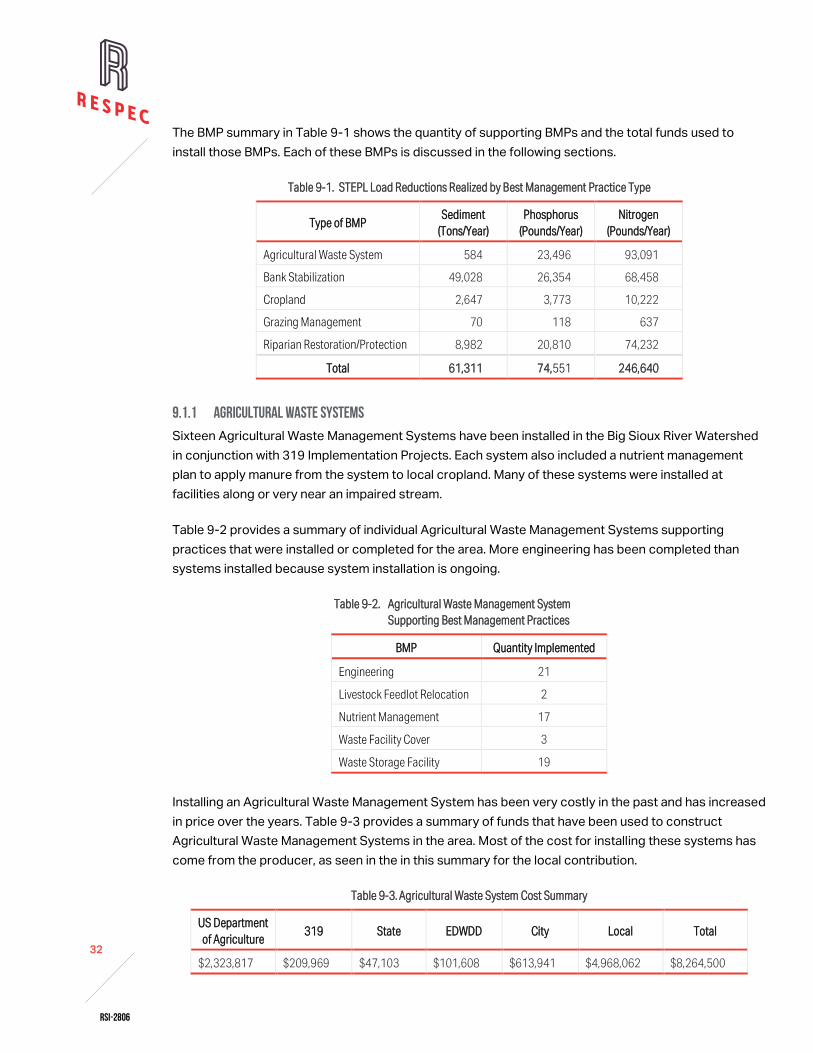
9.1.1 Agricultural Waste Systems ................................................................................................................................................. 32
9.1.2 Bank Stabilization ................................................................................................................................................................... 33
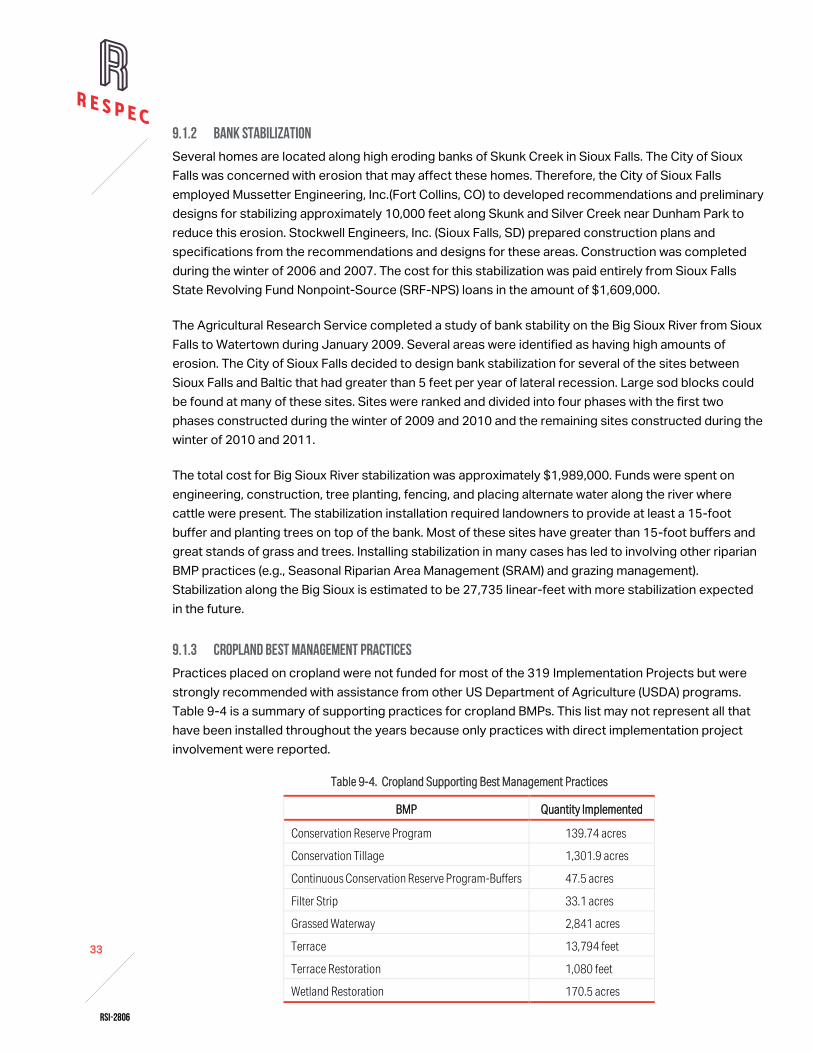
9.1.3 Cropland Best Management Practices ............................................................................................................................. 33
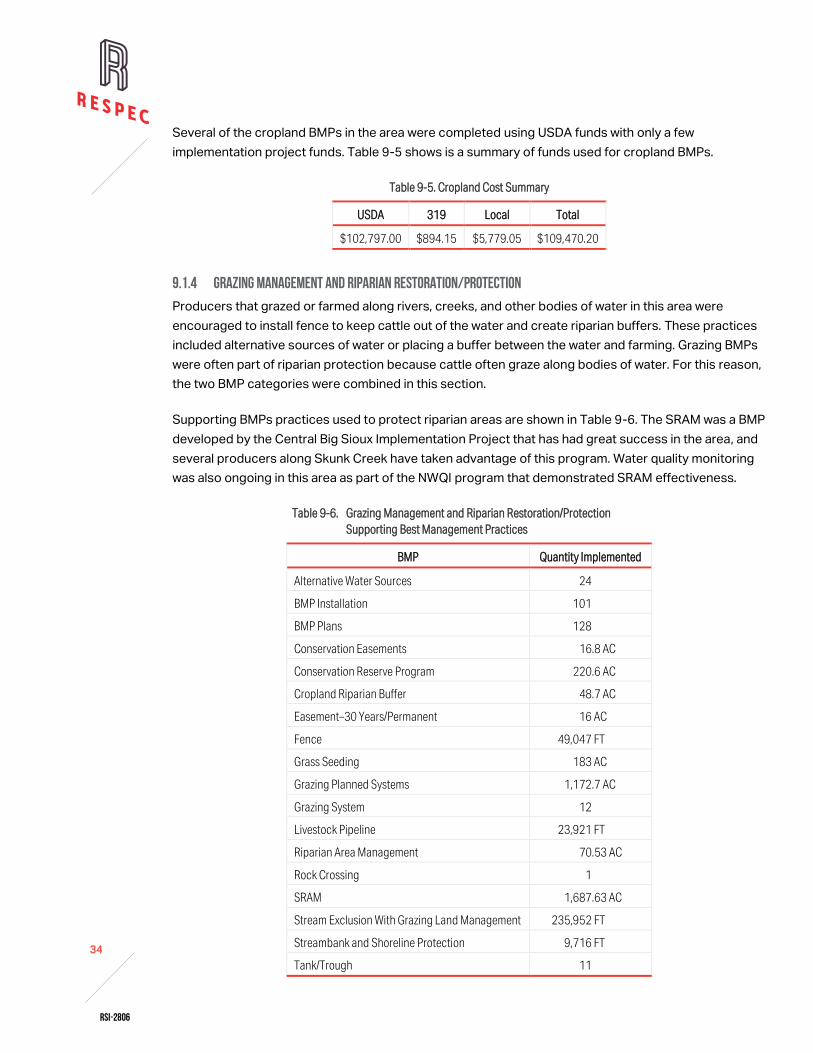
9.1.4 Grazing Management and Riparian Restoration/Protection ....................................................................................... 34
9.1.5 City Best Management Practices ....................................................................................................................................... 35
APPENDIX A DAILY MAXIMUM CRITERIA TOTAL MAXIMUM DAILY LOAD TABLES ........................................................... A-1
RSI-2806
viii
2
LIST OF TABLES
Table Page
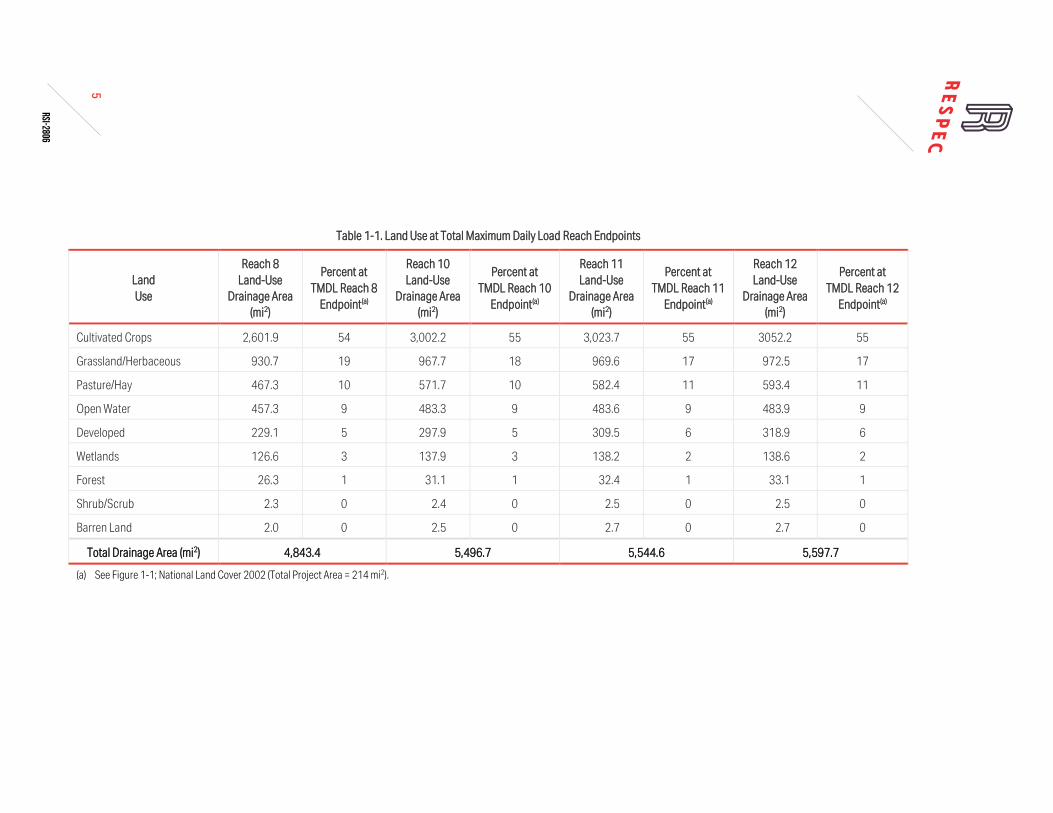
1-1 Land Use at Total Maximum Daily Load Reach Endpoints ................................................................................................................... 5
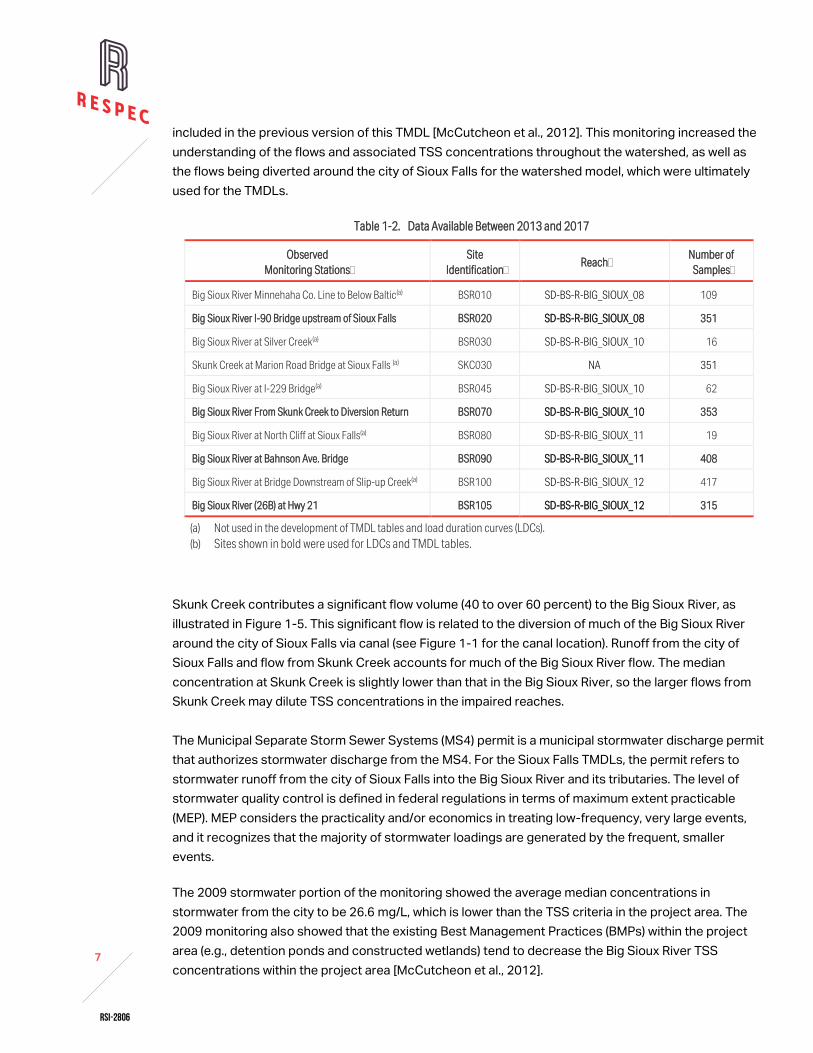
1-2 Data Available Between 2013 and 2017 .................................................................................................................................................. 7
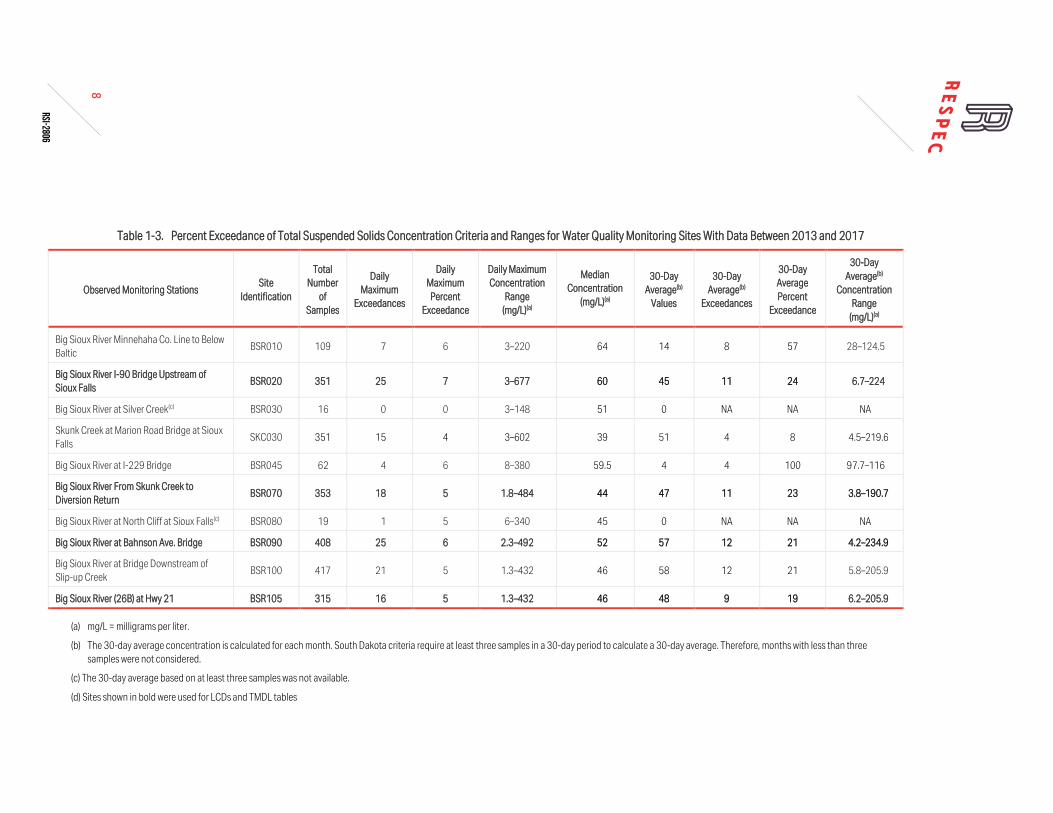
1-3 Percent Exceedance of Total Suspended Solids Concentration Criteria and Ranges for Water Quality Monitoring
Sites With Data Between 2013 and 2017 ................................................................................................................................................ 8
2-1 State Total Suspended Solids Surface Water Quality Standards for the Big Sioux River in the City of Sioux Falls ................ 12
3-1 Point-Source Flows, Concentrations, and Waste Load Allocations ................................................................................................... 15
5-1 Big Sioux River Total Suspended Solids Wasteload Allocations and Municipal Separate Storm Sewer Systems
9-1 STEPL Load Reductions Realized by Best Management Practice Type ............................................................................................ 32
9-2 Agricultural Waste Management System Supporting Best Management Practices ..................................................................... 32
9-3 Agricultural Waste System Cost Summary ............................................................................................................................................... 32
9-4 Cropland Supporting Best Management Practices................................................................................................................................ 33
9-6 Grazing Management and Riparian Restoration/Protection Supporting Best Management Practices ................................... 34
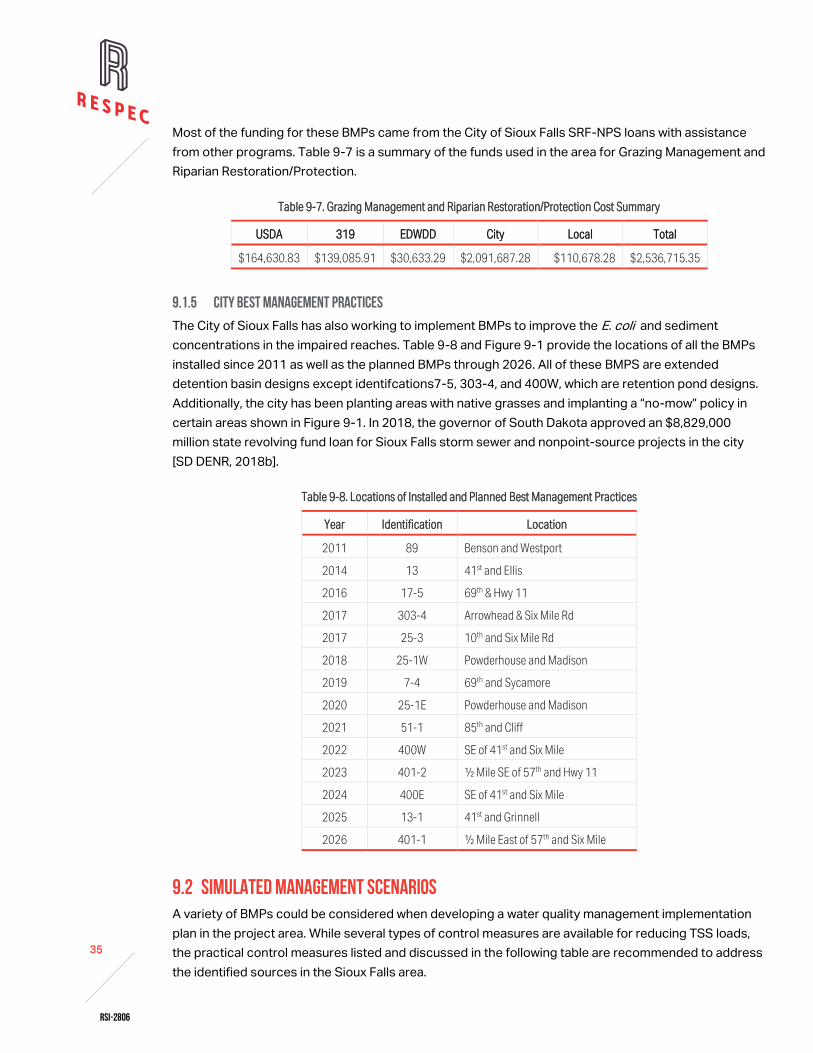
9-7 Grazing Management and Riparian Restoration/Protection Cost Summary ................................................................................... 35
9-8 Locations of Installed and Planned Best Management Practices ...................................................................................................... 35
9-9 Big Sioux River Best Management Practice Modeled Percent Exceedance of the 30-Day Average Criterion and Best
Management Practice Reduction ............................................................................................................................................................... 37
A-1 Total Suspended Solids Total Maximum Daily Load Based on the Daily Maximum Criterion for Reach 8 .............................. A-2
A-2 Total Suspended Solids Total Maximum Daily Load Based on the Daily Maximum Criterion for Reach 10 ............................ A-2
A-3 Total Suspended Solids Total Maximum Daily Load Based on the Daily Maximum Criterion for Reach 11 ............................ A-2
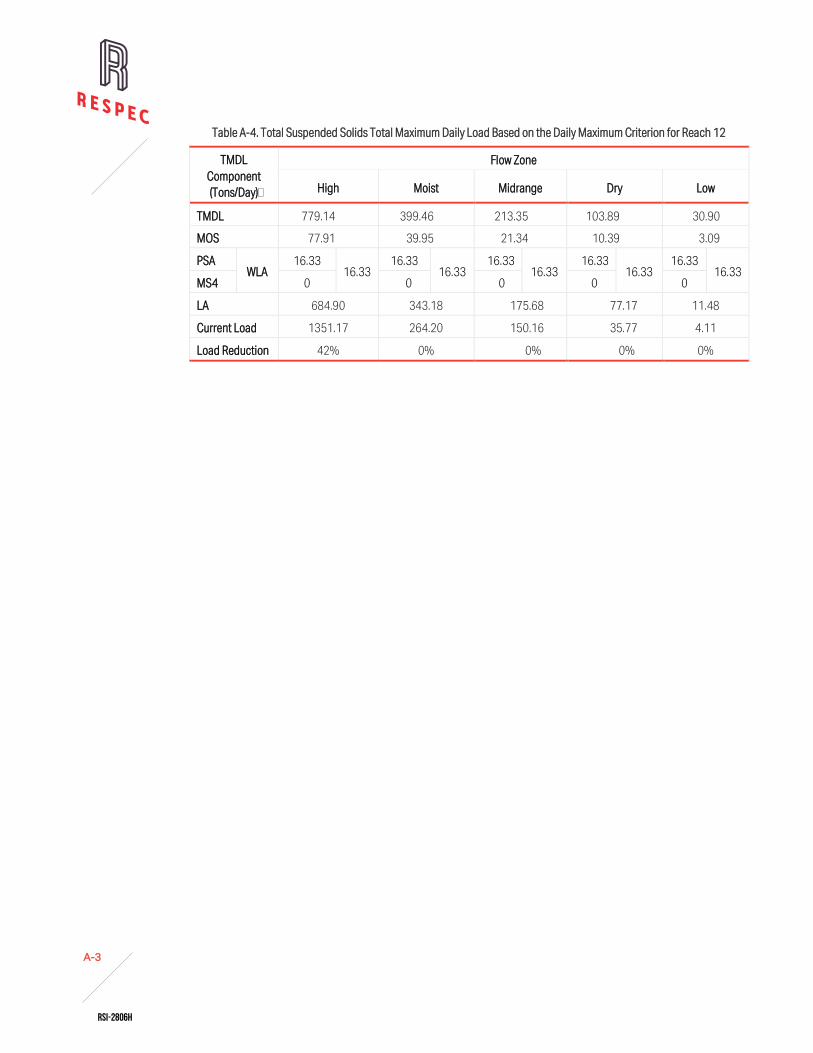
A-4 Total Suspended Solids Total Maximum Daily Load Based on the Daily Maximum Criterion for Reach 12 ............................ A-3
RSI-2806
ix
2
LIST OF FIGURES
FIGURE Page
ES-1 Total Suspended Solids High Flow Zone Total Maximum Daily Load Distribution ......................................................................... vi
ES-2 E. coli High Flow Zone Total Maximum Daily Load Distribution ......................................................................................................... vi
1-1 Project Area Watershed and Total Suspended Solids Impaired Reaches ........................................................................................ 2
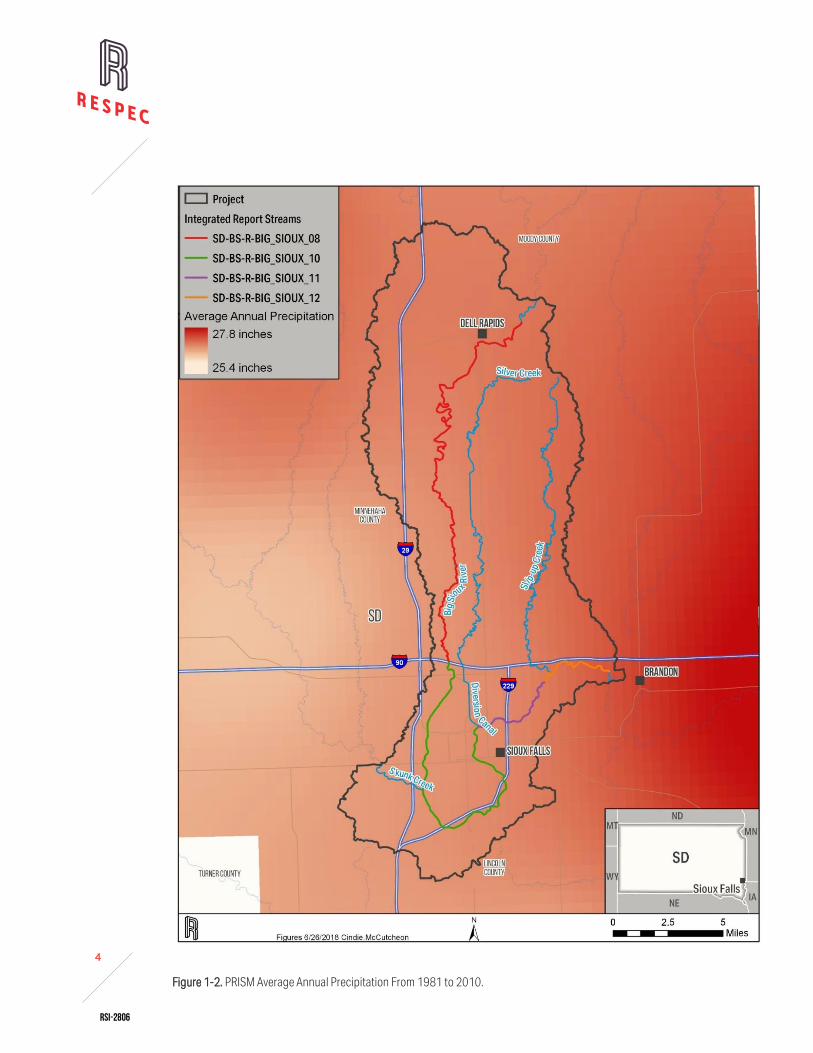
1-2 PRISM Average Annual Precipitation From 1981 to 2010 ................................................................................................................... 4
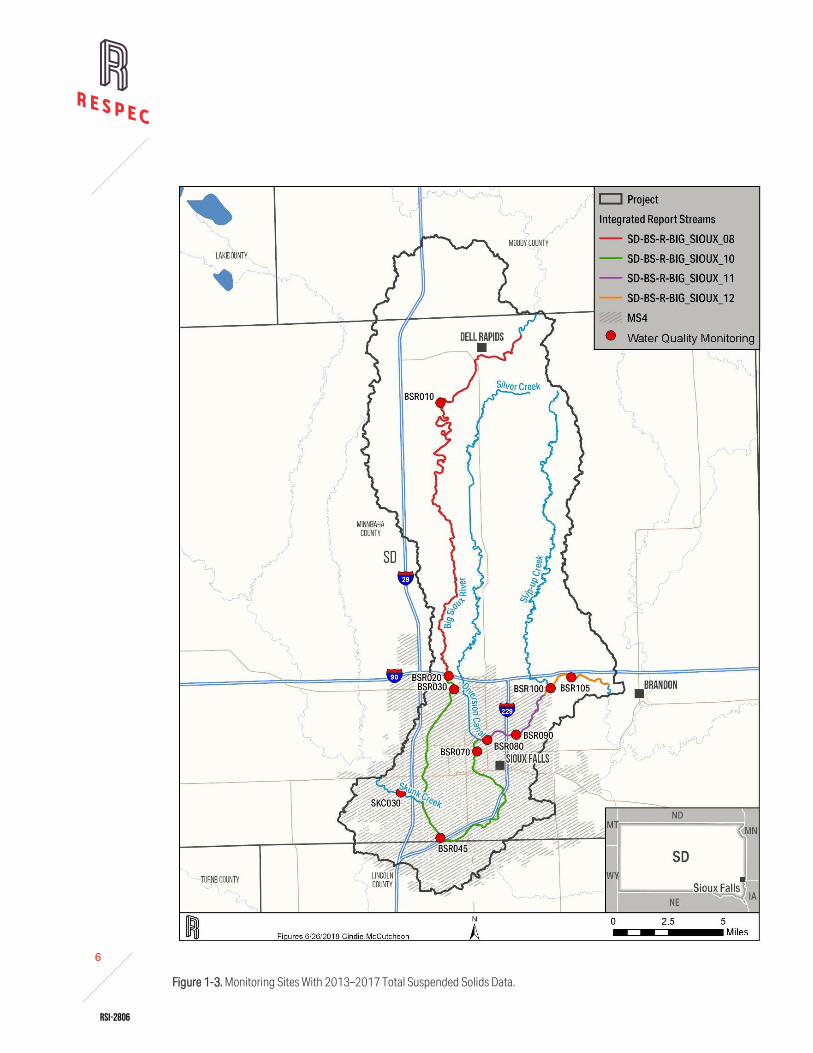
1-3 Monitoring Sites With 2013–2017 Total Suspended Solids Data ..................................................................................................... 6
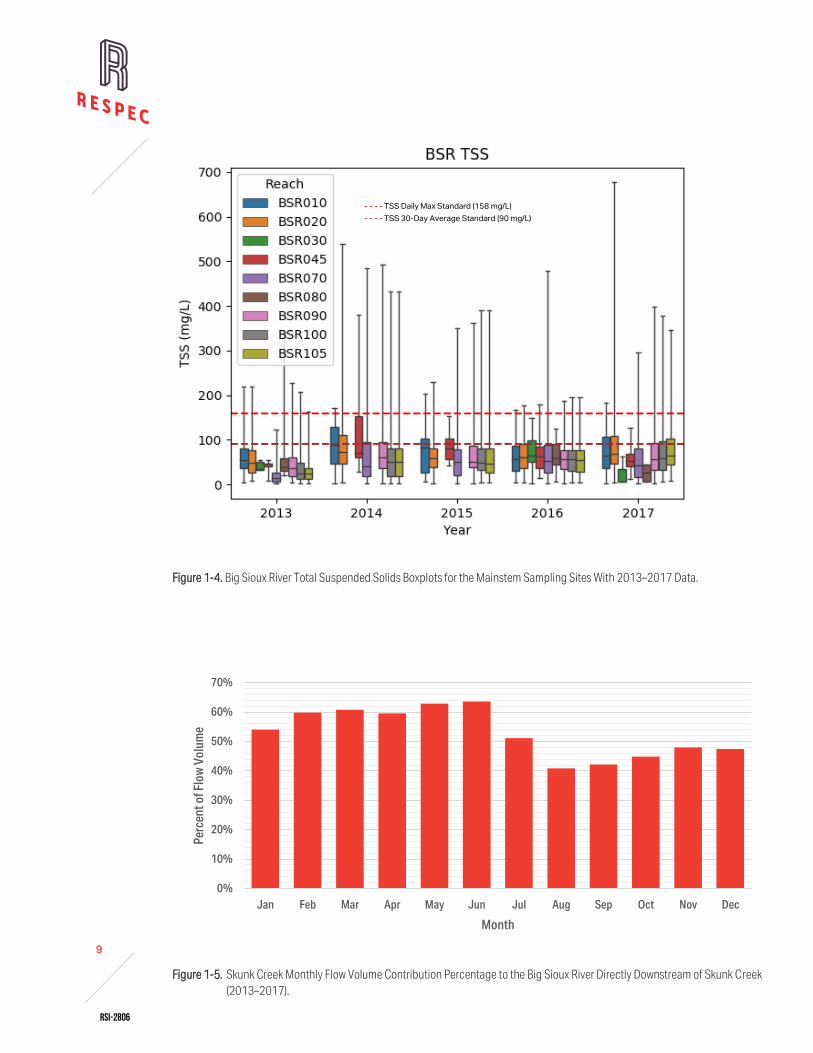
1-4 Big Sioux River Total Suspended Solids Boxplots for the Mainstem Sampling Sites With 2013–2017 Data ......................... 9
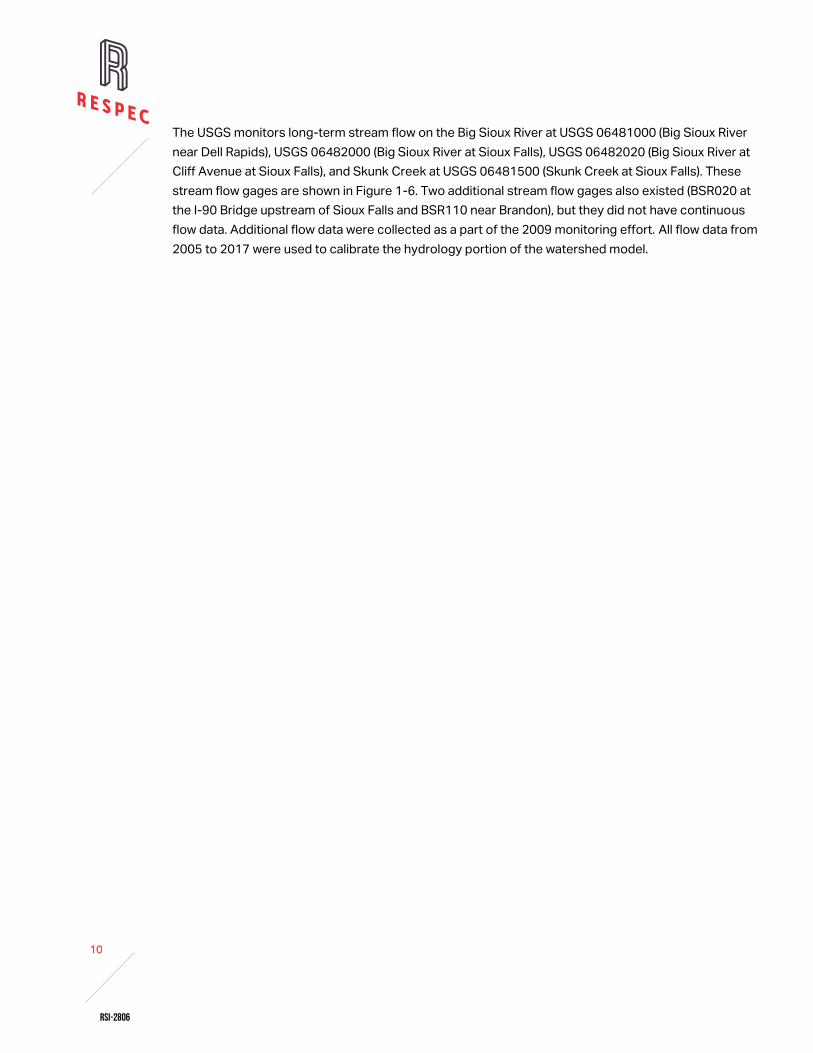
1-5 Skunk Creek Monthly Flow Volume Contribution Percentage to the Big Sioux River Directly Downstream of Skunk
Creek (2013–2017) ........................................................................................................................................................................................ 9
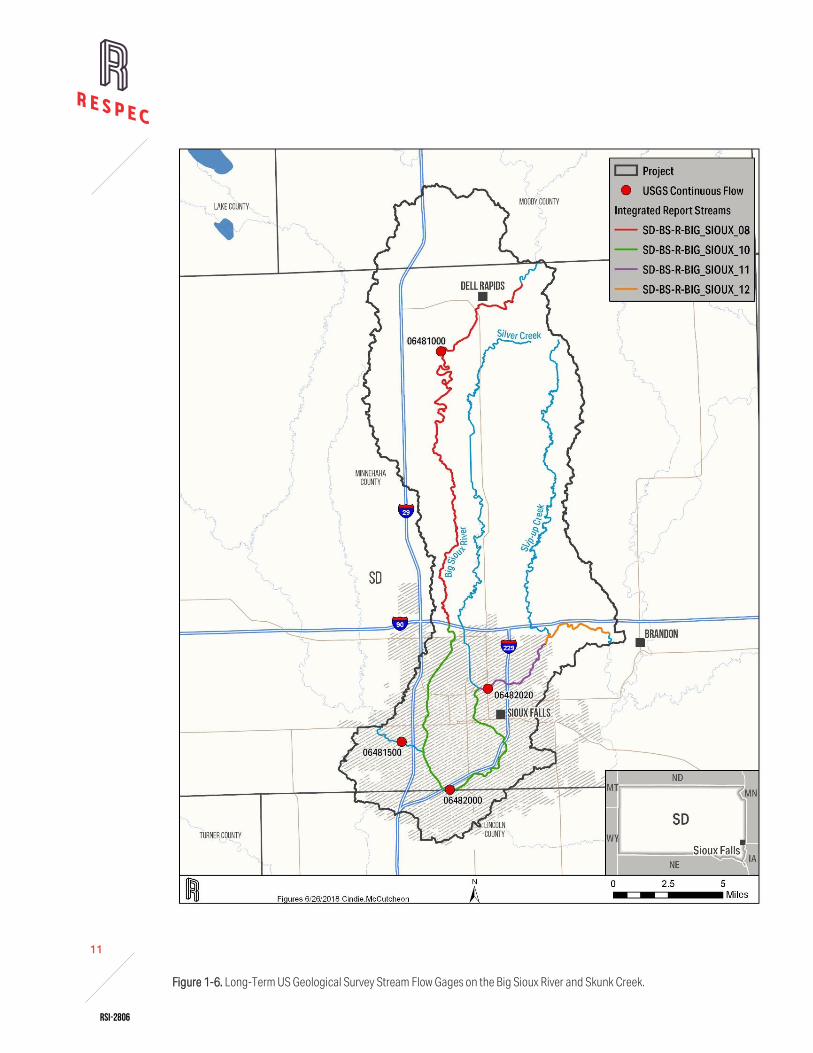
1-6 Long-Term US Geological Survey Stream Flow Gages on the Big Sioux River and Skunk Creek ............................................... 11
3-1 Point Sources Including the Municipal Separate Storm Sewer Systems .......................................................................................... 14
3-2 Diagram of Sources Used in Source Assessment Pie Charts ............................................................................................................... 16
3-3 Source Assessment Modeling Results for Total Maximum Daily Load Reach 8 ............................................................................. 17
3-4 Source Assessment Modeling Results for Total Maximum Daily Load Reach 10 ........................................................................... 17
3-5 Source Assessment Modeling Results for Total Maximum Daily Load Reach 11 ........................................................................... 18
3-6 Source Assessment Modeling Results for Total Maximum Daily Load Reach 12 ........................................................................... 18
4-1 Reach 8 Load-Duration Curve Generated With Observed Total Suspended Solids (BSR020) and Simulated Flow ............. 20
4-2 Reach 10 Load-Duration Curve Generated With Observed Total Suspended Solids (BSR070) and Simulated Flow ........... 20
4-3 Reach 11 Load-Duration Curve Generated With Observed Total Suspended Solids (BSR090) and Simulated Flow ........... 21
4-4 Reach 12 Load-Duration Curve Generated With Observed Total Suspended Solids (BSR105) and Simulated Flow ........... 21
6-1 Total Suspended Solids Concentration Boxplots (BSR020, BSR070, BSR090, and BSR105 From 2013–2017) ................ 26
6-2 Monthly Median Flows From Local US Geological Survey Data (2013–2017) ................................................................................ 27
9-1 Best Management Practices Installed Within and Upstream of the Project Area........................................................................... 31
RSI-2806
1
2
1.0 INTRODUCTION
This document is to clearly identify the components of a set of Total Maximum Daily Loads (TMDLs),
support adequate public participation, and facilitate the US Environmental Protection Agency (EPA)
review. This document is an update to the TMDLs that were finalized in 2012, which have been
developed in accordance with Section 303(d) of the federal Clean Water Act and guidance developed
by the EPA. A revision to the 2012 TMDLs was deemed necessary to account for the inevitable
population and industrial growth occurring in and around the city of Sioux Falls, as Census data indicate
that the population of Sioux Falls has increased nearly 15 percent since the previous TMDLs were
written. The revision utilized updated land cover datasets and newly collected ambient water quality
data. This TMDL document addresses total suspended solids (TSS) impairments on the Big Sioux
River within the Lower Big Sioux River Watershed local to the city of Sioux Falls. The impaired reaches
[Reach 11], SD-BS-R-BIG_SIOUX_12 [Reach 12]) were assigned to priority category 1 (high priority) in
the 2010 impaired waterbodies list [South Dakota Department of Natural Resources, 2010], but were
removed from priority category 1 when they were approved by the EPA in 2012.
From 2008 to 2010, South Dakota Department of Environment and Natural Resources (SD DENR)
integrated SD-BS-R-BIG_SIOUX_09 (Reach 09) into the upstream and downstream reaches because of
differences in beneficial use designations and TMDL development. None of the newly listed reaches
were listed as impaired for TSS in the 2008 impaired waterbodies list [SD DENR, 2008]. The 2018
integrated report lists the four reaches as impaired for TSS in EPA category 4A (water impaired with an
approved TMDL).
1.1 WATERSHED CHARACTERISTICS The Big Sioux River Watershed above the project area outlet is primarily located in eastern South
Dakota and drains approximately 5,598 square miles in South Dakota, Minnesota, and Iowa. The Sioux
Falls TMDL assessment project area lies within the Lower Big Sioux River Watershed, which includes
the city of Sioux Falls (South Dakota’s largest city). The project area drains approximately 216 square
miles within the state of South Dakota.
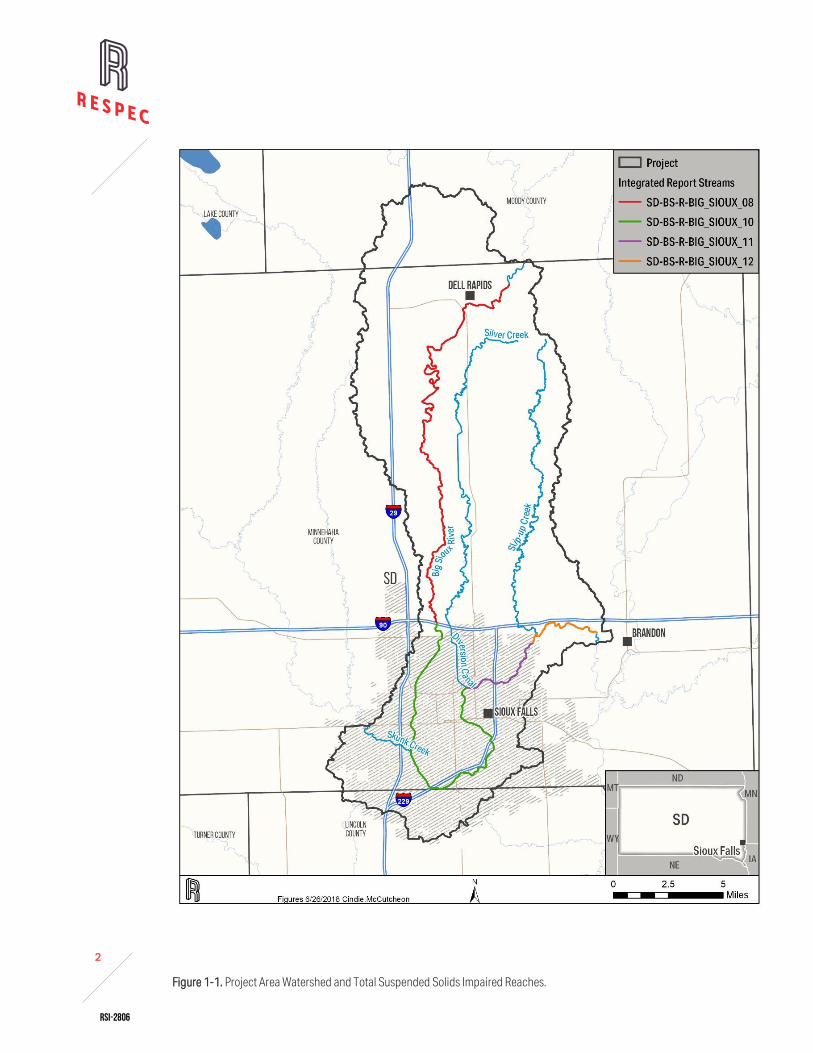
Figure 1-1 shows the impaired (Section 303(d) listed) reaches on the Lower Big Sioux River that are
located within the project area [SD DENR, 2018a]. Reach 8 begins near Dell Rapids at the
Moody/Minnehaha County line and ends at Interstate-90 (I-90). In the 2008 integrated report, Reach 8
was defined as extending from near Dell Rapids to below Baltic [SD DENR, 2008]. In the 2010 integrated
report, Reach 8 was expanded to include the portion of Reach 9 above the diversion split or at I-29
[SD DENR, 2010]. The remainder of Reach 9 below the diversion to Skunk Creek was incorporated into
Reach 10 in the 2010 report [SD DENR, 2010]. Reach 10 now begins at I-90 and ends at the diversion
return; Reach11 begins at the diversion return and ends at the Sioux Falls Wastewater Treatment
Plant (WWTP); and Reach12 begins at the Sioux Falls WWTP and ends above Brandon, South Dakota
[SD DENR, 2018a]. These TMDLs represent the contiguous Reaches 8 through 12.
RSI-2806
2
2
Figure 1-1. Project Area Watershed and Total Suspended Solids Impaired Reaches.
RSI-2806
3
2
The Sioux Falls project area receives 73 percent of its average annual precipitation (24.7 inches) during
the growing season of April through September [South Dakota State University, 2008]. The average
annual precipitation in the project area is shown in Figure 1-2. Local storms with short durations often
produce heavy rainfall and can elevate to severe thunderstorms and occasionally produce tornados.
The average seasonal snowfall is 41.1 inches per year [US Department of Commerce National Climatic
Data Center, 2004]. Land use in the entire area draining to the impaired reaches is predominantly
cropland and pasture. A complete list of watershed land uses and percent areas is shown in Table 1-1.
1.2 CLEAN WATER ACT SECTION 303(D) LISTING INFORMATION Four Big Sioux River reaches (8 through 12) within the project area were listed as impaired in South
Dakota’s 2018 303(d) list because of sample concentrations of TSS that exceeded the criteria for
protecting warm-water, semipermanent fish life propagation. The Big Sioux River reaches within the
Sioux Falls project area were not listed as impaired for TSS in South Dakota before 2010 [SD DENR,
2018a].
1.3 AVAILABLE WATER QUALITY AND WATER-QUANTITY DATA Data have been collected throughout the project area by the SD DENR, the US Geological Survey
(USGS), and by the City of Sioux Falls throughout the years. A summary of older water quality data,
which included a specific summary of the baseflow samples versus the stormflow samples, is included
in the previous version of this updated TMDL [McCutcheon et al., 2012]. Data summarized for this
updated TMDL were collected between 2013 and 2017. Water quality data monitoring locations are
shown in Figure 1-3 and listed in Table 1-2. Table 1-3 contains data summaries for each site from 2013
through 2017 including concentration ranges, percent exceedance of the daily maximum standard, and
percent exceedance of the 30-day average standard. Data were used to create boxplots (Figure 1-4),
that show the range of TSS concentrations [milligrams/Liter (mg/L)] at each site.
The most downstream monitoring site in each reach was used for load-duration curve development.
The most downstream monitoring sites include BSR020 in Reach 8, BSR070 in Reach 10, BSR090 in
Reach 11, and BSR105 in Reach 12. In Reach 8, BSR020 is the most downstream monitoring site in
Reach 8, is the first mainstem site below the diversion above Skunk Creek into the city., is above Skunk
Creek, and is below the diversion. In Reach 10, BSR070 is the most downstream monitoring site in
Reach 10, includes flows from much the city and Skunk Creek, and but does not include diversion flows.
Approximately half-way down Reach 11, BSR090 is the most downstream monitoring site in Reach 11,
includes flows from the entire city, Skunk Creek, and the diversion, but not flows from Slip-up Creek.
Approximately half-way down Reach 12, BSR105 includes flows from the entire city, Skunk Creek, the
diversion, and Slip-up Creek. At all locations, exceedances of the 30-day average criteria were far more
prevalent than exceedances of the daily maximum criteria; therefore, these TMDLs are developed using
the 30-day average concentrations and criteria.
Monitoring was completed in 2009 on three key tributaries (Skunk Creek, Slip-up Creek, and Silver
Creek); on the diversion canal, which sends flow around the Sioux Falls area; at multiple sites along the
Big Sioux River; and throughout the city’s storm drainage network. More information about these sites is
RSI-2806
4
2
Figure 1-2. PRISM Average Annual Precipitation From 1981 to 2010.
5
RSI-2806
Table 1-1. Land Use at Total Maximum Daily Load Reach Endpoints
Total Drainage Area (mi2) 4,843.4 5,496.7 5,544.6 5,597.7
(a) See Figure 1-1; National Land Cover 2002 (Total Project Area = 214 mi2).
RSI-2806
6
2
Figure 1-3. Monitoring Sites With 2013–2017 Total Suspended Solids Data.
RSI-2806
7
2
included in the previous version of this TMDL [McCutcheon et al., 2012]. This monitoring increased the
understanding of the flows and associated TSS concentrations throughout the watershed, as well as
the flows being diverted around the city of Sioux Falls for the watershed model, which were ultimately
used for the TMDLs.
Table 1-2. Data Available Between 2013 and 2017
Observed
Monitoring Stations
Site
IdentificationReach
Number of
Samples
Big Sioux River Minnehaha Co. Line to Below Baltic(a) BSR010 SD-BS-R-BIG_SIOUX_08 109
Big Sioux River I-90 Bridge upstream of Sioux Falls BSR020 SD-BS-R-BIG_SIOUX_08 351
Big Sioux River at Silver Creek(a) BSR030 SD-BS-R-BIG_SIOUX_10 16
Skunk Creek at Marion Road Bridge at Sioux Falls (a) SKC030 NA 351
Big Sioux River at I-229 Bridge(a) BSR045 SD-BS-R-BIG_SIOUX_10 62
Big Sioux River From Skunk Creek to Diversion Return BSR070 SD-BS-R-BIG_SIOUX_10 353
Big Sioux River at North Cliff at Sioux Falls(a) BSR080 SD-BS-R-BIG_SIOUX_11 19
Big Sioux River at Bahnson Ave. Bridge BSR090 SD-BS-R-BIG_SIOUX_11 408
Big Sioux River at Bridge Downstream of Slip-up Creek(a) BSR100 SD-BS-R-BIG_SIOUX_12 417
Big Sioux River (26B) at Hwy 21 BSR105 SD-BS-R-BIG_SIOUX_12 315
(a) Not used in the development of TMDL tables and load duration curves (LDCs).
(b) Sites shown in bold were used for LDCs and TMDL tables.
Skunk Creek contributes a significant flow volume (40 to over 60 percent) to the Big Sioux River, as
illustrated in Figure 1-5. This significant flow is related to the diversion of much of the Big Sioux River
around the city of Sioux Falls via canal (see Figure 1-1 for the canal location). Runoff from the city of
Sioux Falls and flow from Skunk Creek accounts for much of the Big Sioux River flow. The median
concentration at Skunk Creek is slightly lower than that in the Big Sioux River, so the larger flows from
Skunk Creek may dilute TSS concentrations in the impaired reaches.
The Municipal Separate Storm Sewer Systems (MS4) permit is a municipal stormwater discharge permit
that authorizes stormwater discharge from the MS4. For the Sioux Falls TMDLs, the permit refers to
stormwater runoff from the city of Sioux Falls into the Big Sioux River and its tributaries. The level of
stormwater quality control is defined in federal regulations in terms of maximum extent practicable
(MEP). MEP considers the practicality and/or economics in treating low-frequency, very large events,
and it recognizes that the majority of stormwater loadings are generated by the frequent, smaller
events.
The 2009 stormwater portion of the monitoring showed the average median concentrations in
stormwater from the city to be 26.6 mg/L, which is lower than the TSS criteria in the project area. The
2009 monitoring also showed that the existing Best Management Practices (BMPs) within the project
area (e.g., detention ponds and constructed wetlands) tend to decrease the Big Sioux River TSS
concentrations within the project area [McCutcheon et al., 2012].
8
RSI-2806
Table 1-3. Percent Exceedance of Total Suspended Solids Concentration Criteria and Ranges for Water Quality Monitoring Sites With Data Between 2013 and 2017
Big Sioux River (26B) at Hwy 21 BSR105 315 16 5 1.3–432 46 48 9 19 6.2–205.9
(a) mg/L = milligrams per liter.
(b) The 30-day average concentration is calculated for each month. South Dakota criteria require at least three samples in a 30-day period to calculate a 30-day average. Therefore, months with less than three
samples were not considered.
(c) The 30-day average based on at least three samples was not available.
(d) Sites shown in bold were used for LCDs and TMDL tables
RSI-2806
9
2
Figure 1-4. Big Sioux River Total Suspended Solids Boxplots for the Mainstem Sampling Sites With 2013–2017 Data.
Figure 1-5. Skunk Creek Monthly Flow Volume Contribution Percentage to the Big Sioux River Directly Downstream of Skunk Creek
(2013–2017).
0%
10%
20%
30%
40%
50%
60%
70%
Jan Feb Mar Apr May Jun Jul Aug Sep Oct Nov Dec
Per
cent
of F
low
Vol
ume
Month
- - - - TSS Daily Max Standard (158 mg/L)
- - - - TSS 30-Day Average Standard (90 mg/L)
RSI-2806
10
2
The USGS monitors long-term stream flow on the Big Sioux River at USGS 06481000 (Big Sioux River
near Dell Rapids), USGS 06482000 (Big Sioux River at Sioux Falls), USGS 06482020 (Big Sioux River at
Cliff Avenue at Sioux Falls), and Skunk Creek at USGS 06481500 (Skunk Creek at Sioux Falls). These
stream flow gages are shown in Figure 1-6. Two additional stream flow gages also existed (BSR020 at
the I-90 Bridge upstream of Sioux Falls and BSR110 near Brandon), but they did not have continuous
flow data. Additional flow data were collected as a part of the 2009 monitoring effort. All flow data from
2005 to 2017 were used to calibrate the hydrology portion of the watershed model.
RSI-2806
11
2
Figure 1-6. Long-Term US Geological Survey Stream Flow Gages on the Big Sioux River and Skunk Creek.
RSI-2806
12
2
2.0 WATER QUALITY STANDARDS AND TOTAL MAXIMUM DAILY LOAD TARGETS
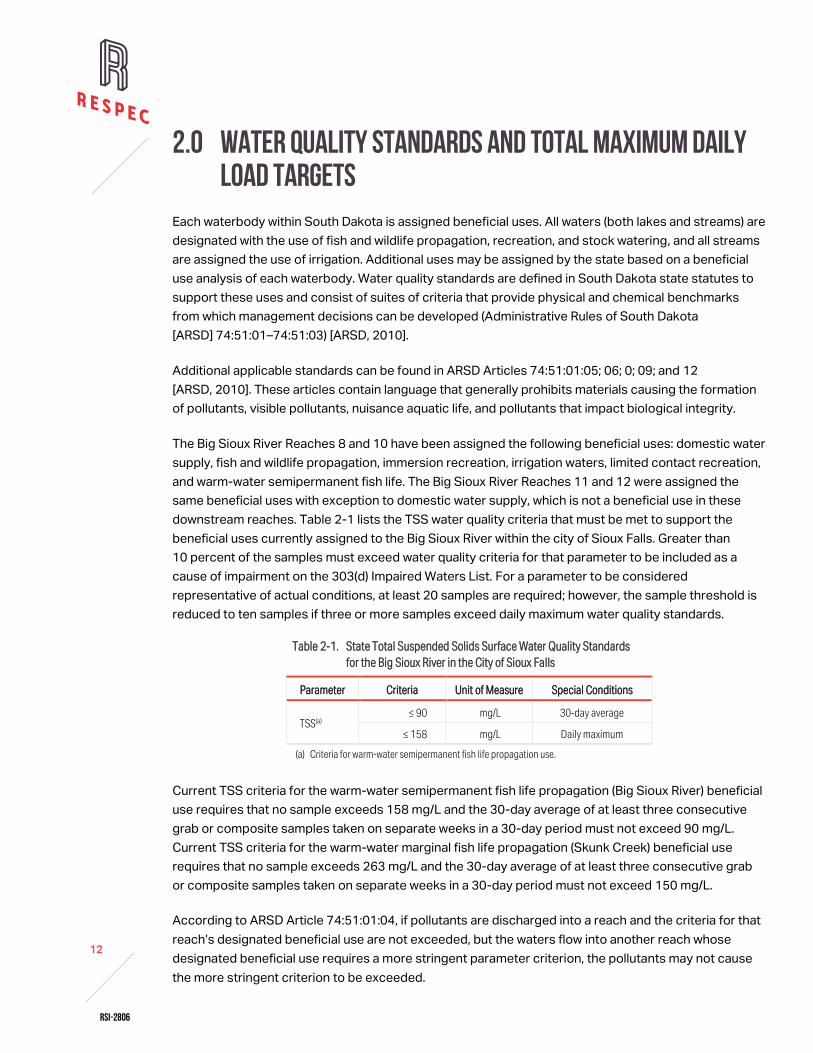
Each waterbody within South Dakota is assigned beneficial uses. All waters (both lakes and streams) are
designated with the use of fish and wildlife propagation, recreation, and stock watering, and all streams
are assigned the use of irrigation. Additional uses may be assigned by the state based on a beneficial
use analysis of each waterbody. Water quality standards are defined in South Dakota state statutes to
support these uses and consist of suites of criteria that provide physical and chemical benchmarks
from which management decisions can be developed (Administrative Rules of South Dakota
[ARSD] 74:51:01–74:51:03) [ARSD, 2010].
Additional applicable standards can be found in ARSD Articles 74:51:01:05; 06; 0; 09; and 12
[ARSD, 2010]. These articles contain language that generally prohibits materials causing the formation
of pollutants, visible pollutants, nuisance aquatic life, and pollutants that impact biological integrity.
The Big Sioux River Reaches 8 and 10 have been assigned the following beneficial uses: domestic water
supply, fish and wildlife propagation, immersion recreation, irrigation waters, limited contact recreation,
and warm-water semipermanent fish life. The Big Sioux River Reaches 11 and 12 were assigned the
same beneficial uses with exception to domestic water supply, which is not a beneficial use in these
downstream reaches. Table 2-1 lists the TSS water quality criteria that must be met to support the
beneficial uses currently assigned to the Big Sioux River within the city of Sioux Falls. Greater than
10 percent of the samples must exceed water quality criteria for that parameter to be included as a
cause of impairment on the 303(d) Impaired Waters List. For a parameter to be considered
representative of actual conditions, at least 20 samples are required; however, the sample threshold is
reduced to ten samples if three or more samples exceed daily maximum water quality standards.
Table 2-1. State Total Suspended Solids Surface Water Quality Standards
for the Big Sioux River in the City of Sioux Falls
Parameter Criteria Unit of Measure Special Conditions
TSS(a) ≤ 90 mg/L 30-day average
≤ 158 mg/L Daily maximum
(a) Criteria for warm-water semipermanent fish life propagation use.
Current TSS criteria for the warm-water semipermanent fish life propagation (Big Sioux River) beneficial
use requires that no sample exceeds 158 mg/L and the 30-day average of at least three consecutive
grab or composite samples taken on separate weeks in a 30-day period must not exceed 90 mg/L.
Current TSS criteria for the warm-water marginal fish life propagation (Skunk Creek) beneficial use
requires that no sample exceeds 263 mg/L and the 30-day average of at least three consecutive grab
or composite samples taken on separate weeks in a 30-day period must not exceed 150 mg/L.
According to ARSD Article 74:51:01:04, if pollutants are discharged into a reach and the criteria for that
reach’s designated beneficial use are not exceeded, but the waters flow into another reach whose
designated beneficial use requires a more stringent parameter criterion, the pollutants may not cause
the more stringent criterion to be exceeded.
RSI-2806
13
2
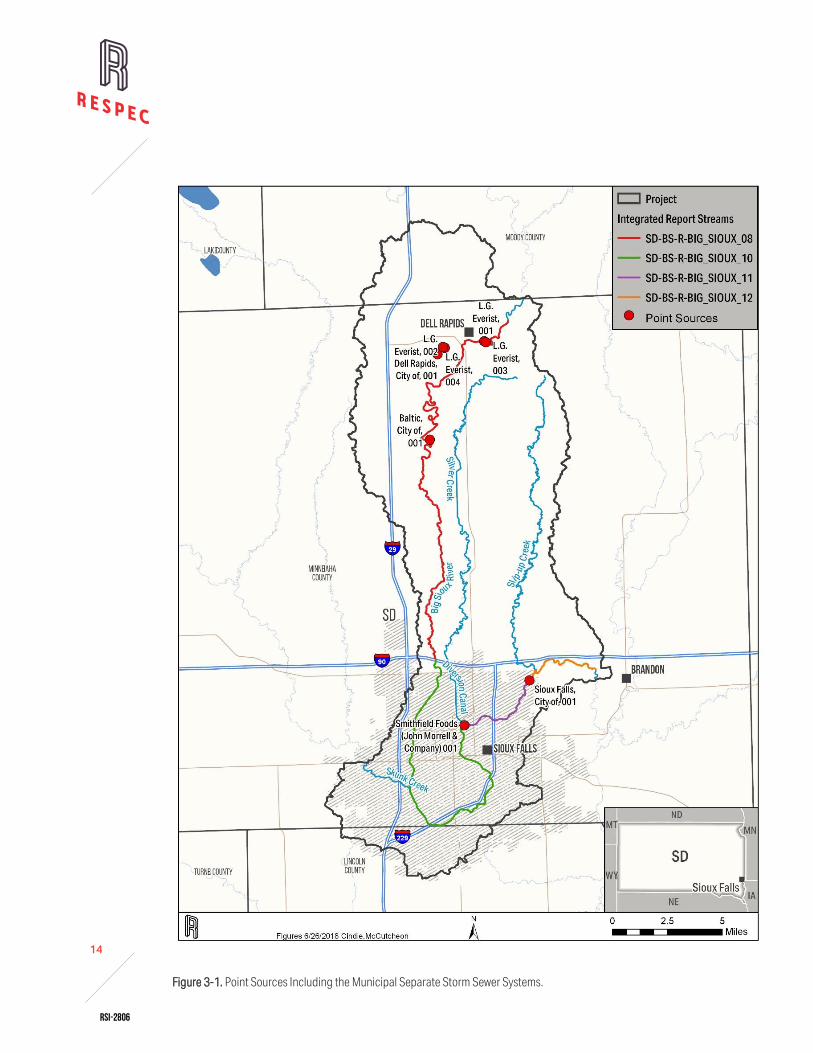
3.0 SIGNIFICANT SOURCES 3.1 POINT SOURCES Multiple permitted point-source discharges are in the project area, illustrated in Figure 3-1 and listed in
Table 3-1. These permitted point sources include the L.G. Everest in Reach 8, Dell Rapids Wastewater
Treatment Plant (WWTP) in Reach 8, Baltic WWTP in Reach 8, Sioux Falls MS4 permit in Reaches 10 and
11, Smithfield Foods in Reach 11, and Sioux Falls WWTP in Reach 12. The TSS daily maximum effluent
limits for these facilities are listed in Table 3-1. The Baltic WWTP and the Dell Rapids WWTP are lagoons.
According to the discharge monitoring report data, the Baltic WWTP has not discharged in over
10 years, and the Dell Rapids WWTP typically discharges in May and December each year. When the
previous version of this TMDL document was written, Smithfield Foods was John Morrell. The permit
area covered by the MS4 permit includes “all areas within the corporate boundary of the city of Sioux
Falls served by, or otherwise contributing to, discharges to state waters from municipal separate storm
sewers owned or operated by the city of Sioux Falls and interstate highways operated by South Dakota
Department of Transportation” [SD DENR, 1999]. Multiple concentrated animal feeding operations
(CAFOs) are located in Minnehaha County. Note, however, that all of these permitted CAFOs have zero
discharge except in the rare case of a precipitation event that produces a volume of water greater than
the facility’s design capacity. In this case, the permittee is required to notify the SD DENR and develop a
plan of action to remediate the problem. CAFOs were therefore not given WLAs.
3.2 NONPOINT SOURCES Nonpoint-source pollution of TSS generally comes from surface runoff, bed and bank erosion, cropland
erosion, and construction erosion. Analysis of sediment concentrations from upstream to downstream
shows no obvious trends. TSS loadings for the model were estimated using the simulated hydrologic
response of each modeled land use and the corresponding Event Mean Concentrations (EMCs) that
were derived from 2009 sample data based on representative land use draining to particular sampling
sites. For example, one sampling site was predominantly residential, so the concentrations observed
from that site were used as the EMC for all residential land. The multiple sampling sites had a targeted
representative land use. To account for spatial variability in the watershed and to align with downstream
sampling measurements, the EMCs in some cases were adjusted through the calibration process within
the range of concentrations that were observed for the land use.
3.3 SOURCE ASSESSMENT MODELING RESULTS The watershed modeling package selected for this assessment was the EPA HSPF model. HSPF is a
comprehensive watershed model of hydrology and water quality that includes modeling both land
surface and subsurface hydrologic and water quality processes that are linked and closely integrated
with corresponding stream and reservoir processes. HSPF is considered a premier, high-level model
among those currently available for comprehensive watershed assessments.
RSI-2806
14
2
Figure 3-1. Point Sources Including the Municipal Separate Storm Sewer Systems.
RSI-2806
15
2
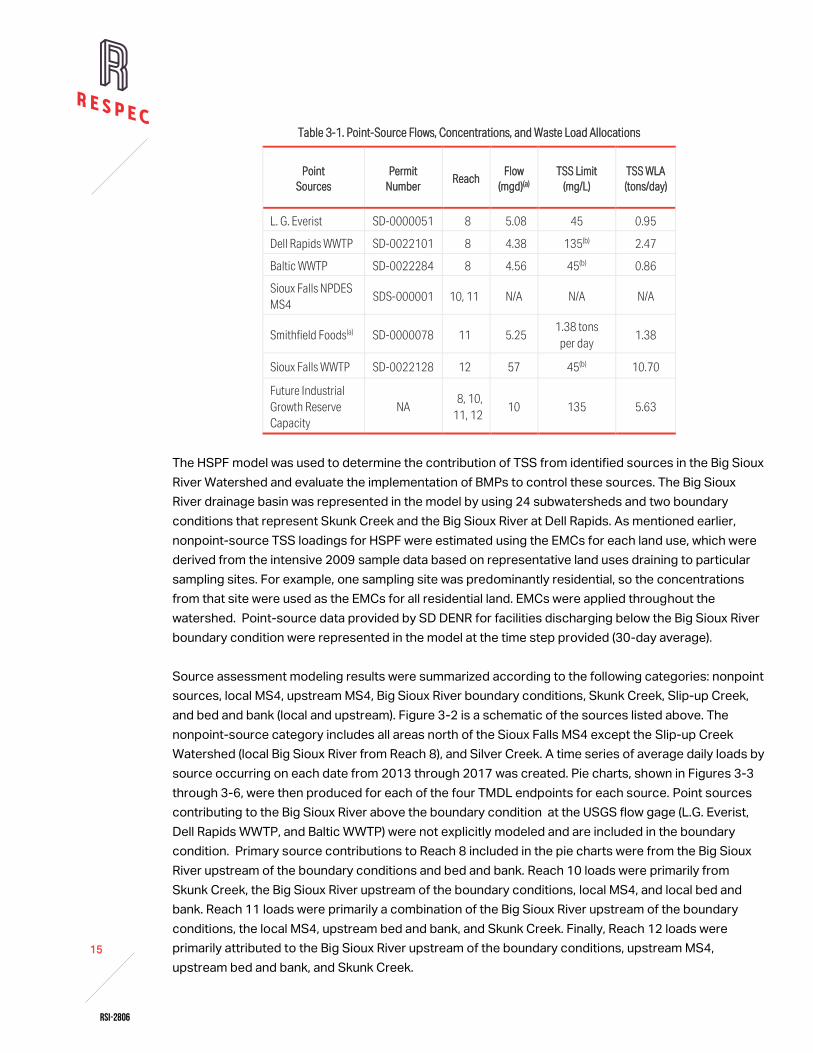
Table 3-1. Point-Source Flows, Concentrations, and Waste Load Allocations
Point
Sources
Permit
Number Reach
Flow
(mgd)(a)
TSS Limit
(mg/L)
TSS WLA
(tons/day)
L. G. Everist SD-0000051 8 5.08 45 0.95
Dell Rapids WWTP SD-0022101 8 4.38 135(b) 2.47
Baltic WWTP SD-0022284 8 4.56 45(b) 0.86
Sioux Falls NPDES
MS4 SDS-000001 10, 11 N/A N/A N/A
Smithfield Foods(a) SD-0000078 11 5.25 1.38 tons
per day 1.38
Sioux Falls WWTP SD-0022128 12 57 45(b) 10.70
Future Industrial
Growth Reserve
Capacity
NA 8, 10,
11, 12 10 135 5.63
The HSPF model was used to determine the contribution of TSS from identified sources in the Big Sioux
River Watershed and evaluate the implementation of BMPs to control these sources. The Big Sioux
River drainage basin was represented in the model by using 24 subwatersheds and two boundary
conditions that represent Skunk Creek and the Big Sioux River at Dell Rapids. As mentioned earlier,
nonpoint-source TSS loadings for HSPF were estimated using the EMCs for each land use, which were
derived from the intensive 2009 sample data based on representative land uses draining to particular
sampling sites. For example, one sampling site was predominantly residential, so the concentrations
from that site were used as the EMCs for all residential land. EMCs were applied throughout the
watershed. Point-source data provided by SD DENR for facilities discharging below the Big Sioux River
boundary condition were represented in the model at the time step provided (30-day average).
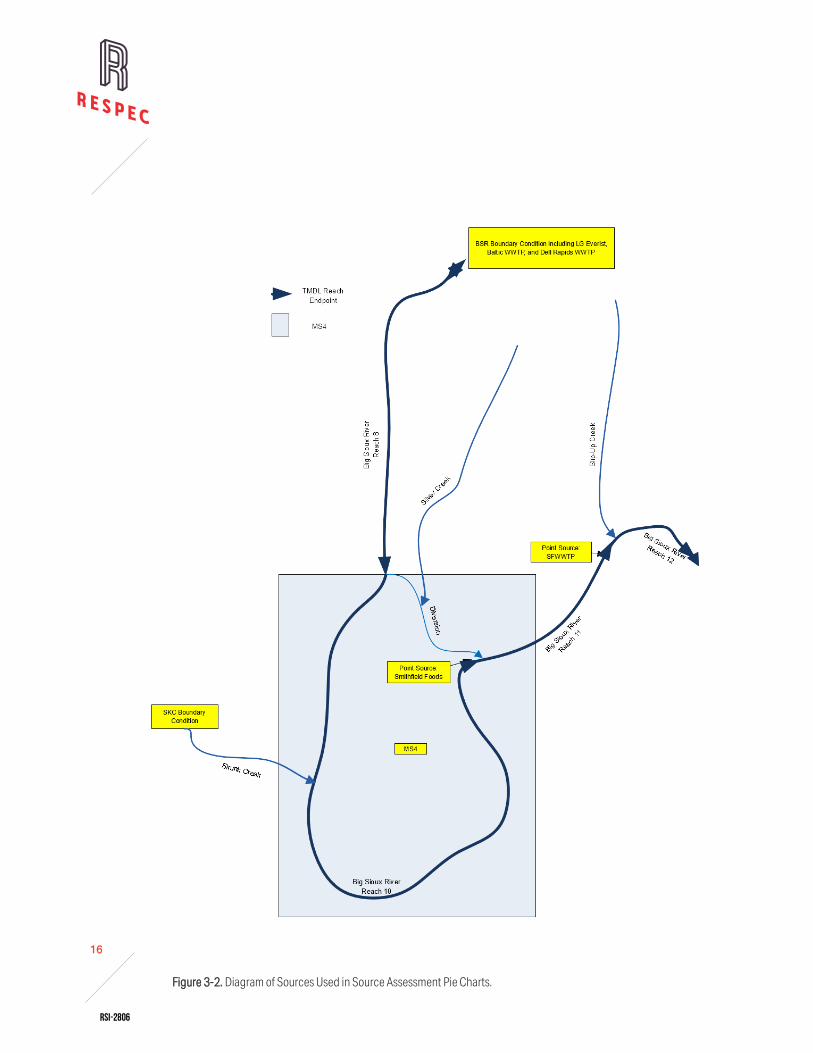
Source assessment modeling results were summarized according to the following categories: nonpoint
sources, local MS4, upstream MS4, Big Sioux River boundary conditions, Skunk Creek, Slip-up Creek,
and bed and bank (local and upstream). Figure 3-2 is a schematic of the sources listed above. The
nonpoint-source category includes all areas north of the Sioux Falls MS4 except the Slip-up Creek
Watershed (local Big Sioux River from Reach 8), and Silver Creek. A time series of average daily loads by
source occurring on each date from 2013 through 2017 was created. Pie charts, shown in Figures 3-3
through 3-6, were then produced for each of the four TMDL endpoints for each source. Point sources
contributing to the Big Sioux River above the boundary condition at the USGS flow gage (L.G. Everist,
Dell Rapids WWTP, and Baltic WWTP) were not explicitly modeled and are included in the boundary
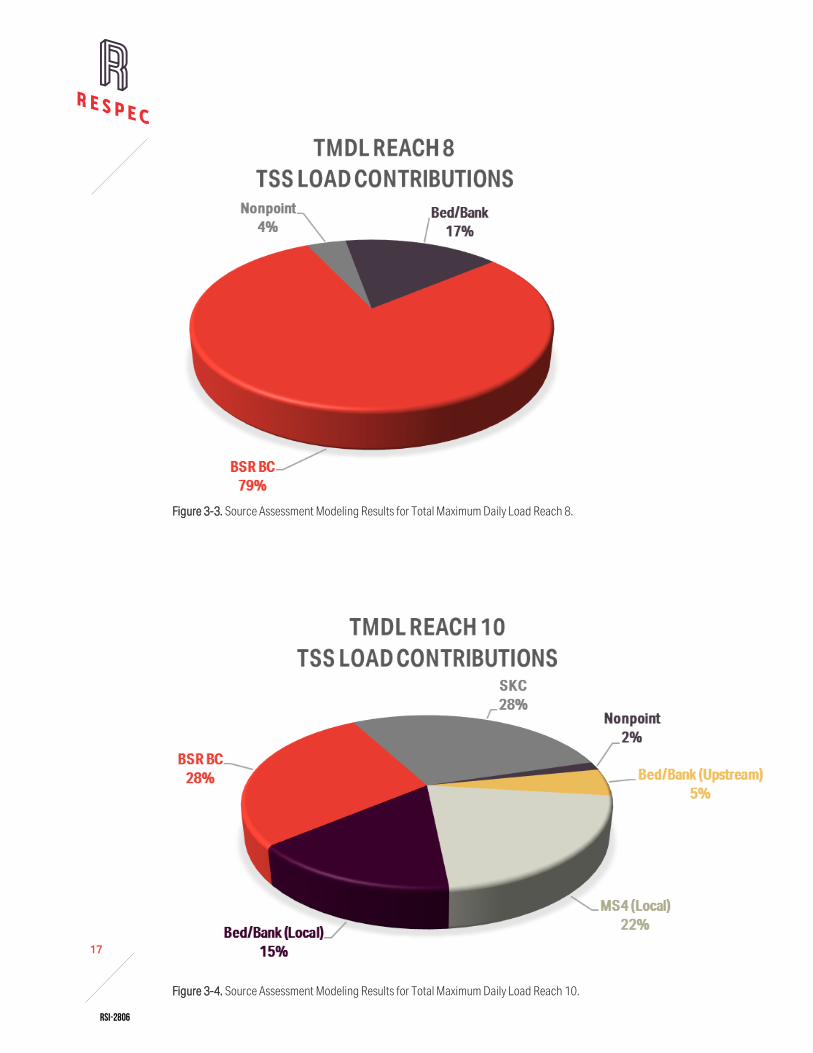
condition. Primary source contributions to Reach 8 included in the pie charts were from the Big Sioux
River upstream of the boundary conditions and bed and bank. Reach 10 loads were primarily from
Skunk Creek, the Big Sioux River upstream of the boundary conditions, local MS4, and local bed and
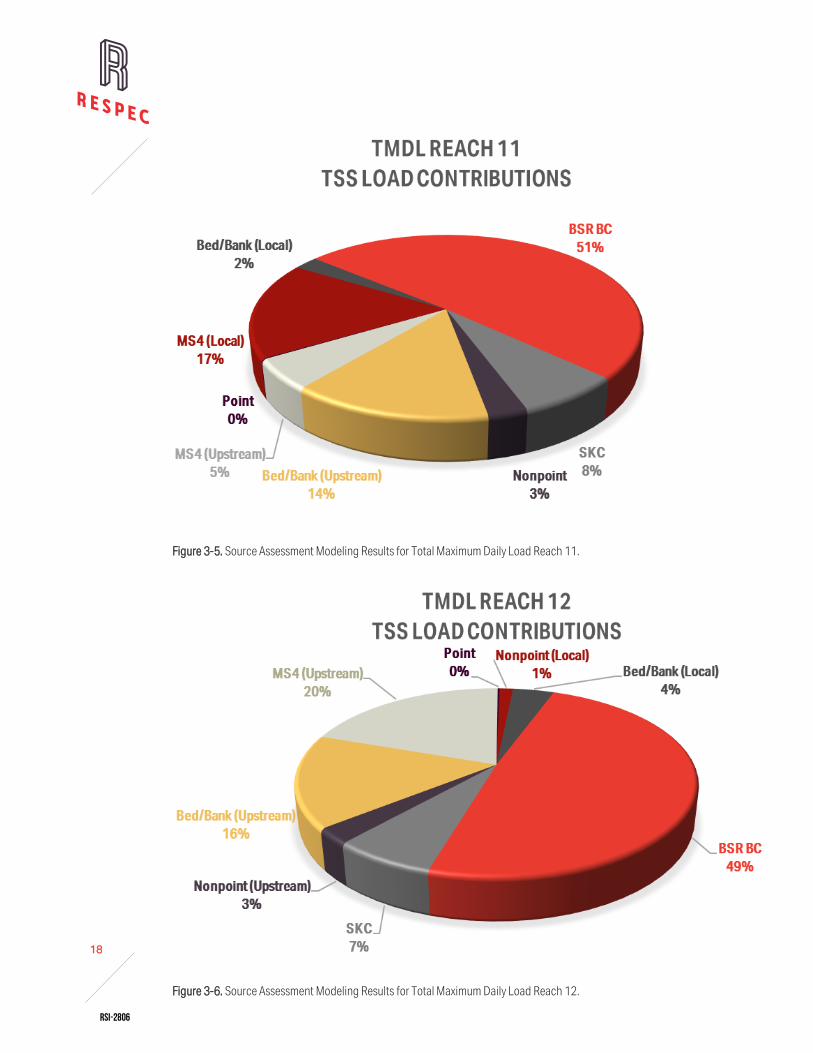
bank. Reach 11 loads were primarily a combination of the Big Sioux River upstream of the boundary
conditions, the local MS4, upstream bed and bank, and Skunk Creek. Finally, Reach 12 loads were
primarily attributed to the Big Sioux River upstream of the boundary conditions, upstream MS4,
upstream bed and bank, and Skunk Creek.
RSI-2806
16
2
Figure 3-2. Diagram of Sources Used in Source Assessment Pie Charts.
RSI-2806
17
2
Figure 3-3. Source Assessment Modeling Results for Total Maximum Daily Load Reach 8.
Figure 3-4. Source Assessment Modeling Results for Total Maximum Daily Load Reach 10.
RSI-2806
18
2
Figure 3-5. Source Assessment Modeling Results for Total Maximum Daily Load Reach 11.
Figure 3-6. Source Assessment Modeling Results for Total Maximum Daily Load Reach 12.
RSI-2806
19
2
4.0 TECHNICAL ANALYSES
The TMDL was developed using the load-duration curve (LDC) approach, which resulted in a flow-
variable target that considers the entire flow regime. The LDC is a dynamic expression of the allowable
daily load for any given flow. To aid in interpreting and implementing the TMDL, the LDC flow intervals
were grouped into five flow zones: high flows (0–10 percent), moist conditions (10–40 percent),
Reaches 8, 10, 11, and 12, respectively. This scenario simulates streambank protection measures
within the project area.
An 85 percent reduction of loads from the MS4 within the project area (Scenario 6) would be expected
to reduce the load by 0, 10, 3, and 3 percent in Reaches 8, 10, 11, and 12, respectively.
A cumulative scenario (Scenario 7) was run with the goal of meeting the 30-day average TMDL
reductions needed in each reach. The cumulative scenario was the combination of Scenarios 3 through
6. The cumulative scenario achieved the goal of meeting the necessary TMDL reductions with a 31, 38,
36, and 39 percent reduction in Reaches 8, 10, 11, and 12, respectively. Therefore, reasonable
assurance is given that the cumulative implementation of Scenarios 3 through 6 would be an effective
method for achieving the TSS TMDLs in the Big Sioux River throughout the project area.
In addition to evaluating load reductions for each scenario, the change in percent exceedance was also
calculated. From the cumulative scenario, the modeled 30-day average percent exceedance was
reduced from 27 to 2 percent in Reach 8, from 17 to 2 percent in Reach 10, from 28 to 5 percent in
Reach 11, and from 32 to 10 percent in Reach 12.
The City of Sioux Falls led the development of the Central Big Sioux River Watershed Implementation
Plan. Within this plan, a watershed-scale, decision-support framework based on cost optimization was
developed to support government and local planning agencies as they considered watershed-scale
investments to improve water quality. This decision-support framework assisted in developing the
TMDL implementation plan, identifying management practices to achieve pollutant reductions under an
MS4 stormwater permit, and developing a phased BMP installation plan that is optimized for both cost
and water quality effectiveness.
Achieving the load reductions necessary to meet the TMDLs will require proper planning between state
and local regulatory agencies, organizations, and stakeholders; BMP implementation; and access to
adequate financial resources. Funds to implement watershed water quality improvements can be
obtained through the SD DENR and the USDA. Specifically, the SD DENR administers three major
funding programs that provide low-interest loans and grants for projects that protect and improve
water quality in South Dakota. These programs include the Consolidated Water Facilities Construction
Program, the Clean Water State Revolving Fund Program, and the Section 319 Nonpoint-Source
Program. If the preferred concentrations cannot be met with the implementation of recommended
BMPs, pollutant trading should be considered for the Sioux Falls Big Sioux River project area
9.3 REASONABLE ASSURANCE When a TMDL is developed for waters that are impaired by both point and nonpoint sources and the
WLA is based on an assumption that nonpoint-source load reductions will occur, the EPA states that
the TMDL should provide reasonable assurances that nonpoint-source control measures will achieve
expected load reductions. The Big Sioux River Reaches 8, 10, 11, and 12 are impaired by nonpoint
sources and permitted point sources (including the MS4); therefore, the requirement to provide
reasonable assurances applies to the TSS TMDLs for these reaches.
RSI-2806
39
2
The WLAs for the non-MS4 point sources are calculated based on the TSS water quality criterion and
discharge volumes estimated by the SD DENR for each point source. The concentration used in these
calculations is equal to or less than the TMDL target. Modeling demonstrates that the non-MS4 point
sources at these WLAs contribute less than 1 percent of the TSS load in these reaches. Therefore,
further reductions in the WLAs for the non-MS4 point sources is not likely to be effective in meeting the
TSS water quality criteria in these reaches. Baltic WWTP did not discharge during the modeling period.
The Dell Rapids WWTP did not exceed their TSS permit limits between 2005 and 2018. L.G. Everist
exceeded their 30-day average permit limit (25 mg/L) in 12 of 202 samples (6 percent) and exceeded
their daily maximum permit limit (45 mg/L) in 4 of 202 samples (2 percent) between 2005 and 2018. The
Sioux Falls WWTP did not exceed their TSS permit limits (45 mg/L) between 2005 and 2018. Smithfield
foods does not have a concentration based WLA, but they exceeded the daily maximum water quality
standard (158 mg/L) in 4 of 44 samples (9 percent).
The following elements provide assurances that nonpoint-source control measures can be feasibly
designed to reduce the TSS loading in these reaches, are likely to be effective, and have a reasonably
high probability of successful implementation in the Big Sioux River project area:
/ Continued cooperation among stakeholders will facilitate implementing BMPs. The water
quality assessment work and the TMDL development for these reaches were performed as a
cooperative project among the City of Sioux Falls, USGS, the EDWDD, RESPEC, and SD DENR.
The cooperation among local stakeholders, state and local regulatory agencies, and
organizations is expected to continue through the implementation phase, which will increase
the probability of success.
/ Simulation of management scenarios indicates that they are likely to be effective. Potential
BMP scenarios of the four reaches have been conceptually developed, and the HSPF model
was used to predict the effectiveness of individual and cumulative scenarios. The HSPF model
predicts that implementing the cumulative scenario will achieve the required load reductions
needed in all four impaired reaches.
/ The percent reductions in nonpoint-source loading required to meet the TMDL are the
difference between the baseline loading and the TMDL. The baseline loading value chosen for
the four reaches was calculated using the 90th percentile of the monthly average TSS
concentration for each flow zone with the median of the monthly average discharge. This
method conservatively calculates of the necessary loading reductions.
/ A TMDL implementation plan has been written, resources have been committed, and work has
been completed on a watershed-scale decision-support framework. The cost-effective
framework supports government and local planning agencies in coordinating investments to
achieve required load reductions. This decision-support framework outlines strategies with the
best probability of success and milestones for implementation. BMP implementation strategies
have already been developed within the city of Sioux Falls MS4 permit and the Central Big Sioux
River Implementation Plan.
9.4 ADAPTIVE IMPLEMENTATION APPROACH An adaptive implementation approach will be followed for this TMDL. The EPA defines “adaptive
implementation [as] an iterative implementation process that makes progress toward achieving water
RSI-2806
40
2
quality goals while using any new data and information to reduce uncertainty and adjust implementation
activities” [EPA, 2006]. Using an adaptive implementation approach for this TMDL is based on the
uncertainty in developing the loading sources. The source assessment presented in Chapter 3.0 of this
TMDL is based on relatively general sources of load contributions. To effectively achieve TSS reduction
in the Big Sioux River, further understanding of specific sources of TSS to the impaired reaches is
needed. To obtain a better understanding of the sources, a relatively intensive monitoring network, that
consists of spatially distributed sampling locations should be established within the project area. A
possible benefit of this monitoring would be the ability to further isolate and investigate portions of the
watershed with elevated suspended sediment levels for potential source areas and remedial actions.
As noted in Chapter 8.0, the SD DENR will notify the EPA of any adjustments to this TMDL within 30 days
of their adoption.
RSI-2806
41
2
10.0 REFERENCES
Administrative Rules of South Dakota, 2010. “ASRD: 74:51:01:30,” legis.state.sd.us, retrieved
February 23, 2010, from http://legis.state.sd.us/rules/DisplayRule.aspx?Rule=74:51:01:30
Buscher, K., 2010. Personal communication between K. Buscher, South Dakota Department of
Environment and Natural Resources, Pierre, SD, and C. McCutcheon, RESPEC, Rapid City, SD,
November 9.
McCutcheon, C. M., J. K. Oswald, J. T. Love, and J. P. Lambert, 2012. Total Suspended Solids Total Maximum Daily Load for The Big Sioux River, Minnehaha County, South Dakota, RSI-2182, prepared by
RESPEC, Rapid City, SD, for the South Dakota Department of Environment and Natural Resources, Pierre,
SD.
South Dakota Department of Environment and Natural Resources, 1999. Authorization to Discharge Under the Surface Water Discharge System SDS-000001, prepared by the South Dakota Department of
Environment and Natural Resources, Pierre, SD.
South Dakota Department of Environment and Natural Resources, 2008. The 2008 South Dakota Integrated Report for Surface Water Quality Assessment, prepared by the South Dakota Department of
Environment and Natural Resources, Pierre, SD.
South Dakota Department of Environment and Natural Resources, 2018a. The 2018 South Dakota Integrated Report for Surface Water Quality Assessment, prepared by the South Dakota Department of
Environment and Natural Resources, Pierre, SD.
South Dakota Department of Environment and Natural Resources, 2018b. Gov. Daugaard Announces $8.829 Million Loan for Sioux Falls Storm Sewer and Nonpoint Source Projects, external news release
from M. Perkovich, South Dakota Department of Environment and Natural Resources, Pierre, SD,
January 4.
South Dakota Department of Environment and Natural Resources, 2010. The 2010 South Dakota Integrated Report for Surface Water Quality Assessment, prepared by the South Dakota Department of
Environment and Natural Resources, Pierre, SD.
South Dakota State University, 2008. “South Dakota Climate and Weather,” sdstate.edu, retrieved
September 1, 2008, from http://climate.sdstate.edu/climate_site/ climate.htm
US Department of Commerce National Climatic Data Center, 2004. “Snowfall-Average Totals in Inches,”
noaa.gov, retrieved September 1, 2008, from http://lwf.ncdc.noaa.gov/oa/climate/online/ccd/snowfall.html
US Environmental Protection Agency, 2006. “Clarification Regarding “Phased” Total Maximum Daily
Loads,” epa.gov, retrieved July 1, 2010, from http://water.epa.gov/lawsregs/lawsguidance/cwa/tmdl/tmdl_clarification_letter.cfm
US Environmental Protection Agency, 2007. An Approach for Using Load Duration Curves in the Development of TMDLs, US Environmental Protection Agency, Office of Water, Washington, DC.
RSI-2806
A-1
2
APPENDIX A DAILY MAXIMUM CRITERIA TOTAL MAXIMUM DAILY LOAD TABLES
RSI-2806h
A-2
2
TMDLs in the daily maximum TMDL tables were developed using the median simulated daily average
flow and the daily maximum criteria in each flow zone. Current loads in the daily maximum TMDL tables
were developed using the 90th percentile observed daily average concentration and the median
simulated daily average flow in each flow zone.
Table A-1. Total Suspended Solids Total Maximum Daily Load Based on the Daily Maximum Criterion for Reach 8
TMDL
Component
(Tons/Day)
Flow Zone
High Moist Midrange Dry/Low Combined
TMDL 596.64 324.88 164.25 58.87
MOS 59.66 32.49 16.42 5.89
PSA WLA
9.91 9.91
9.91 9.91
9.91 9.91
9.91 9.91
MS4 0 0 0 0
LA 527.07 282.48 137.92 43.07
Current Load 789.99 283.47 126.20 24.21
Load Reduction 24% 0% 0% 0%
Table A-2. Total Suspended Solids Total Maximum Daily Load Based on the Daily Maximum Criterion for Reach 10
TMDL
Component
(tons/day)
Flow Zone
High Moist Midrange Dry/Low Combined
TMDL 223.13 82.16 41.72 18.43
MOS 22.31 8.22 4.17 1.84
PSA WLA
5.63 39.10
5.63 17.96
5.63 11.89
5.63 8.40
MS4 33.47 12.32 6.26 2.76
LA 161.72 55.98 25.66 8.19
Current Load 344.30 55.38 32.85 10.88
Load Reduction 35% 0% 0% 0%
Table A-3. Total Suspended Solids Total Maximum Daily Load Based on the Daily Maximum Criterion for Reach 11
TMDL
Component
(Tons/Day)
Flow Zone
High Moist Midrange Dry Low
TMDL 750.64 382.60 200.27 92.51 22.07
MOS 75.06 38.26 20.03 9.25 2.21
PSA WLA
7.01 37.04
7.01 22.32
7.01 15.02
7.01 10.71
7.01 7.90
MS4 30.03 15.30 8.01 3.70 0.88
LA 638.54 322.02 165.22 72.55 11.96
Current Load 1260.88 286.71 138.67 36.89 4.14
Load Reduction 40% 0% 0% 0% 0%
RSI-2806h
A-3
2
Table A-4. Total Suspended Solids Total Maximum Daily Load Based on the Daily Maximum Criterion for Reach 12