Update on CMIP5 and Opportunities for Assessing Model Reliability Karl E. Taylor Program for Climate Model Diagnosis and Intercomparison (PCMDI) Lawrence Livermore National Laboratory Presented to WCRP Open Science Conference Denver, Colorado 26 October 2011
Transcript
Update on CMIP5 and Opportunities for Assessing Model Reliability
Karl E. Taylor
Program for Climate Model Diagnosis and Intercomparison (PCMDI) Lawrence Livermore National Laboratory
Presented to WCRP Open Science Conference
Denver, Colorado 26 October 2011
PCMDI WCRP OSC 26 October 2011 K. E. Taylor
Outline
• CMIP5 overview
• Approaches to assessing model reliability
• “Long-term” experiments
• Decadal prediction experiments
• Atmosphere-only experiments
• Summary
PCMDI WCRP OSC 26 October 2011 K. E. Taylor
CMIP5 overview
• CMIP5 is organized by the WCRP’s Working Group on Coupled Modeling (WGCM)
• It builds on but is much more ambitious than its predecessors
Addresses more research questions Includes more comprehensive models Produces more output fields Calls for more complete documentation of models/experiments Requires a new delivery system for data
• It is designed to
Meet the needs of the climate research community Provide a basis for papers of interest to the IPCC’s AR5
PCMDI WCRP OSC 26 October 2011 K. E. Taylor
CMIP5 participating groups (23 groups; 50+ models; 17 Oct 2011: 24 models available from 13 centers)
Primary Group Country Model CAWCR Australia ACCESS
BCC China BCC-CSM1.1
GCESS China BNU-ESM
CCCMA Canada CanESM2, CanCM4, CanAM4
CCSM USA CESM1, CCSM4
RSMAS USA CCSM4(RSMAS)
CMCC Italy CMCC- CESM, CM, & CMS
CNRM/CERFACS France CNRM-CM5
CSIRO/QCCCE Australia CSIRO-Mk3.6
EC-EARTH Europe EC-EARTH
LASG, IAP China FGOALS- G2.0, S2.0 & gl
FIO China FIO-ESM
NASA/GMAO USA GEOS-5
GFDL USA GFDL- HIRAM-C360, HIRAM-C180, CM2.1, CM3, ESM2G, ESM2M
NASA/GISS USA GISS- E2-H, E2-H-CC, E2-R, E2-R-CC, E2CS-H, E2CS-R
MOHC UK Had CM3, CM3Q, GEM2-ES, GEM2-A, GEM2-CC
NMR/KMA Korea / UK HadGEM2-AO
INM Russia INM-CM4
IPSL France IPSL- CM5A-LR, CM5A-MR, CM5B
MIROC Japan MIROC 5, 4m, 4h, ESM, ESM-CHEM
MPI-M Germany MPI-ESM- HR, LR
MRI Japan MRI- AGCM3.2H, AGCM3.2S, CGCM3, ESM1
NCC Norway NorESM1-M, NorESM-ME, NorESM1-L
PCMDI WCRP OSC 26 October 2011 K. E. Taylor
PCMDI-led Earth System Grid Federation (ESGF) serves CMIP5 simulation output to analysts worldwide
What does ESGF do for CMIP5?
• For CMIP5, ESGF links together 13 data nodes
• Data holdings expanding from 100’s to 1000’s of Tbytes
• Serves 100’s of users
Data Nodes (at major international climate research centers)
Node 1
Node 2
Node 3
Node 4
Node 5
Data Portal Local copy of heavily-used data
Model & expt. documentation
Data Users (climate model analysts worldwide)
Three Primary CMIP5 Data Portals)
PCMDI Data Portal
DKRZ Data Portal
BADC Data Portal
PCMDI WCRP OSC 26 October 2011 K. E. Taylor
Approaches to assessing model reliability
• Seasonal to decadal forecasts: use hindcasts
• Ability to simulate important climate phenomena (e.g., seasonal cycle, ENSO, NAO, diurnal cycle, MJO)
Compare directly with observations: regional to global scale
• Ability to simulate important processes (e.g., radiative transfer, boundary layer clouds, convection, cyclones/anticyclones)
Make use of specialized datasets (site-specific – e.g., ARM; and special observing periods– e.g., YOTC)
Compare with benchmark models
• Isolate and evaluate sub-components of the climate system
PCMDI WCRP OSC 26 October 2011 K. E. Taylor
Reliability/uncertainty in climate projections on centennial and longer time-scales is difficult
• Observational record not long enough to quantify skill based on hindcasts (only 1 hindcast available)
• Attempt to build confidence that models accurately represent the physics (and dynamics) of the climate system
Ability to simulate important climate phenomena Ability to represent individual processes Ability to forecast weather and climate (on decadal and shorter time-
scales) Ability to simulate paleoclimates
• But we don’t know the relationship between skill in simulating things we can observe and projection skill.
• So, we also consider model spread as a guide to uncertainty
PCMDI WCRP OSC 26 October 2011 K. E. Taylor
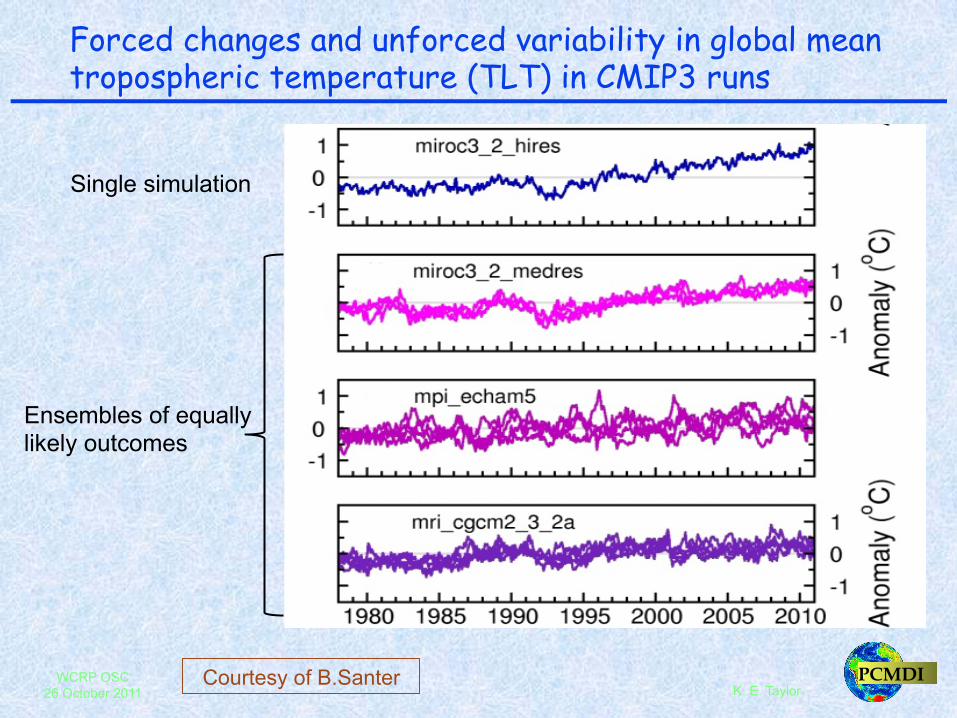
The CMIP3 multi-model ensemble produced a range of responses even when forced similarly
AR4 Summary for Policy Makers
PCMDI WCRP OSC 26 October 2011 K. E. Taylor
Forced changes and unforced variability in global mean tropospheric temperature (TLT) in CMIP3 runs
Courtesy of B.Santer
Single simulation
Ensembles of equally likely outcomes
PCMDI WCRP OSC 26 October 2011 K. E. Taylor
Total range of future climate change estimates depends on scenario, model, and unforced variability
Hawkins & Sutton, BAMS, 2009
Unforced variability is important only in the near-term.
PCMDI WCRP OSC 26 October 2011 K. E. Taylor
Projection ranges are initially dominated by model “uncertainty”, but eventually are dominated by scenario
Hawkins & Sutton, BAMS,
2009
scenario
model response
Unforced variabilty
PCMDI WCRP OSC 26 October 2011 K. E. Taylor
The CMIP3 multi-model ensemble produced a range of responses even when forced similarly
AR4 Summary for Policy Makers
PCMDI WCRP OSC 26 October 2011 K. E. Taylor
What is “model uncertainty”?
• The “spread” of model results for any given scenario is loosely referred to as “model uncertainty”
• It sometimes is assumed to be an estimate of the range of “possible outcomes” produced by some scenario, with the “truth” presumably contained within the range
• Remember, the spread can result from several factors:
Differences in “forcing” and “climate sensitivity”
Differences in the (equally likely) paths of unforced variability exhibited by simulations forced in the same way
In CMIP5 emission-forced simulations, differences in carbon cycles
PCMDI WCRP OSC 26 October 2011 K. E. Taylor
CMIP5 is organized around three types of simulations
“Long-Term” Projections (century &
longer)
TIER 1
TIER 2
CORE
evaluation & projection
diagnosis
Decadal Climate Prediction
(initialized ocean state)
hindcasts & forecasts
CORE
TIER 1
AMIP
“time-slice” CORE
Atmosphere-Only Simulations (for computationally demanding and NWP models)
TIER 1
TIER 2
PCMDI WCRP OSC 26 October 2011 K. E. Taylor
A rich set of CMIP5 experiments, drawn from several predecessor MIPs, focuses on model evaluation, projections, and understanding
Green subset is for coupled carbon-cycle climate models only
Red subset matches the entire CMIP3 experimental suite
Control, AMIP, & 20 C
RCP4.5, RCP8.5
aqua
planet
(clouds)
mid
-H
oloc
ene
& LG
M la
st
mille
nniu
m
E-driven RCP8.5
E-driven control & 20 C
1%/yr CO2 (140 yrs) abrupt 4XCO2 (150 yrs)
fixed SST with 1x & 4xCO2
1%/yr CO2 (but radiation sees 1xCO2) 1%/yr CO2 (but carbon cycle sees 1XCO2)
ensembles: AMIP & 20 C
Understanding
Model Evaluation
Climate Projections
ensembles: AMIP & 20 C
Adapted from Taylor et al., BAMS, 2011
PCMDI WCRP OSC 26 October 2011 K. E. Taylor
Abrupt 4xCO2 simulation yields estimates of model differences in climate “sensitivity” and “forcing”
Control, AMIP, & 20 C
RCP4.5, RCP8.5
aqua
planet
(clouds)
mid
-H
oloc
ene
& LG
M la
st
mille
nniu
m
E-driven RCP8.5
E-driven control & 20 C
1%/yr CO2 (140 yrs) abrupt 4XCO2 (150 yrs)
fixed SST with 1x & 4xCO2
1%/yr CO2 (but radiation sees 1xCO2) 1%/yr CO2 (but carbon cycle sees 1XCO2)
ensembles: AMIP & 20 C
Understanding
abrupt 4XCO2 (150 yrs)
PCMDI WCRP OSC 26 October 2011 K. E. Taylor
CMIP5 idealized experiments designed to quantify differences in model forcing and global climate sensitivity
Gregory et al., 2004
ΔF (for quadrupling of CO2)
α = slope ΔTeq
PCMDI WCRP OSC 26 October 2011 K. E. Taylor
Preliminary results from 9 CMIP5 models
Ranges Climate fdbk (α) = 0.6 – 1.6 W m-2 / K
Forcing = 4.9 – 8.6 W m-2
2xCO2 equilibrium climate sensitivity = 2.0 – 4.6 K
Courtesy of T. Andrews
PCMDI WCRP OSC 26 October 2011 K. E. Taylor
CO2 forcing and aerosol forcing can be quantified using an alternative method.
Control, AMIP, & 20 C
RCP4.5, RCP8.5
aqua
planet
(clouds)
mid
-H
oloc
ene
& LG
M la
st
mille
nniu
m
E-driven RCP8.5
E-driven control & 20 C
1%/yr CO2 (140 yrs) abrupt 4XCO2 (150 yrs)
fixed SST with 1x & 4x CO2
1%/yr CO2 (but radiation sees 1xCO2) 1%/yr CO2 (but carbon cycle sees 1XCO2)
ensembles: AMIP & 20 C
Understanding
PCMDI WCRP OSC 26 October 2011 K. E. Taylor
Carbon cycle feedbacks can be diagnosed
Control, AMIP, & 20 C
RCP4.5, RCP8.5
aqua
planet
(clouds)
mid
-H
oloc
ene
& LG
M la
st
mille
nniu
m
E-driven RCP8.5
E-driven control & 20 C
1%/yr CO2 (140 yrs) abrupt 4XCO2 (150 yrs)
fixed SST with 1x & 4xCO2
1%/yr CO2 (but radiation sees 1xCO2) 1%/yr CO2 (but carbon cycle sees 1XCO2)
ensembles: AMIP & 20 C
Understanding
PCMDI WCRP OSC 26 October 2011 K. E. Taylor
Representation of clouds and cloud processes can be studied under realistic and idealized conditions with help of “satellite simulator” output (CFMIP)
Control, AMIP, & 20 C
RCP4.5, RCP8.5
aqua
planet
(clouds)
mid
-H
oloc
ene
& LG
M la
st
mille
nniu
m
E-driven RCP8.5
E-driven control & 20 C
1%/yr CO2 (140 yrs) abrupt 4XCO2 (150 yrs)
fixed SST with 1x & 4xCO2
1%/yr CO2 (but radiation sees 1xCO2) 1%/yr CO2 (but carbon cycle sees 1XCO2)
ensembles: AMIP & 20 C
Understanding
PCMDI WCRP OSC 26 October 2011 K. E. Taylor
Ability to simulate climates of the past that are substantially different from today can be assessed
Control, AMIP, & 20 C
RCP4.5, RCP8.5
aqua
planet
(clouds)
mid
-Ho
loce
ne
& LG
M la
st
mill
enni
um
E-driven RCP8.5
E-driven control & 20 C
1%/yr CO2 (140 yrs) abrupt 4XCO2 (150 yrs)
fixed SST with 1x & 4xCO2
1%/yr CO2 (but radiation sees 1xCO2) 1%/yr CO2 (but carbon cycle sees 1XCO2)
ensembles: AMIP & 20 C
Understanding
PMIP runs
PCMDI WCRP OSC 26 October 2011 K. E. Taylor
Ability to simulate trends can be evaluated with “detection and attribution” focused simulations
Control, AMIP, & 20 C
RCP4.5, RCP8.5
aqua
planet
(clouds)
mid
-H
oloc
ene
& LG
M la
st
mille
nniu
m
E-driven RCP8.5
E-driven control & 20 C
1%/yr CO2 (140 yrs) abrupt 4XCO2 (150 yrs)
fixed SST with 1x & 4xCO2
1%/yr CO2 (but radiation sees 1xCO2) 1%/yr CO2 (but carbon cycle sees 1XCO2)
ensembles: AMIP & 20 C
PCMDI WCRP OSC 26 October 2011 K. E. Taylor
Climate projections
Control, AMIP, & 20 C
RCP4.5, RCP8.5
aqua
planet
(clouds)
mid
-H
oloc
ene
& LG
M la
st
mille
nniu
m
E-driven RCP8.5
E-driven control & 20 C
1%/yr CO2 (140 yrs) abrupt 4XCO2 (150 yrs)
fixed SST with 1x & 4xCO2
1%/yr CO2 (but radiation sees 1xCO2) 1%/yr CO2 (but carbon cycle sees 1XCO2)
ensembles: AMIP & 20 C
Climate Projections
ensembles: AMIP & 20 C
PCMDI WCRP OSC 26 October 2011 K. E. Taylor
“Long-term” experiments: contributions
Experiment(s) # of
models
* Control & historical 35 (14)
* AMIP 26 (9)
* RCP4.5 & 8.5 29 (15)
RCP2.6 18 (12)
RCP6 13 (10)
RCP’s to year 2300 10 (?)
* 1% CO2 increase 28 (11)
* Fixed SST CO2 forcing diagnosis 16 (8)
* Abrupt 4XCO2 diagnostic 22 (11)
* Core simulations (# available as of 17 Oct 2011)
Experiment(s) # of
models
Fast adjustment diagnostic 9 (?)
Aerosol forcing 9 (5)
*ESM control, historical & RCP8.5 18 (4)
Carbon cycle feedback isolation 9 (3)
Mid-Holocene & LGM 11 (4)
Millenium 7 (0)
CFMIP runs ~8 (~4)
D & A runs 15 (8)
PCMDI WCRP OSC 26 October 2011 K. E. Taylor
CMIP5 will also include models initialized with the observed climate state (particularly, the upper ocean)
• The hope is that through initialization the models will be able to predict the actual trajectory of “unforced” climate variations.
• The hypothesis is that some longer time-scale natural variability is predictable if the initial state of the system is known
Stephenson (2007, hereafter CS07) used a simple climate model to estimate the three different con-tributions to fractional uncertainty. Knutti et al. (2008) used data from CMIP3 and from simpler climate models in a similar analysis but only quan-tified the model uncertainty component. Here, we have used the CMIP3 data to estimate the fractional uncertainty associated with all three contributions (Figs. 3, 4a), and extended the analysis to regional
scales (Fig. 4b), which are of much greater relevance for adaptation planning. Our results for global mean temperature are consistent with those of Knutti et al. (2008). They also show important similarities to the findings of CS07, but there are also some crucial differences.
Following CS07, Figs. 3 and 4a both show how the contributions to fractional uncertainty vary as a function of prediction lead time. In Fig. 3 the
FIG. 4. The relative importance of each source of uncertainty in decadal mean surface temperature projec-tions is shown by the fractional uncertainty (the 90% confidence level divided by the mean prediction) for (a) the global mean, relative to the warming from the 1971–2000 mean, and (b) the British Isles mean, relative to the warming from the 1971–2000 mean. The importance of model uncertainty is clearly visible for all policy-relevant timescales. Internal variability grows in importance for the smaller region. Scenario uncertainty only becomes important at multidecadal lead times. The dashed lines in (a) indicate reductions in internal variability, and hence total uncertainty, that may be possible through proper initialization of the predictions through assimilation of ocean observations (Smith et al. 2007). The fraction of total variance in decadal mean surface air temperature predictions explained by the three components of total uncertainty is shown for (c) a global mean and (d) a British Isles mean. Green regions represent scenario uncertainty, blue regions represent model uncertainty, and orange regions represent the internal variability component. As the size of the region is reduced, the relative importance of internal variability increases.
1097AUGUST 2009AMERICAN METEOROLOGICAL SOCIETY |
Hawkins & Sutton, 2009
The deviation from observations caused by unforced variability can potentially be reduced through initialization.
PCMDI WCRP OSC 26 October 2011 K. E. Taylor
The new “near-term" experiments attempt “predictions” of the climate state, including “unforced” variations, by initializing models with observations.
* Core simulations simulations (# available as of 17 Oct 2011)
PCMDI WCRP OSC 26 October 2011 K. E. Taylor
CMIP5 Atmosphere-Only Experiments (targeted for computationally demanding and NWP models)
AMIP (1979-2008)
uniform ΔSST
(clouds)
patterned ΔSST
(clouds)
future “time-slice” (2026-2035)
~14 models plan to do core runs (10 of these will also do long-term and/or decadal simulations)
PCMDI WCRP OSC 26 October 2011 K. E. Taylor
Is “uncertainty” based on spread of model results misleading?
• It doesn’t include possibility of a common bias across models
If the bias is not zero, the truth may lay outside model results
• It assumes that existing models constitute a “representative sample” of all possible models that are equally consistent with physical laws and observations.
If some of the models are inconsistent with observations, then eliminating/down-weighting those models should improve uncertainty estimation
If “social pressures” decrease the spread of model results, “model uncertainty” will be unjustifiably perceived as being reduced
• The common (but not rigorously grounded) aspects of model formulation may (misleadingly) limit the spread
PCMDI WCRP OSC 26 October 2011 K. E. Taylor
Structural uncertainty may be underestimated in perturbed physics ensembles (perhaps also in multi-model ensembles)
Sea level rise pattern (with global mean removed)
Pardaens, Gregory, and Rowe, Clim. Dyn., 2010
CMIP3 ensemble
Perturbed physics ensemble
PCMDI WCRP OSC 26 October 2011 K. E. Taylor
If the multi-model ensemble can’t provide rigorous estimates of the total uncertainty, what can it do?
PCMDI WCRP OSC 26 October 2011 K. E. Taylor
Rough explanations for differences in model responses can sometimes be identified and used to set research priorities
Response Model Agreement
Nor
mal
ized
inte
r-m
odel
diff
eren
ce
Feedback type Multi-model mean
Dufresne and Bony, J. Climate, 2008
Cloud feedbacks are responsible for largest fraction of model response differences
PCMDI WCRP OSC 26 October 2011 K. E. Taylor
Relationships between observables and projected climate responses can sometimes be discovered
Response of snow cover to global warming in models is related to their snow response to spring warming
Hall and Xu, GRL, 2006
But recall that surface albedo feedback is relatively weak
PCMDI WCRP OSC 26 October 2011 K. E. Taylor
CMIP5 provides a number of opportunities to evaluate models
• Forced responses
Seasonal cycle
Diurnal cycle
Volcanic eruptions
Historical warming
Paleoclimates
• Unforced variability
ENSO
Madden-Julien Oscillation
NAO
historical &
single-forcing “detection & attribution”
LGM, mid-Holocene, last millenium
Control & AMIP
AMIP
Most relevant Experiments
PCMDI WCRP OSC 26 October 2011 K. E. Taylor
CMIP5 provides perspectives on uncertainty in projections
• The spread indicates that there is uncertainty in model projections
• Reduced spread may give us more confidence in a result, but
• The spread of model results cannot provide a rigorous estimate of uncertainty
PCMDI WCRP OSC 26 October 2011 K. E. Taylor
CMIP5 timeline reminder:
• Late 2013: IPCC AR5 published
• Journal articles accepted – 15 March 2013
• Journal articles submitted – 31 July 2012
• April 2012: Data not already in the CMIP5 archive will probably not be included in publications cited by the AR5
• March 2011: First model output became available to users
PCMDI WCRP OSC 26 October 2011 K. E. Taylor
Advertisements
• WCRP’s WGCM has planned a CMIP5 science conference: