Oil and Gas at Your Door?A Landowner’s Guide to Oil and Gas DevelopmentSecond Edition
Updates-1
upda
tesUpdates to the 2004 Landowner’s Guide
Section/Chapter New Page Number
Introduction
Should you be concerned about oil and gas development?Figure i-1 (new) ....................................................................................................i-2Figure i-2 (updated) ...............................................................................................i-4Figure i-3 (updated) ...............................................................................................i-5Figure i-5 (new) ......................................................................................................i-6
Chapter I
Terms and ConceptsFigure I-1 (new) ......................................................................................................I-3Updated information on nonconventional oil and gas .......................................I-3
Stages of Oil and Gas Development, 1.2.3.4Drilling Fluid/Mud (updated) ..............................................................................I-11Well Spacing (updated) ................................................................................I-13, 14Mineral Pooling (updated) ...........................................................................I-15, 16Unitization (new)..................................................................................................I-16Hydraulic fracturing (updated) ...............................................................I-17 to I-20Figure I-11 (new) .................................................................................................I-19Oil and Gas Treatment and Conditioning (updated, new title) ..........I-20, 21, 22Figure I-22 (new) .................................................................................................I-29Figure I-24 (new) .................................................................................................I-33Cavitation (updated).....................................................................................I-33, 34Figure I-25 (new) .................................................................................................I-34
Impacts Associated with Oil and Gas OperationsHousing, Crime, Safety, Roads, Dust, Property Values (new)...................I-43, 44Noise (updated).......................................................................................I-44 to I-49 Dust Suppression................................................................................................I-52
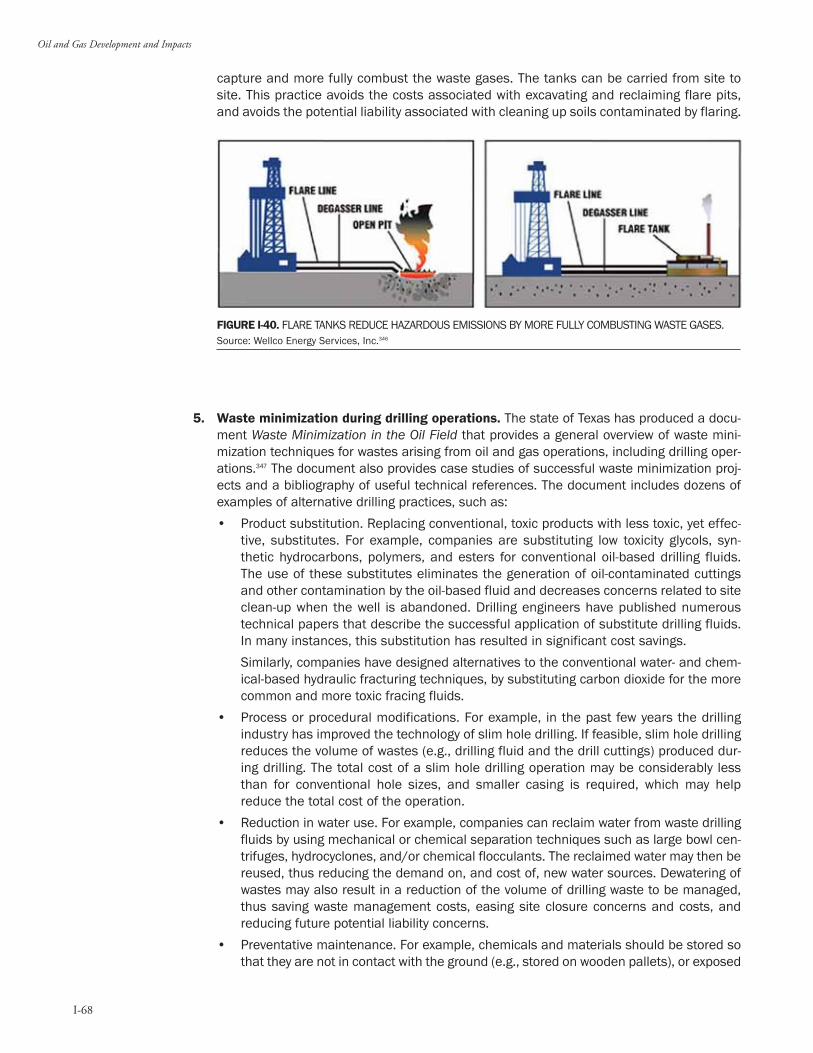
Alternative Technologies and PracticesFigure I-37 (new)..................................................................................................I-66Figure I-39 (new) .................................................................................................I-67Flareless or “green” completions (new) ...................................................I-67, I-68Figure I-40............................................................................................................I-68
Chapter II
Who Owns the Minerals Beneath Your Land?How to Determine Ownership (updated) ...................................................II-5, 6, 7
Updates-2
Updates
Regulations and Surface Owner ProtectionsLeasing (updated) ..............................................................................................II-11Shortage of State and Federal Oil and Gas Inspectors (new)........................II-12Financial Assurance (updated) ............................................................II-17, 18, 19Figure II-6 (updated)...........................................................................................II-17Figure II-7 (new)..................................................................................................II-18Figure II-8 (new)..................................................................................................II-19
Chapter III
What to do When the Landman Comes CallingWhat to do if contacted by a landman (updated) ........................................III-1, 2Know your landman (new) ..................................................................................III-2
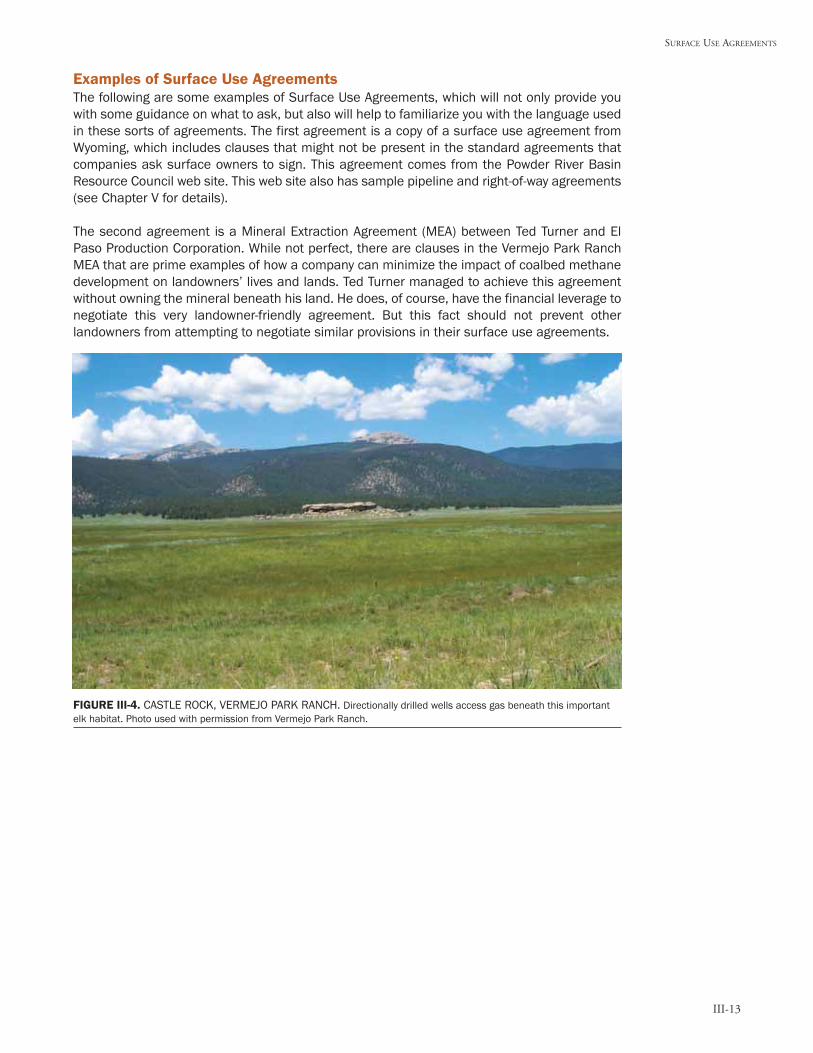
Surface Use AgreementsHow to Determine Reasonable Compensation (updated) .................III-9 to III-12Figure III-1 (new)................................................................................................III-10Figure III-2 (new)................................................................................................III-12Figure III-4 (new)................................................................................................III-13
Other Activities Landowners May Want to ConsiderResidents of Matanuska Susitna get progressive local regulations......III-31, 32
Chapter IV
Landowner StoriesLaura Amos: Hydraulic Fracturing.....................................................IV-23, 24, 25Company’s Threat to Bond and Drill is Not Negotiating in Good Faith...IV-25, 26Wyoming Landowners Face Condemnation or Loss of Home Insurance.....................................................................IV-27, 28, 29
Chapter V
Most sections have been updated ...........................................................V1 to 11
Endnotes
Endnotes have been updated ....................................................Endnotes-1 to 19
SHOULD YOU BE CONCERNED ABOUT OIL AND GAS DEVELOPMENT?
If you own some land, but aren’t presently dealing with oil and gas development, you may bewondering whether or not you need to read this guidebook. The following questions may shedsome light on this issue.
What is the future of oil and gas production in the U.S.? In the United States, approximatelyfour million wells have been drilled in the search for oil and gas, which started in this countryin the early 1800s.1
Between 1992 and 2002, the number of producing domestic natural gas wells increased fromapproximately 202,000 to 262,000. Meanwhile, the number of domestic oil wells declinedfrom 396,000 wells in 1992 to 319,000 wells in 2002.2
Figure i-1 shows the number of oil and gas wells drilled per year in the U.S. since 1992. It isclear that the drilling of natural gas wells has skyrocketed since about 1999.
All signs point to the fact that drilling—at least for natural gas—is not going to slow down in thenear future. The U.S. Department of Energy predicts that domestic natural gas production inthe country is going to increase from 19.1 trillion cubic feet (2003) to 21.8 trillion cubic feet(2025).4 Crude oil production is predicted to experience slower growth, and any increase isexpected to come from offshore oil reserves.
The current administration contends that increasing our domestic energy supply is necessaryto protect our national security.5 In a 2001 speech on U.S. Energy Strategy, Vice PresidentCheney stated that:
FIGURE i-1. NEW CRUDE OIL AND NATURAL GAS WELLS DRILLED IN THE U.S. BY YEAR.Source: Energy Information Administration. U.S. Department Of Energy.3
For the oil we need, unless we choose to accept our growing dependence on foreignsuppliers—and all that goes with that—we must increase domestic production fromknown sources. . . For the natural gas we need, we must lay more pipelines—at least38,000 miles more—as well as many thousands of miles of added distribution lines tobring natural gas into our homes and workplaces.6
The United States will eventually deplete its oil and gas resources, but this is unlikely to occurin our lifetime. As development continues, more and more conflicts between oil and gas devel-opers and landowners are sure to arise because of impacts to land, water and public healthand safety, all of which are threatened by increased oil and gas extraction.
Do we “need” so much oil and gas? The United States is the number one consumer of oil—Americans use 23.5 million barrels per day.7 There is the perceived need to increase oil pro-duction because the U.S. Department of Energy has forecast that our consumption will increaseby 1.8% (423,000 barrels per day) every year until 2050.8 Current government policy, however,is focused on increasing production rather than decreasing consumption. If a shift occurred infederal government priorities, the “need” to develop more wells, faster, would diminish.
For example, because nearly 70% of this country’s oil consumption is currently used for trans-portation, the United States could reduce consumption if it focused on reducing oil use in thetransportation sector. According to a report by the National Environmental Trust,9 the U.S. gov-ernment easily could implement a program to decrease U.S. oil demand by:
• Encouraging Americansto keep their enginestuned up and their tiresproperly inflated. Thiswould cut U.S. oil con-sumption by a millionbarrels per day!
• Increasing federal fueleconomy standards forcars and trucks to 40miles per gallon by 2010. This would elimi-nate the projectedgrowth in U.S. oil imports by that date. This is a reasonable recommendation, as U.S. autocompanies have already committed to meeting this standard for cars exported to Europeby 2010. They simply need to implement the same standard here in the U.S.
As for natural gas, the United States is the country with the second largest consumption rate inthe world.10 In June 1999, an article in Oil & Gas Journal reported that in Texas, a state that pro-duces 1/3 of the nation’s gas, 6,400 new wells must be drilled each year to keep its produc-tion stable. But Americans’ demand for natural gas is not stable.11 According to the U.S.Department of Energy, U.S. consumption is forecast to increase by 2.2% every year.12 So, evenif we continue to increase our drilling of natural gas wells, we are not going to meet our “needs.”
What is really needed is an energy policy that provides incentives for reducing our demand foroil and natural gas, and promotes the development of less polluting, renewable energy sources.
i-3
With engines tunedand tires properlyinflated, oil con-sumption would bedecreased by1,000,000 barrels per day
— NationalEnvironmental Trust
Where will the oil and gas come from? Since it is likely that oil and gas development will con-tinue to be promoted in the United States, information on the known locations of oil and gasreserves will help landowners know whether or not they are living in areas where oil or gasexploration and drilling may either begin to occur or intensify.
Known deposits of oil occur in more than 30 states, with the majority of current onshore oil pro-duction concentrated in Texas, Oklahoma, Louisiana, Wyoming, California, Kansas and NewMexico.13 The majority of proved reserves of oil, however, have a slightly different geographicdistribution. (The U.S. Department of Energy defines proved reserves as the volumes of oil orgas that geological and engineering data have demonstrated with reasonable certainty to berecoverable in the future, under existing economic and operating conditions.)14 As seen inFigure i-2, Texas, Alaska, California, Louisiana, New Mexico and Oklahoma are the states withthe largest on-shore proved reserves of oil.
The geographic distribution of natural gas is similar to that of oil, as natural gas often occurs inassociation with oil deposits. In terms of current production, three States (Texas, Louisiana, andOklahoma) produce more than half of the natural gas in this country. New Mexico, Wyoming,Colorado and Kansas are also major gas-producing states.16
Large deposits of natural gas exist in half of the 50 states, but the deposits in Alaska, Texas,Louisiana, New Mexico and Oklahoma make up approximately half of the known U.S. dry natu-ral gas proved reserves. See Figure i-3. Dry natural gas is almost entirely methane, with fewimpurities or other hydrocarbons.
i-4
Introduction
FIGURE i-2. 2003 U.S. CRUDE OIL PROVED RESERVES.Source: Energy Information Administration, U.S. Department of Energy. 15
With the recent boom in extraction of natural gas from coal beds (i.e., coalbed methane devel-opment), landowners should also be aware of the areas where coalbed methane developmentmay potentially occur. See Figures i-4 and i-5.
In most regions of the country where oil and gas reserves exist, the federal government hasplans to ramp up oil and gas production. For example, in New Mexico’s San Juan Basin thereare currently 18,000 producing wells, but the federal Bureau of Land Management (BLM) isproposing an additional 12,500 new wells to be drilled in one portion of the basin alone.17 InWyoming and Montana, the BLM is proposing that 77,000 new wells be drilled in the PowderRiver Basin.18
If you live in these regions, or other regions of proved reserves, you may have a visit from an oilor gas company representative in your future.
i-5
FIGURE i-3. 2003 U.S. DRY NATURAL GAS PROVED RESERVES.Source: Energy Information Administration, U.S. Department of Energy. 19
i-6
Introduction
BCF - billion cubic feet of methane
Uinta-Piceance (1801 BCF)
Greater Green River (162 BCF)
Cherokee (244 BCF)
Arkoma (280 BCF)
Warrior (1283 BCF)
Powder River (2239 BCF)
Raton (2448 BCF)
San Juan (8547 BCF)
Central Appalachian (1411 BCF)
FIGURE i-5. 2002 PROVED COALBED METHANE RESERVES.Source: Energy Information Administration, U.S. Department of Energy.21
FIGURE i-4. POTENTIAL COALBED METHANE BASINS IN THE UNITED STATES.Source: Interstate Oil and Gas Compact Commission. 20
When natural gas is produced from oil wells it is called associated gas, while natural gas andcondensate wells produce nonassociated gas. Approximately 35% of natural gas recovered inthe U.S. is associated with oil recovery.26
Sour gas is a highly undesirable type of gas to have produced near your property.27 It containshigh concentrations of hydrogen sulfide (H2S), which is toxic, potentially fatal at certain con-centrations, and has a vile odor, much like rotten eggs. If H2S dissolves in water, it forms a mildacid that can corrode pipes, valves, meters and other gas handling equipment. Sour gas is com-monly found in deep, hot, high pressure natural gas deposits such as the foothills of the RockyMountains in Alberta and northeastern British Columbia. In the United States, some productionof sour gas occurs in Michigan and Texas. H2S may also be associated with coalbed methaneextraction. In Colorado and New Mexico, there have been numerous complaints related to H2Scontamination of water wells and migration into homes following coalbed methane develop-ment.28 (For more information on sour gas, see the section on Impacts Associated with Oil andGas Operations.)
Not surprisingly, the oil and gas industry has focused most of its attention on the deposits thatare the easiest to find and extract, e.g., those in relatively shallow, highly porous rock forma-tions. These are known as conventional accumulations, and they tend to exist in localizeddeposits. Nonconventional (also known as unconventional) oil and gas deposits tend to occurover large geographic areas rather than in localized accumulations.
Historically, it was not possible to develop nonconventional deposits since the technology to do sodid not exist, or it was much too expensive to access and process the oil and gas. Over the pasttwo decades, however, improvements in technology have occurred largely as a result of govern-ment subsidies. As a result, nonconventional gas deposits have become a noticeable source oftotal U.S. domestic production.
The U.S. Energy Information Administration (EIA) predicts that natural gas production from non-conventional sources (tight sands, shale, and coalbed methane) is going to increase more rapidlythan conventional production in the U.S. The EIA predictions show nonconventional gas produc-tion from the lower 48 states growing from 6.6 trillion cubic feet (tcf) in 2003 (35% of natural gasproduction in lower 48) to 8.6 tcf in 2025 (44% of lower 48 natural gas production). Industryexperts expect a much faster growthin nonconventional gas production,predicting that more than 10 tcf willbe produced in 2005.29
This guide focuses primarily on thedevelopment of conventional oil andgas deposits. Recognizing, however,that development of nonconventionalresources is on the rise, Chapter 1includes a section on Development ofNonconventional Oil and Gas.
I-3
TERMS AND CONCEPTS
1990 1995 2003 2010 2015 2020 20250
2
4
6
8
10
Lower 48 NA
conventional
onshore
History Projections
Lower 48 AD
Alaska
Lower 48 NA
unconventional
Lower 48 NA
offshore
FIGURE I-1. NATURAL GAS PRODUCTION (CONVENTIONAL VS.UNCONVENTIONAL), 1990-2025. Note: AD stands for gas that isassociated (dissolved) with crude oil production. Energy InformationAdministration.29a
• Camps for workers may be set up on a surface owner’s property.
• If drilling does not produce a viable well, it is important to ensure that wells are properlyplugged, and the site satisfactorily reclaimed.
Air Emissions
• Drilling operations produce air emissions from diesel engines and turbines that power thedrilling equipment. The air pollutants from these devices may include: nitrogen oxides,particulates, volatile organic compounds, and carbon monoxide. Additionally, hydrogensulfide may be released during the drilling process.57
Wastes
• When improperly drilled or cased, or when the casing has corroded, wells can serve aspathways for contamination of aquifers.
• There are numerous wastes that are commonly associated with drilling. These include: pipedope, hydraulic fluids, used oils and oil filters, rigwash, spilled fuel, drill cuttings, drums andcontainers, spent and unused solvents, paint and paint wastes, sandblast media, scrapmetal, solid waste, and garbage.
• According to the American Petroleum Institute, approximately 146 million barrels of drillingwaste were produced in the U.S. 1995.58 Drilling fluids and drill cuttings are the largestsources of drilling wastes.59
Drilling Fluid/Mud
• Drilling fluids or muds are made up of a base fluid (water, diesel or mineral oil, or a syn-thetic compound); weighting agents (most frequently barite is used); bentonite clay to helpremove cuttings from the well and to form a filter cake on the walls of the hole; chromelignosulfonates and lignites to keep the mud in a fluid state; and various additives thatserve specific functions, such as biocides, diesel lubricants and chromate corrosioninhibitors.
• Whether the drilling muds are water-based, oil-based, or synthetic-based largely dependsupon the drilling conditions encountered.
• Water-based muds (WBMs) are used most frequently. They are the least expen-sive of the major types of drilling fluids. This is mainly because water-baseddrilling wastes are less toxic than the alternatives, and often can be dis-charged on site. For difficult drilling situations, such as wells drilled in reac-tive shales, deep wells, and horizontal and extended-reach wells, WBMsdo not offer consistently good drilling performance. For these types ofdrilling situations at onshore sites, the industry relies primarily on oil-basedmuds (OBMs).60
• Oil-based muds commonly are used while drilling deep wells, high-pressureshales, or during high-angle directional drilling because oil components(such as diesel or mineral oil) can avoid the pore-clogging that may occur withwater-based mud. The downside of OBMs is the high cost, as well as the cost ofdisposing of the oil-contaminated drill cuttings, which contain hazardous chemicals,e.g., polycyclic aromatic hydrocarbons (PAHs), which may cause cancer, organ damageand reproductive effects.61
• Since 1990, the oil and gas industry has been developing a number of synthetic-basedmuds (SBMs), which are less toxic than oil-based muds. Instead of diesel or mineral oils,SBMs use internal olefins, esters, linear alpha-olefins, poly alpha-olefins, and linear paraf-fins. SBMs are free of PAHs, which decreases the toxicity of these muds.62 Under certaincircumstances, SBMs are used in place of OBMs or WBMs.
• Muds usually contain bentonite clay and other additives. Bentonite is a very expansive soil
I-11
STAGES OF OIL & GAS DEVELOPMENT
FIGURE I-5. IMPROPERLYFENCED DRILLING MUDRESERVE PITPoses threat to wildlife andlivestock.
FIGURE I-6. DEWATEREDDRILLING MUDIs often buried on-site.
material. This may create a site with the potential for great soil volume change, and pos-sibly damage to surface structures. The common practice for disposing of drilling muds isto either bury the mud reserve pit, or discharge the mud to the surface. For landownerswho may want to build on what was previously a drill site, it is worth noting that in orderto be eligible for FHA mortgage insurance, all unstable and toxic materials must beremoved and the pit must be filled with compacted selected materials.63
• Wastes that may be associated with drilling fluid include oil derivatives (e.g., PAHs), spilledchemicals, and empty containers.64 Drilling muds that circulate through the well andreturn to the surface may contain dissolved and suspended contaminants including cad-mium, arsenic, and metals such as mercury, copper and lead; hydrocarbons; hydrogensulfide and natural gas,65 as well as drilling mud additives, many of which contain poten-tially harmful chemicals (e.g., chromate, barite).
Drill Cuttings
• The main toxic agents in drilling cuttings are oil and oil products. These accumulate in thesolid phase of drilling cuttings when crude oil and oil-based drilling fluids contact cuttingsduring the drilling process.66 Rock cuttings may also contain arsenic or metals dependingupon the geology.67
• Cuttings may be spilled around the well pad due to high pressures, dangerous working con-ditions, and lack of government oversight of drilling operations.68
• In West Virginia, the Department of Mines, Minerals and Energy (DMME) received com-plaints from residents about soap bubbles flowing from residential faucets. The DMMEattributed this to the drilling process associated with coalbed methane well installation.Soaps and other substances are used to extract drilling cuttings from the borehole becausethe foam expands and rises. As it rises, it carries the cuttings to the surface. During drillingof the shallow portion of the well (and before the required groundwater casing is cement-ed in place) these drilling fluids may migrate from the borehole into the groundwater zonethat supplies private wells. In the incidents of soap contamination in West Virginia, waterwas provided to the affected residents until the soaps were completely purged from thearea surrounding their water well.69
Waste Disposal
• Onshore oil production operations produce quantities of cuttings and mud ranging from60,000 to 300,000 gallons per day. Lined pits for disposal and storage are sometimesused, but mud, drill cuttings and other materials are often discharged into unlined pits,allowing potentially toxic substances to seep into the ground.70 If improperly fenced, thesepits can be a hazard for livestock and wildlife.
• While it is common for oil and gas companies to drain off fluids from drilling mud pits, it isvery common for companies to simply bury the remaining solids in place or spread them onthe lease site.71
Blowouts
• Well blowouts are rare, but can be extremely serious. Blowouts have been known to com-pletely destroy rigs and kill nearby workers. They are most likely to occur during drilling, butcan occur during any phase of well development including production (especially duringwell workover operations). If the pressure exerted by the geological formation is much high-er than that exerted by the drilling fluid, then the gas, oil or other fluids in the well may riseuncontrollably to the surface. Equipment that is within the well may also be thrust to thesurface. If there is a significant quantity of natural gas in the blowout materials, the fluidmay ignite from an engine spark or other source of flame. Some blowouts are controlled ina matter of days, but others have taken months to cap and control.72 The section on ImpactsAssociated with Oil and Gas Operations has more information on blowouts.
I-12
Oil and Gas Development and Impacts
Surface and Other Disturbances—Tips for Landowners
• Revegetation of the pad surface and pipeline rights-of-way with native grasses is one of thebest methods for controlling the spread of noxious weeds.73
• Lined pits or preferably tanks should be used to store spent mud, drill cuttings and solids,water used to wash any machinery, and surface runoff from the drilling area. These wastematerials should be transported to a proper disposal site.
• Pitless or closed-loop drilling, which does not require pits for disposal of drilling wastes, isan option that reduces the potential for soil and water contamination. More details on pit-less drilling are included in Alternative Technologies and Practices later in this chapter.
• Some traditional drilling fluid additives are toxic, but substitutes do exist: 1) replacement ofchrome lignosulfonate dispersants with chrome-free lignosulfonates and polysaccharidepolymers; 2) use of amines instead of pentachlorophenols and paraformaldehyde as bio-cides; 3) lubrication with mineral oil and lubra-beads instead of diesel oil.74
• Instead of disposing of drilling fluids in pits on-site, companies can use filtration processesto recondition the mud, so that it can be used for multiple wells before being discarded.Other possible uses for used drilling fluids include using it to plug unproductive wells or tospud in new wells.75
2. FIELD ORGANIZATION
This stage is primarily administrative, and usually involves government regulators. The purposeof field organization is to make the development of the oil or gas field more financially lucrativeby creating a system for efficiently extracting the oil and gas from a particular region or field.Well spacing, pooling, and unitization are examples of organizational techniques that areapplied during this stage.
It is during this stage of development that many citizens become involved because the impactsare broadly distributed over a geographic area (i.e., the oil or gas field), and governments oftenprovide the public with an opportunity to comment on how the development might occur.
Well SpacingThrough well testing and geologic analyses it is possible to estimate the volume of oil and gasin a particular reservoir that can be drained by a single well, and then estimate how many wellswill be needed to drain all of the oil or gas from the reservoir. Using these types of calculations,state governments determine how close together the wells need to be located (i.e., the well den-sity) to most efficiently and economically drain the reservoir. The state agencies then define thenumber of wells that can be drilled in a specified surface area (usually per acre). The area allo-cated by the state for the drilling of an oil or gas well is sometimes referred to as the drillingunit.
Typically, states enact spacing laws on a state-wide basis. States may also adopt different rulesfor particular fields.
• For example, in Colorado an operator can generally drill one well per 40 acres per forma-tion anywhere in the state, unless there is an existing field rule in place, like the Ignacio-Blanco field rule in Southwestern Colorado. As of May, 2005, the Ignacio-Blanco field ruleallows only one well to be drilled into the Fruitland Formation per every 160 acres.
Spacing rules apply to geological formations. That means if there are two or more formationsthat produce gas or oil in an area, then it is possible to end up with many more wells.
• For instance, in Southeast Colorado there are two major producing formations for coalbedmethane: the Vermejo and Raton formations. In that region, an operator is allowed to drill
I-13
STAGES OF OIL & GAS DEVELOPMENT
two wells per 40 acres – one well to access the methane in the Vermejo formation, and oneto access methane in the Raton formation. In that situation, however, the wells must belocated on the same pad unless the operator gets a variance or exception to the rule.
Spacing requirements vary drastically from state to state. For example, in California, wells canbe spaced as closely as one well per acre; while in Florida, gas wells are spaced at one well per640 acres.76 Shallow wells are usually spaced more closely together than deep wells. For moreinformation on spacing requirements, the Interstate Oil and Gas Compact Commission has pro-duced a summary of the various spacing requirements on a state-by-state basis.77
Well Spacing—Tips for Landowners
• Landowners should be aware that it is not uncommon for well spacing densities to changeover time. While the state sets the initial well density requirements for an area, it is commonfor companies to later request that the wells be more closely spaced together. When statesincrease the number of wells that can be located in an area, it is referred to as infilling ordownspacing. Landowners who buy land thinking that there will not be oil and gas develop-ment on their property (based on current well density regulations) may be shocked to find thata few years after buying property the spacing regulations have changed, and that there arewells proposed on their land. See the story “County officials say residents ignored,” in ChapterIV for an example of downspacing.
• Additionally, companies are sometimes exempted from the spacing requirements. A state’sspacing regulations usually mention the conditions under which a company may be exempt-ed from the spacing rules.
• Within the drilling unit, some states may designate a drilling window, which is an area withina drilling unit where wells may be drilled. The location of the drilling window is dependent ona number of factors. In many states, wells cannot be drilled within a certain distance ofhomes. So, if there are a number of homes within a drilling unit, there may be a limited num-ber of areas that can be used for drilling. In many states, however, it is not uncommon for com-
I-14
Oil and Gas Development and Impacts
Downspacing and PublicHealth and Safety Concerns
In the 30,000-acre Jonah conventional natural gas field inWyoming, industry hopes to use 20-acre well spacing (32 wellpads per section of land) instead of the current 40-acre spacing.The industry proposal would increase six-fold the number ofpermitted natural gas wells in the Jonah Field (from about 500to more than 3,000). If this were to occur, it is likely that airquality for the entire area would fail both national andWyoming ambient air-quality standards. Consequently, inorder to protect public health and safety, federal Bureau ofLand Management officials have been discussing closing allpublic roads into the Jonah Field and forbidding any huntingor discharge of firearms in the 30,000-acre area.
Photo at right shows Jonah Field with 40-acre spacing of gaswells.
Adapted from: Taylor, Meredith. Fall, 2003. “Industry Stakes its Claim tothe Upper Green’s Public Lands,”78 Photo credit: Image by SkyTruth for theUpper Green River Valley Coalition.
panies to apply for waivers, which allow them to drill outside the drilling window. Sometimesthe waiver requires that if drilling occurs at a surface location outside the drilling window, thecompany must still hit the targeted drilling window at a certain depth (e.g., by using direction-al or horizontal drilling techniques).
Mineral PoolingOften, mineral leases cover much smaller areas than the drilling units designated by the state.If this is the case, a company may pool two or more leases to create a tract that is sufficient insize to form a drilling unit for a single well.
• For example, in Colorado, an operator needs 40 acres to drill a well (unless there is a field-wide spacing rule in place). To obtain the 40 acres, the operator may have to lease min-erals from 4 contiguous mineral owners that each own 10 acres. In addition to acquiringa minimum of 40 acres, those 40 acres may have to be located in a particular area.Typically, the 40 acres represent a quarter-quarter section of land (to ensure that drillingoccurs in a uniform pattern of 4 wells per quarter section or 16 wells per section).
When mineral leases are pooled into a drilling unit, the mineral owners share proportionatelyin the proceeds from oil and gas production. For instance if you own 10 acres and are in a 40acre unit, your income will be figured as 1/4 of the unit’s production multiplied by your royaltyinterest.
Before a company can develop on a pooled unit, approval must be obtained from state agen-cies. It is sometimes the case that not all mineral owners within a drilling unit want to pool theirminerals to allow for oil and gas extraction. For example, they may want to wait until gas pricesare higher before they develop their minerals, or wait until technologies can be developed thatcause less impact on the surface property. Unfortunately, for mineral owners who want to resistdevelopment of oil and gas, many states have what are known as force pooling laws. Theselaws allow mineral properties to be pooled into a drilling unit and developed without the con-sent of all of the mineral owners.
Force pooling laws can be of assistance to mineral owners who are concerned that their oil andgas resources are being removed without any compensation. When companies drill for oil orgas on a particular property, they will usually drain the resources that are located adjacent tothat property. If mineral owners suspect that a well on a neighboring property is draining the oilor gas on their property, they can go to the state agencies (usually oil and gas boards or com-missions) and request that the company be forced to pool their minerals with their neighbor'sminerals, thereby allowing them their share of the profits.
Mineral Pooling—Tips for Mineral OwnersParticipate in pooling hearings. When a pooling application is filed by a company, a hearing isheld by the state to determine whether the pooled unit complies with the pertinent laws. Theseare the hearings that mineral and surface owners should attend if they want to protest the pool-ing terms. If mineral owners do nothing, they will be deemed to have accepted the termsapproved in the hearing.79
In many states, these hearings are not held in the mineral owner’s community, but rather, areheld in a larger city (often the state capital), which does not make it easy for mineral owners toparticipate. In Michigan, a bill was passed in 1998 that helped to lessen the burden on miner-al owners who were being force pooled by energy companies. This law moved the administra-tive hearings from the larger city to a community in the mineral owners’ region.80
If mineral owners have not yet leased their mineral rights, and they are approached by a com-pany about leasing, they are usually presented with three options.
I-15
STAGES OF OIL & GAS DEVELOPMENT
1. Negotiate and sign a lease and take the offered bonus and royalty interest.
2. Decide to not sign and likely be force pooled under terms established by the state.
3. Elect to participate in the well and pay their proportionate share of the drilling and com-pletion costs in order to receive their pro rata payout as a working interest owner.
It is important to look into the pooling laws in the state where your property is located, or talkwith a lawyer, in order to evaluate which of these options works best for you.
For more resources on force pooling, see references to East of Huajatolla Citizens Alliance infor-mation sheets in Chapter V. And for landowner experiences with force pooling, refer to ChapterIV stories: “Threats and Intimidation—This is Called Negotiation? Force Pooling an Affront”;“State Could Force Property Owners to Allow Drilling”; and Terry Fitzgerald’s story.
UnitizationUnitization is the process of bringing together a group of drilling units (see pooling above) toform a large operating area. Typically, there are several operators in the operating area.Unitization takes place through an order from a state agency, and participation by operatorsmay occur either voluntarily or involuntarily. Unitization orders may specify things such as wellspacing or extraction rates in order ensure that all operators are working together to efficientlyand effectively remove the oil or gas from the operating area. Unitization often occurs when anolder field's production has begun to decline and it is necessary to utilize secondary recoverypractices such as water or CO2 flooding techniques to stimulate more production. As a result of
a compulsory unitization statute for oil and gas reservoirs, Louisiana's oil and gas wells are, onaverage, one-third more productive than those in Texas, which does not require unitization.81
For more information on spacing, pooling and unitization (including federal units), visit theOGAP website (www.ogap.org).
3. PRODUCTION
The first step in production is to complete the well and start the well fluids flowing to the sur-face. Stimulation techniques may be used to enhance the flow of fluids during well completion.Once the fluid begins flowing, it must be separated into its components of oil, gas, and water.Finally, the oil and gas are treated, measured, and tested before being transported to the refin-ery. In addition to extracting and transporting the oil and gas, other tasks carried out during theproduction stage include: production enhancement, which uses techniques similar to thoseused to stimulate wells; well servicing, which includes routine maintenance operations suchreplacing worn or malfunctioning equipment; and well workover, which is more extensive equip-ment repair.
Well CompletionTo begin completing a well, casing material (usually steel pipe) is inserted into the well bore. Aswith the casing used during the drilling stage, the casing material is supposed to prevent the oilor gas from contaminating groundwater, and stop the walls of the hole from collapsing. Cementis pumped down the casing to fill the space between the casing and the walls of the drilled hole.This is done to protect the casing and to further decrease movement of oil, gas or other fluidsinto ground water or rock formations.
When cementing of the casing is completed, the drilling rig and other associated equipment areremoved from the site, and a smaller rig (a workover or completion rig) is moved over the wellbore to finish the well completion. This rig is used to puncture or perforate the casing at spe-cific locations where the casing comes in contact with the formations that contain oil or gas.The oil and gas can then enter the well through these perforations.
I-16
Oil and Gas Development and Impacts
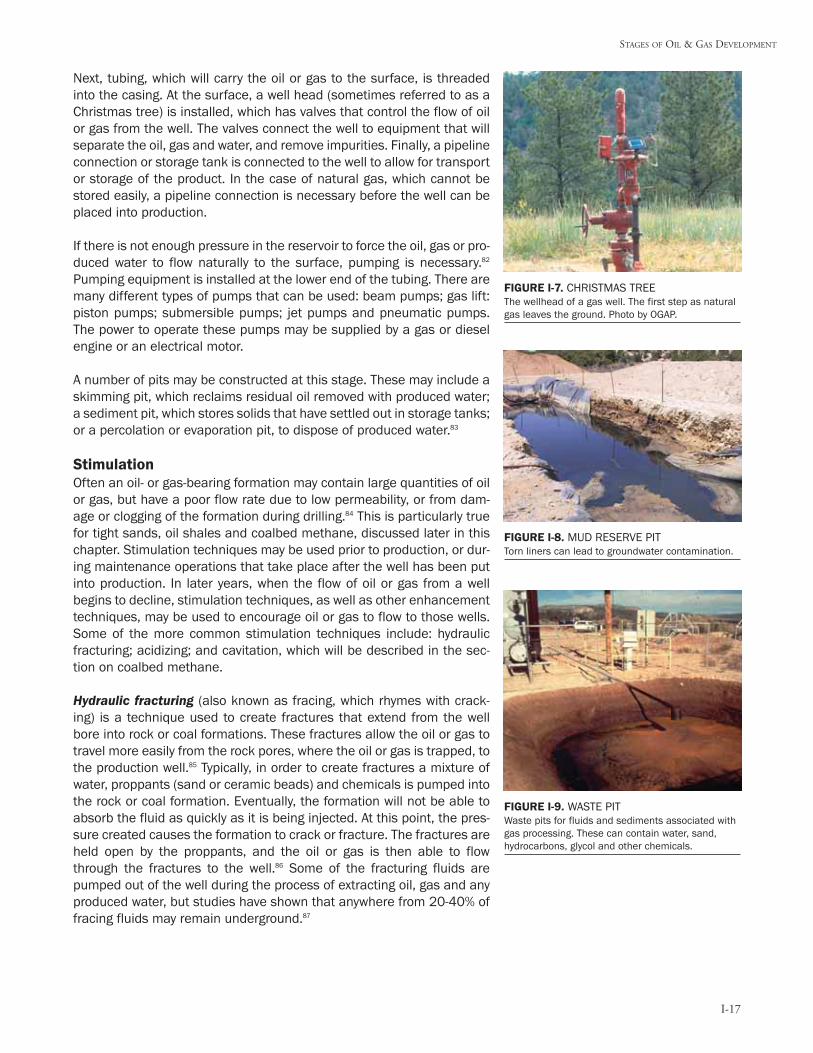
Next, tubing, which will carry the oil or gas to the surface, is threadedinto the casing. At the surface, a well head (sometimes referred to as aChristmas tree) is installed, which has valves that control the flow of oilor gas from the well. The valves connect the well to equipment that willseparate the oil, gas and water, and remove impurities. Finally, a pipelineconnection or storage tank is connected to the well to allow for transportor storage of the product. In the case of natural gas, which cannot bestored easily, a pipeline connection is necessary before the well can beplaced into production.
If there is not enough pressure in the reservoir to force the oil, gas or pro-duced water to flow naturally to the surface, pumping is necessary.82
Pumping equipment is installed at the lower end of the tubing. There aremany different types of pumps that can be used: beam pumps; gas lift:piston pumps; submersible pumps; jet pumps and pneumatic pumps.The power to operate these pumps may be supplied by a gas or dieselengine or an electrical motor.
A number of pits may be constructed at this stage. These may include askimming pit, which reclaims residual oil removed with produced water;a sediment pit, which stores solids that have settled out in storage tanks;or a percolation or evaporation pit, to dispose of produced water.83
StimulationOften an oil- or gas-bearing formation may contain large quantities of oilor gas, but have a poor flow rate due to low permeability, or from dam-age or clogging of the formation during drilling.84 This is particularly truefor tight sands, oil shales and coalbed methane, discussed later in thischapter. Stimulation techniques may be used prior to production, or dur-ing maintenance operations that take place after the well has been putinto production. In later years, when the flow of oil or gas from a wellbegins to decline, stimulation techniques, as well as other enhancementtechniques, may be used to encourage oil or gas to flow to those wells.Some of the more common stimulation techniques include: hydraulicfracturing; acidizing; and cavitation, which will be described in the sec-tion on coalbed methane.
Hydraulic fracturing (also known as fracing, which rhymes with crack-ing) is a technique used to create fractures that extend from the wellbore into rock or coal formations. These fractures allow the oil or gas totravel more easily from the rock pores, where the oil or gas is trapped, tothe production well.85 Typically, in order to create fractures a mixture ofwater, proppants (sand or ceramic beads) and chemicals is pumped intothe rock or coal formation. Eventually, the formation will not be able toabsorb the fluid as quickly as it is being injected. At this point, the pres-sure created causes the formation to crack or fracture. The fractures areheld open by the proppants, and the oil or gas is then able to flowthrough the fractures to the well.86 Some of the fracturing fluids arepumped out of the well during the process of extracting oil, gas and anyproduced water, but studies have shown that anywhere from 20-40% offracing fluids may remain underground.87
I-17
STAGES OF OIL & GAS DEVELOPMENT
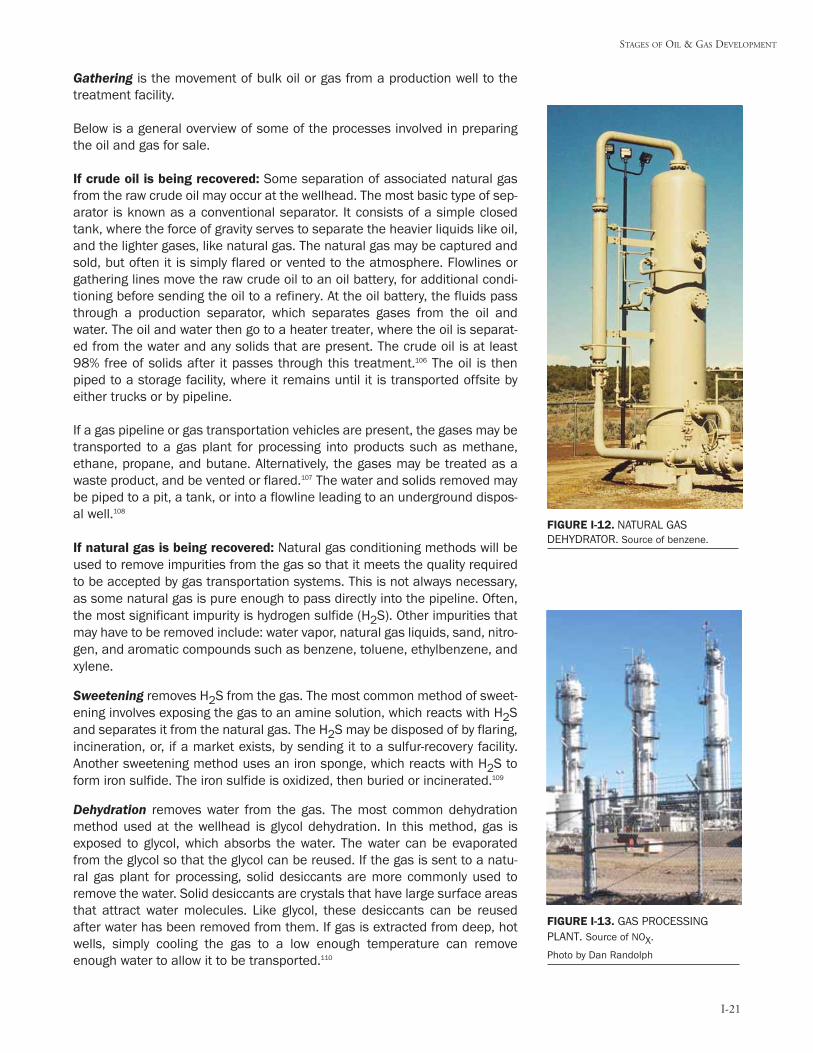
FIGURE I-8. MUD RESERVE PITTorn liners can lead to groundwater contamination.
FIGURE I-7. CHRISTMAS TREE The wellhead of a gas well. The first step as naturalgas leaves the ground. Photo by OGAP.
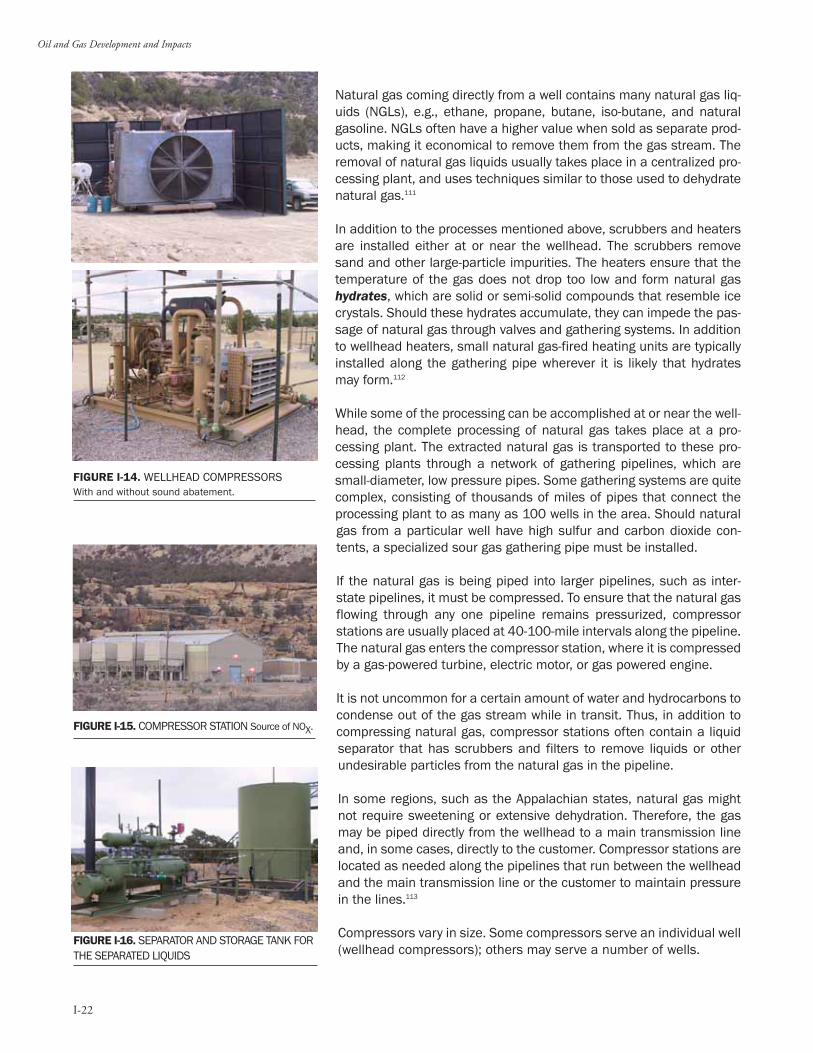
FIGURE I-9. WASTE PITWaste pits for fluids and sediments associated withgas processing. These can contain water, sand,hydrocarbons, glycol and other chemicals.
Acidizing involves pumping acid (usually hydrochloric acid), into the formation. The acid dis-solves some of the rock material so that the rock pores open and fluid flows more quickly intothe well. Fracing and acidizing are sometimes performed simultaneously, in an acid fracturetreatment.88
Stimulation—Issues and ImpactsPotential Groundwater Contamination—Coalbed fracture treatments use anywhere from50,000 to 350,000 gallons of various stimulation and fracturing fluids, and from 75,000 to320,000 pounds of proppant during the hydraulic fracturing of a single well.89 Many fracturingfluids contain chemicals that can be toxic to humans and wildlife, and chemicals that are knownto cause cancer. These include potentially toxic substances such as diesel fuel, which containsbenzene, ethylbenzene, toluene, xylene, naphthalene and other chemicals; polycyclic aromatichydrocarbons; methanol; formaldehyde; ethylene glycol; glycol ethers; hydrochloric acid; andsodium hydroxide.90 Very small quantities of chemicals such as benzene, which causes cancer,are capable of contaminating millions of gallons of water.
As mentioned previously, hydraulic fracturing is used in many coalbedmethane (CBM) production areas. Some coal beds contain groundwaterof high enough quality to be considered underground sources of drink-ing water (USDWs). According to the U.S. Environmental ProtectionAgency (EPA) ten out of eleven CBM basins in the U.S. are located, atleast in part, within USDWs. Furthermore, EPA has determined that insome cases, hydraulic fracturing chemicals are injected directly intoUSDWs during the course of normal fracturing operations.91
Calculations performed by EPA show that at least nine hydraulic fractur-ing chemicals may be injected into or close to USDWs at concentrationsthat pose a threat to human health. These chemicals may be injected atconcentrations that are anywhere from 4 to almost 13,000 times theacceptable concentration in drinking water.92 (See Peggy Hocutt’s letterand Laura Amos’ story in Chapter IV, to read landowner stories abouthow hydraulic fracturing of coalbeds and other geological formations hasaffected drinking water.)
Not only does the injection of these chemicals pose a short-term threat to drinking water quali-ty, it is quite possible that there could be long-term negative consequences for USDWs fromthese fracturing fluids. According to the EPA study, and studies conducted by the oil and gasindustry,93 between 20 and 40% of the fracturing fluids may remain in the formation, whichmeans the fluids could continue to be a source of groundwater contamination for years to come.
The potential long-term consequences of dewatering and hydraulic fracturing on waterresources have been summed up by professional hydrogeologist who spent 32 years with theU.S. Geological Survey:
At greatest risk of contamination are the coalbed aquifers currently used as sources ofdrinking water. For example, in the Powder River Basin (PRB) the coalbeds are the bestaquifers. CBM production in the PRB will destroy most of these water wells; BLM predictsdrawdowns...that will render the water wells in the coal unusable because the water levelswill drop 600 to 800 feet. The CBM production in the PRB is predicted to be largely over bythe year 2020. By the year 2060 water levels in the coalbeds are predicted to have recov-ered to within 95% of their current levels; the coalbeds will again become useful aquifers.However, contamination associated with hydrofracturing in the basin could threaten theusefulness of the aquifers for future use.94
Oil and Gas Development and Impacts
I-18
FIGURE I-10. FRAC PITUnlined pits may allow toxic fracing fluids to seep intosoil and contaminate groundwater.
One potentially frustrating issue for surface owners is that it may not be easy to find out whatchemicals are being used during the hydraulic fracturing operations in your neighborhood.According to the Natural Resources Defense Council, attempts by various environmental andranching advocacy organizations to obtain chemical compositions of hydraulic fracturing fluidshave not been successful because oil and gas companies refuse to reveal this “proprietaryinformation.”95
As mentioned above, anywhere from 20-40% of fracing fluids remain in the ground. Some frac-turing gels remain stranded in the formation, even when companies have tried to flush out thegels using water and strong acids.96 Also, studies show that gelling agents in hydraulic fractur-ing fluids decrease the permeability of coals, which is the opposite of what hydraulic fracturingis supposed to do (i.e., increase the permeability of the coal formations). Other similar, unwant-ed side effects from water- and chemical-based fracturing include: solids plugging up thecracks; water retention in the formation; and chemical reactions between the formation miner-als and stimulation fluids. All of these cause a reduction in the permeability in the geologicalformations.97
From a public health perspective, if hydraulic fracturing stimulation takes place, the best optionis to fracture formations using sand and water without any additives, or sand and water withnon-toxic additives. Non-toxic additives are being used by the offshore oil and gas industry,which has had to develop fracturing fluids that are non-toxic to marine organisms.98
STAGES OF OIL & GAS DEVELOPMENT
I-19
FIGURE I-11. DIAGRAM OF HYDRAULIC FRACTURING OPERATION.Source: Petroleum Communication Foundation. (Canadian Centre for Energy Information). 1999.99
High-pressure fluid creates cracks extending 300 metres (990 feet) or more intothe producing formation. Sand props open the cracks, which are typically five toten metres high but only two to six millimetres wide (0.078 to 0.236 inches).
It is common to use diesel in hydraulic fracturing fluids. This should be avoided, since dieselcontains the carcinogen benzene, as well as other harmful chemicals such as naphthalene,toluene, ethylbenzene and xylene. According to the company Halliburton, “Diesel does notenhance the efficiency of the fracturing fluid; it is merely a component of the delivery sys-tem.”100 It is technologically feasible to replace diesel with non-toxic “delivery systems,” such asplain water. According to the EPA, “Water-based alternatives exist and from an environmentalperspective, these water-based products are preferable.”101
Stimulation—Tip for LandownersThe law requires that all employees have access to a Material Safety Data Sheet (MSDS), whichcontains information on health hazards, chemical ingredients, physical characteristics, controlmeasures, and special handling procedures for all hazardous substances in the work area. TheMSDSs are produced and distributed by the chemical manufacturers and distributors. It shouldbe noted that MSDSs may not list all of the chemicals or chemical constituents being used (ifthey are trade secrets).102 Landowners may be able to obtain copies of MSDSs from companyemployees, the chemical manufacturers, or possibly from state agency representatives.
For more information on impacts associated with hydraulic fracturing, and alternative fractur-ing techniques, please visit the Oil and Gas Accountability web site: http://www.ogap.org .
Well TestingAfter the well has been drilled, and before production begins, the reservoir pressure is tested.Prior to testing, however, large volumes of debris, fluids and gases must be cleaned out of thewell bore. For example, any fluid, rock debris and sand remaining in the well bore and sur-rounding reservoir from stimulation activities (e.g., cavitation or hydraulic fracturing) has to becleaned out. The conventional method for doing this is to pump air down the well bore to lift thesand and fracturing fluid up and out.103 These wastes are usually dumped into earthen pits.
Natural gas is mixed in with the air, sand and liquids exiting the well bore. These gases areeither “blown off” (i.e., vented to the atmosphere) or “burned off” (i.e., flared).
During the well test, the gas in a newly drilled well is allowed to flow freely for a number of dayswhile the rate-of-flow and pressure of the gas in the reservoir are measured. According to thePembina Institute for Appropriate Development, “a company can normally get enough data inone to three days, [therefore] well testing should be minimized and not exceed three days, espe-cially when there is flaring or direct venting to the atmosphere.”104
Well Testing—Tips for Landowners
• To minimize potential environmental impacts from the storage of solid and liquid wastesthat flow from the well, “flowback units” rather than earthen pits should be used. Also,“flareless completions” or “green completion” techniques can be used to minimize the airpollution from the venting or flaring of natural gas during the well clean-up and testingphases.
• For more information on both of these technologies, see the section on AlternativeTechnologies and Practices, later in this chapter.
Oil and Gas Treatment and ConditioningThe fluids that flow or are pumped to the surface from conventional oil or gas wells include amixture of oil, water, various gases and dissolved and suspended solids.105 Before oil and natu-ral gas can be marketed, the fluids must go through a treatment process to separate out waterand remove dangerous gases and other impurities. Some of the treatment can occur at the wellsite (field processing). After initial treatment, however, the crude oil or natural gas is sentthrough a pipeline to a centralized processing facility such as an oil battery or a gas plant.
I-20
Oil and Gas Development and Impacts
Gathering is the movement of bulk oil or gas from a production well to thetreatment facility.
Below is a general overview of some of the processes involved in preparingthe oil and gas for sale.
If crude oil is being recovered: Some separation of associated natural gasfrom the raw crude oil may occur at the wellhead. The most basic type of sep-arator is known as a conventional separator. It consists of a simple closedtank, where the force of gravity serves to separate the heavier liquids like oil,and the lighter gases, like natural gas. The natural gas may be captured andsold, but often it is simply flared or vented to the atmosphere. Flowlines orgathering lines move the raw crude oil to an oil battery, for additional condi-tioning before sending the oil to a refinery. At the oil battery, the fluids passthrough a production separator, which separates gases from the oil andwater. The oil and water then go to a heater treater, where the oil is separat-ed from the water and any solids that are present. The crude oil is at least98% free of solids after it passes through this treatment.106 The oil is thenpiped to a storage facility, where it remains until it is transported offsite byeither trucks or by pipeline.
If a gas pipeline or gas transportation vehicles are present, the gases may betransported to a gas plant for processing into products such as methane,ethane, propane, and butane. Alternatively, the gases may be treated as awaste product, and be vented or flared.107 The water and solids removed maybe piped to a pit, a tank, or into a flowline leading to an underground dispos-al well.108
If natural gas is being recovered: Natural gas conditioning methods will beused to remove impurities from the gas so that it meets the quality requiredto be accepted by gas transportation systems. This is not always necessary,as some natural gas is pure enough to pass directly into the pipeline. Often,the most significant impurity is hydrogen sulfide (H2S). Other impurities thatmay have to be removed include: water vapor, natural gas liquids, sand, nitro-gen, and aromatic compounds such as benzene, toluene, ethylbenzene, andxylene.
Sweetening removes H2S from the gas. The most common method of sweet-ening involves exposing the gas to an amine solution, which reacts with H2Sand separates it from the natural gas. The H2S may be disposed of by flaring,incineration, or, if a market exists, by sending it to a sulfur-recovery facility.Another sweetening method uses an iron sponge, which reacts with H2S toform iron sulfide. The iron sulfide is oxidized, then buried or incinerated.109
Dehydration removes water from the gas. The most common dehydrationmethod used at the wellhead is glycol dehydration. In this method, gas isexposed to glycol, which absorbs the water. The water can be evaporatedfrom the glycol so that the glycol can be reused. If the gas is sent to a natu-ral gas plant for processing, solid desiccants are more commonly used toremove the water. Solid desiccants are crystals that have large surface areasthat attract water molecules. Like glycol, these desiccants can be reusedafter water has been removed from them. If gas is extracted from deep, hotwells, simply cooling the gas to a low enough temperature can removeenough water to allow it to be transported.110
STAGES OF OIL & GAS DEVELOPMENT
FIGURE I-12. NATURAL GAS DEHYDRATOR. Source of benzene.
FIGURE I-13. GAS PROCESSINGPLANT. Source of NOX.
Photo by Dan Randolph
I-21
Natural gas coming directly from a well contains many natural gas liq-uids (NGLs), e.g., ethane, propane, butane, iso-butane, and naturalgasoline. NGLs often have a higher value when sold as separate prod-ucts, making it economical to remove them from the gas stream. Theremoval of natural gas liquids usually takes place in a centralized pro-cessing plant, and uses techniques similar to those used to dehydratenatural gas.111
In addition to the processes mentioned above, scrubbers and heatersare installed either at or near the wellhead. The scrubbers removesand and other large-particle impurities. The heaters ensure that thetemperature of the gas does not drop too low and form natural gashydrates, which are solid or semi-solid compounds that resemble icecrystals. Should these hydrates accumulate, they can impede the pas-sage of natural gas through valves and gathering systems. In additionto wellhead heaters, small natural gas-fired heating units are typicallyinstalled along the gathering pipe wherever it is likely that hydratesmay form.112
While some of the processing can be accomplished at or near the well-head, the complete processing of natural gas takes place at a pro-cessing plant. The extracted natural gas is transported to these pro-cessing plants through a network of gathering pipelines, which aresmall-diameter, low pressure pipes. Some gathering systems are quitecomplex, consisting of thousands of miles of pipes that connect theprocessing plant to as many as 100 wells in the area. Should naturalgas from a particular well have high sulfur and carbon dioxide con-tents, a specialized sour gas gathering pipe must be installed.
If the natural gas is being piped into larger pipelines, such as inter-state pipelines, it must be compressed. To ensure that the natural gasflowing through any one pipeline remains pressurized, compressorstations are usually placed at 40-100-mile intervals along the pipeline.The natural gas enters the compressor station, where it is compressedby a gas-powered turbine, electric motor, or gas powered engine.
It is not uncommon for a certain amount of water and hydrocarbons tocondense out of the gas stream while in transit. Thus, in addition tocompressing natural gas, compressor stations often contain a liquidseparator that has scrubbers and filters to remove liquids or otherundesirable particles from the natural gas in the pipeline.
In some regions, such as the Appalachian states, natural gas mightnot require sweetening or extensive dehydration. Therefore, the gasmay be piped directly from the wellhead to a main transmission lineand, in some cases, directly to the customer. Compressor stations arelocated as needed along the pipelines that run between the wellheadand the main transmission line or the customer to maintain pressurein the lines.113
Compressors vary in size. Some compressors serve an individual well(wellhead compressors); others may serve a number of wells.
I-22
Oil and Gas Development and Impacts
FIGURE I-16. SEPARATOR AND STORAGE TANK FORTHE SEPARATED LIQUIDS
FIGURE I-15. COMPRESSOR STATION Source of NOX.
FIGURE I-14. WELLHEAD COMPRESSORSWith and without sound abatement.
Plugging WellsBefore a company permanently leaves a well site, the well should be plugged or capped. Thepurpose of plugging is to prevent formation water from migrating into and contaminatingaquifers or surface water.
All oil and gas producing states have specific regulations governing the plugging and abandon-ment of wells.140 Generally, however, when a well is plugged there are a number of steps thatare taken. First, the downhole equipment is removed and the perforated sections of the wellbore are cleaned of scale and other wastes. Then, a minimum of three cement plugs, eachbetween 100-200 feet in length, are placed into the well. Plugs should be placed: 1) into theperforated zones of the well, in order to prevent the inflow of fluid; 2) in the middle of the well-bore; and 3) within a couple hundred feet of the surface. Also, fluid with an appropriate densi-ty is placed between the cement plugs in order to maintain adequate pressure in the voids.Finally, the casing is cut off below the surface and capped with a steel plate welded to the cas-ing. Surface reclamation should then be undertaken to restore natural soil consistency andplant cover.
Conversion to an Injection WellIf the well is located in an area where a company has many nearby wells still in production,the company may decide to convert the well to an injection well. If this occurs, the well will beregulated by the federal government as an Underground Injection Control (UIC) Class IIInjection well, and will be subject to the federal Safe Drinking Water Act and UndergroundInjection Control Regulations.141 Such a well can be used either for disposal of the producedwater from other wells, or as part of oil enhancement operations in the production field.
ReclamationFederal, state, and sometimes local rules and regulations describe how reclamation is sup-posed to occur when a site is abandoned. In some states, companies are required to providefinancial assurance (e.g., bonds) to ensure that some funds are available to plug the wells andcarry out the reclamation activities. Reclamation clauses in surface use agreements negotiat-ed during the early stages also come into play at this stage.
Full reclamation should leave the land, air and water in the same condition as before oil andgas development was carried out. This is rarely the case. In many states, the unwillingness ofcompanies to completely restore the original environment is accepted by state governments.Consequently, operators are required only to reclaim the land “as nearly as is possible” to it pre-development condition.
I-29
STAGES OF OIL & GAS DEVELOPMENT
FIGURE I-22. LEFT-RIGHT: PLUGGED WELL, NOT RECLAIMED. PLUGGED WELL, RECLAIMED. Photo at rightused with permission of Vermejo Park Ranches.
Reclamation activities typically include: removal of all well-related equipment; re-grading ofroads and other surfaces; removal of trash and debris; road closures; closure and remediationof pits and contaminated soils; and site revegetation. While this stage appears at the end of thedevelopment process, there are interim reclamation activities that can and often must be per-formed by operators at other stages of development. An example of interim or “annual” recla-mation requirements can be found in the Vermejo Park Ranch Mineral Extraction Agreement inChapter III.
SITE ABANDONMENT—ISSUES AND IMPACTS
Orphaned and Idle WellsSurface owners should be aware that as a well becomes less and less profitable, some largercompanies will sell these wells to smaller companies. Eventually, these wells may become theresponsibility of the state, for example, if the smaller company does not have the funding toproperly plug the wells and reclaim the site. If a company goes bankrupt and has no assetsavailable to be used for proper well abandonment the well is considered to be an orphan well.142
The term orphan well also applies to the situation where the operator is unknown (e.g., in thecase of wells drilled in the early part of the century).
Idle wells are wells that have ceased production but have not been plugged. In most states,wells require regulatory approval to be idle.143 Most states allow some period of time of inactiv-ity (usually six months to one year) without approval. When this initial time has elapsed, statesmay require a statement of the operator’s intentions, which may include extensive geologicaland engineering information and a schedule for returning the well to production.144 Also, a statemay require periodical mechanical integrity tests to ensure that the well does not pose a threatto the environment.145
• In 1995, there were 134,000 wells in the U.S. that had stopped production yet had neitherbeen plugged nor received government approval to be idle.146
• Orphan wells and idle wells that do not have government approval may present a ground-water contamination hazard. With many of these wells, the integrity of the casing is notknown, and so there is a possibility that reservoir fluids or gases are contaminating or willcontaminate nearby fresh water aquifers. Not all wells will cause contamination, but untilthe wells are evaluated, the risk that they pose is unknown.
• Most oil- and gas-producing states have a program for addressing orphan wells, whichincludes: prioritizing wells (because states do not have the funding to assess and properlyplug all orphan wells); programs to plug dangerous orphan wells; and clean up of any con-tamination that may have already occurred.
• There is no guarantee that a state will have adequate funding to properly plug and reclaimorphan sites; leaving the surface owner with concerns about long-term risk of contamina-tion. See “Bankrupt companies walk away from oil wells in Texas,” Chapter II.
• One source of information that can help inform state regulators of the risks posed byorphan or idle wells comes from area of review (AOR) studies that are required for theapproval of new underground injection wells. Under this requirement, the operator of thenew well must study all active, idle and abandoned wells within an area (often a ¼ mileradius) to determine whether they pose a risk of contamination.147
Improperly Plugged and Abandoned Wells
• Improperly completed and abandoned wells may allow contaminants such as pesticides tobe transferred from the surface to groundwater.
I-30
Oil and Gas Development and Impacts
• Oil, gas, and salt water can leak from abandoned, unplugged, or improperly plugged oil andgas wells, especially older wells, and pollute groundwater resources,148 or migrate to the sur-face. In Colorado, Oil and Gas Conservation Commission (COGCC) staff believe thatincreased methane concentrations found in water wells and buildings in some areas arepartially due to old, improperly abandoned gas wells and older, deeper conventional gas wells that were not completely isolated. According to COGCC officials, a mitigation programfocused on sealing old, improperly abandoned gas wells appears to have reduced methaneconcentrations in approximately 27 percent of the water wells sampled.149
• Additionally, improperly closed sites can be a safety hazard to humans and livestock.
Tips for Landowners
• Surface owners should work with state agencies to ensure that abandonment is satisfac-torily completed.
• Owners may want to consider pressuring companies to use native species in their re-seed-ing projects, as these may be better able to combat noxious weed species.
• The company should have saved topsoil during the drilling and production stages for use intheir reclamation efforts.
• Almost all states require companies to set aside funds to properly plug and abandon theirwells. There is more information on financial assurance (or bonding) in Chapter II.
I-31
STAGES OF OIL & GAS DEVELOPMENT
Ideally, full reclamationshould leave vegetation,soil, air and water in thesame condition thatexisted prior to oil andgas development.Thisrarely occurs.
Development of Nonconventional Gas and Oil
Forward-thinking landowners may want to investigate the possibility of unconventional reser-voirs beneath their land, since it is likely that more non-conventional oil and gas deposits willbe developed in the near future. This is certainly happening with the nonconventional coalbedmethane gas deposits.
Nonconventional gas includes gas trapped in coal formations (coalbed methane); and low-per-meability sandstone (tight sands) and shale formations (gas shales). These three types of natu-ral gas are currently being exploited in some areas of the U.S., and will be discussed in this sec-tion. Other nonconventional natural gas resources, such as gas hydrates, are not likely to becomecommercially viable for decades to come.150 Consequently, they will not be discussed in this guide.
Nonconventional oil deposits include heavy oils, tar sands and oil shales. As mentioned previ-ously, petroleum is a broad term for hydrocarbons that includes gases, highly fluid “light” oils,viscous “heavy” oils, tars and bitumens. Today, light oils comprise approximately 95 % of petro-leum production.151 As will be discussed later in this section, when compared to conventionaldeposits and methods, the amount of work required to produce an equivalent amount of crudeoil from tar sands or oil shales makes it cost prohibitive under most circumstances.152
COALBED METHANE (CBM)
As many landowners in Wyoming, Montana, Colorado, New Mexico and Alabama can attest, anincreasingly significant source of natural gas is coalbed methane (see the Introduction chapterfor a map of CBM producing areas). Two decades ago, coalbed methane was not a highly prof-itable source of natural gas. By the year 2004, however, CBM accounted for more than 8% ofnatural gas production in the U.S.153
According to the CBM Association of Alabama, 13% of the land in the lower 48 United Stateshas some coal under it, and in all coal deposits methane is found as a byproduct of the coalformation process. Historically, this methane was considered a safety hazard in the coal miningprocess and was purposely vented to the atmosphere. Recently, however, companies havebegun to capture the methane found in coal mines, as well as recover methane from coalbeddeposits that are too deep to mine.154
Coal beds are an attractive prospect for development because of their ability to retain largeamounts of gas—coal is able to store six to seven times more gas than an equivalent volume ofrock common to conventional gas reservoirs.155 On a daily basis, however, CBM wells typicallydo not produce as much gas as conventional wells.156 In most regions of the U.S., coalbedmethane wells produce between 100 and 500 thousand cubic feet (Mcf) per day, while theaverage conventional well in the lower 48 states produces approximately 1.7 million cubic feet(MMcf) per day.157 There are, however, some extremely productive coalbed methane areas, suchas the San Juan basin in Colorado and New Mexico, where some wells produce up to 3 MMcfof methane per day.158
The amount of methane in a coal deposit depends on the quality and depth of the deposit. Ingeneral, the higher the energy value of the coal159 and the deeper the coal bed, the moremethane in the deposit.160
Methane is loosely bound to coal—held in place by the water in the coal deposits. The water con-tributes pressure that keeps methane gas attached to the coal. In CBM development, water isremoved from the coal bed (by pumping), which decreases the pressure on the gas and allowsit to detach from the coal and flow up the well.
I-32
Oil and Gas Development and Impacts
In the initial production stage of coalbed methane, the wells produce mostly water. Eventually,as the coal beds near the pumping well are dewatered, the volume of pumped water decreas-es and the production of gas increases.161 Depending on the geological conditions, it may takeseveral years to achieve full-scale gas production. Generally, the deeper the coal bed the lesswater present, and the sooner the well will begin to produce gas.
Water removed from coal beds is known as produced water. The amount of water producedfrom most CBM wells is relatively high compared to conventional gas wells because coal bedscontain many fractures and pores that can contain and move large volumes of water.162
CBM wells are drilled with techniques similar to those used for conventional wells. In someregions where the coal beds are shallow, smaller, less expensive rigs, such as modified water-well drilling rigs, can be used to drill CBM wells, rather than the more expensive, specialized oiland gas drilling rigs.163
As with conventional gas wells, hydraulic fracturing is used as a primary means of stimulatinggas flow in CBM wells.164 Another gas stimulation technique, unique to CBM wells, is known ascavitation (also known as open-hole cavity completion).
Cavitation is a similar phenomenon to opening a shaken pop bottle, only on a much largerscale.165 Water, and air or foam are pumped into the well to increase the pressure in the reser-voir. Shortly thereafter, the pressure is suddenly released, and the well violently blows out, spew-ing gas, water, coal and rock fragments out of the well. This action is sometimes referred to as“surging,” and it is accompanied by a jet engine-like noise, which can last up to 15 minutes.166
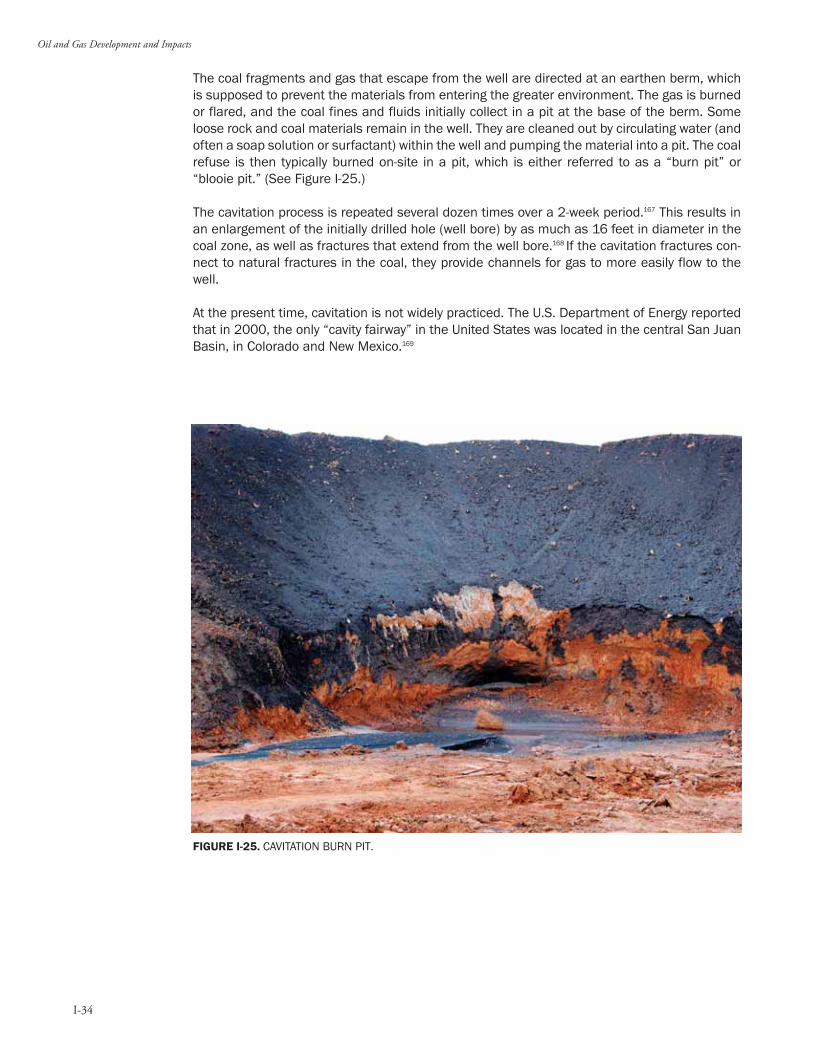
The coal fragments and gas that escape from the well are directed at an earthen berm, whichis supposed to prevent the materials from entering the greater environment. The gas is burnedor flared, and the coal fines and fluids initially collect in a pit at the base of the berm. Someloose rock and coal materials remain in the well. They are cleaned out by circulating water (andoften a soap solution or surfactant) within the well and pumping the material into a pit. The coalrefuse is then typically burned on-site in a pit, which is either referred to as a “burn pit” or“blooie pit.” (See Figure I-25.)
The cavitation process is repeated several dozen times over a 2-week period.167 This results inan enlargement of the initially drilled hole (well bore) by as much as 16 feet in diameter in thecoal zone, as well as fractures that extend from the well bore.168 If the cavitation fractures con-nect to natural fractures in the coal, they provide channels for gas to more easily flow to thewell.
At the present time, cavitation is not widely practiced. The U.S. Department of Energy reportedthat in 2000, the only “cavity fairway” in the United States was located in the central San JuanBasin, in Colorado and New Mexico.169
I-34
Oil and Gas Development and Impacts
FIGURE I-25. CAVITATION BURN PIT.
A decline in quality of life may result from: economic issues that arise from energy develop-ment (e.g., decline in property values; attorney fees related to negotiations with companies);noise; water well depletion or loss; degradation of water quality; land disturbance and soil ero-sion; vegetation die-off; the presence of industrial facilities (unsightly buildings and odors);damage to roads; and traffic congestion.
Several of these issues are addressed in more detail below.
The following information on housing, crime, roads, and dust emissions related to coalbedmethane (CBM) development comes from a study conducted in Wyoming. As part of theWyoming Energy Commission Community Outreach Program, the Commission contracted witha consultant, Pedersen Planning Consultants, to perform community assessments related toCBM development in six counties – Campbell, Sheridan, Johnson, Sweetwater, Converse andCarbon.216 The information below reflects insights and recommendations from various commu-nity leaders.
HousingSince 1998, the coalbed methane boom in Campbell, Sheridan and Johnson counties hasincreased housing costs and decreased availability of rental apartments and homes to pur-chase. The lack of housing frustrates workers who are working 12-hour shifts, as they have lit-tle time to make an extensive search for housing. Increased housing costs have increased theoverall cost of living for most households in Campbell County. Law enforcement representativespoint out that these stresses have contributed to more petty theft, domestic violence, and othercriminal behavior.
CrimeCampbell County has experienced an increase in larceny, destruction of private property, fami-ly violence, and child abuse since CBM development came to the county. The heavy amount ofshift work has resulted in children being left at home unsupervised. Other crimes are attributedto alcohol and drug problems, which are linked, in part, to the increase in CBM development –as more people in the community earn more income, greater drug usage occurs. Ninety-ninepercent of all crimes in Johnson County tie back to drug or alcohol abuse. Police from the Cityof Gillette report that methamphetamines are a growing community concern because of theaddictiveness of these drugs. As more money is needed to sustain the drug habit, both sellersand users often commit crimes to obtain money. Drug users are also more likely to be involvedin marital and child abuse.
In Sheridan County, there has been an increase in population of at least 300 people since1998. Many of the new residents are CBM workers and their dependents. The county has expe-rienced an increase in aggravated assaults from 40 in 1998 to 90 assaults in 2000. Burglaryand larceny crimes also increased considerably during that period.
In both Sheridan and Campbell counties, the CBM development has affected the ability of thesheriff’s department to hold on to their employees. The higher wages offered by CBM compa-nies have enticed many experienced crime prevention workers to leave their jobs and join theCBM industry. It is also more difficult to attract new police recruits, as the higher wages againdraw more young men and women to the industry jobs.
SafetyThere are no local or state-wide safety standards being applied in the coal bed methane explo-ration and production areas of Wyoming. Most of the larger CBM companies, however, haveadopted their own operational and safety standards, but subcontractors do not necessarily fol-low them (and companies do no monitor their subcontractors to ensure that they are following
I-43
IMPACTS ASSOCIATED WITH OIL AND GAS
Soil erosion can beunsightly; it canlead to excessiveturbidity in streams;and the loose soilscan create problemswith dust anddecrease visibility.
the company’s safety standards). In the aftermath of some industrial accidents, the CampbellCounty Fire Chief has witnessed CBM contractor crews that were somewhat drunk and/orunprepared to carry out work safely.
RoadsIn Sheridan County, 50% of county roads have been impacted by CBM development, while inCampbell county more than 25% have been affected. Increased road usage by the CBM indus-try and new residents has reduced the facility life of the roads, and has increased the cost ofroad operations and maintenance. In Sheridan County, some impacts on county roads arebeing mitigated by CBM companies that sign road “user agreements” with the county (in whichthe companies agree to: repair road damages beyond normal wear and tear; restore roads toexisting condition; and provide labor and materials for road repairs). Even with these agree-ments, however, Sheridan County estimates that $8.7 million will have to be spent on roadimprovements in the county and City of Gillette.
DustAnother consequence of CBM development is significant dust emissions along county roads.Horses in some areas of Sheridan County have experienced chronic coughing from increaseddust emissions. Some ranchers in Campbell County have found that cattle do not eat grass thatis within 0.25 miles of both sides of some county roads. Some counties are applying magne-sium chloride to suppress dust; others are using gravel, which is thought to be a more effectivedust suppressant. Campbell County, which does not have its own gravel source, imports gravelfor dust suppression at a cost of $6/ton.
Property ValuesIn some Wyoming counties, housing values, in general, have increased due to the recent boomin CBM development combined with an overall housing shortage in those counties.
A study conducted in La Plata County in Colorado, found that despite an overall increase inhousing values between 1990 and 2000, the selling price for properties that had an oil or gaswell on them was 22% less than a similar property without a well on site.217
Interestingly, the study found that if a property did not have a well, but was located within 550feet of a property with an oil or gas well, that the non-well-bearing property increased in value.The authors suggested that this occurred because buyers assumed that there was a low likeli-hood of two wells being drilled right next to each other. This assumption may have disappoint-ing results for those buyers, however, because state agencies can and do change well spacingrequirements – especially as the oil or gas field ages – and wells may eventually have to bedrilled in between existing wells in order to get more oil or gas out of the formation. (Read aboutwell spacing in the section on Field Organization earlier in this chapter)
NoiseMany landowners choose to live in rural areas because they want to live a peaceful life. Oil andgas development, however, can greatly affect the peace and tranquility of rural areas, and canbecome a major annoyance to those living close to oil and gas facilities. This, in turn, may affecta person’s health and quality of life. The following section provides an overview of noise issuesfor landowners dealing with oil and gas development. See Chapter V for additional resourcesrelated to noise.
Noise from oil and gas development comes from a number of sources: truck traffic, drilling andcompletion activities, well pumps and compressors.
In general, the volume of a sound is measured in decibels (dB). According to the World Health
I-44
Oil and Gas Development and Impacts
Organization, outdoor sound that exceeds 55 dB begins to be a nuisance to people.218 Duringthe nighttime hours (10 p.m. to 7 a.m.), sound levels in rural or quiet suburban areas are oftenas low as 25 to 35 dBA,219 while urban areas may be 80 dB or more.220
How Sound Travels—Sound is caused by changes in air pressure. For example, when a malletstrikes a drum the drumhead begins to move back and forth (vibrate). As the drumhead movesdown, air is pulled toward it, and as the head bounces back up it pushes air away. This createschanges in air pressure that move (or propagate) away from the drum, eventually striking oureardrum. These changes in pressure are known as sound waves.
There are a number of factors that affect the propagation of sound. The most importantinclude: distance from source; obstacles such as barriers and buildings; atmospheric absorp-tion; wind direction and speed; temperature and temperature gradient; humidity; precipitation;reflections; and ground absorption.223
It is important to understand that noise does not always decrease as one moves away from anoise source. The above factors can work to increase or decrease noise levels. For example, atshort distances (up to 160 feet) the wind has a minor influence on the measured sound level.At distances greater than 1,000 feet from a noise source, noise can become louder on thedownwind side by as much as 20 dB, while on the upwind side levels can drop by 20 dB(depending on wind speed and distance). 224
Other things to consider include the fact that while barriers may act to reduce high frequencysounds, low frequency sounds are difficult to reduce using obstacles or barriers. Additionally,while soft ground surfaces and the atmosphere are effective at absorbing mid-frequency andhigh frequency noise, these factors do not tend to reduce low frequency noise to the samedegree. This means that as one moves away from the source, low frequencies often becomemuch more prominent.225
What Makes Certain Sounds Annoying?—Whether a noise is objectionable will vary depend-ing on its type (tonal, impulsive, etc.), the circumstances (e.g., does the noise occur in an areawhere there are already loud noises versus a quiet rural setting), and the sensitivity of the indi-
I-45
IMPACTS ASSOCIATED WITH OIL AND GAS
Oil and Gas Development Noise
In a La Plata County, Colorado study221 noise levels were reported for a number of oil and gas activi-ties and equipment:• A typical compressor station: 50 dBA* at 375 feet from the property boundary (noise emitted 24-
hours-a-day)• Pumping units: 50 dBA at 325 feet from the well pad (noise emitted 24-hours-a-day)• Fuel and water trucks: 88 dBA at 50 feet; 68 dBA at 500 feet• Crane (used to hoist rigging equipment): 88 dBA at 50 feet; 68 dBA at 500 feet• Concrete pump (used during drilling): 82 dBA at 50 feet; 62 dBA at 500 feet• Average well construction site: 85 dBA at 50 feet; 65 dBA at 500 feet
*Often, equipment used to measure sound is designed to account for sensitivity of human hearing tovarious frequencies. This is known as A-weighted correction, and the measurement is an A-weighteddecibel (dBA).222
Prolonged periodsof noise exposure to65 dBA can causemental and bodilyfatigue.
vidual who hears it. Certain noise characteristics can greatly increase the annoyance and thehealth impacts associated with a noise. These factors include: 1) tonality; 2) impulsiveness 3)fluctuation or intermittence and 4) presence of low frequencies.
When a noise contains sound that has distinct frequency components (tones), e.g., noise fromfans, compressors, or saws, the noise is generally far more annoying than other types of noise.Most energy industry facilities typically exhibit either a tonal or impulse/impact component.226
Impulsive noise comes from impacts or explosions, e.g., from a pile driver, or pieces of pipe hit-ting one another. The noise is brief and abrupt, and its startling effect causes greater annoy-ance than would be expected from a simple measurement of the sound decibel level.Fluctuating noises, as well, may be far more annoying than predicted by average sound levels.227
Oil and gas pump jacks can create fluctuating and intermittent noises. Pump jacks may oper-ate and automatically shut off for specific periods of time. When improperly maintained, pumpjacks can develop intermittent rubbing noises or squeaking noises that occur at regular inter-vals. Regular variations in noise have been found to increase the annoying aspects of thenoise.228
Some jurisdictions have developed noise regulations that penalize individuals or industries thatgenerate tonal, impulsive or fluctuating noises. For example, if a noise has an obvious tonalcontent, a “penalty” or correction may be added to account for the additional annoyance.229
Currently, the penalty for tones varies between 0 dB (no penalty) and 6 dB.230 The penalty isadded to the measured decibel level, and this combined decibel level is compared to theacceptable decibel standard.
• For example, if the noise from a compressor is measured as 49 dBA, but it is determinedthat the noise has tonal components, a penalty of 6 dBA would result in a noise level of55 dBA. If the acceptable noise standard is 50 dBA, the noise from the compressor wouldbe out of compliance.
Low Frequency Noise—Low frequency noise is experienced by some landowners who live nearoil and gas facilities. Low frequency noise does not have a consistent definition, but it is com-monly defined as noise that has a frequency between 20 and 100 - 150 Hz (in other words,sound waves are vibrating between 20 and 150 times per second).
Low frequency noise can be generated by numerous sources during oil and gas production.231
• Low frequency noise is produced by machinery, both rotational and reciprocating, and allforms of transport and turbulence. Typical sources include pumps, compressors, and fans.
• The firing rate of many diesel engines is usually below 100 Hz, so road traffic noise canbe regarded as low frequency.
I-46
Oil and Gas Development and Impacts
FIGURE I-28. NOISE EXAMPLESLeft to right: Pump jack noise is intermittent; compressor noise is constant and long-term; noise from drill rigs is short-term but very loud.
• Combustion turbines are capable of producing high levels of low frequency noise. Thisnoise is generated by the exhaust gas.232
• Burners (and flares) can emit broadband low frequency flame roar.
Low frequency noise creates a potential for . It is well established, however, that the annoyance due to a given noise source is perceivedvery differently from person to person. For many humans, their ears are not very sensitive tolow levels of low frequency sound. At low frequencies, however, noise may not be perceived assound but rather may be “felt” as a vibration or pressure sensation.233
For those who are sensitive to low frequency sound the effects can be dramatic.234
Complainants often describe the noise as:
• Humming or rumbling
• Constant and unpleasant
• Pressure in ears
• Affects whole body
• Sounds like large, idling engine
• Coming from far away
Researchers have conducted field measurements and laboratory studies of people who havecomplained of low frequency noise in their homes. Studies have found that:235
• Problems tend to arise in quiet rural or suburban environments
• The noise is often close to inaudibility, and is heard by a minority of people
• The noise is typically audible indoors and not outdoors
• The noise is more audible at night than day
• The noise has a throbbing and rumbly characteristic
• The complainants have normal hearing
Despite the fact that the World Health Organization has stated that, “The evi-dence on low frequency noise is sufficiently strong to warrant immediate con-cern,” few noise regulations in the United States address low frequency noise.Some counties in northern Michigan have developed ordinances that referencelow frequency noise as a separate than other noise issues.236 Most of the researchand regulation related to low frequency noise has taken place in European coun-tries and Japan. See Chapter V for resources related to Low Frequency Noise.
Health Effects of NoiseThere are adverse physical and mental effects from noise. For example, pro-longed periods of exposure to 65 dBA can cause mental and bodily fatigue.Furthermore, noise can affect the quantity and quality of sleep; cause permanenthearing damage; contribute to the development or aggravation of heart and circulatory dis-eases; and transform a person’s initial annoyance into more extreme emotional responses andbehavior.237
According to the World Health Organization:238
Noise annoyance is a global phenomenon. A definition of annoyance is “a feeling ofdispleasure associated with any agent or condition, known or believed by an individualor group to adversely affect them.”
I-47
IMPACTS ASSOCIATED WITH OIL AND GAS
FIGURE I-29. VENTING OF GAS WELLCAN BE PIERCINGLY LOUD.
. . .apart from “annoyance”, people may feel a variety of negative emotions whenexposed to community noise, and may report anger, disappointment, dissatisfaction,withdrawal, helplessness, depression, anxiety, distraction, agitation, or exhaustion.
. . . Social and behavioural effects include changes in overt everyday behaviour pat-terns (e.g. closing windows, not using balconies, turning TV and radio to louder levels,writing petitions, complaining to authorities); adverse changes in social behaviour (e.g.aggression, unfriendliness, disengagement, non-participation); adverse changes insocial indicators (e.g. residential mobility, hospital admissions, drug consumption,accident rates); and changes in mood (e.g. less happy, more depressed).
The World Health Organization also reports that “a large proportion of low-frequency componentsin noise may increase considerably the adverse effects on health.” In an epidemiological surveyof sufferers from low frequency noise, the following health effects were documented:239
The above health effects were felt by people experiencing low frequency noise in their homes.The New Mexico Game and Fish states that even for human beings in a recreational setting, lowfrequency noise has been shown to cause stress reactions including raised blood pressure andincreased muscle tension.241
Unfortunately, many of the health effects of noise due to oil and gas operations have not beenscientifically documented. The lack of scientific study does not mean, however, that noiseissues related to oil and gas are insignificant. The loud, continuous noise during the drillingphase; the loud short-term noises from flaring or hydraulic fracturing; the intermittent whine ofpoorly maintained pump jacks and other equipment; and the loud or low frequency noise fromcompressors are common complaints related to oil and gas development. Numerous citizenshave reported disruption of sleep and increased anxiety caused by noise from oil and gas devel-opments.242
I-48
Oil and Gas Development and Impacts
FIGURE I-30. HEALTH EFFECTS OF LOW FREQUENCY NOISESource: Mirowska, M. and Mroz, E. 2000.240
To illustrate the frustration with noise generated by compressors, here is one landowner’sexperience:
Now comes the second phase. The dreadful noise generated by a nearby large com-pressor station. Noise that was so loud that our dog was too frightened to go outsideto do his business without a lot of coaxing. Noise that sounds like a jet plane circlingover your house for 24 hours a day. Noise that is constant. Noise that drives people tothe breaking point. My neighbor called the sheriff, state officials and even the gover-nor and was told nothing could be done about the noise. Like I said, the noise drivespeople to the breaking point, and my neighbor fired 17 rifle shots toward the station.
—Excerpted from CBM Destroys Retirement Dream.The full story from this landowner can be found in Chapter IV.243
For more landowner stories related to noise, see Chapter IV. See the section on AlternativeTechnologies and Practices later in the chapter for information on how to decrease noise levels.
I-49
IMPACTS ASSOCIATED WITH OIL AND GAS
CONTAMINANTS ASSOCIATED WITH THE OIL AND GAS INDUSTRY
The following table summarizes the types of wastes that are generated during the variousstages of oil and gas development.
Of these wastes, there are some that pose more serious concerns for landowners than others.These include specific air emissions; hydrocarbon wastes; produced water; and naturally occur-ring radioactive materials (NORM). These are discussed in more detail on the following pages.
I-50
Oil and Gas Development and Impacts
244
AIR EMISSIONS
As seen in the table below, there are several types of air emissions in the drilling and produc-tion process. The following table provides information on air quality concerns related to oil andgas in different parts of the country.
Some of the key sources of air emissions include the following:
1. Fugitive emissions from leaking tubing, valves, tanks, and open pits, or intentional vent-ing of natural gas may release volatile organic compounds (VOCs)246 and hydrogen sulfide.
• VOCs are carbon-containing substances that readily evaporate into the air. They cancombine with nitrogen oxides to form ground-level ozone, which can cause respiratoryailments such as asthma, and decreased lung function (see following page for moreinformation). Examples are benzene and toluene.
2. Particulate Matter is essentially small particles that are suspended in the air and settle tothe ground slowly. These particles may be re-suspended if disturbed. The most commonsources of particulate matter from oil and gas operations are dust or soil entering the airduring pad construction or from traffic on access roads; and diesel exhaust from vehiclesor engines used at oil and gas facilities.
• PM10 particles (with diameters less than 10 micrometers or µm) are small enough tobe inhaled and can cause adverse health effects.
• PM2.5 particles (with diameters less than 2.5 µm) can lodge deep within the lungsand cause serious health problems. PM2.5 particles are the main cause of visibilityimpairment (haze). Secondary particles are formed through chemical reactions involv-ing gases and other particles in the atmosphere. Particles formed in this manner arefine particles (< 2.5 µm). The most common precursor gases involved in these reac-tions are nitrogen oxides (NOx), sulphur dioxide (SO2), volatile organic compounds(VOCs) and ammonia (NH3).247 SO2, NOx and VOCs are all emitted during oil and gasoperations.
• For residents living along unpaved roads or near well pads, dust can penetrate theirhomes causing a nuisance and health problems such as hay fever and allergies. Crops
I-51
IMPACTS ASSOCIATED WITH OIL AND GAS
Studies over the last15 years show thatlow levels of ozone,most certainly at 50to 60 parts per billion(34-24 ppb below thefederal limit) aredetrimental to health.
American Journal ofRespiratory and CriticalCare Medicine
245
and vegetation near unpaved roads can be covered with the airborne dust stuntingtheir growth due to the shading effect and clogging of the plant's pores. As a result,cattle and wildlife may avoid this vegetation. For motorists using the unpaved roadsthe traffic-generated dust can reduce visibility and cause driving hazards.
3. The flaring of natural gas produced from the oil or gas wells may release carbon monox-ide, nitrogen oxides, sulfur dioxide, benzene, toluene, ethylbenzene and xylene, polycyclicaromatic hydrocarbons (PAHs) and, in the case of sour gas, hydrogen sulfide and carbondisulfide.
• Benzene and PAHs are carcinogenic (cancer-causing). Also, benzene has been shownto cause various adverse health effects other than cancer, such as blood disorders,
I-52
Oil and Gas Development and Impacts
Dust Suppression
WATER is probably the oldest of all dust suppressants. Typically, it is applied by spraying it over the road surface. Drawbacks: Water’s dust suppressing capacity is very temporary because of evaporation. Heavy applications of watercan create soft mud or penetrate the road to the sub-base and causing major road failure. Consequently, several lightapplications are preferable to one heavy application.
CHLORIDE COMPOUNDS such as calcium chloride (CaCl2), magnesium chloride (MgCl2) and the less popular sodiumchloride (NaCl2) are used because they attract and absorb moisture from the atmosphere and retain it for extendedlength of time, which significantly reduce the evaporation of moisture from the road surface. Thus, they are moreeffective dust suppressants than plain water.Drawbacks: Chloride compounds have the disadvantage of dissolving in water, and therefore can be washed out dur-ing wet weather conditions. They are also corrosive.
LIGNIN DERIVATIVES include a variety of industrial waste products, animal fats, and vegetable oils; the most popular isligninsulfonate, which is a waste product from the paper-making industry. When used as dust suppressant, the ligninpolymers act as glue binding the soil particles together. According to the New Mexico State University MolecularBiologic Program, a by-product of the soybean crushing process, called soapstock, is now being used as dust sup-pressant on dirt and gravel roads throughout the Midwest. This alternative is said to be more environmentally safe inplaces where runoff is a concern, and supposedly lasts longer than most other alternatives.248
Drawbacks: Ligninsulfonate dissolves in water, and so it is easily washed away during wet weather conditions.
RESINOUS ADHESIVES include waste oils, tars, bitumen, and by-products from the plastic industry. Of all these products,cutback asphalt and asphalt emulsions are most widely used as dust suppressants.Drawbacks: According to the Minnesota Pollution Control Agency, “When applied to roads, waste oil can seep intogroundwater, runoff into surface waters or spread into the air with dust particles. Once in ground or surface waterseven small amounts of used oil can contaminate large quantities of drinking water. . . Used oil reduces the amountof oxygen in water, damaging fish and other aquatic life.”249 Consequently, waste oils are prohibited from use as a dustsuppressant in Minnesota.Very little quantitative information currently exists on the environmental impacts from theuse of dust suppressants (other than water). Landowners should be aware that the application of dust suppressantshas been noted to cause slipperiness on unpaved roads in wet weather conditions. The water quality effects of theuse of dust suppressants are still not entirely known, however the chloride compounds and the lignin additives com-monly used contain contaminants such as chlorides, heavy metals and organic compounds that are regulated by theU.S. Environmental Protection Agency.250
ALTERNATIVES TO WATER AND CHEMICAL DUST SUPPRESSANTS251
LOWERING SPEED LIMITS will decrease the amount of dust stirred up from unpaved roads and pads. Lowering the speedof a vehicle from 45 miles per hour to 35 miles per hour can reduce emissions by up to 22 %. Installation of speedbumps can reduce vehicle speeds.
UPGRADING UNPAVED ROADS (e.g., by improving particle size, shape, and mineral types that make up the surface andbase materials) will increase a road’s surface strength, and reduce dust emissions. Adding surface gravel can reducethe source of dust emission, but if gravel is added the amount of fine particles (i.e., those smaller than 0.075 mm)should be limited to 10 to 20 %. Also, improving drainage and crown can reduce dust emissions. Paving is the mostexpensive, but most effective road upgrade option.
Dust can affect humanhealth, and the health of
crops, livestock andwildlife.
Studies also show that directional drilling has been successful in a variety of geologicalformations (e.g., shallow reservoirs, deep reservoirs, tight sands, coal beds, tar sands).Furthermore, if horizontal drilling is used in coal beds, there may be no need to hydrauli-cally fracture the beds, resulting in a decreased potential for groundwater pollution.Perhaps the greatest benefit to the surface owner is the ability to locate well sites awayfrom residences or other areas that surface owners do not want to be disturbed. It is nowpossible for companies to access oil or gas from beneath a landowner's property by drillinga well that is miles away from that property.338
A major benefit to the companies and mineral owners receiving royalties is increased oiland gas production. Oil- and gas-bearing formations tend to be more wide than they aredeep, consequently, wellsthat intersect a producing for-mation at an angle or horizon-tally often can drain more ofthe oil and gas than purelyvertical wells. There arenumerous studies showingthat directionally drilled wellshave been able to extract 2-25 times more oil or gas thanvertical wells drilled in thesame oil or gas field.339
I-66
Oil and Gas Development and Impacts
FIGURE I-38. DIRECTIONALLY DRILLED WELLSSource: Drilling Smarter: Using Directional Drilling to Reduce Oil and Gas Impacts in the Intermountain West.340
FIGURE I-37. A VERTICAL AND HORIZONTAL WELL DRILLED ONONE PAD. Photo printed with permission of Vermejo Park Ranch.
The drilling of a directional well is more costly than drilling a typical vertical well becauseit requires specialized equipment; constant attention to the placement of the drill bit; ittakes several days longer to drill the wells; and pumping costs may increase becauseparts may wear out faster. According to the U.S. EPA, however, the increased costs of direc-tional drilling are often more than offset by increased production and the reduced needfor drilling multiple wells.341
In the Dundee Formation of Michigan, as much as 85 % of the known oil remained inthe formation after many years of production, but many wells were on the verge ofbeing plugged because daily production had fallen to only five barrels of oil per well.The U.S. Department of Energy co-sponsored a project to drill a horizontal well in theformation. This well produced 100 barrels per day. The program attracted other welldevelopers, and 20 to 30 additional horizontal wells are being drilled in the formation.It is estimated that the application of horizontal drilling to this formation may yield anadditional 80 to 100 million barrels of oil.342
4. Flareless or “green” completions reduce flaring and venting of natural gas. Before nat-ural gas and coalbed methane wells begin producing gas for sale, the well bore and sur-rounding reservoir must be “cleaned up” (i.e., any fluids, sand, coal particles, or drill cut-tings within the well bore must be removed). The conventional method for doing this is topump air down the well bore, which lifts the waste fluids and solids out. The solid and liq-uid waste materials are then dumped into a pit or tank, and any gas that is removed isflared or vented to the atmosphere. In some flareless or green completions, natural gas,rather than air, is pumped down the well bore to clean it out.343
In flareless or green completions the gas that comes to the surface is separated from flu-ids and solids using a series of heavy-duty separators (sometimes referred to as “flowbackunits”). The water is discharged to tanks to be reused, the sand is sent to a reserve pit,and the gas is either cycled back through the well bore, or sent to a pipeline to be soldrather than vented or flared. According to the U.S. Environmental Protection Agency (EPA),benefits of this system include: the elimination or reduction in venting or flaring of natu-ral gas; sale of the gas and condensate provides the operator with an immediate revenuestream; there is a reduction in solid waste and water pollution; and the system enablessafer operating practices.
Emissions Reductions: One company, which drilled63 wells using flareless completions, reported areduction in natural gas emissions of 7,410 thou-sand cubic feet per year, which is 70% of the gas thatwould formerly have been vented to the atmos-phere.344 Another company has been able to reduceflaring by 85-90%.345
Costs and Pay-Back: The capital costs for companiesinclude the use of separators, sand traps and tanks.One company reported these costs as being$180,000. The equipment, however, can be movedfrom site to site, so if a company were to complete 60wells per year the annual capital charges would beless than $10,000. Operating costs are less than$1,000 per year. EPA has estimated that “green com-pletions” can pay back their costs in about 1 year.
An alternative to sending the gas to the pipeline is to send it to a flare tank. Flare tanks
I-67
STAGES OF OIL & GAS DEVELOPMENT
FIGURE I-39. TYPICAL COMPLETION WITH A FLARE BERM ANDWASTE PITS. Photo by Dan Randolph
capture and more fully combust the waste gases. The tanks can be carried from site tosite. This practice avoids the costs associated with excavating and reclaiming flare pits,and avoids the potential liability associated with cleaning up soils contaminated by flaring.
5. Waste minimization during drilling operations. The state of Texas has produced a docu-ment Waste Minimization in the Oil Field that provides a general overview of waste mini-mization techniques for wastes arising from oil and gas operations, including drilling oper-ations.347 The document also provides case studies of successful waste minimization proj-ects and a bibliography of useful technical references. The document includes dozens ofexamples of alternative drilling practices, such as:
• Product substitution. Replacing conventional, toxic products with less toxic, yet effec-tive, substitutes. For example, companies are substituting low toxicity glycols, syn-thetic hydrocarbons, polymers, and esters for conventional oil-based drilling fluids.The use of these substitutes eliminates the generation of oil-contaminated cuttingsand other contamination by the oil-based fluid and decreases concerns related to siteclean-up when the well is abandoned. Drilling engineers have published numeroustechnical papers that describe the successful application of substitute drilling fluids.In many instances, this substitution has resulted in significant cost savings.
Similarly, companies have designed alternatives to the conventional water- and chem-ical-based hydraulic fracturing techniques, by substituting carbon dioxide for the morecommon and more toxic fracing fluids.
• Process or procedural modifications. For example, in the past few years the drillingindustry has improved the technology of slim hole drilling. If feasible, slim hole drillingreduces the volume of wastes (e.g., drilling fluid and the drill cuttings) produced dur-ing drilling. The total cost of a slim hole drilling operation may be considerably lessthan for conventional hole sizes, and smaller casing is required, which may helpreduce the total cost of the operation.
• Reduction in water use. For example, companies can reclaim water from waste drillingfluids by using mechanical or chemical separation techniques such as large bowl cen-trifuges, hydrocyclones, and/or chemical flocculants. The reclaimed water may then bereused, thus reducing the demand on, and cost of, new water sources. Dewatering ofwastes may also result in a reduction of the volume of drilling waste to be managed,thus saving waste management costs, easing site closure concerns and costs, andreducing future potential liability concerns.
• Preventative maintenance. For example, chemicals and materials should be stored sothat they are not in contact with the ground (e.g., stored on wooden pallets), or exposed
I-68
Oil and Gas Development and Impacts
FIGURE I-40. FLARE TANKS REDUCE HAZARDOUS EMISSIONS BY MORE FULLY COMBUSTING WASTE GASES.Source: Wellco Energy Services, Inc.346
to the weather. There should be secondary containment in the case of spills. All drumsand containers should be kept closed except when in use. It is very important that allchemical and material containers always be properly labeled so that their contents maybe identified at any time. Proper storage and labeling of containers allows quick andeasy identification and classification of released chemical or material in the event of aleak or rupture. In some instances, that could save hundreds of dollars in soil samplingand laboratory analysis costs.
• Recycling. For example, the cost of closing a drilling site is increased if waste drillingfluid in a reserve pit must be dewatered and/or stabilized prior to closure. An alterna-tive is to recycle or reuse the waste drilling fluid, e.g., in another drilling project. Onecompany designed a multi-well drilling project where the same drilling fluid was usedfor drilling each successive well. The result was significant cost savings and greatlyreduced waste management concerns. Another cost effective alternative for reuse ofwaste drilling fluid is in plugging or spudding of other wells.
ALTERNATIVES USED DURING THE PRODUCTION PHASE
1. Minimizing Surface Disturbance
• Well pads are often much larger than they need to be—sometimes exceeding severalacres in size. At Ted Turner’s Vermejo Park Ranch, however, the well pads are only 0.6acres. (See Vermejo Park Ranch Coal Bed Methane Project Mineral ExtractionAgreement Summary, in Chapter III).
• After the drilling phase if over, the portion of the drilling pad not needed for oil or gasproduction can be reclaimed. This is known as interim reclamation, and it is requiredby law in many states. Unfortunately, lack of enforcement by state agencies meansthat interim reclamation does not occur in many jurisdictions.
I-69
STAGES OF OIL & GAS DEVELOPMENT
FIGURE I-41. MINIMIZING SURFACE DISTURBANCE.Left to right: Poor Practice: no efforts have been made to reduce surface disturbance at this site. Better Practice: this wellsite and the road leading to it have been revegetated. The surface owner has 40 additional years of use, and a 40-yearhead start on reclamation. Photos by Bob Miller.
2. Minimizing Visual Impacts and Noise
• Landscaping can help decrease the visual impacts of wells. For example, soil can beformed into ridges or gentle berms around the well pad, and trees and other vegeta-tion can be planted on the ridges to screen wells so that nearby residents don’t seethem.
• A low-profile pumping unit can replace the conventional unit, which uses a 30- to 40-foot beam and looks like a giant, bobbing horse’s head. The conventional pump is runon a gas- or diesel-powered engine, which is noisy and smelly. Alternatives to this largepump include using a pneumatic pumping device that doesn’t require an engine,therefore, produces little or no noise. This pump stands about 10 to 15-feet tall.According to one company, pneumatic pumps will not function correctly if a lot ofwater is extracted while extracting methane gas.348 When larger amounts of water areproduced, an alterative to the standard beam pump is the progressive cavity pump.These pumps come in different shapes and sizes, and like the pneumatic pump, theycan un on electric motors, and therefore, be much quieter than conventional pumps.
3. Minimizing Noise
• Noise created by operators constantly driving in and out from the well pad to monitorwell production can be mitigated using an automated monitoring system, which allowswells to be monitored remotely, e.g., from the company’s office.349
• To mitigate noise impacts from engines, a sound barrier made out of four inches ofinsulation and 18-gauge steel can be used. Sound barriers are placed in an L-shapeabove the engine, and they extend past the sides of the engine.350 Some engines canoperate at a constant number of revolutions per minute (RPM), which reduces the up-down noise caused by other engines, which speed up and slow down. Mufflers, likethose used for automobile engines, can be used to minimize engine noise.351 Toreduce noise in sensitive areas, well-site or field compressors may be enclosed in asound-insulated building, and equipped with two buried hospital-grade mufflers inseries.
• Noise from compressors can be mitigated by treating each significant noise source:gas turbines or engines, compressors, exhaust outlets and air inlets, and cooling andventilation fans. Abatement may involve changing the blades on fans, which canchange the frequency of sound emitted, thereby removing the annoying tones. Enginenoise can be muffled using automotive-type mufflers, or by housing the engines inacoustically insulated structures. Also, the entire compressor can be housed in anacoustically insulated building.
• If the control valves on a pump’s separator unit, which separates the methane and water,are replaced with better valves, methane emissions to the atmosphere can be reduced.This will have positive environmental benefits, as methane is a powerful greenhouse gasthat contributes to global warming. By replacing 3,300 controllers on 2,760 wells inColorado and New Mexico, the Colorado Oil and Gas Conservation Commission expectsthat methane emissions will be reduced by 12,000 tons per year in the San Juan Basin.353
According to an engineer with the company BP, replacing valves not only has a positivebenefit with greenhouse gases, it also has a positive economic benefit for that company.354
• Emissions can be reduced by monitoring and pinpointing fugitive emissions, and thensealing the leaks; using lower heater treater temperatures; connecting storage tanksto flare systems; converting gas-driven chemical pumps to electric-, air- or nitrogen-driven pumps; compressing casing gas and shutting down line pigging. Also, airemission may be decreased by installing: no-bleed or low-bleed pneumatic devices;vapor recovery units; high efficiency flares; closed-loop skimmers on water tanks; andseparator pumps and evacuators on pipeline bleeders.355
• Wellhead compressors that are powered by natural gas emit NOx and VOCs (whichcontribute to ground-level ozone) and carbon monoxide. According to the federalBureau of Land Management, there are add-on technologies, such as catalytic con-verters, that can reduce these emissions by as much as 95%.356
• Cavitation baffle systems (large storm sewer concrete pipe) can be used to reduceflare height and contain the majority of coal dust during coalbed methane cavitationoperations.357
I-71
STAGES OF OIL & GAS DEVELOPMENT
FIGURE I-44. SOUND CONTROLLeft to right: Sound is directed up; sound is directed away from a house, but is not absorbed; sound is effec-tively reduced with absorbing panels to 1 decibel above ambient.
FIGURE I-43. SOUND CONTROLLeft to right: Pump jack with sound abatement walls and muffler at lower right. The “barn” houses a compressorstation. By treating each noise source, the company achieved its design goal of 40 dB at 300 feet from the sta-tion. The barn-like building was designed to fit into the rural countryside; source: ATCO Noise Management. 352
• Barrett Resources Corporation has minimized odors generated at natural gas produc-tion sites, a common source of complaint by surface owners, by using combustionunits designed to destroy vapors released by condensate tanks and glycol dehydra-tors. These units also reduce emissions of methane (a greenhouse gas), and otherhydrocarbons that can affect visibility.
• Standard glycol dehydrators which are used to remove water from natural gas, typi-cally vent water and hazardous gases directly into the atmosphere. Glycol dehydratorsare a major source of benzene emissions within the oil and gas industry.359 Fatalitiesfrom human exposure to high concentrations of benzene have been documentedsince the early 1900s, and studies have shown correlations between workplace expo-sure to benzene and the onset of certain forms of leukemia.360 The issue of air emis-sions from glycol dehydrators has only been identified in the past few years. Most ofthe glycol dehydration units are installed in rural environments; they are typically leftunattended, and emissions are not regularly monitored.
In 1995, the Canadian government announced that it would be limiting benzenereleases through various measures including controlling emissions of benzene fromnatural gas dehydrators. A Canadian Working Group composed of industry, govern-ment, and public interest groups produced a document, Best Management Practicesfor Control of Benzene Emissions from Glycol Dehydrators,361 which outlines methodsfor minimizing benzene emissions in new and existing plants; and provides more infor-mation on alternatives to glycol dehydration. These include: methanol or glycol injec-tion; separator packages; line heaters; solid desiccant/molecular sieve plants; mem-brane technology; and other commercial processes.
Emissions from glycol dehydrators can be reduced by: optimization of operations;equipment modifications or replacement; and/or, addition of emission control equip-ment. Emission controls such as condensers, flare stacks, and incinerators for still col-umn vent vapors have been installed by industry at some locations. Research by theU.S. EPA has indicated that operators of glycol dehydrators often maintain a circulationrate that is at least two times higher than is needed to remove enough water from thegas. Therefore, companies can reduce their glycol use by performing simple calcula-tions to determine the minimum circulation rate needed. By doing so, they will lose lessmethane to the atmosphere; improve the dehydrator unit efficiency; and decrease fuelpump use. EPA has calculated that by doing so, the potential savings for a dehydratorunit can range from $260 to $26,280 per year.362
I-72
Oil and Gas Development and Impacts
Capture Gas Instead of Flaring It
The federal Department of Energy and the Interstate Oil and Gas Compact Commission areinvolved in a project to reduce greenhouse gases and NOx emissions and increase oil pro-duction and in California. Gas that would otherwise be flared, and shut-in gas fromCalifornia’s oil-fields will be used to generate electricity. Several types of conventional andnew microturbine generators will be tested at selected sites from among California’s 21,000marginal wells.
Petroleum Technology Transfer Council358
RECONNECTING THE SURFACE AND MINERAL ESTATES
In some states, mineral rights revert to the surface owner under certain conditions such asdeath, failure to obtain production, or passage of a specified period of time. It is important tobe aware that these types of laws may exist in your state, and they may provide surface ownerswith the opportunity to take possession of the mineral rights beneath their land. Several stateshave laws to this effect.
• In Louisiana, if the minerals are not used (e.g., no exploration or production has occurred)within 10 years, the surface owner becomes the owner of the minerals.377
• In North Dakota and Ohio, if minerals have lain dormant for 20 years the surface ownercan claim them.378
• In Michigan, a law that passed in 1998 provides landowners with the opportunity to peti-tion the state to purchase the state-owned minerals beneath their land. They can do thisonly if there is no pending lease or development. Upon request from surface owners, thestate must sell the minerals to them at fair market value, unless the state wants to reserveminerals to prevent damage in environmentally sensitive areas, or there is some otherlegitimate reason to keep the minerals in state ownership. A deed restriction then will beadded to the property that prohibits the minerals from being severed in the future.379
• Recent attempts to pass similar laws in Colorado and Montana have failed.
HOW TO DETERMINE OWNERSHIP
If a landowner is unsure of whether or not he or she owns the mineral estate, it is a questionthat should be answered, especially if the land is owned or leased in a region with oil and gasdevelopment.
• If you own the minerals beneath your land, you have considerable opportunity to benefitfrom and influence the course of oil and gas development.
• If you do not own the minerals beneath your land, that means that other people or entitiespossess certain rights that may hinder your ability to shape oil and gas development onyour property.
There are a number of methods for determining who owns the oil and gas beneath your land.
1. Read your property deed and research the land title records.If you want to find out who owns the minerals beneath your land the first step is to find the deedto your property. The deed may state that ownership of your property is fee simple absolute.This may mean that you own both the surface property and the underground mineral resources.
If you can’t find your copy of your deed, contact your county government. Surface deeds arealmost always recorded in the county government’s Recorder of Deeds (or some equiva-lent) office in the county where the property is located.
It may be necessary to search the property’s historical deeds all the way back to the 1800s.(Be aware that older mineral deeds may not be recorded in any government office.) Aphrase in an old deed such as “oil and gas excepted and reserved” means that the surfacewas sold separately from the oil and gas estate at that time. If you find such a statementin an old deed, the oil and gas is probably not yours to lease or develop.380
II-5
WHO OWNS THE MINERALS
BENEATH YOUR LAND?
2. Research mineral deeds, grants and reservations. Go to the county and federal government offices to find out if there are mineral deeds,grants or reservations related to your property. You will need a legal description of your land(this can be found in your deed or in the title document for your land).
The federal Bureau of Land Management maintains Surface and Mineral Land Statusmaps, which can be purchased for a nominal fee. These maps are color-coded to show own-ership status (i.e., federal, state or private ownership), but the maps do not show privateland owner names.
Depending upon where you live, there will be different county officials (e.g., countyrecorders, register of deeds, county clerk) charged with recording mineral, oil and gas trans-action documents such as mineral deeds. To obtain addresses and phone numbers for theappropriate office, contact your county government, or visit the web site: http://royalty-deeds.com/courthouses/.
Some county assessor offices track minerals because they are taxed at the county level ifthey are producing (or they are taxed if non-producing but severed from the surface). Youshould contact your assessor’s office to determine if they track mineral ownership.
3. Have a title search conducted by a land title/abstract or title insurance company. There are two main types of companies that provide information on property ownership:one that will create an abstract of title, and a second that provides title insurance. In bothcases, these companies can research the legal history of property and perform extensivesearches of public records including deeds, mortgages, contracts, civil court records, pro-bate court records, federal court records, and tax records. They may be able to assist you,if your own search attempts have not provided you with adequate information.
When you purchased your property, you may have hired a company to provide you with titleinsurance to prove that you had clear title to the land. In Colorado, title insurance compa-nies are now required by law to inform the title insurance purchaser if the mineral estatehas been either leased or severed from the surface estate. The title companies must alsoinform the purchaser that there is a substantial likelihood that a third party holds some orall interest in oil, gas, other minerals, or geothermal energy in the property; and that suchmineral estate may include the right to enter and use the property without the surfaceowner’s permission.381
For residents of other states, be aware that title searches may not include information onwhether or not you own the minerals. In many states, it is common for title companies toexclude research on mineral rights, mining claims, water rights, and other issues of con-cern. If you have already done a title search for your property, refer to the exclusion sectionof the title policy. If mineral rights are mentioned as exclusions, then it is unlikely that thisdocument will provide you with the information you need.
Make sure you find a company that will (and knows how to) include mineral rights in a titlesearch. Not all title companies have personnel trained in examining mineral ownership, soit is important to ask if they are qualified to examine this type of property. The companiesshould also be willing to “stand behind” their findings. Having a title company insure a min-eral title examination may be difficult, however, so find out in advance whether or not thecompany is willing to provide insurance. Alternatively, you can ask for a mineral guaran-tee, which will disclose any mineral reservations found in the “chain of title” (i.e., the list ofall people/entities who have held title to the property) since the land was first patented. Asmentioned above, a mineral reservation indicates that the ownership of the minerals hasbeen severed from ownership of the land. The interpretation of the mineral report, howev-
II-6
Legal and Regulatory Issues
er, can be complicated. Usually, if you order a mineral guarantee report from a title/abstractcompany, you will need to take that information to an attorney who can provide you with anopinion based on the findings in the report. If you get mineral title insurance, you do notnormally need to get the legal opinion.
Be aware that title searches can be expensive. One Montana titles searcher quoted his hourlyfee for producing a mineral report at $126.382 And there may be attorney fees on top of that.
4. You may want to consider hiring a landman. While landmen typically work for oil and gas companies, determining mineral ownership isa large component of their work, and experienced landmen should have significant expert-ise in determining mineral ownership. Also, landmen may be more affordable than titlecompanies, but unlike title companies they may not be able to guarantee their findings.
5. Find out if the minerals have been dormant, and for how long. As mentioned above, several states have laws that allow surface owners to claim mineralsbeneath their lands if those minerals have been dormant for a certain period of time. Theremay be other states that also have similar laws. Again, you will want to consult an attorneyto determine whether the dormant minerals now belong to you, or what steps you need totake to re-claim these rights.
Mineral Versus Surface Rights
If someone owns or leases the mineral rights to oil and gas beneath your land, he or she hasthe right to enter your property and search for minerals; and, if minerals are discovered, theowner then has the right to remove those minerals.
Depending upon the state that you live in, some or all of the following “rights” may be included in the search for and removal of minerals:
• the right to enter upon the surface for exploration and production of oil and gas
• the right to conduct geophysical exploration and seismic tests on the surface
• the right to mine caliche (dirt, gravel, etc.) for constructing roads, drill pads, etc. from thepremises
II-7
MINERAL VS SURFACE RIGHTS
The Rights
“In Manistee County, the Michigan Departmentof Environmental Quality (DEQ) has alloweddrilling in residential areas of natural gas wellsthat contain high concentrations of hydrogen sul-fide, a poisonous chemical. DEQ officials defendtheir action on the basis that the rights of miner-al and lease holders “must be respected.” Ineffect, they appear to be determining that thedrillers’ rights are more important than the rightsof residents.”
— Schneider, Keith.383
To find out which statutes and regulations apply to oil and gas in your state, contact the gov-ernment agencies listed in Chapter V. For a list of federal statutes that apply to oil and gas, seethe publication Preserving Our Public Lands (to obtain a copy, see Chapter V).
The following sections provide examples of various state, federal and county or municipalstatutes and regulations that provide some protections for surface owners.
Before reading about the potential regulatory protections for surface owners, it is important tonote that even though there are statutes and regulations on the books, it does not guaranteethat these protections will occur. Companies may fail to follow the laws, and their infractions maygo unnoticed by the government enforcement agencies. Or governments may turn a blind eyewhen companies break the law — either for political reasons, or because the agencies do nothave the staff to properly enforce the laws. Therefore, it is important for landowners to learn asmuch as they can about the laws and regulations governing oil and gas in their region. If landown-ers see that laws are being broken, they can pressure government agencies to enforce the laws.
STATE REGULATIONS
The oil and gas industry is regulated primarily at the state level. Whether the state, the federalgovernment or a private party owns the minerals, generally the mineral operator must adhereto state laws and regulations governing oil and gas development.394
Most states have agencies with the specific mandate to oversee oil and gas development. Forexample, many states have oil and gas commissions, which are empowered by the state gov-ernment to regulate the industry. Also, natural resources or environmental quality departmentsmay have the ability to regulate certain aspects of the oil and gas industry, such as discharge ofwastes. (A table of state regulatory agencies and contact information can be found in Chapter V.)
The following section provides information on how various states treat some issues that are ofconcern to surface owners. Selected examples are given of state regulations and requirements.It is not possible to include all regulations for all states in this guide. The purpose of the exam-ples is to provide the reader with an idea of the way in which different states regulate oil andgas development.
LeasingThe direct notification of individual surface owners typically does not occur when leasing ofstate or federal minerals occurs. Consequently, surface owners often do not realize that themineral rights have been leased to a company that may develop oil and gas on their land. Somestates do have processes for posting notices about lease sales on state lands. For example, thestate agency in Montana will post notices on its web site, in local newspapers and they will sendinformation about leases to a mailing list.395
The Interstate Oil and Gas Compact Commission has produced a table that summarizes stateoil and gas leasing information, including how the state agencies notify the public about leasesales. This table is available at: http://www.iogcc.state.ok.us/STATELANDLEASINGINFO.htm
II-11
REGULATIONS AND SURFACE
OWNER PROTECTIONS
Even thoughthere are laws or regulations on thebooks, it does notguarantee thatthese protectionswill occur.
II-12
Legal and Regulatory Issues
Shortage of State and Federal Oil and Gas Inspectors
A 2004 review of inspection and enforcement programs in five western states found thatalthough the number of active oil and gas wells in those states increased by 14% between 2000and 2004, the number of state oil and gas inspectors generally did not increase. On the feder-al level, Bureau of Land Management (BLM) field office inspectors conducted 33% fewerinspections in 2003 than they did in 1999. The chart below shows the average number of activewells per state and federal inspectors for the year 2003. From the chart, it is clear that in mostjurisdictions inspectors cannot possibly have time to inspect all active wells every year – giventhe fact that each inspection involves driving to the well site, conducting the inspection, andperforming any necessary paperwork and follow-up. Although state agencies have fewerinspectors relative to the number of active wells than the BLM, state inspectors conduct sig-nificantly more field inspections than their federal counterparts. State agencies inspect activewells once every 1-3 years, while BLM field office staff inspect active wells every 2-10 years(and inspect active wells for environmental compliance once every 4-5 years).
The above information comes from a report entitled Law and Order in the Oil and Gas Fields – A Reviewof Inspection and Enforcement in Five Western States. It was produced by the Western Organization ofResource Councils in November, 2004.396
Number of Active Wells Per Federal BLM Inspector (2003)
3310
1378
3247
296
4323
305
509
970
143
214
216
Colorado
Montana
New Mexico
North Dakota
Wyoming
Grand Junction, CO
Miles City, MT
Farmington, NM
Dickinson, ND
Buffalo, WY
Pinedale, WY
Number of Active Wells Per State Agency Inspector (2003)
Financial Assurance (Bonds)Typically, if oil and gas operators walk away from their operations (e.g., by declaring bankrupt-cy), the management of these orphan sites falls to the state or federal governments. Nearly allstates require that companies post a bond or another form of financial assurance with the stateto cover the costs related to plugging and abandonment of wells. These funds are collected toprovide the state with some “insurance,” in the event that a company is no longer willing or ableto perform the plugging and restoration. The funds are released back to a company if it prop-erly plugs and abandons its well. Proper abandonment typically includes the restoration of sur-face lands.408
Well depth and geographic location are two factors that play into the amount of financial assur-ance that state agencies require for plugging and restoration of individual wells. The amountvaries with well depth in fourteen states (Alabama, Arizona, California, Illinois, Kansas,Kentucky, Michigan, Mississippi, Missouri, Montana, New Mexico, New York, Utah andWyoming).410 Geographical differences in financial assurance are evident by comparing bondamounts in Kentucky and Alaska. In Kentucky a single bond for a well 500 feet deep or less is$500, while the minimum per well amount in Alaska is $100,000. This may reflect the highercosts of reclaiming Alaskan well sites.
In most states, companies are allowed to post state-wide or blanket financial assurances withthe state government. These blanket bonds are supposed to demonstrate a company’s finan-cial capability of plugging and restoring all of its wells in that state. The states vary greatly onthe amount of financial assurance required in a blanket bond. The amounts range from as low
II-17
REGULATIONS AND SURFACE
OWNER PROTECTIONS
State Financial Assurance Per Well State-wide Blanket Bond
Alaska $100,000 $200,000
California
$15,000 (wells < 5,000’ deep)
$20,000 (wells 5,000 – 10,000’)
$30,000 (wells > 10,000’)
$100,000 (50 or fewer onshore wells)
$250,000 (more than 50 onshore wells)
$1 million (all onshore and offshore wells)
Colorado $5,000 $30,000 (less than 100 wells)
$100,000 (more than 100 wells)
Illinois $1,500 (well < 2,000’ deep)
$3,000 (well = or > 2,000’ deep)
$25,000 for up to 25 wells
$50,000 for up to 50 wells
$100,000 for all wells in state
Kansas
$50 refundable fee (if operator has an
acceptable record of compliance)
$0.75 per foot drilled (for all the operator’s
wells)
$5,000 (1-5 wells that are <2,000’ deep ;
this increases to $20,000 for 25 or more
wells at this depth)
$10,000 (1-5 wells that are >2,000’; this
increases to $30,000 for 25 or more wells)
Kentucky$500 (wells = or < 500’ deep)
$5,000 (wells > 4,000’ deep) $10,000
Montana
$1,500 (well < 2,000’ deep)
$5,000 (2,000’ – 3,500’ deep)
$10,000 (3,501’ or deeper)
$50,000
New Mexico
$5,000 - $7,500 (well < 5,000’ deep)
$7,500 - $10,000 (5,000’ – 10,000’ deep)
$10,000 – $12,500 (well > 10,000’ deep)
$50,000
Ohio $5,000 $15,000
Oklahoma None. $25,000 OR financial statement showing
operator net worth of at least $50,000
Pennsylvania
$2,500 (this amount may be adjusted every
two years; different rules apply for wells
drilled prior to 1985)
$25,000 (this amount may be adjusted
every two years; different rules apply for
wells drilled prior to 1985)
Wyoming $10,000 (wells < 2,000’ deep)
$20,000 (wells > 2,000’ deep)$75,000 for all wells < 2.000’ deep
FIGURE II-6. VARIATIONS IN FINANCIAL ASSURANCE REQUIREMENTS FOR PLUGGING AND SITE RESTORATION. 409
as $5,000 in Kansas to as high as $1 million in California.
A recent study indicates that the costs of plugging and reclaiming a single orphaned well site inthe western states can range from $19,000 to $75,000.411 Based on these numbers, it appearsthat in most states financial assurance bonds are inadequate to cover the costs of properlyplugging and restoring well sites.
A striking example of the inadequacy of bond amounts comes from Wyoming. In 2001, thestate of Wyoming and the federal Bureau of Land Management (BLM) were left with an esti-mated $4 million in liability to plug and reclaim 120 wells abandoned by Emerald Restoration& Production. The government collected $125,000 in bonds from the company, which wenttoward plugging 56 wells on private land. The state Oil and Gas Commission used $2 millionfrom the state’s Conservation Fund to meet plugging costs that the bond did not cover. Thereare still more than 60 of Emerald’s wells on federal and state lands yet to be plugged.412
According to industry statistics, approximately 2 % of the three million wells (i.e., 60,000 wells)that have been drilled in the United States are considered orphaned.414 As already mentioned,it can cost between $19,000 and $75,000 to properly plug and abandon a single orphan well.That means that at the present time $1.1 billion to $4.5 billion of taxpayers’ money will have tobe spent to properly plug and abandon all of the orphan wells in the U.S.415
In some situations it can cost far more than $75,000 to properly plug and abandon a singleorphan well. To date, the Colorado Oil and Gas Conservation Commission (COGCC) has spentmore than $400,000 trying to plug an orphan gas well in La Plata County, Colorado.Unfortunately, COGCC’s efforts have not been successful, and the failure to plug the well hashad near tragic consequences.
On February 12, 2005, Charles Yoakum turned on his stove. All four walls of his trailer blewapart and the roof blew into the air. An orphan gas well, located about 250 feet fromYoakum’s trailer, is the likely source of methane that fueled the --.416 The orphan well hasa long history of leaking methane and fouling the groundwater in the Bondad area of LaPlata County. In 1994, the Colorado Oil and Gas Conservation Commission (COGCC) spent
II-18
Legal and Regulatory Issues
The cost of plugging and
reclaiming a singleorphaned well site
in the westernstates can rangefrom $19,000 to
$75,000.
Status of wells drilled in the U.S. since states began regulating oil and gas
Plugged or Abandoned
53%
Idle
10%Converted to
Underground Injection
Control Well
4%
Orphan
2%
Currently
Producing/Enhanced
Recovery
31%
Total: 3 million wells.
FIGURE II-7. STATUS OF THE THREE MILLION WELLS drilled in the U.S. since states began regulating oil and gas.
Source: Produce or Plug: A Summary of Idle and Orphan Well Statistics and Regulatory Approaches. 413
$200,000 trying to plug the well. After the explosion, the COGCC pledged to spend$200,000 more to identify the exact location of the well and of another orphan well in thearea, and identify any abandoned pipelines, utility corridors, or other potential conduits forgas migration. 417
Clearly, if states do not have enough money to put toward plugging all orphan wells, the wellscan become environmental problems and present health hazards to nearby residents. (See boxentitled “Bankrupt Companies Walk Away from Oil Wells in Texas.”) It is important, therefore,for surface owners to: 1) encourage governments to require adequate bonds, and/or 2) includea financial security provisions in Surface Use Agreements. With these measures in place, therewill be some assurance that companies —not the surface owners or the public— will bear thecost of adequately plugging and cleaning up well sites.
II-19
REGULATIONS AND SURFACE
OWNER PROTECTIONS
FIGURE II-8. REMAINS OF A TRAILER IN LA PLATA COUNTY, CO. The trailer exploded due to methane that
most likely came from an inadequately plugged orphan well. Photo Credit: Yodit Gidey, Durango Herald.
Chapter IIITips for Landowners
WHAT TO DO WHEN THE LANDMAN COMES CALLINGThis section provides surface owners with suggestions on how to respond to the initial visitsfrom oil and gas companies.
SURFACE USE AGREEMENTSOne of the tools available for protecting surface property and surface owner quality of life is theSurface Use Agreement. This section examines the pros and cons of negotiating these agree-ments, and provides samples of what others have been able to negotiate.
LEASINGThe information in this section is geared toward those fortunate enough to own mineral rights.Mineral owners have the option of leasing or not leasing the minerals to oil and gas companies.If they choose to lease, there are some tips contained in this section to help ensure that thelease meets their needs and protects their interests.
OTHER ACTIVITIES LANDOWNERS MAY WANT TO CONSIDERThe final section of this chapter provides additional strategies and tools for surface owners con-fronted with oil and gas development. Some of these strategies include pushing for reform ofoil and gas laws and regulations, taking companies to court, and working with other landown-ers to pressure companies and governments to carry out responsible oil and gas development.
What to do When the Landman Comes Calling
What is a landman? A landman is the name given to a man or woman who serves as the company’s contact personwith the public who may be an employee or contractor with the oil or gas company. Some of thetasks that landmen perform include: researching courthouse records to determine mineralownership; locating mineral/landowners and negotiating oil and gas leases and other agree-ments with them; and conducting surface inspections before drilling.449
What to do if contacted by a landman
1. When interest develops in your minerals, you may be approached by phone, mail, or in per-son. The landman or lease broker may determine your interest in leasing by quoting youan offer. You should write the offer down or get it in writing.
2. Do not sign or agree to anything (e.g., a lease or surface use agreement) without under-standing the terms of the agreement or getting professional advice. You may want to con-tact an attorney or organizations that work with landowners. You may want to talk withyour neighbors and others who have been in negotiations with oil or gas companies. It maybe helpful for you to read through the landowner profiles that are scattered throughoutthis document. The lessons learned by others may help you to figure out your own strate-gy for dealing with oil and gas company representatives.
III-1
III
3. Stand your ground. Some landmen may use intimidation tactics or threats to pressure youinto signing an agreement. For more information on intimidation tactics, see the story“Threats and Intimidation: This is Negotiation?” and also Peggy Hocutt’s story, in ChapterIV.
4. Put together a list of issues important to you before you begin negotiating with the land-man. Remember, everything except your name and the legal description of the property isnegotiable.
5. At any meeting with a landman, document as much as you can. Take notes, or better yet,tape record your meetings. Or have someone else sit in as a witness.
6. Understand who it is you are dealing with. Research the oil or gas company’s track record.Talk with neighbors and other landowners who have had to deal with the same company.Find out, if you can, details of agreements reached between the company and other sur-face owners (e.g., if they offered to test your neighbor’s well water, they should do thesame for you).
• The Colorado Oil and Gas Conservation Commission (COGCC) maintains a databaseof incidents and complaints. You can look up information on a specific company, e.g.,how many violations they have had, and how the company responded to complaints.Also, the database has information on inspections, notices of alleged violations, andspills. It can be found at the COGCC website, under “Database.” (http://oil-gas.state.co.us/). There may be similar databases in other states. Contact your stateagencies to find out.
7. Consider signing a lease or negotiating a Surface Use Agreement (both are discussedbelow). If you are going to sign a lease, consider negotiating the Surface Use Agreementeither before or at the same time that you negotiate the lease.
III-2
Tips for Landowners
Knowing Your Landman
You may want to ask your landman if he or she is a certified landman, and whether or not heor she belongs to any professional landmen associations, the largest one being the AmericanAssociation of Professional Landmen (AAPL). Many of these associations have codes ofethics that landmen agree to follow. For example, the AAPL Code of Ethics state that:
The Land Professional, in his dealings with landowners, industry parties, and othersoutside the industry, shall conduct himself in a manner consistent with fairness andhonesty, such as to maintain the respect of the public.
If you believe that the land professional has used intimidation tactics, or has lied to you duringthe negotiations, you should call the landman’s association and report the incident. For exam-ple, the AAPL has an Ethics Committee to which you may direct complaints. Their address is:American Association of Professional Landmen. Ethics Committee. 4100 Fossil Creek Blvd.Fort Worth, TX 76137. Phone: 817-847-7700.
ment payments. For example, they might be willing to pay a percentage overriding royaltyto split estate owners, if it were in lieu of surface damage payments.
• Some companies recognized that the actual implementation of the surface use agree-ment was a potential area of conflict. Some felt that giving the landowner a single, localpoint of contact for the agreement would be good. Others did not necessarily provide forthis in the agreement, yet said that they believed that landowners prefer companies whohave a local office or point of contact. Some company representatives also stated thatmore authority should be given to local company staff to resolve disputes.
How to Determine Reasonable CompensationOften, there is no equality in the amount of compensation received from one landowner to thenext, or from one region to the next. Also, it is not always easy to find out how much you shouldbe asking for. Often, there are clauses in surface use agreements that prohibit surface ownersfrom disclosing the details of their agreement. This makes it extremely difficult for landownerswho are negotiating a surface use agreement to know what is reasonable, or to try to negotiateagreements similar to what their neighbors have negotiated. Still, that should not preventlandowners from talking with other landowners or attorneys, and trying to find out what level ofcompensation others have been able to receive.
Navajo landowners not receiving the “fair market value” for leased land
Many natural gas pipelines that originate in the San Juan Basin of Colorado and New Mexico crosslands owned by Navajo tribes, individual Navajo landowners, and non-Native landowners. InAugust of 2003, it was brought to light that some Navajo tribes and individuals in the region werenot being compensated for pipeline rights-of-ways at the same rate as private landowners. A reportreleased by a court-appointed investigator revealed that the U.S. Department of the Interior leasedNavajo land to oil and gas pipeline companies for as much as 20 time less than the amounts paidto nearby private landowners. “It is doubtful,” wrote the investigator, Alan Balaran, whetherNavajos “are receiving ‘fair market value’ for leases encumbering their land. It is certain they aredenied the information necessary to make such a determination.”458
On an annual basis, private landowners who leased their land to oil and gas companies receivedbetween $432 and $455 per rod (16.5 feet) of land leased; Navajo Tribes negotiated payments ofbetween $140 and $475 per rod; andindividual Navajo landowners onlyreceived from $25 to $40 per rod.Using these figures, over the 20-yearlife of the leases, individual Navajolandowners could receive $11,000less than their private landownerneighbors. According to a DenverPost article, because the InteriorDepartment did not provide transla-tors for the pipeline right-of-waynegotiations, “some of the individualNavajos put their thumbprints ondubious leases they couldn’t read andnever had explained to them.”459
III-9
SURFACE USE AGREEMENTS
The government in Alberta, Canada, has prepared information for surface owners on how todetermine adequate compensation payments.460 Alberta is a major oil and gas producingregion, and oil and gas companies that operator there are required to negotiate a “surfacelease” with the surface owner (similar to the mineral lease that is negotiated with a mineralowner). In fact, companies are not allowed on a surface owner’s property, except to conductthe land survey, until the lease has been negotiated, signed, and the first-year compensationpaid. Although prepared for Alberta landowners, the guidelines below may provide landownersin the United States with a starting point for assessing how much to ask for in compensation.
The dollar amounts are in Canadian dollars ($1 Canadian = approximately $0.83 U.S.).
III-10
Tips for Landowners
Entry Fee
The entry fee is $500 (approximately $415 U.S.) per acre of land granted to the
company, to a maximum of $5,000 when 10 or more acres are used. The minimum
entry fee is $250, paid when the area is half an acre or less.
� For example, if a company uses 4.25-acres, the entry fee would be: 4.25
acres x $500 = $2,125
*Note: the entry fee for many U.S. states is higher than this amount. For example, in
Wyoming the initial payment, which is akin to this entry fee, is closer to $2,000 (US) per
acre.
Land Value
The value of the land used by the company is determined by the price expected if the
land were sold on the open market by a willing seller to a willing buyer at the time when
the lease was prepared. The value is also based on the highest approved use
(agricultural, industrial, residential) for the land.
� The per acre value for the well site is determined by dividing the value of the
titled unit by the number of acres required.
InitialNuisance, Inconvenience and Noise
This payment is for nuisance during the first year of the lease.
� For example, in the first year landowners likely have to spend time dealing
with a company's representatives and surveyors, preparing documentation,
negotiating with the company and/or seeking advice from government
agencies or lawyers. There may also be noise and inconvenience related to
construction. The company should pay reasonable compensation to you for
nuisance. Keep a record of all time spent, phone calls made and expenses
incurred.
Loss of Use of the Land
The company pays an annual compensation for loss of the normal use of the well site
area during the well site's life. The amount should approximate the value of the gross
annual production reasonably expected from the area.
� To calculate the amount, use the greater of yield and price averages from the
past five years, or today's street price. For example, assuming canola
production at 35 bushels per acre on a well site and access road occupying
four acres, the loss would be 4 x 35 = 140 bushels. At $8.50 per bushel, the
total annual loss would be $1,190.
Adverse Effect
This payment is related to inconvenience, nuisance and extra costs on the rest of the
quarter section where the well site is located.
� For instance, farming around the well site may require constantly turning
corners, which can cause overlaps, extra strain on machinery, soil
compaction, loss of seed and grain, and extra field and labor costs. Other
factors related to adverse effect can be noise, dust, odor, additional traffic on
the land, and proximity to a residence or farm site.
Other Relevant Factors:
If there are other considerations specific to a landowner’s situation, they should be
included when negotiating compensation.
FIGURE III-1. ISSUES TO CONSIDER WHEN DETERMINING SURFACE DAMAGE COMPENSATION PAYMENTS.
Reported Compensation AmountsThe following information comes landowners, real estate brokers, attorneys, mineral royaltyassociations, and community organizations.461 This information is meant to provide surfaceowners with an idea of what others have been able to negotiate in various parts of the country.The chart is by no means comprehensive — undoubtedly, some surface owners in these areasreceive more or less compensation based on their particular circumstances.
III-11
SURFACE USE AGREEMENTS
Location Item Compensation
Sublette County, WY Surface damage payment per well $2,500
Wyoming Initial payment per well site (1/2 acre)
Annual payment
Use of existing roads
$1,000
$1,000
$1,000
Wyoming Initial payment per well
Roads and pipelines
4” pipeline – initial payment
4” pipeline – annual payment
8” pipeline – initial payment
8” pipeline – annual payment
$1,000 - $1,500
$5-$10/rod (1 rod = 16.5 feet)
$8/rod
$4/rod
$16/rod
$8/rod
Weld County, CO Surface damage payment per well site
(2 acres)
4” pipeline
$4,000 - $5,000
$33/rod
La Plata County, CO Surface damage payment per well
(well site 6/10 acre), plus payments for
roads, pipelines and compressor sites
16” inch pipelines
$5,000 - $35,000
$1-$86/rod
Las Animas County,
CO
Well site (7/10 acre)
Access road
$2,000 - $2,500
$25/rod
Oklahoma Payment for well pad and access road
(appraised value)
$7,500 - $8,600
Kansas Well site damages
8” pipeline
$5,000 - $10,000
$30-$35/rod
FIGURE III-2. EXAMPLES OF COMPENSATION PAID TO SURFACE OWNERS IN VARIOUS PARTS OF THE U.S.
The following chart (Figure III-3) contains information gathered by the Powder River BasinResource Council. It shows compensation amounts that some Wyoming landowners were ableto negotiate for lands affected by coalbed methane development in the year 2000.462
How much does compensating surface owners affect a company’s “bottom line”?According to the Landowners Association of Wyoming:
Surface Owner Accommodation legislation, whether enacted by a ballot initiative or by thelegislature, will have no significant impact on revenues generated by Wyoming’s oil andgas industry. It may require some additional monies to be spent by the oil and gas indus-try to compensate the private landowner for losses due to their activities, but those lossesare currently being borne by the private landowners—individuals who in no way caused thelosses. Currently, Anadarko Production, a top 15 producer, voluntary grants a 1-3% royal-ty interest in the production to the surface owners on the Union Pacific lands in Wyoming’ssouthern corridor. Clearly, compensating landowners for damages caused by oil and gasactivities can go hand-in-hand with being a prudent and successful oil and gas operator.
An average well on the Pinedale Anticline in Sublette County costs $2.5 million to drill andcomplete. Currently companies operating in that area offer $2,500 per well location fora surface damage payment which equates to 1/10th of 1% of the cost of that well goingto the affected surface owner. If negotiations ensured by this legislation result in a high-er surface damage payment – say even 10 times higher in the extreme case – the sur-face damage payment would still be less than 1% of the total cost of drilling that well. Inthis example, the total surface damage payment of $25,000/location would be 3/4 ofone day’s revenues of a well that is estimated to produce for 20 years. Looking at thisanother way, the overall IRR (internal rate of return) for this well would be reduced to25.0% from 25.5% as a result of this higher surface damage payment.463
III-12
Tips for Landowners
Item Compensation
Right-of-way easements $3.00 - $3.50 per rod (1 rod = 16.5 feet; 320 rods = 1 mile)
24-inch diameter pipeline $13 - $25 per rod
8-, 10- or 12-inch diameter pipelines $13 - $15 per rod
4- or 6-inch diameter pipelines $6 - $8 per rod
Small waterlines, e.g., 2-inch diameter $0.00
Trenches/electrical between well-heads $0.00
Above-ground power lines and poles Same as the power company’s going rate
Pod Building - meters production, 10 x
12 feet and 8 x 12 feet
$1000/year
Screw compressors – 20 x 40 feet
(1 per 8 wells), rented by the acre
$2150/acre for the first year, and then $1200 - $1500/acre for
every year thereafter
Large Compressors
This example is for a compressor on a
3.67-acre compressor site.
Chain link fence, gravel road to site.
Road - $5 per rod per year
Compressor - $1300 per acre/year (for five years), with an
increase of $500/acre for each additional 5-year renewal period.
Reseeding - $325/acre – landowner pays for seed and uses own
equipment
Receipt Stations – where production is
metered. These stations may include
several buildings taking up a 15-foot x
35-foot area.
$1500 per year, paid 5 years in advance. Rental fee is tied to
Consumer Price Index, so the initial rental is $7500 after the first
5 years are over. The agreement reflects that $1500 per year is
the least the landowner will be paid.
Wells $500 - $1500 per well for the first year. Every year after that,
landowner receives an annual payment of $700 to $1000.
FIGURE III-3. EXAMPLES OF COMPENSATION RECEIVED FOR SURFACE DAMAGE RELATED TO COALBEDMETHANE DEVELOPMENT.
Examples of Surface Use AgreementsThe following are some examples of Surface Use Agreements, which will not only provide youwith some guidance on what to ask, but also will help to familiarize you with the language usedin these sorts of agreements. The first agreement is a copy of a surface use agreement fromWyoming, which includes clauses that might not be present in the standard agreements thatcompanies ask surface owners to sign. This agreement comes from the Powder River BasinResource Council web site. This web site also has sample pipeline and right-of-way agreements(see Chapter V for details).
The second agreement is a Mineral Extraction Agreement (MEA) between Ted Turner and ElPaso Production Corporation. While not perfect, there are clauses in the Vermejo Park RanchMEA that are prime examples of how a company can minimize the impact of coalbed methanedevelopment on landowners’ lives and lands. Ted Turner managed to achieve this agreementwithout owning the mineral beneath his land. He does, of course, have the financial leverage tonegotiate this very landowner-friendly agreement. But this fact should not prevent otherlandowners from attempting to negotiate similar provisions in their surface use agreements.
III-13
SURFACE USE AGREEMENTS
FIGURE III-4. CASTLE ROCK, VERMEJO PARK RANCH. Directionally drilled wells access gas beneath this importantelk habitat. Photo used with permission from Vermejo Park Ranch.
analysis indicates that a project would exceed the exposure limits in the event of an accident,the township would deny the required land use permit. 2) Implement an effective emergencywarning system. 3) Inform the township about hazardous materials used on the site.
• Colorado communities gain some ability to regulate oil and gasIn Colorado, courts have ruled that local governments, as well as the state gov-ernment, have the ability to regulate oil and gas companies. The ColoradoAppeals Court decided in 2002 to uphold a trial court ruling in a case betweenthe town of Frederick and the oil and gas operator North American ResourcesCo. (NARCO). The town had passed an ordinance requiring gas and oil com-panies to obtain a special use permit to drill in town, and pay an applicationfee of $1,000; as well as requiring certain setbacks, and noise and visualimpact mitigation, among other things. NARCO went ahead and drilled a wellwithout getting a permit from the town. The town initiated a court action, andthe trial court stopped the operation of the well and ordered the company toeither remove the well or get the required permit from the town. The case wentto the Colorado Appeals Court. The Appeals Court ruled that Colorado com-munities, including counties, can regulate oil and gas wells, as long as the reg-ulations do not conflict with state laws.475 The court acknowledged that town’sordinances may delay drilling, but upheld the regulatory scheme as a wholebecause the ordinances did not allow the town to prevent drilling entirely or toimpose arbitrary conditions that would materially impede or destroy thestate’s interest in oil and gas development.476
Examples of conflicts between town ordinance and state laws:
• the regulations of setback requirements, noise abatement, visualimpact of oil and gas operations, and the authority of the town to assessadditional penalties for violation of state rules.
Examples of acceptable community ordinance provisions:
• requiring companies to obtain a special use permit. The court said thatthis did not conflict with the state’s objectives even though it couldresult in a delay in drilling.
• requiring an inspection fee and a $1,000 application fee, because therewas no state rule on the amount a local government could charge forthese fees.
• requiring building permits for above-ground structures, access roads,and emergency response and fire protection plans and costs, againbecause there was no state rule that created an operational conflictwith the town’s rule.
• Residents of Matunuska Susitna Borough in Alaska press for, and get, progressivelocal regulations on mineral leasing and development.In 2003 Evergreen Resources purchased coalbed methane leases in the MatanuskaSusitna (Mat-Su) Borough area of Alaska. Property owners were alarmed to find that Statelaw allowed for permitting of these leases with no public notice. Citizens in the region tookit upon themselves to became more and more educated on CBM development, invitingOGAP to Alaska to deliver landowner workshops. Eventually, public outcry against the leas-ing practices of the state led the Alaska Department of Natural Resources to hold a seriesof public meetings for the purpose of developing operating standards for the leases.
After more than a year of controversy surrounding the CBM leases, Pioneer Natural
III-31
OTHER ACTIVITIES TO CONSIDER
The state of Colorado failsin its bid to limit local
regulation of oil and gas
In 2002, the state agency that over-sees oil and gas development, theColorado Oil and Gas ConservationCommission (COGCC), amended arule saying that state drilling per-mits would take precedence overany county permit or land-useapproval process. This amendmentwas challenged in court by LaPlata, Archuleta, Las Animas,Routt and San Miguel counties.
In September, 2003, the ColoradoCourt of Appeals ruled 2-1 that theCOGCC overstepped its authoritywith the amendment, which thecourt said pre-empted county land-use rights; and the amendment wasdeclared invalid. The two appealscourt judges who ruled in favor ofthe counties wrote that counties“have a legally protected interest inenacting and enforcing their land-use regulations governing the sur-face effects of oil and gas opera-tions.”
Colorado Court of Appeals, September25, 2003.477
Resources announced that the Mat-Su leases acquired through its merger with EvergreenResources would be relinquished to the State. Despite the return of the leases, the Mat-Su Borough Assembly took steps to prevent a situation of this magnitude happening in thefuture. Members of the Borough Assembly traveled to the lower 48 to visit areas with CBMdevelopment and talk with local governments about oil and gas regulations. In the fall of2004, the Borough Assembly passed a CBM ordinance with several progressive provisions,for example, requiring ground and surface water monitoring plans, and allowing a surfaceowners to deny access until a surface use agreement is signed. The Mat-Su ordinance isavailable on-line at: http://www.matsugov.us/Assembly/documents/04-175AMor.pdf
Industry Will Try to Push BackCitizens and local governments must anticipate that industry may object to any additional reg-ulations that impose a perceived burden on the way that they do business. There have beenmany cases where citizens have made some strides in surface owner and environmental pro-tection, only to have the industry use their clout to have the protections removed.
• Exploratory wells allowed in a sensitive watershed, despite community opposition.In 2002, in Delta County, Colorado, local citizens groups such as the Grand Mesa CitizensAlliance, worked hard to organize old-time farmers, ranchers, fruit growers and others toconvince county commissioners to reject well applications that threatened the water sup-ply in their county. County commissioners denied four of five applications by GunnisonEnergy to drill exploratory coalbed methane gas wells. One Delta County Commissioner saidthat the wells were denied because they were in the middle of the county’s watershed. Theone well that was approved was located in a remote end of the county where domesticwater supplies would not be threatened. The decision went against an earlier decision bythe state Oil and Gas Commission, which approved the exploratory drilling.478 The countyalso imposed a moratorium on drilling, pending further study of impacts on the water sup-ply, largely due to the efforts of the Western Slope Environmental Resource Council.479
Legal actions were initiated by Gunnison against the county, and Delta county against theColorado Oil and Gas Conservation Commission. In 2003, a Denver District court ruled thatthe county did not have jurisdiction to deny the permits on the basis of water quality orquantity concerns, and Gunnison was issued its permits.
• Oil and gas industry tries to remove ability of local governments to regulate oil and gasin Kentucky.”In early 2003, the oil and gas industry drafted a bill to remove virtually all ability forKentucky counties to adopt any ordinances related to oil and gas development. At the time,the law gave counties broad powers to protect public health, safety and the environment,as long as the county’s regulations did not conflict with state laws.
The issue that prompted the bill was that Letcher County, Kentucky was considering pass-ing an ordinance regulating the placement of “gathering lines” used to gather gas and oilfrom wells, due to abuse of landowners’ rights. Rather than suggesting that the state imple-ment a program to address the issue of gathering lines (e.g., make the industry account-able to surface landowners for the damage caused when gathering lines are located), theoil and gas industry simply proposed a bill to remove local government authority over allaspects of the industry.
In February, 2003, the Kentucky Legislature passed the bill, despite citizens’ attempts tostop it.480 Continued citizen action helped to force some amendments to the bill, and inMarch, 2003, the Senate passed an amended bill that allows local communities to adoptordinances that regulate oil and gas exploration, production, development, gathering andtransmission, if they do so through community planning and zoning processes. The Senate
III-32
Tips for Landowners
opment in their backyards. This is why we are one of the founding members of the MichiganEnergy Reform Coalition. MERC has provided our township with a statewide view of things, andhas given us the access to information and expertise vital to making intelligent decisions.
One of the main reasons our township has been instrumental in MERC is because the issuessurrounding oil and gas development are too big to confront alone. MERC shares our goal -- tocreate a cooperative partnership with the oil and gas industry that will insure reasonable indus-trial development in our neighborhoods.
It comes as no surprise that some members of the oil and gas industry are loudly complainingthat the proposed legislation will put them out of business, and that MERC’s hidden agenda isto stop oil and gas development. We have heard these ridiculous accusations before. And wehave learned our lesson, which is to let reality take its course, to stick to the truth, to be patient,and with time, our reasonable demands will be met.
The days of letting the oil and gas companies and the GSD behave like dictators are over. Thedays of companies ignoring the people who live and work amongst their projects are over!
The bills currently under consideration by the Legislature are for minimum changes that arelong overdue. They are just the start of a process of insuring that townships, counties, and cit-izens have a say in the health, safety, and quality of life in their communities. We hope our leg-islators see that these bills become law.
Reprinted with permission of the Michigan Land Institute.
15. LAURA AMOS: HYDRAULIC FRACTURINGFAMILY’S WATER WELL WAS CONTAMINATED AFTER HYDRAULIC FRACTURING NEAR THEIR HOME.
By Laura Amos
My husband Larry, our daughter Lauren and I live south of Silt in the heart of what we call Encana’sIndustrial Wasteland. We were among the first in our area to have natural gas drilling on our prop-erty. We are among the unfortunate who do not own the mineral rights under our property. The“Good Faith Negotiations” required by the Colorado Oil and Gas Conservation Commissionaddressed none of our concerns. Encana sent to our home a nice old gentleman who sat at ourkitchen table and told us more or less, “I feel for you, but you own the surface, we own the min-erals, and we’re coming in to drill. Here’s the Surface UseAgreement, you can sign it, but you don’t have to. If you signit you get a check for $3000. If you don’t sign you get nofinancial reimbursement for any damages that may occur.”We hesitated to sign for a couple of weeks until we learnedthat what he was telling us was accurate—the law provided usno protection, no mediation, and no real power to negotiate.It also now appears that others who do not own the mineralrights under their land were also bullied.
In May 2001 while fracturing four wells on our neighbors’property (less than 1000’ from our house on what’s known asthe G33 pad), the gas well operator ‘blew up’ our water well.Fracturing created or opened a hydrogeological connectionbetween our water well and the gas well, sending the cap ofour water well flying and blowing our water into the air like ageyser at Yellowstone.
IV-23
Immediately our water turned gray, had a horrible smell, and bubbled like 7-Up. Water productiondropped drastically from 15 gallons per minute to nothing or near nothing. Tests of our watershowed 14 milligrams (mg) per liter of methane. That’s almost as much methane that water willhold at our elevation. But the Colorado Oil and Gas Conservation Commission (COGCC) claimedthat the methane was “transient” in nature. We were assured that methane is safe, that in factour bodies produce it naturally, and that there are no known health effects. We were warned, how-ever, to make sure there were no closets or pockets in our home where the gas could build up andexplode. They tested the water in our well a couple more times that summer, ending in August2001.
In the spring of 2003 I became very ill. I spent months in doctors’ offices and hospitals. I waseventually diagnosed with Primary Hyper Aldosteronism, a very rare condition of a tumor in myadrenal gland. None of my doctors had any idea of how I could have acquired such a rare disease.The tumor and my adrenal gland had to be removed. As a result, I am concerned that my immunesystem is now compromised, as well as the other endocrine related systems that are linked withthe adrenal glands.
For more than two years my husband and I felt more or less abandoned by the COGCC. Weresolved nothing. In January 2004 I had had enough and decided to become better informed andmake others aware of my predicament. I started my 1st letter-writing campaign. The gas com-mission came back, tested again, and again found 14 mg of methane per liter in our water. Theydetermined that it was Williams Fork Formation gas, a Notice of Alleged Violation was issued toEncana, but no fine was administered by the COGCC.
In August 2004 I came across a memo written to the US Forest Service and BLM Regional officesin Delta County, describing the health hazard posed by a chemical used in fluids that are injectedunderground to enhance the release of methane. Dr. Theo Colborn of Paonia, Colorado submit-ted the memo in response to decisions that were being made in Delta County by the governmentofficials to allow gas exploration and development on the Grand Mesa. Colborn is the Presidentof the Endocrine Disruption Exchange, Inc (TEDX) and for over 10 years directed the World WildlifeFund’s Wildlife and Contaminants Program. She has been honored worldwide for her focus on theeffects of synthetic chemicals on human and wildlife health. The focus of Colborn’s memo wason a chemical called 2BE, used in fracturing fluids.
The following information was taken from Colborn’s report: “2BE is a highly soluble, colorless liq-uid with a very faint, ether like odor.” She wrote that at the concentration to be used in Delta coun-ty 2BE might not be detectable through odor or taste. “2-BE has a low volatility, vaporizes slowlywhen mixed with water and remains well dissolved throughout the water column.” “It mobilizes insoil and can easily leach into groundwater.” “It could remain entrapped underground for years.”She noted it is readily absorbed by the skin and can easily be inhaled as it off-gasses in the home.Colborn cited the Agency for Toxic Substances and Disease Registry Profile that listed the follow-ing effects of 2-BE: kidney damage, kidney failure, toxicity to the spleen, the bones in the spinalcolumn and bone marrow, liver cancer, anemia, female fertility reduction, embryo mortality, andthe biggie that got my attention…elevated numbers of combined malignant and non-malignanttumors of the adrenal gland.
Of course that sent up a huge red flag! I have had no peace of mind ever since. Remember thatfrom August 2001 until January 2004 no testing was done on our water. Our daughter was only6 months old when fracturing blew up our water well. I bathed her in that water every day. I alsocontinued breast-feeding her for 18 more months until she was 2 years old – during the time thetumor was developing in my adrenal gland. If there was a chemical in my body causing my tumor,she was exposed to it as well. She was in contact with the chemical through every possible expo-sure pathway.
IV-24
Landowner Stories
After reading Colborn’s memo, I tried to find out if Encana used 2BE in fracturing. Encana’sspokesman, Walt Lowrey, assured several of our neighbors, and my husband and me that 2BEwas NOT used. In addition, Lowrey told many reporters in western Colorado, Denver and theAssociated Press that 2BE was not used on the pad, or anywhere in this area.
However, on January 31, 2005, I learned that the industry had not been telling the truth to all ofus. In June 2001, five weeks after the operator and the COGCC knew that there was a connec-tion between the gas well and my water well, they proceeded to fracture wells on the G33 padagain. It was reportedly an experimental fracture, a new idea to fracture into the Wasatch for-mation, the same formation that our water comes from. They fractured 2000 feet below the sur-face, and they DID use 2BE. Encana is now delivering us alternative water for use in our home,but we are concerned that our well water may never be safe again.
I am ONE MAD MOTHER who intends to continue to challenge the system that allows average cit-izens to be ignored and trampled on, without consideration for their health, their children’s health,and life-long investments. I am ONE MAD MOTHER who believes it is the role of government toprotect the average citizen. I believe that I should have the support and concern of the COGCC,but that is far from the case. Instead, it is obvious that the COGCC is continuing to be more con-cerned with corporate interests. In fact, Brian Macke, director of the COGCC recently told a CBSNews Bureau Chief in Washington D.C. that I am crazy, and that my exposure to 2BE may havecome from Windex!
Surface owners need some protection and some power in dealing with huge corporations whocare only about profit. I am not the only person who believes her health has been compromisedbecause of gas development in Garfield County. There are many others out there who feel thatthey have been violated. Giving surface owners some legal rights to protect themselves and theirproperty is critical in order to prevent more situations like mine.
16. COMPANY’S THREAT TO BOND AND DRILL IS NOT NEGOTIATING IN GOOD FAITH.THE FOLLOWING LETTER WAS WRITTEN TO ASK COLORADO LEGISLATORS TO SUPPORT A BILL THAT WOULD PROVIDE PROTECTIONS FOR SURFACE OWNERS.
By Bruce Thomson
I'm writing in hope that my story of working with BP Amoco will help persuade you to support theCurry Surface Owners Compensation Bill.
My background is as a CPA, small business owner, and sometimes real estate developer. Alongwith my wife, I own 157 acres about 15 miles east of Durango that we plan to develop. The landhas been conceptually approved by La Plata County for 10 residential lots.
In 2000, we received notice from BP Amoco of their intention to drill another gas well on our land(there was one on the property when we bought it). I specifically asked to work directly withwhomever was authorized to make final decisions regarding well placement, pad size, noise miti-gation, compensation, etc. I was told that Ralph Chamberlain of Timberline Land Corporation wasthe man for me to work with. After many hours of work and numerous walks on the land, Ralphand I agreed to a pad location and size with specific protection for about a dozen very nice, largePonderosas.
Then I got a call from BP Amoco, from the man for whom Ralph was working. This company rep-resentative said that what Ralph and I had agreed to had no standing and that BP Amoco and I
IV-25
would have to begin all over again on working through well placement, pad size, etc. In my mind,this was an egregious breach of good faith. If I had been working with a building contractor in anarm's length transaction, I would have severed the relationship immediately and refused to dobusiness with them.
But as I was reminded by BP Amoco in every phone conversation, letter, and meeting at that time,I had no choice but to do business with them and if I didn't cooperate, they didn't need to do busi-ness with me and they would simply 'bond and drill'. 'Bond and drill' became the gun to my headthat made me realize that I could only ask for or resist very little and then I'd better shut up.
As it turned out, BP Amoco drilled the well in approximately the location that Ralph and I hadagreed to, but with a much bigger pad size so that we lost those dozen or so Ponderosas closestto the gas well that we had hoped to protect. I can't tell you specifically what compensation orpromises of mitigation my wife and I got from BP in our Surface Use Agreement because I am legal-ly bound to confidentiality by the agreement itself, but I can tell you that the money doesn't comeclose to compensating us for the damage to the surface and the promises of mitigation are pret-ty much non-existent.
I was opposed to the agreement confidentiality pro-vision because I would like to be able to share theexperience I had with BP Amoco with other landown-ers facing the same situation and perhaps helpthem, but again BP Amoco held the gun to my headand I was forced to leave the confidentiality provisionin the agreement. My relations with BP Amoco wereand continue to be very cordial, but there's alwaysthe implicit understanding that the game is rigged intheir favor and I'd better cooperate or else.
I am a businessman and I believe in the free market.I believe that BP Amoco has the right to profit fromtheir mineral rights, but I also believe that I have theright to enjoy and profit from my surface rights. Bydrilling a gas well on my land without adequately
compensating me for surface destruction or protecting against noise or other pollution related tothe gas well, I have been denied a portion of my surface rights.
The 10 lots that I will develop on my land will now all have a reduced value because of the prox-imity of the gas wells and it will be my family and not BP who suffers that financial loss.
I ask you to please support the Curry Surface Owners Compensation Bill to help level the playingfield between gas well operators and land owners.
Don't let gas well operators continue to exploit their mineral rights at the expense of land owners'surface rights.
Thank you,
Bruce M. Thomson
IV-26
Landowner Stories
17. WYOMING LANDOWNERS FACE CONDEMNATION OR LOSS OF HOME-OWNERS’ INSURANCE
By Dan and Barbara Renner
Under the current laws of the State of Wyoming, Landowners who own their surface but not theminerals lying underneath (commonly referred to as split estate) face a desperate decision: Eitheragree to allow a seismic company to place explosives on your property and detonate them, or becondemned under eminent domain.
But wait, there’s more...Should the landowner agree to allow the explosive seismic testing to takeplace in order to avoid condemnation, they may lose their homeowners’ insurance. So, what doyou do? You call the Governor, right?
In June 2004 the residents of Clark, WY, a small community on the outskirts of Yellowstone Park,received notification of a pending 3-D seismic testing project in a 47 square mile area that encom-passed much of the Clark community. Quantum Geophysical, Inc., based in Houston, TX, was con-tracted to perform the 3-D seismic testing and proposed 3,420 seismic shotholes in and aroundClark. This proposed activity is unusual in that Clark is a residential community encompassingapproximately 350 private landowners and this activity will take place in their front yards!
In addition to the seismic testing, Windsor Wyoming, LLC, an oil and gas developer based inOklahoma City, has applied to the BLM and the State of Wyoming for permits to install approxi-mately 20 miles of pipeline across public and private lands, as well as the Clarks Fork River, andconstruct a gas separation plant in Clark. Again, this exploration and development activity, willtake place in the front yards of Clark’s residents. Such activity is not unknown in the area —Windsor has taken over the operation of an abandoned well site that sits just one-quarter mile of5 homes. But residents in the area had not realized until recently that all of this activity, particu-larly explosive seismic testing, places them jeopardy when it came to homeowners’ insurance.
Much of the private land in the Clark area overlies minerals owned and leased by the federal gov-ernment. Under Wyoming law, the mineral owner (or the mineral lessee) holds a superior positionto that of the surface owner. Surface owners in Wyoming are required by law to allow open accessto their lands by the oil and gas industry for the purposes of exploration and development.Attempts to block or inhibit that access will result in condemnation procedures against the surfaceowner.
In January 2005 Quantum Geophysical began to contact, via telephone and mail, residents in theClark area regarding the not yet permitted seismic testing they had been hired to conduct. One ofthe residents, Dan Renner, questioned Quantum‚s representative (Bruce Fulker) regarding thepossibility of unexploded ordnance remaining on his property following the testing and who isliable should that ordnance explode at a later date. He also requested information regarding thetype of explosive to be used, how often misfires occur and how long it would take any unexplodedordnance to deteriorate. The representative could not readily answer the questions, but assuredMr. Renner he would obtain the answers.
The events that have taken place subsequent to Quantum‚s phone call have made it abundantlyclear that Mr. Renner and other surface owners in his situation are caught in an untenable posi-tion: If they allow seismic testing to place and permit explosives on their property, they risk losingtheir homeowner’s insurance; If they oppose the testing in order to maintain adequate insurancecoverage, they risk condemnation by the seismic testing company via the eminent domain laws inthe State of Wyoming. A full explanation of the events follows:
Mr. Fulker replied, in writing, to Mr. Renner that the explosive his company would be using is Seis-
IV-27
gel, that approximately 1% of the charges would misfire and that the sleep time for Seis-gel is twoyears (after which it would begin to deteriorate until it eventually became completely inert). Mr.Fulker did not address the liability issues.
However, Mr. Renner had begun to conduct some research on his own. He phoned his insurancecompany, advised them of the proposed explosives and seismic exploratory operations and askedabout his liability coverage. He was promptly advised that should such activity take place on hisproperty, his homeowner‚s insurance would either be cancelled or would not be renewed on thenext renewal date.
Mr. Renner’s next call was to the Wyoming Insurance Commissioner’s office. He posed the samequestions and was told that the commissioner’s office would have to investigate the matter andwould get back to him in about a week. Approximately an hour later, Mr. Renner received a callfrom the Insurance Commissioner’s office advising that they could not be of any assistance to him.He was referred to Eric Nelson, an attorney with the Wyoming Oil and Gas ConservationCommission (WOGCC).
A message was left for Mr. Nelson which resulted in a phone call from Mr. Don Likwartz, State Oiland Gas Supervisor with the WOGCC. Mr. Renner was advised that the issue of homeowner‚s lia-bility coverage during and after seismic testing had never come up before and questioned Mr.Renner as to why he had contacted his insurance company. Mr. Likwartz said he did not have anyanswers at that moment but would look into the matter. The last contact from Mr. Likwartz wasapproximately a week later. He advised that the WOGCC still didn’t have any answers.
Mr. Renner contacted a local insurance agency and asked that they attempt to find an insurer whowould be willing to cover him under the seismic testing circumstances. The insurance agentresponded about a week later advising Mr. Renner that he had contacted four companies (thatwould insure ranch property of his type) and was told that “with the possibility of undetonatedexplosives on his property, they would not be willing to write a policy which would include liability.”
Further research led Mr. Renner to Mr. Bob Hartwig, Senior Vice President & Chief Economist withthe Insurance Information Institute (NY). Mr. Hartwig stated that he knew of no underwriter whowould write a policy for liability insurance under the proposed circumstances. He further advisedthat if a landowner signed the seismic agreement to allow testing involving explosives to take placewithout notifying his insurance provider, he had significantly changed the conditions of his cover-age; his insurance provider could potentially deny any claim based on that change in conditions.On the other hand, if the homeowner notified his insurance carrier of the seismic activities, hewould most likely be cancelled, or at the very least, not renewed on the next renewal date. Mr.Hartwig went on to say, however, that the issue could certainly be resolved, although not quickly.He offered a series of solutions, including legislative changes that would be required, which areattached. Mr. Renner forwarded Mr. Hartwig’s email response to Ryan Lance, Office of theGovernor, State Planning Office, Cheyenne, WY.
Governor Freudenthal’s office, through Mr. Lance, has been supportive to the surface owners inClark who find themselves faced with a no-win situation and has tried to come up with a quick andadequate solution for all involved. The WOGCC, on the other hand, has taken the approach of“they will sign on the dotted line, or they will be condemned.” The BLM has maintained that theissue of insurability on private lands does not fall under their purview and that the issue of insur-ability on public lands “should not be problem.”
The Governor’s office issued a final statement to the residents of Clark during a community meet-ing on February 16: The issue is a private party issue that has to be resolved between the two par-ties. His office offered to assist in finding a solution, but advised that the surface owner andQuantum would have to resolve the issue on their own. “We can’t have the heavy hand of the State
IV-28
Landowner Stories
involved in a private property issue,” said Mr. Lance. (Billings Gazette, February 22, 2005)
The problem with that solution is that it isn’t a “private party” issue. If the parties fail to come toan agreement it becomes a State issue with the seismic company using State eminent domainlaws to condemn private property and permit seismic testing to go forward. At that point thelandowner is right back where he started with the risk of becoming uninsurable.
Furthermore, the issue is much more far-reaching than an agreement between a landowner anda seismic company in Clark, Wyoming. It affects similarly situated landowner’s throughout theState and possibly throughout the U.S. It affects lenders who hold the mortgages on such prop-erty and have insurance requirements that must be met by the borrower. It affects the ability ofinsurers to write insurance in Wyoming and other states where explosive seismic activity isinvolved.
One has to ask has this administration become so unconscionable when it comes to oil and gasdevelopment that they would not only allow, but support development in subdivisions, next toschools, alongside churches, and in people’s front yards? Better yet, has the quest for develop-ment become so outrageous that the State would allow people’s land to be condemned if they donot agree to allow seismic activity in order to maintain their homeowners insurance?
Oil and Gas at Your Door?A Landowner’s Guide to Oil and Gas DevelopmentSecond Edition
Chapter VSources of Information
RESOURCES ON THE OIL AND GAS DEVELOPMENT PROCESS
U.S. Environmental Protection Agency October 2000. Profile of the Oil and Gas Extraction Industry. EPA Office of ComplianceSector Notebook Project. http://www.epa.gov/compliance/resources/publications/assistance/sectors/notebooks/oil.html
Baars, D.L., Watney, W. Lynn, Steeples, Don W., and Brostuen, Erling A. 1993. Petroleum: A Primer for Kansas. Educational Series 7. Kansas Geological Survey.http://www.kgs.ukans.edu/Publications/Oil/
Natural Gas—from wellhead to burner tip. http://www.naturalgas.org
Pembina Institute This Canadian institute is an independent, not-for-profit environmental policy research andeducation organization. Pembina Institute has developed a series of primers on Environmentand Energy in the North. While these primers are geared for northern environments, theyalso contain a lot of excellent general information on the oil and gas development process.http://www.pembina.org/publications_item.asp?id=168
Centre for EnergyA Canadian energy industry web site that has some basic overviews of the developmentprocess for conventional and nonconventional oil and gas sources. http://www.centreforener-gy.com/generator2.asp?xml=/silos/ong/UNGOverview01XML.asp&Template=1,1,1
Resources on Oil and Gas Development on Public LandsSee the publication Preserving our Public Lands for more information on the federal laws thatapply to oil and gas development on public lands. This publication provides citizens withsome strategies for protecting public lands from the harmful effects of oil and gas develop-ment. To obtain a copy of this publication, contact: the Wyoming Outdoor Council; the Oil andGas Accountability Project; or download a copy from the Western Resource Advocates website: http://www.westernresourceadvocates.org/media/pdf/preserv_public_lands_FINAL.PDF
Information on the federal leasing process can be found at the BLM Colorado web site.http://www.co.blm.gov/oilandgas/leasinstruct.htm
Regulations that govern the BLM’s oil and gas leasing program may be found in Title 43,Groups 3000 and 3100 of the Code of Federal Regulations (a publication available in BLMState Offices, law libraries and most public libraries).
Morton, P., Weller, C., Thomson, J., Haefele, M. and Culver, N. 2002.Coalbed methane and public wildlands: how much and at what cost?http://www.wilderness.org/Library/Documents/upload/ Drilling-in-the-Rocky-Mountains-How-Much-and-at-What-Cost.pdf
V-1
V
Resources on Impacts to LivestockMarr-Laing, T. and Severson-Baker, C. 1999. Beyond “Eco-terrorism”: The Deeper IssuesAffecting Alberta’s Oilpatch. Pembina Institute for Appropriate Development. Drayton Valley,Alberta. pp. 13-15. This report describes a number of studies that have shown linksbetween oil and gas operations and health effects on livestock. http://www.pembina.org/pdf/publications/oilpatch.pdf
Resources on Air EmissionsThe Health Effects Notebook for Hazardous Air Pollutants is an excellent resource for informa-tion on specific air pollutants. It can be found on the U.S. EPA’s web site.http://www.epa.gov/ttn/atw/hapindex.html
An excellent report on the impact of hydrogen sulfide emissions from gas wells and relatedfacilities on surface owners is: Schindler, D. 2001. Survey of Accidental and IntentionalHydrogen Sulfide Releases Causing Evacuations and/or Injuries in Manistee and MasonCounties from 1980 to 2001. http://www.mecprotects.org/oilaccidents.pdf
Resources on Oil and Gas NoiseBreul and Kjaer. 2000. Environmental Noise Handbook.http://www.macavsat.org/pdf_files/misc_reports/bk.pdf
Berglund, B., Lindvall, T. and Schwela, D. 1999. Guidelines for Community Noise. WorldHealth Organization. http://www.who.int/docstore/peh/noise/Commnoise2.htm
Leventhall, G. 2003. A Review of Published Research on Low Frequency Noise and itsEffects. Prepared for Department for Environmental Foods and Rural Affairs. (UnitedKingdom). http://www.defra.gov.uk/environmental/noise/lowfrequency/index.htm
Danish Environmental Protection Agency. 2002. Danish Guidelines On Environmental LowFrequency Noise, Infrasound And Vibration.http://www.mst.dk/transportuk/02030000.htm#vibration
Resources on Oil and Gas Processing, Refining, Pipelines and Liquefied Natural GasNaturalGas.orgFor more details on the steps involved in processing natural gas, read “Processing NaturalGas” at the NaturalGas.org web site.http://www.naturalgas.org/naturalgas/processing_ng.asp
Pipeline Safety TrustThe Pipeline Safety Trust promotes fuel transportation safety. This web site has an extensivelibrary with information on pipeline accidents, pipeline policies and regulations, and more.http://pstrust.org/
Federal Energy Regulatory Commission. Landowner Guide: An interstate natural gas facility on my land - what do I need to know?http://www.ferc.gov/about/doing/6513gpo.pdf
Oil spill information research links. This site provides a listing of government, industry, academic and nonprofit organizationalweb sites, with descriptions of the information offered on the various sites. http://www.racerocks.com/pearson/ensy/oils/esoilspl.htm
V-2
Sources of Information
Liquefied Natural Gas (LNG) Watch The “LNGwatch” web site has been created by a coalition of citizens and organizations con-cerned with the health issues associated with LNG. The site contains links to variousresources and information on LNG. http://lngwatch.com/
Energy Justice NetworkThe network works locally (Pennsylvania), nationally, and internationally, focusing primarily onliquefied natural gas issues. The network has also work on combined cycle natural gas powerplants and other “dirty energy” issues. Contact Mike Ewall (215-743-4884, [email protected]) or visit their web site. http://www.energyjustice.net
RESOURCES ON “BEST” OR ALTERNATIVE TECHNOLOGIES AND PRACTICES
The authors of this publication do not claim that any specific technologies or practices in thefollowing resources are the “best”. The resources are included as potential sources of infor-mation on alternative practices in the oil and gas industry. Surface owners will have todecide for themselves what technologies and practices fit best with their needs.
Alaska Department of Environmental ConservationA pollution prevention opportunities guide for the oil field service industry, from the AlaskaDepartment of Environmental Conservation Pollution Prevention Office. http://es.epa.gov/program/regional/trade/p2-oppt.html
A Canadian Working Group composed of industry, government, and public interest groupsproduced Best Management Practices for Control of Benzene Emissions from GlycolDehydrators, which outlines methods for minimizing benzene emissions in new and existingplants; and provides more information on alternatives to glycol dehydration. The document isavailable on the Small Explorers and Producers Association of Canada (SEPAC) web sitehttp://www.sepac.ca/Downloads/bmp.pdf
Bureau of Land Management. The BLM has a program dedicated to techniques used to reduce the visual impacts from sur-face disturbing projects. Information on this program can be found athttp://www.blm.gov/nstc/VRM/destech.html
Colorado Oil and Gas Conservation CommissionThe commission’s Outstanding Oil and Gas Operation Awards may give landowners a sense ofwhat some companies have done to set them apart from the rest of the industry.http://www.dnr.state.co.us/cdnr_news/oil-gas/2001810132249.html
Groundwater Protection CouncilFor example, they held a Produced Water Conference on Oct 15-17, 2002 in ColoradoSprings, CO. Proceedings from this conference can be found athttp://www.gwpc.org/Meetings/PW2002/Post-Meeting-Report.htm
New Mexico Energy, Minerals and Natural Resources DepartmentIn 2000, the Oil Conservation Division of the department released a two volume handbook onPollution Prevention - Best Management Practices for the Oil and Gas Industry.http://www.emnrd.state.nm.us/ocd/
V-3
Petroleum Technology Transfer Center (PTTC)Case Studies on various technologies (some of these are highly technical)http://www.pttc.org/case_studies/case_studies.htm, and PTTC Technology Connections:State-of-the-Art Technology Summary http://www.pttc.org/tech_sum/statev8no1.htm
Railroad Commission of TexasThis state regulatory body has waste minimization information for various oil and gas relatedoperations; a guidance document Minimization in the Oil Field Manual; and case histories ofwaste minimization projects. http://www.rrc.state.tx.us/divisions/og/key-programs/ogkwast.html
Southwest Pollution Prevention Center, Gas and Oil HubThis site provides a great deal of information on oil and gas pollution prevention alternativesfor all stages of oil and gas development (drilling, well completion, oil and gas processing, oiland gas storage, pipelines, well servicing, oil recovery, transportation and more). Also, thesite provides lists of wastes associated with various stages of oil and gas operationshttp://p2.utep.edu/hubs/toc.cfm?hub=11&subsec=7&nav=7
U.S. Environmental Protection AgencyOil and Gas Industry Sector Notebook describes pollution prevention opportunitieshttp://www.epa.gov/compliance/resources/publications/assistance/sectors/notebooks/oil.html
EPA’s Natural Gas STAR Program is a source of information on waste minimization techniquesin natural gas treating and processing operations. The program is designed to promote envi-ronmental protection through cost-effective measures without regulation, by encouraging nat-ural gas companies to adopt “best management practices” that can reduce methane emis-sions. More information on the Natural Gas Star Program can be obtain by contacting: U.S.EPA Natural Gas Star Program, U.S. EPA, 401 M Street, SW Washington, DC 20460.http://134.67.55.16:777/dc/methane/home.nsf/pages/gasstar
The Illinois office of the EPA produced the document Best Management Practices for OilExploration and Extraction. http://www.epa.state.il.us/p2/fact-sheets/bmp-oil-exploration.html
Western Governor’s AssociationThe WGA is developing a handbook of best management practices for coalbed methanedevelopment. Some of the topics likely to be addressed in their handbook include practicesrelated to planning, landowner relations, land use, water, infrastructure, and fish and wildlifehabitat. The handbook should be available in 2004. http://www.westgov.org/
Drilling Waste Management Information SystemThis is an online resource created by the Argonne National Laboratory and industry. It con-tains technical and regulatory information on standard and better practices for managingdrilling wastes. http://web.ead.anl.gov/dwm/
COALBED METHANE RESOURCES
High Country NewsThis newspaper produced a special report called Coalbed Methane Boom. It can be found ontheir web site. http://www.hcn.org
ALL ConsultingALL Consulting has prepared some in-depth material on CBM, including some information on
V-4
Sources of Information
best practices and mitigation strategies. http://www.all-llc.com/CBM/
Wyoming CBM ClearinghouseThis web site is a clearinghouse of information about coalbed methane (CBM) in and aroundthe state of Wyoming. The CBM Clearinghouse is a joint project of the University of Wyomingand the U.S. Bureau of Land Management. http://www.cbmclearinghouse.info/
East of Huajatolla Citizens AllianceThis group has produced numerous information sheets for citizens dealing with CBM develop-ment (including issues such as health and welfare, produced water, impacts on wildlife andlivestock, well spacing, and many others). http://ehcitizens.org/cbmgas/index.htm
Montana Department of Environmental QualitySee their information on CBM Environmental and Economic Issues, which contains papers onagriculture, irrigation, water quality, air quality, biological issues, geology and soils, social andeconomic impacts, and other issues, including a study on Potential Costs and Benefits toMontanans from CBM Development. http://www.deq.state.mt.us/CoalBedMethane/index.asp
RESOURCES ON SLAPP SUITS
California Anti-SLAPP Project (CASP)CASP is dedicated to helping protect and further the rights of Californians to participate ingovernment and civic affairs and to speak freely about public issues. CASP maintains aresource and information center about California SLAPPs. CASP also provides legal assistanceand representation to individuals and organizations to defend against SLAPPs. Phone: 510-486-9123 http://www.casp.net
First Amendment Project (FAP)FAP is a nonprofit public interest law firm active in two main areas of First Amendment law:anti-SLAPP and open government. FAP provides legal representation to individuals and organi-zations to defend against SLAPPs. Phone: 510-208-7744 http://www.thefirstamendment.org
Political Litigation Project, University of Denver School of LawThe Political Litigation Project is run by University of Denver Professors George Pring andPenelope Canan, the leading authorities on SLAPPs. They have a wealth of knowledge aboutSLAPPs all over the United States, and beyond. Phone: 303-871-2049
SLAPP Resource Center http://www.slapps.org
NONPROFIT ORGANIZATIONAL RESOURCES FOR SURFACE OWNERS
For landowners facing gas well development, a number of resources are available.Information on various issues including how to negotiate with an oil and gas company anddeveloping a surface use agreement can be accessed by contacting the nonprofit organiza-tions and/or visiting the websites of the groups listed below. (As well as the groups listed inthe Coalbed Methane Resources section.
V-5
East of Huajatolla Citizens Alliance in Colorado This organization has useful information sheets on coalbed methane, and many of these factsheets are useful for those dealing with conventional oil and gas extraction (e.g., topics suchas Surface Use Agreements, Pooling, Force Pooling, Spacing, Citizens Rights andResponsibilities, and many others). Phone: 719-941-4740 http://www.ehcitizens.org/cbmgas
Northern Plains Resource CouncilThis Montanta organization has produced a number of publications for surface owners,including Coal Bed Methane - A guide to protecting your property, and Your Lands, Your Rights. Phone: 406-248-1154 http://www.northernplains.org
Oil and Gas Accountability ProjectThis Colorado/New Mexico group has produced this guide, along with various other materialsthat are helpful for surface owners. Phone: 970-259-3353 http://www.ogap.org
Powder River Basin Resource CouncilLocated in Wyoming, this group has a section on their web site “Help for Surface Owners,”which includes example legal documents, surface damage agreement checklist and a lot ofother great information. Phone: 307-358-5002 or 307-672-5809 http://www.powderriverbasin.org/helpforsurface_owners.htm
Western Organization of Resource CouncilsA Montana-based group with a number of reports and fact sheets that may be useful tolandowners (See also CBM resources above). These include: How to Negotiate; How to DealWith Intimidation and Protecting Surface Owners and Promoting Responsible Coal BedMethane DevelopmentPhone: 406-252-9672http://www.worc.org
Michigan Land Use InstituteThis organization has a great deal of information on surface owner issues with oil and gas.They also have a Leasing Packet for Michigan Property Owners, which includes educationalinformation, tips on negotiating a lease, and model language for a lease addendum.According to the Institute, this packet has helped numerous property owners receive higherroyalty rates, and establish protections for their surface land and groundwater. The leasingpacket is free to Institute members, and is $15 for non-members. Phone: 231-882-4723http://www.mlui.org
GOVERNMENT-PRODUCED LANDOWNER GUIDES AND RESOURCES
A Landowner’s Guide to Oil and Gas in Alabama, by Strudwick Marvin Rogers, J.D., and LisaLee Mancini. 26 p. 1991. $4.50. Order from Alabama Oil and Gas Board.http://www.ogb.state.al.us/
Landowners Guide on Oil and Gas Leasing. Ohio Department of Natural Resources. FreeBrochure. http://www.ohiodnr.com/mineral/oil/o6.htm
V-6
Sources of Information
V-7
Answers to Typical Questions from the Public and Information for Surface Owners. ColoradoOil and Gas Conservation Commission. http://oil-gas.state.co.us/General.html
Landowners and Oil and Gas Leases in Pennsylvania. Department of EnvironmentalProtection. Fact Sheet. http://www.dep.state.pa.us/dep/deputate/minres/oilgas/fs2834.htm
A Landowner’s Guide to Oil and Gas Leasing. New York State Department of EnvironmentalConservation, Division of Mineral Resources. Brochure. http://www.dec.state.ny.us/website/dmn/Lndownrguide.htm
OTHER LANDOWNER AND MINERAL OWNER RESOURCES
David, Rick D. April 2000. Conflicts Between Surface Owners and Mineral Lessees. InternalPaper, Cotton, Bledsoe, Tighe & Dawson, P.C., Attorneys at Law (Midland, Texas).http://www.cbtd.com/news/conflicts.pdf
National Association of Royalty Owners (NARO) is geared toward mineral owners. They havefree brochures, and paid publications on mineral deeds, leasing, How to Survive ForcePooling, and other topics. http://www.naro-us.org/index.shtml
PETEX Publications. Land and Leasing. This manual is for landowners, landmen, lawyers,and investors as well as all oil company employees. It takes a layperson’s approach to thelegal aspects of land-ownership, transfer, and leasing, privately owned land; state and federallands; preparations for drilling, producing, and selling; agreements to explore and developleased properties; and pooling, unitization, and release. It uses examples from Alaska,California, Louisiana, and Canada, Kansas, Michigan, New Mexico, North Dakota, Oklahoma,Texas, and Wyoming. 1984, 287 pp. $21. http://www.utexas.edu/cee/petex/pubs/reference.html
Purdue University Agricultural Economics Department. Negotiating Oil and Gas Leases onIndiana Farmland. http://www.agcom.purdue.edu/AgCom/Pubs/EC/EC-564.html
Real Estate Center at Texas A&M University has information for mineral owners and surfaceowners. Topics include: Negotiating Leases; Scrutinzing Royalty Payments; Recovery ofSurface Damages and Remediation Costs; Subdivision Drill Sites, and more.http://recenter.tamu.edu/pubs/catoilg.html
Straube, Michele and Holland, Melinda. March, 2003. A Conflict Assessment of Split EstateIssues and a Model Agreement Approach to Resolving Conflicts Over Coalbed MethaneDevelopment in the Powder River Basin. Prepared For: U.S. Institute for EnvironmentalConflict Resolution. http://www.ecr.gov/pdf/CAR.pdf
NONPROFIT ORGANIZATIONS WORKING ON OIL, NATURAL GAS AND CBM ISSUES
NATIONAL AND REGIONAL ORGANIZATIONS
Oil and Gas Accountability ProjectOGAP works with citizens and communities from the U.S. and Canada. Visit OGAP’s web sitefor information on: general oil and gas issues; public health and toxics; alternative technolo-gies and practices; federal and state regulatory reform; model local regulations; and surfaceowner protections.
Natural Resources Defense CouncilHeadquarters: New YorkPhone: (212) 727-2700Email: [email protected]://www.nrdc.org
The Wilderness SocietyHead office: Washington, DC Phone: 1-800-THE-WILDhttp://www.wilderness.org
Western Organization of Resource CouncilsWORC is a regional network of seven grassroots community groups from Montana, NorthDakota, South Dakota, Idaho, Oregon, Montana, and Colorado. WORC also has an office inWashington, DC.Phone: 406-252-9672Email: [email protected]; [email protected]://www.worc.org
STATE-BASED ORGANIZATIONS
Alaska
Alaska Center for the Environment, AnchoragePhone: 907-574-3647Email: [email protected] http://www.akcenter.org
Idaho Department of Lands, http://www2.state.id.us/lands/Bureau/Bureau of Surface and Mineral Surface_and_Mineral_Resources/Resources, Oil and Gas Surface_Minerals_Resource_Mngmnt_Bur.htmConservation Commission Ph: 208-334-0200
Illinois Illinois Department of Natural http://dnr.state.il.us/mines/dog/welcome.htmResources, Division of Oil and Gas Ph: 217-782-7756
Indiana Indiana Department of Natural http://www.state.in.us/dnroil/Resources, Division of Oil and Gas Ph: 317-232-4055
Kentucky Department of Mines and Minerals, http://dmm.ppr.ky.gov/OilAndGas.htmDivision of Oil and Gas Ph: 502-573-0147
Louisiana Department of Natural Resources, ttp://www.dnr.state.la.us/cons/conserv.ssihOffice of Conservation Ph: 225-342-5570
Michigan Department of Environmental http://www.michigan.gov/deq/0,1607,7-135-3311_4111---,00.htmlQuality, Geological and Land Ph: 517-373-7917Management Division
Mississippi Oil and Gas Board http://www.ogb.state.ms.usPh: 601-354-7142
Missouri Department of Natural Resources, http://www.dnr.mo.gov/geology/geosrv/oil.htmGeological Survey and Resource Ph: 573-368-2100Assessment Division
Montana Department of Natural Resources http://bogc.dnrc.state.mt.us/and Conservation, Montana Board Ph: 406-656-0040of Oil and Gas Conservation
Nebraska Oil and Gas Conservation http://www.nogcc.ne.govCommission Ph: 308-254-6919
Nevada Commission on Mineral Resources; http://minerals.state.nv.us/programs/ogg.htmDivision of Minerals, Oil, Gas Ph: 775-684-7040and Geothermal
V-12
Sources of Information
New Mexico Energy, Minerals and Natural http://www.emnrd.state.nm.us/ocdResources Department, Ph: 505-476-3440Oil Conservation Commission
New York Department of Environmental http://www.dec.state.ny.us/website/dmnConservation, Division of Ph: 518-402-8076Mineral Resources
North Dakota Industrial Commission, http://www.oilgas.nd.gov/Oil and Gas Division Ph: 701-328-8020
Ohio Ohio Department of http://www.ohiodnr.com/mineral/oilNatural Resources Ph: 614-265-6633
Oklahoma Corporation Commission, http://www.occ.state.ok.us/Divisions/OG/Og.htmOil and Gas Conservation Division Ph: 405-521-2211
Oregon Department of Geology and http://www.oregongeology.com/oil/oilhome.htmMineral Industries; Oil, Gas and Ph: 503-731-4100Geothermal Regulatory and Reclamation Program
Pennsylvania Department of Environmental http://www.dep.state.pa.us/dep/deputate/minres/oilgas/oilgas.htmProtection, Bureau of Oil and Ph: 717-772-2199Gas Management
South Dakota Department of Environment http://www.state.sd.us/denr/des/mining/oil&gas/o&ghome.htmand Natural Resources, Ph: 605-394-2229Minerals and Mining Program
Tennessee Department of Environment and http://www.state.tn.us/environment/boards/oilandgas.phpConservation, State Oil and Ph: 615-532-1500Gas Board
Texas Railroad Commission, Crude Oil http://www.rrc.state.tx.us/divisions/og/og.htmland Natural Gas Ph: 512-463-6977
Utah Division of Oil, Gas and Mining http://www.ogm.utah.gov/oilgas/Ph: 801-538-5277
Virginia Department of Mines, Minerals http://www.mme.state.va.us/Dgo/default.htmand Energy, Division of Gas and Oil Ph: 276-676-5423
Washington The Department of Natural http://www.dnr.wa.gov/geology/energy.htmResources, Division of Geology and Ph: 360-902-1450Earth Resources, Energy (Oil and Gas) Regulation
West Virginia Department of Environmental http://www.dep.state.wv.us/item.cfm?ssid=23Protection, Office of Oil and Gas Ph: 304-558-6075
Wyoming Wyoming Oil and Gas http://wogcc.state.wy.us/Conservation Commission Ph: 307-777-7434
V-13
Endnotes-1
1 Thomas, K. 2001. Produce or Plug? A Summary of Idle and Orphan Well Statistics and
Regulatory Approaches. Paper presented at the Society of Petroleum Engineers/EPA/DOE
Exploration and Production Conference, San Antonio, TX, Feb. 2001. SPE 68695. 2 EIA. U.S. Department of Energy. “Distribution and Production of Oil and Gas Wells by State.”
(http://www.eia.doe.gov/pub/oil_gas/petrosystem/petrosysog.html) 3 Energy Information Administration (EIA). U.S. Department of Energy. January, 2005. “Table 5.2
Crude Oil and Natural Gas Wells Drilled.” Monthly Energy Review. 4 Energy Information Administration (EIA). U.S. Department of Energy. November, 2004. Crude
Oil, Natural Gas, and Natural Gas Liquids Reserves 2003 Annual Report. DOE/EIA–0216(2003). 5 Sean Smith, Katy Rexford and Katherine Teitgen. Feb. 26, 2002. Drilling to Disaster.
Bluewater Network. (http://bluewaternetwork.org/campaign_pl_drilling.shtml) 6 U.S. Department of State. April 30, 2001. “U.S. Energy Strategy.” Text of speech delivered by
Vice President Cheney at the Annual Meeting of the Associated Press Toronto, Canada.
http://usinfo.state.gov/topical/global/energy/01043001.htm7 Energy Information Administration (EIA), U.S. Department of Energy. May, 2003. “World Oil
Consumption by Region, Reference Case, 1990-2025,” International Energy Outlook 2003.(http://www.eia.doe.gov/oiaf/archive/ieo03/tbl_a4.html) 8 EIA. May, 2003. See endnote 7.
9 National Environmental Trust. 2002. America, Oil & National Security- What Government and
Industry Data Really Show. (http://www.envirnet.org)10
EIA. May, 2003. See endnote 7. 11
Article cited in: Udall, R. and Andrew, S. Methane Madness: A Natural Gas Primer. Community Office for Resource Efficiency (CORE). Aspen, CO. 12
EIA. May, 2003. See endnote 7. 13
U.S. Geological Survey. 1999. Fact Sheet FS-142-99. 14
Energy Information Administration (EIA). U.S. Department of Energy. November, 2002. Crude Oil, Natural Gas, and Natural Gas Liquids Reserves 2001 Annual Report. p. 130.15
EIA. November, 2004. p. 23. See endnote 4. 16
U.S. Environmental Protection Agency (U.S. EPA). October, 2000. Profile of the Oil and Gas Extraction Industry. EPA Office of Compliance Sector Notebook Project. EPA/310-R-99-006. p.
7. 17
U.S. Bureau of Land Management. 2003. Farmington Proposed Resource Management Plan and Final Environmental Impact Statement. 18
U.S. Bureau of Land Management (BLM). 2003. Final Environmental Impact Statement and Proposed Plan Amendment for the Powder River Basin Oil and Gas Project. 19
Energy Information Administration (EIA). U.S. Department of Energy. Coalbed Methane in the U.S.: Past, Present and Future. http://www.eia.doe.gov/oil_gas/rpd/cbmusa2.pdf22
Peel, John. “Buyers get warning on gas-well drilling,” Durango Herald. October 24, 1999.23
Radovic, Ljubisa R. Pennsylvania State University. Textbook for Course “Energy and
Environment – EGEE 101.” Chapter 8, p. 143. (http://www.ems.psu.edu/~radovic/Chapter8.pdf24
U.S. EPA. October, 2000. p. 5. See endnote 16. 25
BP Canada Energy Company. 2003. Condensate. Material Safety Data Sheet.
(https://www.nglnow.com/safety.html); and Phillips Petroleum Company. 1997. Natural Gas Condensate, Sweet. Material Safety Data Sheet.
Fletcher, Sam. 2005. “Unconventional gas vital to US supply,” Oil and Gas Journal. Feb. 28,
2005. p. 20. 29a
Energy Information Administration. February, 2005. Annual Energy Outlook 2005. Report
#DOE/EIA-0383 (2005). p. 95. (http://www.eia.doe.gov/oiaf/aeo/) 30
Fambrough, J. June, 1996. Minerals, Surface Rights and Royalty Payments. The Real Estate
Center, Texas A&M University. Technical Report 840. p. 5. 31
East of Huajatolla Citizens Alliance. 2001. Information Sheet #3. Biography of a Coalbed Methane Field. (http://www.ehcitizens.org/cbmgas) 32
Fambrough, J. June, 1996. See endnote 30 33
Beaumont and Foster, 1992; Leg, 1994. in Oil – A Life Cycle Analysis of its Health and Environmental Impacts. Edited by Paul R. Epstein and Jesse Selber. The Center for Health and
the Global Environment, Harvard Medical School. March, 2002. 34
Fambrough, J. June, 1996. See endnote 30. 35
Berger, Bill D. and Kenneth E. Anderson, Modern Petroleum -- A Basic Primer of the Industry,
Third Edition, Tulsa, OK: PennWell Publishing Company, 1992. 36
Fambrough, J. June, 1996. See endnote 30. 37
Griffiths, Mary and Marr-Laing, Tom. February, 2001. When the Oilpatch Comes to Your Backyard: A Citizens’ Guide to Protecting Your Rights. Pembina Institute for Appropriate
Development: Drayton Valley, Alberta. p. 5. 38
Griffiths, Mary and Marr-Laing, Tom. February, 2001. February, 2001. See endnote 37. 39
Griffiths, Mary and Marr-Laing, Tom. February, 2001. See endnote 37. 40
Baars, D.L., Watney, W. Lynn, Steeples, Don W., and Brostuen, Erling A. 1993. Petroleum: A Primer for Kansas. Educational Series 7. Kansas Geological Survey. 40 pp.
U.S. EPA. October, 2000. pp. 22, 23. See endnote 16. 42
Baars, D.L., Watney, W. Lynn, Steeples, Don W., and Brostuen, Erling A. 1993. See endnote
40. 43
Baars, D.L., Watney, W. Lynn, Steeples, Don W., and Brostuen, Erling A. 1993. See endnote
40. 44
U.S. EPA. p. 18. October, 2000. See endnote 16. 45
Baars, D.L., Watney, W. Lynn, Steeples, Don W., and Brostuen, Erling A. 1993. See endnote
40. 46
Baars, D.L., Watney, W. Lynn, Steeples, Don W., and Brostuen, Erling A. 1993. See endnote
40. And U.S. EPA. October, 2000. p. 23. See endnote 16. 47
American Petroleum Institute. 1998. 1997 Joint Association Survey on Drilling Costs, American in EPA, 2000, p. 17. 48
Baars, D.L., Watney, W. Lynn, Steeples, Don W., and Brostuen, Erling A. 1993. See endnote
40. 49
Baars, D.L., Watney, W. Lynn, Steeples, Don W., and Brostuen, Erling A. 1993. See endnote
40. 50
Southwest Pollution Prevention Center “Gas and Oil Hub,” (http://p2.utep.edu) 51
Up to nine acres, according to the U.S. Bureau of Land Management (BLM). 2000. Draft RMPA/EIS for Federal Fluid Minerals Leasing and Development in Sierra and Otero Counties. 4-
50. Cited in Sean Smith, Katy Rexford and Katherine Teitgen. p. 3. See endnote 5. As much as
40 acres according to the Louisiana Department of Natural Resources. See endnote 398. 52
New Mexico State University. 1985. Oil and Gas Interactions with the Ranching Industry inNew Mexico. Agricultural Experiment Station, Bulletin 715. 53
BLM. 2000. See endnote 51. 54
La Plata County (Colorado). 2002. La Plata County Impact Report. pp. 3-99, 3-110.
(http://co.laplata.co.us/publications.htm) 55
New Mexico Cattle Growers’ Association. Feb. 2003. Oil and Gas Position Paper. 56
BLM. 2003. p. 3-103. See endnote 18.
Endnotes
Endnotes-3
57 U.S. EPA. October, 2000. p. 38. See endnote 16.
58 American Petroleum Institute (API). 1997. Oil and Gas Waste Management – Preliminary
Results from API Survey. 59
U.S. EPA. October, 2000. p. 57. See endnote 16. 60
Drilling Waste Management Information System. Fact Sheet “Using Muds and Additives with
Drilling Waste Management Information System. Fact Sheet “Using Muds and Additives with
Lower Environmental Impacts.” See endnote 60.63
U.S. Department of Housing and Urban Development. Directive No. 4150.2. Valuation Analysis for Single Family One- to Four- Unit Dwellings. 64
Southwest Pollution Prevention Center. See endnote 50. 65
U.S. EPA. p. 38. October, 2000. See endnote 16. 66
Wills, Jonathan. May, 2000. A Survey of Offshore Oilfield Drilling Wastes and Disposal Techniques to Reduce the Ecological Impact of Sea Dumping. (http://www.offshore-
environment.com/drillcuttings.html)67
U.S. EPA. October, 2000. p. 38. See endnote 16.68
Darin, T.F. and Stills, T. 2002. Preserving our Public Lands. (Boulder, CO: Land and Water
Beaumont and Foster, 1992; Leg, 1994. In Oil – A Life Cycle Analysis of its Health and Environmental Impacts. Edited by Paul R. Epstein and Jesse Selber. (The Center for Health and
the Global Environment, Harvard Medical School.) March, 2002. p. 9.71
“Michigan's Oil and Gas Debate – Legislature Passes Six Energy Reform Bills, 12 More Are
Pending,” Great Lakes Reporter. Summer/Fall 1998, Volume 3, Number 3. p. 39. 81
Murray, Paula C., and Cross, Frank B. 1992. “The Case for a Texas Compulsory Unitization
Statute,” Saint Mary's Law Journal 23: 1099-1154. 82
Southwest Pollution Prevention Center. See endnote 50. 83
U.S. EPA. October, 2000. p. 28. See endnote 16.84
U.S. EPA. October, 2000. p. 27. See endnote 16. 85
U.S. EPA. August, 2002. Chapter 1. Introduction. See endnote 28. 86
U.S. EPA. August, 2002. Chapter 1. Introduction. See endnote 28. 87
U.S. EPA. August, 2002. p. 7-3. See endnote 28.88
U.S. EPA. p. 27. October, 2000. See endnote 16. 89
U.S. Environmental Protection Agency (EPA). June, 2004. Evaluation of Impacts to Underground Sources of Drinking Water by Hydraulic Fracturing of Coalbed Methane Reservoirs.
EPA 816-R-04-003. p. 3-11. (http://www.epa.gov/safewater/uic/cbmstudy.html)90
U.S. EPA. August, 2002. Chapter 4. See endnote 28. 91
U.S. EPA. June, 2004. p. ES-1. See endnote 89. 92
U.S. EPA. August, 2002. Table 4-2. See endnote 28.
Endnotes-4
93 Puri, R., G.E. King, and I.D. Palmer. 1991. “Damage to Coal Permeability During Hydraulic
Fracturing,” Society of Petroleum Engineers Proceedings from Rocky Mountain Regional Meeting and Low-Permeability Reservoirs Symposium, Denver, CO, p. 109-115; and I.D. Palmer et al.
“Comparison between Gel-Fracture and Water-Fracture Stimulations in the Black Warrior Basin,”
Proceedings of the 1991 Coalbed Methane Symposium, pp. 233, 237. Cited in Natural Resources
Defense Council. January, 2002. “Hydraulic Fracturing: A threat to drinking water.”
Puri, R., G.E. King, and I.D. Palmer. See endnote 93. 97
McCallister, Ted. (updated 2002). Impact of Unconventional Gas Technology in the Annual Energy Outlook 2000. Energy Information Administration, U.S. Department of Energy.
Griffiths, Mary and Marr-Laing, Tom. February, 2001. p. 17. See endnote 37. 105
Baars, D.L., Watney, W. Lynn, Steeples, Don W., and Brostuen, Erling A. 1993. See endnote
40. 106
U.S. EPA. October, 2000. p. 25. See endnote 16.107
U.S. EPA. October, 2000. p. 5. See endnote 16.108
Baars, D.L., Watney, W. Lynn, Steeples, Don W., and Brostuen, Erling A. 1993. See endnote
40. 109
U.S. EPA. October, 2000. p. 32. See endnote 16.110
U.S. EPA. October, 2000. p. 31. See endnote 16.111 Natural Gas – From Wellhead to Burner Tip. “Processing natural gas.”
(http://www.naturalgas.org) 112
ibid. 113
U.S. Environmental Protection Agency. 2002. Exemption of Oil and Gas Exploration and Production Wastes from Federal Hazardous Waste Regulations. p. 24.
U.S. EPA. October, 2000. p. 46. See endnote 16. 116
U.S. EPA. October, 2000. p. 30. See endnote 16. 117
U.S. Energy Information Administration. 2004. International Energy Annual–2002. Table 4.1
“World Natural Gas Production.” (http://www.eia.doe.gov/iea/ng.html) 118
Griffiths, Mary and Marr-Laing, Tom. p. 34. February, 2001. See endnote 37. 119
Strosher, M. 1996. Investigations of Flare Gas Emissions in Alberta. (Alberta Research
Council). Cited in Griffiths and Marr-Laing. February, 2001. p. 34. See endnote 37. 120
Strosher, M. 1996. See endnote 119.
Endnotes
Endnotes-5
121 Griffiths, Mary and Marr-Laing, Tom. February, 2001. pp. 18, 35. See endnote 37.
122Powder River Basin Resource Council. Coalbed Methane Monitor. Late Summer 2000. p. 7.
(http://www.powderriverbasin.org) 123
Letter from Burlington Resources to the U.S. Environmental Protection Agency, June 21,
1999. Cited in Sean Smith, Katy Rexford and Katherine Teitgen. p. 4. See endnote 5.124
Southwest Pollution Prevention Center. See endnote 50. 125
Southwest Pollution Prevention Center. See endnote 50. 126
U.S. EPA. October, 2000. pp. 32, 41. See endnote 16. 127
U.S. EPA. October, 2000. p. 77. See endnote 16.128
API. 1997. See endnote 58.129
U.S. EPA. October, 2000. p. 59. See endnote 16.130
U.S. EPA. October, 2000. p. 52. See endnote 16.131
Southwest Pollution Prevention Center. See endnote 50. 132
API. 1997. See endnote 58. 133
U.S. Geological Survey (USGS). Environmental Impacts Associated with Disposal of Saline Water Produced During Petroleum Production - Osage-Skiatook Petroleum Environmental Research Project. (http://toxics.usgs.gov/sites/ph20_page.html) 134
U.S. EPA. October, 2000. p. 54. See endnote 16.135
U.S. EPA. October, 2000. p. 61. See endnote 16.136
U.S. EPA. October, 2000. p. 35. See endnote 16.137
U.S. EPA. Region 8 – Superfund Sites in Wyoming. “Mystery Bridge Road/Hwy 20.
Fleay, B.J. 1998. “Climaxing Oil: How Will Transport Adapt?” Paper presented at Beyond Oil: Transport and Fuel for the Future. Chartered Institute of Transport in Australia National Symposium, Launceston Tasmania. November 6-7, 1998. 152
Fleay, B.J. 1998. See endnote 151.153
Petroleum Technology Transfer Council (PTTC). 2004. “Coalbed Methane Resources in the
U.S. EPA. October, 2000. p. 5. See endnote 16. 155
Western Organization of Resource Councils (WORC). 2003. Factsheet. Coalbed Methane Development: Boon or Bane for Rural Residents. (http://www.worc.org/pdfs/CBM.pdf) 156 Coalbed Methane Transactions News (sources: Dow Jones Interactive, dialog and Northern
Lights). In Coal Bed Methane Alert, No. 13. August, 2002. 157
Stevens, Scott H., Kuuskraa, Jason, Kuuskraa, Vello. 1998. Unconventional Natural Gas in the United States: Production, Reserves and Resource Potential (1991-1997). Prepared for the
California Energy Commission. pp. 11-13. 158
U.S. Energy Information Administration, U.S. Department of Energy. 2001. “Recent Efficiency
Improvements in the Natural Gas Production Industry,” U.S. Natural Gas Markets: Mid-TermProspects for Natural Gas Supply. (http://www.eia.doe.gov/oiaf/servicerpt/natgas/boxtext.html)
Endnotes-6
159 Types of coal include: sub-bituminous (soft, lowest energy content), bituminous, and
anthracite coal (hard, highest energy content). 160
WORC. 2003. See endnote 155.161
U.S. Geological Survey (USGS). 2000. Water Produced with Coal-bed Methane. USGS Fact
Bureau of Land Management, San Juan Field Office. December 1999. A Brief History and Environmental Observations. A Working Document Compiled by the BLM San Juan Field Office.
(http://oil-gas.state.co.us/)165
La Plata County Energy Council. Gas Facts – Production Overview.
La Plata County Energy Council. 2003. See endnote 165. 167
Bureau of Land Management. June, 2004. Northern San Juan Basin Coal Bed Methane Project Draft Environmental Impact Statement. Appendix E. “Well Field Development Activities
Common to All Alternatives,” p. E15.168
McCallister, Ted. 2002. See endnote 97.169
McCallister, Ted. 2002. See endnote 97.170
East of Huajatolla Citizens Alliance. Information Sheet #2, Produced Water. (http://www.ehcitizens.org/cbmgas) 171
Boysen, Deidre B., Boysen, John E., and Boysen, Jessica A. “Strategic Produced Water
Management and Disposal Economics in the Rocky Mountain Region.” Presentation at the
Groundwater Protection Council Produced Water Conference. Oct 15-17, 2002. Colorado
Springs, CO.172
USGS. 2000. See endnote 161. 173
U.S. EPA. August, 2002. See endnote 28. 174
U.S. EPA. August, 2002. pp. ES 1-5 and 3-10. See endnote 28. Cited in a letter from the
Natural Resource Defense Council to the Chief of the EPA, October 28, 2002. 175
WORC. 2003. p. 3. See endnote 155. 176
WORC. 2003. p. 3. See endnote 155. 177
Letter from John Bredehoeft, PhD to Joan Harrigan-Farrelly, Chief, Underground Injection
Control, Prevention Program, EPA. May 22, 2003. Citing data from the Final Environmental Impact Statement and Proposed Plan Amendment for the Powder River Basin Oil and Gas Project. (http://www.earthworksaction.org/publications.cfm?pubID=94) 178
U.S. EPA. August, 2002. See endnote 28. 179
Testimony of Walter R. Merschat (Scientific Geochemical Services) at the hearing on “The
Orderly Development of Coalbed Methane Resources from Public Lands.” Subcommittee on
Energy and Mineral Resources of the Committee on Resources of the House of Representatives.
Sept. 6, 2001. 180
U.S. EPA. August, 2002. See endnote 28. 181
Merschat, Walter. 2001. See endnote 179. 182
San Juan Citizens Alliance. October, 2003. San Juan Citizens News, p. 11.
Stevens, Scott H., Kuuskraa, Jason, Kuuskraa, Vello. 1998. Unconventional Natural Gas in the United States: Production, Reserves and Resource Potential (1991-1997). Prepared for the
California Energy Commission. p. 4.
Endnotes
Endnotes-7
187 Kuuskraa, Vello A. (Advanced Resources International, Inc.) and Guthrie, Hugh D. (US Dept.
of Energy). 2001. “Translating Lessons Learned from Unconventional Natural Gas R&D to
Geologic Sequestration Technology,” Journal of Energy & Environmental Research, Volume 2,
Kuuskraa, Vello A. and Guthrie, Hugh D. 2001. “Translating Lessons Learned from
Unconventional Natural Gas R&D to Geologic Sequestration Technology.” Workshop on Carbon Sequestration Science, 2001. Conference Proceedings, U.S. Department of Energy.
Fleay, B.J. 1998. “Climaxing Oil: How Will Transport Adapt?” Paper presented at Beyond Oil: Transport and Fuel for the Future. Chartered Institute of Transport in Australia National Symposium, Launceston Tasmania. November 6-7, 1998. 191
Fleay, B.J. 1998. See endnote 190.192
Government of Alberta. December, 2004. “Talk About Oil Sands.” Fact sheet.
National Centre for Upgrading Technology, National Research Council, Workshop
Proceedings, June 21, 1999. Cited in Foley, Dermot. May, 2001. Fuelling the Climate Crisis: the Continental Energy Plan. David Suzuki Foundation, British Columbia. p. 14.194
Utah Natural Resources Division of Energy. (no date, approximately 1980), Oil Shale: Utah Department of Natural Resources, Salt Lake City. Cited in Youngquist, Walter. 1998. “Shale Oil
– the elusive energy.” M. King Hubbert Center for Petroleum Supply Studies Newsletter. Vol. 98.
"How Perceptions Have Changed of World Oil, Gas Resources," Oil & Gas Journal. February
23, 1998, pp. 77-79. 200
Radovic, Ljubisa R. See endnote 194.201
Dyni, John R. 2000. See endnote 198. 202
Johnson, H.R., Crawford, P.M. and Bunger, J.W. 2004. Strategic Significance of America’s Oil Shale Resource. Volume I Assessment of Strategic Issues. Report prepared for U.S. Department
of Energy. (http://www.fossil.energy.gov/programs/reserves/publications/Pubs-
NPR/npr_strategic_significancev1.pdf) 203
For more information on mining impacts, contact Earthworks
(http://www.earthworksaction.org). 204
“Alberta Tar Sands and Global Warming.” The Gallon Environmental Letter. Vol. 6, No. 23,
October 8, 2002. 205
“Alberta Tar Sands and Global Warming.” See endnote 204. 206
“Alberta Tar Sands and Global Warming.” See endnote 204. 207
Dyni, John R. 2000. See endnote 198.208
“Alberta Tar Sands and Global Warming.” See endnote 204. 209
“Alberta Tar Sands and Global Warming.” See endnote 204. 210
Carbon dioxide equivalents. 211
National Energy Board. 2000. Canada’s Oil Sands: A Supply and Market Outlook to 2015.
Appendix 4, p. 107. Cited in Foley, Dermot. May, 2001. Fuelling the Climate Crisis: the Continental Energy Plan. David Suzuki Foundation, British Columbia. p. 14. 212
David Suzuki Foundation. Meeting U.S. Energy demands worsens climate change. News
Release. Feb 23, 2001.(http://www.davidsuzuki.org/Campaigns_and_Programs/Climate_Change/News_Releases/newsc
limatechange02270101.asp) 213
New Mexico State University. 1985. See endnote 52.
Endnotes-8
214 Burton K. Wheeler Center for the Exploration of Montana Issues. Coal Bed Methane: What Do
Schindler, D. 2001. Survey of Accidental and Intentional Hydrogen Sulfide Releases Causing Evacuations and/or Injuries in Manistee and Mason Counties from 1980 to 2001.
Pedersen Planning Consultants. 2001. Appendix D in the Wyoming Energy Commission,
Preliminary Progress Report to the Wyoming Legislature, Joint Minerals, Business and Economic
Development Committee, December 14, 2001. Draft Report. 34 pp. 217
BBC Research and Consulting. November 12, 2001. Measuring the Impact of Coalbed Methane Wells on Property Values. (http://co.laplata.co.us/pdf/plan_doc/final_impactrpt/final-
ir_appb.pdf) 218
Berglund, B. and Lindvall, T. 1995. Community Noise. World Health Organization. (Document
available at http://www.nonoise.org/library/whonoise/whonoise.htm). 219
M.L. McDaniel and W.E. Biker. 1998. “Compressor stations: careful design and evaluation
required to reduce station noise,” Pipe Line & Gas Industry. July 1998 Vol. 81 No. 7.
U.S. Environmental Protection Agency. 1974. Information on Levels of Environmental Noise Requisite to Protect Public Health and Welfare with an Adequate Margin of Safety. EPA/ONAC
McGregor, S. (Engineering Dynamics). 1998. Compression Facility Noise Guidelines for Colorado Oil and Gas Commission. p. 10; and Breul and Kjaer. 2000. p. 20. See endnote 223. 225
Casella Stanger. 2001. Low Frequency Noise. (Technical research support for U.K.
Department for Environment, Food and Rural Affairs Noise Programme). p. 4; and Breul and
Kjaer. 2000. pp. 18 and 19. See endnote 223. 226
Breul and Kjaer. 2000, p. 25. See endnote 223; and Alberta Energy and Utilities Board
(EUB). November, 1999. Noise Control Directive User Guide. (Guide 38). p. 67. 227
Leventhall, G. 2003. A Review of Published Research on Low Frequency Noise and its Effects. Prepared for Department for Environmental Foods and Rural Affairs. (United Kingdom).
p. 36. (http://www.defra.gov.uk/environment/noise/research/lowfrequency/) 228
Berglund, B., Lindvall, T. and Schwela, D. 1999. “Chapter 3. Adverse Health Effects of
Noise,” Guidelines for Community Noise. World Health Organization.
ISO , 1987. Acoustics – Description and measurement of environmental noise – Part 3: Application to noise limits. International Standard ISO 1996-3:1987(E), International Organization
for Standardization, Geneva, Switzerland. Cited in Berglund, B., Lindvall, T. and Schwela, D.
1999. See endnote 228. 230
Breul and Kjaer. 2000, p. 31. See endnote 223. 231
Poulsen, Torben and Rysgaard, Frank. 2002. Laboratory Evaluation of Annoyance of Low Frequency Noise. Prepared for the Danish Environmental Protection Agency.
Breul and Kjaer. 2000, p. 15. See endnote 223; and Casella Stanger. 2001. p. 4. See endnote
225. 234
Moller and Lydolf, 2002. “A questionnaire survey of complaints of infrasound and low
frequency noise.” Journal of Low Frequency Noise and Vibration. 21:53-65. Cited in Leventhall,
G. 2003, p. 48. See endnote 227. 235
Vasudevan, R. N., and Gordon, C. G. 1977. “Experimental study of annoyance due to low
frequency environmental noise,” Applied Acoustics. 10:57-69. Cited in Leventhall, G. 2003, p. 36.
See endnote 227.
Endnotes
Endnotes-9
236 Otsego County Planning Commission. 2004. Land Use Issues of Wind Turbine Generator
Sites. Section 3. “Low frequency noise.” (http://www.msue.msu.edu/cdnr/otsegowindlfnoise.pdf) 237
Marsh, A. 1999. University of Western Australia, School of Architecture and Fine Arts. Cited inEast of Huajatolla Citizens Alliance. Noise. (http://ehcitizens.org/cbmgas/is9_noise.htm)238
Berglund, B., Lindvall, T. and Schwela, D. 1999. Guidelines for Community Noise. World
Health Organization. p. 50. (http://www.who.int/docstore/peh/noise) 239
Mirowska, M., and Mroz, E. 2000. “Effect of low frequency noise at low levels on human
health in light of questionnaire investigation,” Proc Inter-Noise 2000, 5, 2809 - 2812. Cited inLeventhall, G. 2003. p. 49. See endnote 227. 240 ibid.241
Sittig, Marshall. 1978. Petroleum Transportation and Production: Oil Spill and Pollution Control. (Park Ridge, NJ: Noyes Data Corporation); and U.S. Environmental Protection Agency,
Office of Solid Waste. 1987. Management of Wastes From Oil and Gas Exploration, Development, and Production. Report to Congress.245
U.S. Department of Energy. Office of Fossil Energy. “Oil and Gas Supply and Delivery –
Ramirez, Pedro Jr. December, 2000. See endnote 263. 265 ibid.266
Alberta Research Council. 1994. Livestock Field Investigations of Two Ranches Associated with a Pipeline Break. Cited in Marr-Laing, T. and Severson-Baker, C. 1999. Beyond “Eco-terrorism”: The Deeper Issues Affecting Alberta’s Oilpatch. Pembina Institute for Appropriate
Development. p. 13. 267
U.S. EPA. October, 2000. p. 34. See endnote 16.268
Texas Natural Resource Conservation Commission. June, 1998. Joint Groundwater Monitoring and Contamination Report, 1997 (June 1998). TNRCC Publication Number SFR-
056/97. 269
U.S. Environmental Protection Agency (U.S. EPA). 2002. Exemption of Oil and Gas Exploration and Production Wastes from Federal Hazardous Waste Regulations. p. 2. 270
U.S. EPA. 2002. See endnote 269. 271
Flynn, P., Boyce, D. and Murphy, T. Weld County Waste Disposal Site (EPA 7003 RCRA): Closure of an exploration and production waste disposal facility. Petroleum Technology Transfer
Council (PTTC) Rockies: Case Studies on Oilfield Waste Disposal Using Low-Cost Techniques.
Nussbaumer, J. and Wonstolen, K.A. Patina Oil & Gas Corporation Integrated E&P Waste Management Facility in Colorado. Petroleum Technology Transfer Council (PTTC) Rockies:
Case Studies on Oilfield Waste Disposal Using Low-Cost Techniques.
New Mexico Energy, Minerals and Natural Resources Department. 2001. New Mexico Followup and Supplemental Review - State Review of Oil and Natural Gas Environmental Regulations. p. 6. 274
New Mexico Energy, Minerals and Natural Resources Department. See endnote 273. 275
Bradbury, L.D., Bell, R., Mark, S. Case Study - Planting Crops on Land Spread with TankBottoms: A Possible Disposal Solution for Oilfields. Petroleum Technology Transfer Council.
Hauser, Robert L. and Guerard, William F. Jr. 1993. A History of Oil- and Gas-well Blowouts in California: 1950-1990. California Department of Conservation, Division of Oil and Gas. 37 pp. 279
Hauser, Robert L. and Guerard, William F. Jr. 1993. See endnote 278. 280
Hauser, Robert L. and Guerard, William F. Jr. 1993. See endnote 278. 281
Otton, James K. , Asher-Bolinder, Sigrid, Owen, Douglass E., and Hall, Laurel. Feb. 1997.
Effects of Produced Waters at Oilfield Production Sites on the Osage Indian Reservation, Northeastern Oklahoma, U.S. Geological Survey, Open-File Report 97-28. 282
Mitchell, David C. 1999. The Effects of Oilfield Operations on Underground Sources of Drinking Water in Kern County. California Department of Conservation, Division of Oil and Gas. p.
5. 283
Mitchell, David C. 1999. See endnote 282. 284
U.S. Geological Survey. 1997. USGS Research on Saline Waters Produced with EnergyResources. FS-003-97. (http://greenwood.cr.usgs.gov/energy/factshts/003-97/FS-003-97.html) 285
Waterwatch Victoria. 1996. “Salinity,” A Community Water Quality Monitoring. Chapter 4.
U.S. Geological Survey (USGS). 1999. “Oklahoma – radium associated with oil production.”
(http://water.usgs.gov/pubs/FS/FS-037-99) 317
Otton, James K., Asher-Bolinder, Sigrid, Owen, Douglass E., and Hall, Laurel. 1997. See
endnote 281.318
For more information, read Naturally Occurring Radioactive Materials (NORM) in Produced Water and Oil-Field Equipment – An Issue for the Energy Industry. US Geological Survey.
USGS Factsheet FS-142-00. September, 1999.319
Railroad Commission of Texas. See endnote 315. 320
Otton, James K., Asher-Bolinder, Sigrid, Owen, Douglass E., and Hall, Laurel. 1997. See
endnote 281.321
Railroad Commission of Texas. See endnote 315. 322
USGS. 1999. See endnote 316.
Endnotes-12
323 U.S. Geological Survey. 1999. Naturally Occurring Radioactive Materials (NORM) in
Produced Water and Oil-Field Equipment – An Issue for the Energy Industry. USGS FS-142-00.
(http://pubs.usgs.gov/fs/fs-0142-99) 324
Otton, James K., Asher-Bolinder, Sigrid, Owen, Douglass E., and Hall, Laurel. 1997. See
endnote 281.325
Railroad Commission Of Texas. Texas Administrative Code, Chapter 3. “Oil And Gas
Otton, James K., Asher-Bolinder, Sigrid, Owen, Douglass E., and Hall, Laurel. 1997. 1997.
See endnote 281.327
See e,g, Gerrity v. Magness , 946 P.2d 913 (Colo. 1997); Getty v. Jones, 470 S.W.2d 618,
619 (Tex. 1971); Amoco Prod. Co. v. Carter Farms Co., 703 P.2d 894 (N.M. 1985); Flying Diamond Corp. v. Rust, 551 P.2d 509 (Utah 1976); Buffalo Min. Co. v. Martin, 267 S.E.2d 721
(W.Va. 1980); and Hunt Oil v. Kerbaugh, 283 N.W.2d 131 (N.D. 1979) 328
Real Estate Center. “Recovery of surface damage and remediation costs,” Letter of the Law.
Volume 11, No. 2. Spring 1997. Texas A&M University. p. 1163. 329
Dole, Stephen E. 2001. Regulatory and Permitting Challenges in Coal Bed Methane Development, Proceedings from the 8th International Petroleum Environmental Conference,
November 6-9, 2001, Houston, TX. (http://ipec.utulsa.edu/Ipec/Conf2001/Conf/dole_91.pdf) 330
Banish, Laura. February 12, 2003. “Farmington council approves five new gas wells,”
Farmington Daily Times. 331
U.S. EPA. October, 2000. p. 69. See endnote 16. 332
Longwell, John. Prima Energy Corp; and Glenn Hertzler, Nabors Drilling USA, Inc. “Closed-
loop system as a cost effective alternative to reserve pits.” Presentation to the Consortium for
Emerging Gas Resources in the Greater Green River Basin, Advances in Drilling Technologies for the North American Rockies (Denver, Colorado, April 28, 1997). Sponsored by: Gas
Research Institute, U.S. Department of Energy and Independent Petroleum Association of
Mountain States. 333
U.S. EPA. October, 2000. p. 69. See endnote 16. 334
Railroad Commission of Texas, Oil and Gas Division. Waste Minimization Case Histories - Drilling Operations. (http://www.rrc.state.tx.us/divisions/og/key-programs/ogkwchdo.html) 335
Longwell, John and Hertzler, Glenn. See endnote 332. 336
Railroad Commission of Texas, Oil and Gas Division. See endnote 334. 337
Railroad Commission of Texas, Oil and Gas Division. See endnote 334. 338
Molvar, Erik, M. 2003. Drilling Smarter: Using Directional Drilling to Reduce Oil and Gas Impacts in the Intermountain West. Prepared for Biodiversity Conservation Alliance, Laramie,
WY. pp. 8, 9. (http://www.biodiversityassociates.org/blm/pubs/DirectionalDrilling1.pdf). 339
Molvar, Erik, M. 2003. p. 8. See endnote 338. 340
Molvar, Erik, M. 2003. p. 5. See endnote 338.341
U.S. EPA. p. 72. October, 2000. See endnote 16.342
U.S. EPA. p. 72. October, 2000. See endnote 16.343
D'Ambrosio, D. July 14, 2004. “BP experiments with flareless wells in county,” Durango Herald. 344
U.S. Environmental Protection Agency. 2004. “Green Completions.” EPA Partner Reported
Opportunities for Reducing Methane Emissions, PRO Fact Sheet No. 703.
Working Group on Benzene Emissions from Glycol Dehydrators. November, 1997. Best Management Practices for the Control of Benzene Emissions from Glycol Dehydrators.(http://www.gov.ab.ca/env/protenf/publications/BenzeneEmissionsFromGlycolDehydrators.pdf) 361
Working Group on Benzene Emissions from Glycol Dehydrators. See endnote 360.362
U.S. EPA. October, 2000. pp. 75-76. See endnote 16.363
Moseley, Davy. “Are water rights getting watered down?” Country World East Texas.(http://www.countryworldnews.com/Editorial/ETX/2001/ET0517_waterrights.html)364
This according to Harry Reagan of the Colorado Real Estate Commission. Cited in Peel,
John. October 24, 1999. “Buyers get warning on gas-well drilling,” Durango Herald. 365
Kansas Geological Survey. “Natural Gas from Coal in Eastern Kansas,” Public Information
Louisiana Rev. Stat. Ann. § 31:15 “Creation of mineral rights by the landowner,” and 31:27
“Extinction of mineral servitude.” (http://www.legis.state.la.us/lss/lss.asp?folder=21) 368
Colorado Oil and Gas Conservation Commission. January 31, 2002. Typical Questions Fromthe Public About Oil and Gas Development on Public Lands. Pamphlet. p. 2. (http://oil-
gas.state.co.us/General/typquest.html) 369
Welborn, John F. Chapter 12. “Split Estates and Mineral Development,” in The GoodNeighbor Guidebook for Colorado. Nancy S. Greif and Erin J. Johnson, Eds. (Johnson Books,
Boulder, CO: 2000). p. 63.370
Final Minutes, Environmental Quality Council (Agency Oversight/MEPA Subcommittee),
Montana. May 8, 2002. p. 2. Senator Tom Keating, Billings.
Senator Tom Keating, Billings. See endnote 370. 379
See endnote 80.
Endnotes-14
380 Commonwealth of Pennsylvania, Department of Environmental Protection, Oil and Gas
Management Program. Fact Sheet. Landowners and Oil and Gas Leases in Pennsylvania. (http://www.dep.state.pa.us/dep/deputate/minres/oilgas/fs2834.htm) 381
Colorado Revised Statutes. Article 11, Title Insurance Code Of Colorado. 10-11-123.
Notification of severed mineral estates.382
Gowen, Russ. Helena Abstract and Title Company. See endnote 370. 383
Schneider, Keith. “A distressing agenda gains in Michigan,” Great Lakes Bulletin, Spring
1997. p. 6. 384
National Parks Service. (http://www.cr.nps.gov/history/online_books/constitution/introj.htm) 385
Western Organization of Resource Councils (WORC). February, 2003. Protecting Surface Owners and Promoting Responsible Coal Bed Methane Development. (http://www.worc.org/issues/art_issues/energy_ownerimpact.html) 386
Colorado Oil and Gas Conservation Commission. January 31, 2002. See endnote 368. 387
Real Estate Center. See endnote 328. 388
Davis, Rick D. April, 2001. Conflicts Between Surface Owners and Mineral Lessees. (Cotton,
Bledsoe, Tighe & Dawson, P.C.: Midland, Texas). p. 33.
Cited in Davis, R.D. April, 2001. See endnote 388. 390 United Geophysical Corp. v. Culver, 349 P.2d 393 (Alaska 1964). Cited in Davis, R.D. April,
2001. See endnote 388. 391 Flying Diamond Corp. v. Rust, 551 P.2d 509 (Utah 1976). Cited in Davis, R.D. April, 2001.
See endnote 388. 392 Lanahan v. Myers, 389 P.2d 92 (Oklahoma 1963). Cited in Davis, R.D. April, 2001. See
endnote 388. 393
Northern Plains Resource Council. June, 2001. Coal Bed Methane – A guide to protecting your property. (http://www.northernplains.org/) 394 ibid.395
Mason, Monte. Montana Department of Natural Resources and Conservation. See endnote
370. (Mineral lease sale web site: (http://www.dnrc.state.mt.us/trust/tlmdhome.htm) 396
Western Organization of Resource Councils. 2005. Law and Order in the Gas Fields – A Review of Inspection and Enforcement in Five Western States. (http://www.worc.org)397
Alaska: Alaska Administrative Code Title 11, 96, Section140. “General Stipulations” #10, and
Section 150 (http://touchngo.com/lglcntr/akstats/AAC/Title11/Chapter096.htm); Montana:Montana Code Annotated 2001. Title 82. Minerals, Oil, and Gas. Chapter 1. General Provisions,
Department of Natural Resources. Frequently Asked Questions. “A company wants to do seismic
testing on my land. Do they need a permit?” (http://www.ohiodnr.com/mineral/oil/o5x.htm)
Oklahoma: Oklahoma Corporation Commission. OAC Rule 165:10-11-6(p). Plugging and
Plugging Back Procedures; and Oklahoma Statutes. 52-4-318.22 “Operations of Seismographic
Exploration - Rules.” 398
Louisiana Department of Natural Resources. Black Gold Beneath the Bayous. Available
through Louisiana Energy and Environmental Resource and Information Center. Louisiana State
University. (http://www.leeric.lsu.edu/bgbb/5/drilling.html) And Ward, Ken Jr. May 17, 2002. “DEP
permits ignore landowners, petition says.” The Charleston Gazette. See also: West Virginia Code.
§22C-9-7. Drilling units and the pooling of interests in drilling units in connection with deep oil or
gas wells. According to the West Virginia Code, “No drilling or operation of a deep well for the
production of oil or gas shall be permitted upon or within any tract of land unless the operator
shall have first obtained the written consent and easement therefor. . . of all the owners of the
surface of such tract of land.” 399
Colorado: State of Colorado Oil and Gas Conservation Commission. 2002. “Oil and Gas Well
Notification, Consultation, and Reclamation Rules.” Brochure. Montana: Montana Code
Annotated 2001. 82-10-503. (http://data.opi.state.mt.us/bills/mca_toc/82_10_5.htm). Michigan:Michigan Department of Environmental Quality. Michigan’s Oil and Gas Regulations. Part 2. R
324.201 “Application for permit to drill and operate requirements; issuance of permit.”
Pennsylvania: Pennsylvania Oil and Gas Act. Section 201 (b), 58 P.S. § 601.201 (b). Cited inendnote 380; and Pennsylvania Code, Chapter 78 Oil and Gas Regulations Subchapter B
Section 78.21. “Opportunity for objections and conferences; surface landowners.“
(http://www.pacode.com/secure/data/025/chapter78/s78.21.html); and Pennsylvania Oil and Gas
Illinois Compiled Statutes. Section 6. “Compensation of surface owners for drilling and
producing operations and duties after cessation of production.” See endnote 401. 403
Straube, Michele and Holland, Melinda. March 14, 2003. A Conflict Assessment of Split Estate Issues and a Model Agreement Approach to Resolving Conflicts Over Coalbed Methane Development in the Powder River Basin. Prepared for: U.S. Institute for Environmental Conflict
Resolution. (http://www.ecr.gov/pdf/CAR.pdf) 404
WORC. See endnote 385. 405
August 23, 1999. Memorandum to members of the Interim Committee to Study the Regulation
of Oil and Gas Production in Colorado. From the Office of Legislative Legal Services. “Overview
Compiled Statutes. See endnote 401. Montana: Montana Code (Annotated 2001). 82-10, Part 5.
“Surface Owner Damage and Disruption Compensation.”
(http://data.opi.state.mt.us/bills/mca_toc/82_10_5.htm). North Dakota: North Dakota Century
Code § 38-11.1-01 to 10. “Oil and Gas Production Damage Compensation.“
(http://www.state.nd.us/lr/cencode/T38C111.pdf). Oklahoma: Oklahoma Statutes §52 4-318.1 to
318.9. Especially section 318.5 “Negotiating Surface Damages - Appraisers - Report and
Exceptions Thereto - Jury trial.”
(http://www.oscn.net/applications/oscn/deliverdocument.asp?citeID=80747). Pennsylvania:Pennsylvania Statutes and Consolidated Statutes Annotated. Title 58. Oil and Gas. Chapter 11.
Oil and Gas Act. Section. 601.401. “Appropriation of interest in real property.”
(http://www.dep.state.pa.us/dep/deputate/minres/oilgas/act223ch4_6.htm#CHAPTER_4). South Dakota: South Dakota Statutes § 45-5A-1 to 11. “Compensation For Damages From Mining, Oil
Administrative Code. Title 62: Chapter I, Part 240, Subpart O. “Bonds.”
(http://dnr.state.il.us/legal/) Kansas: Kansas Corporation Commission. General Rules and Regulations for the Conservation of Crude Oil and Natural Gas. §82-3-120. “Financial
Endnotes-16
Responsibility.” (http://www.kcc.state.ks.us/conservation/cons_rr_0205.pdf) Kentucky:Commonwealth of Kentucky. Oil And Gas Well Operator’s Manual. p. 1.
and Gas Division. Instructions for How to Become an Oil and Gas Operator.(http://www.occ.state.ok.us/Divisions/OG/Og.htm) Pennsylvania: Oil and Gas Act. 223. Chapter
2. Sec. 601.215. “Bonding.”
(http://www.dep.state.pa.us/dep/deputate/minres/oilgas/act223.htm) Wyoming: Wyoming Oil and
Gas Conservation Commission Rules. Chapter 3, Section 4. “Bonding Requirements.”
(http://wogcc.state.wy.us/db\rules\3-4.html)410
Thomas, K. 2001. Produce or Plug? A Summary of Idle and Orphan Well Statistics and Regulatory Approaches. Paper presented at the Society of Petroleum Engineers/EPA/DOE
Exploration and Production Conference, San Antonio, TX, Feb. 2001. SPE 68695. 411
Darin, T.F. and Stills, T. 2002. Preserving Our Public Lands. (Boulder: Land and Water Fund
,00.html#Part%202.%20Permits%20To%20Drill%20And%20Operate) Pennsylvania:Pennsylvania Statutes and Consolidated Statutes Annotated. Title 58, Chapter 11. Oil and Gas Act, Sec. 601.208. “Protection of water supplies.”
(http://www.dep.state.pa.us/dep/deputate/minres/oilgas/Act223CH2.htm#Section_208); and
Department of Environment, Landowner Notification of Well Drilling or Alterations. Form 5500-
FM-OG0052. Rev. 12/2000.
(http://www.dep.state.pa.us/dep/deputate/minres/oilgas/new_forms/OG0052.doc) Colorado:Colorado Oil and Gas Conservation Commission. Rules and Policies. Exploration and Production
and Colorado Oil and Gas Conservation Commission. Typical Questions from the Public about Oil and Gas Development in Colorado. “Requiring directional drilling or pitless drilling systems.”
Northern Plains Resource Council. 2001. See endnote 393. 432
S. Phelps, J. Bauder, and K. Pearson. Coal Bed Methane Ownership and Responsibility: A Summary of Surface, Mineral, and Split-Estate Rights. Dep’t of Land Resources and
Bureau of Land Management, 43 CFR 3160 (Federal Register / Vol. 48, No. 205, Friday,
October 21, 1983). Onshore Oil and Gas Order No. 1 - Approval of Operations on Onshore Federal and Indian Oil and Gas Leases. III. Drilling, A. Surveying and Staking.
U.S. Bureau of Land Management (BLM). April 2, 2003. Instruction Memorandum No. 2003-
131, to all field officials and Washington office group managers from the Director of the BLM.
“Permitting Oil and Gas on Split Estate Lands and Guidance for Onshore Oil and Gas Order No.
1.” 436
Surface Use Program is described in the Bureau of Land Management’s
Onshore Oil and Gas Order No. 1 – Approval of Operations on Onshore Federal and Indian Oil and Gas Leases, Section G. Components of a Complete Application for Permit to Drill, No. 4.
Bureau of Land Management’s Onshore Oil and Gas Order No. 1 – Approval of Operations on Onshore Federal and Indian Oil and Gas Leases, Section G. “Components of a Complete
Application for Permit to Drill. (43 CFR 3160) (http://www.nm.blm.gov/oil_gas/onshore/ord1.html) 438
BLM. See endnote 437.439
BLM. See endnote 437.440
BLM. See endnote 437.441
Bureau of Land Management. April 2, 2003. “BLM Vows to Protect Rights of Surface Owners
Federal Code. 43 C.F.R. Sections 3104.2 and 3104.3. 448
U.S. Department of the Interior and U.S. Department of Energy. January, 2003. Scientific Inventory of Onshore Federal Lands’ Oil and Gas Resources and Reserves and the Extent and Nature of Restrictions and Impediments to Their Development.449
American Association of Professional Landmen. “What is a Landman?”
(http://www.landman.org/WhatIs.htm) 450
Scott Thompson, quoted in Dec. 2001 issue of Horizon. Marguerite Ozburn, “Landman gets
under surface issues.”451
Powder River Basin Resource Council. 2000. “Help for Surface Owners.”
and Jennings, M.C. 2001. A Field Conference on Impacts of Coalbed Methane Development in the Powder River Basin, Wyoming. U.S. Geological Survey. Open-File Report 01-126.
Weinhold, Bob. “La Plata landowners bargain for pipeline fees,” Durango Herald. January 5,
1999. 466
Schneider, Keith. September 1996. “The Role of Communities and Local Government in Oil
and Gas Development - A Position statement from the Michigan Energy Reform Coalition,” Great Lakes Bulletin News Service. (http://www.mlui.org/landwater/fullarticle.asp?fileid=4325) 467
Alexander’s Gas and Oil Connections. April 23, 2001. “Coal-bed methane could meet US’
entire natural gas needs for over 11 years.” Vol. 6, Issue 8.
Hoppe, Josh. “Bellflower Ranches gas well wins approval,” Durango Herald. April 28, 2000. 472
Hoppe, Josh. “Commissioners won’t back off on well testing rule,” Durango Herald. May 23,
2000. 473
Oil and Gas Accountability Project. December, 2002. “Oil & Gas Accountability Report.”
(http://www.ogap.org/ogar/OGAR-200212.htm); and personal communication between OGAP and
Mel Frost, Greater Yellowstone Coalition.474
Schneider, Keith. August 1, 1999. “Township Overrules DEQ, Adopts Own H2S Protections -
New rules protect the public,” Great Lakes Bulletin News Service.475
Kostka, Jennifer. August 3, 2002. “Little bit for everybody in well ruling,” Durango Herald.476
Bjork, Lindley, Danielson & Little Attorneys. 477
Colorado Court of Appeals, September 25, 2003. No. 02CA1879. Board of County Commissioners of La Plata County v. Colorado Oil and Gas Conservation Commission.(http://www.cobar.org/opinions/opinion.cfm?OpinionID=3885) 478
By Ellen Miller. July 23, 2002. “Gas well applications rejected - Commissioners cite dangers to
watershed in denying 4 of 5 requests,” Rocky Mountain News.479
December 2002. Oil and Gas Accountability Project. “Oil & Gas Accountability Report.”
(http://www.ogap.org/ogar/OGAR-200212.htm)480
Kentucky Resources Council. “HB 458 Tramples Local Government.”
All information on this story, unless otherwise indicated, comes from the following source:
Steers, Stuart. Nov. 12, 1998. “Look Out Below! When a Denver gas company started drilling
wells in Las Animas County, it brought bad feelings to the surface.” Westword.(http://westword.com/issues/1998-11-12/feature.html) 483
California Anti-SLAPP Project. “Introduction.” (http://www.casp.net) 484
California Anti-SLAPP Project. See endnote 483.485
This story appears in the Oil and Gas Accountability Project, Oil & Gas Accountability Report, February 2003. (Available at http://www.ogap.org). Reprinted with permission from the authors. 486
Rolston, Alan. March, 2003. “New Mexico Members Involved in Historic Lockout,” San Juan Citizens News. San Juan Citizens Alliance, Durango, CO.