Existing Water Quality (EWQ) Comparison of 2013 Site‐ Specific with 1992 Reach‐Wide Targets Upper and Middle Delaware River Interstate Control Points DRBC/NPS Scenic Rivers Monitoring Program Robert Limbeck Watershed Scientist, DRBC
Transcript
Existing Water Quality (EWQ) Comparison of 2013 Site‐Specific with 1992 Reach‐Wide Targets
Upper and Middle Delaware River Interstate Control Points
DRBC/NPS Scenic Rivers Monitoring Program
Robert LimbeckWatershed Scientist, DRBC
Why Conversion from Reach‐Wide to Site‐Specific?
• Breidt et. al. (1989)* analyzed EWQ for NPS and DRBC, and saw differences between sites within reaches; did not advocate reach‐wide targets; also recommended non‐parametric approach. Acceptance of these points would have delayed rule‐making at the time, so reach‐wide targets were kept in rules.
• Lower Delaware 2000‐2004 target development followed above approach; are non‐parametric and site‐specific; and have worked well for project review and assessment tasks.
• Assessment task is presently not possible using reach‐wide targets; parent data are unrecoverable and were unevenly sampled within reaches.
* Breidt, F.J., D.C. Boes, J.I Wagner, and M.D. Flora. 1991. Antidegradation water quality criteria for the Delaware River: a distribution‐free statistical approach. Water Resources Bulletin 27(5): 849‐858.
Purposes for EWQ Targets
• Project Review and Permitting Waste‐Water Treatment Facilities –use upper 95% confidence limits for design of treatment facilities to prevent water quality degradation.
• Monitoring and Assessment of Measurable Change to EWQ:– Create site‐specific baseline data set (4‐5 years, n approx. 50)– Statistically compare subsequent Assessment Rounds (3‐5 years, n = 30 to 50) to baseline set.
• Review measurable changes and feed back to permitting and planning sections, work with states, municipalities and NGO’s to solve problems before water quality degrades, instead of TMDL’s after criteria are violated.
Methods
• May to September bi‐weekly samples 2006‐2011 (mostly). River sites are composite samples (mostly) and tributary samples are center‐channel grabs. 47 sites (20 UPDE, 25 DEWA, 2 new LDEL)
• USGS and State data included (generally 1999‐2009 from NWIS and STORET) = huge PITA to clean!
• Parameters (Lab was Academy of Natural Sciences): – Field measurements (DO, SpC, pH, WT, AT)– Conventionals (Alk, Hd, TSS, TDS, Cl, Turb)– Nutrients (Ammonia, Nitrate + Nitrite, TKN, TN, Orthophosphate, TP)– Bacteria (Fecal Coliform, E. coli, Enterococcus)– Some Metals & other ions if data available (Ca, Mn, Mg, Fe, SO4)– 2009‐2010 Marcellus (archived) (Al, Ba, Ca, Fe, Mg, Mn, K, Na, Sr, SO4)
Upper Delaware (UPDE)
DataSRMP 2006‐2011;NYSDEC and PADEP 1999‐2009 WQX;USGS NWIS 1999‐2009;
and most data from:
Siemion, J. and Murdoch, P.S., 2010, Water quality of the Upper Delaware Scenic and Recreational River and tributary streams, New York and Pennsylvania: U.S. Geological Survey Scientific Investigations Report 2010–5009, 43 p., available online only at http://pubs.usgs.gov/sir/2010/5009/
Hickman R.E., and Fischer J.M., 2008, Water quality of streams in and near the Delaware Water Gap National Recreation Area, Pennsylvania and New Jersey, 2002‐04: U.S. Geological Survey Scientific Investigations Report 2007‐5290, 65 p.
No Measurable Change (NMC) Parameters
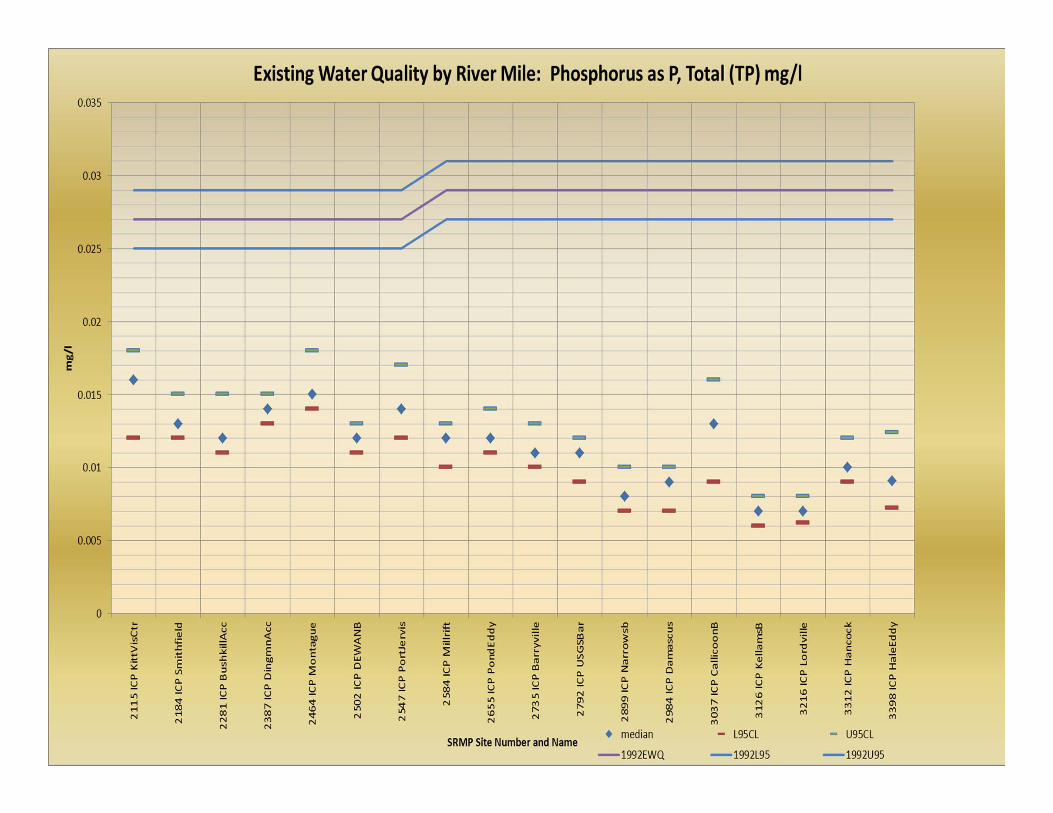
• In DRBC’s permitting process, the following parameters apply to wastewater treatment facilities subject to No Measurable Change rules: Ammonia, DO, Fecal Coliform, Nitrate + Nitrite, Total Phosphorus, TKN, TSS – charts follow showing 1992 reach‐wide EWQ vs. site‐specific EWQ 2006‐2011. Plots follow…
• BOD5 is not monitored, but also applies for NMC. Modeling section helps with this step.
• Note: Plots do not include tributaries. EWQ was not defined for tributaries in 1992; and data are now available for each tributary.
• The following parameters were also defined for anti‐degradation protection in 1992.
TDS vs. Conductivity Linear Regression
SpC = 7.07 + 1.583TDS
R2 = 0.81
Existing Water Quality (EWQ) Loadings Summary
Upper and Middle Delaware River Interstate and Boundary Control Points
DRBC/NPS Scenic Rivers Monitoring Program
Robert LimbeckWatershed Scientist, DRBC
Total Dissolved Solids (TDS) lbs./day
Total Phosphorus lbs./day
Total Chloride lbs./day
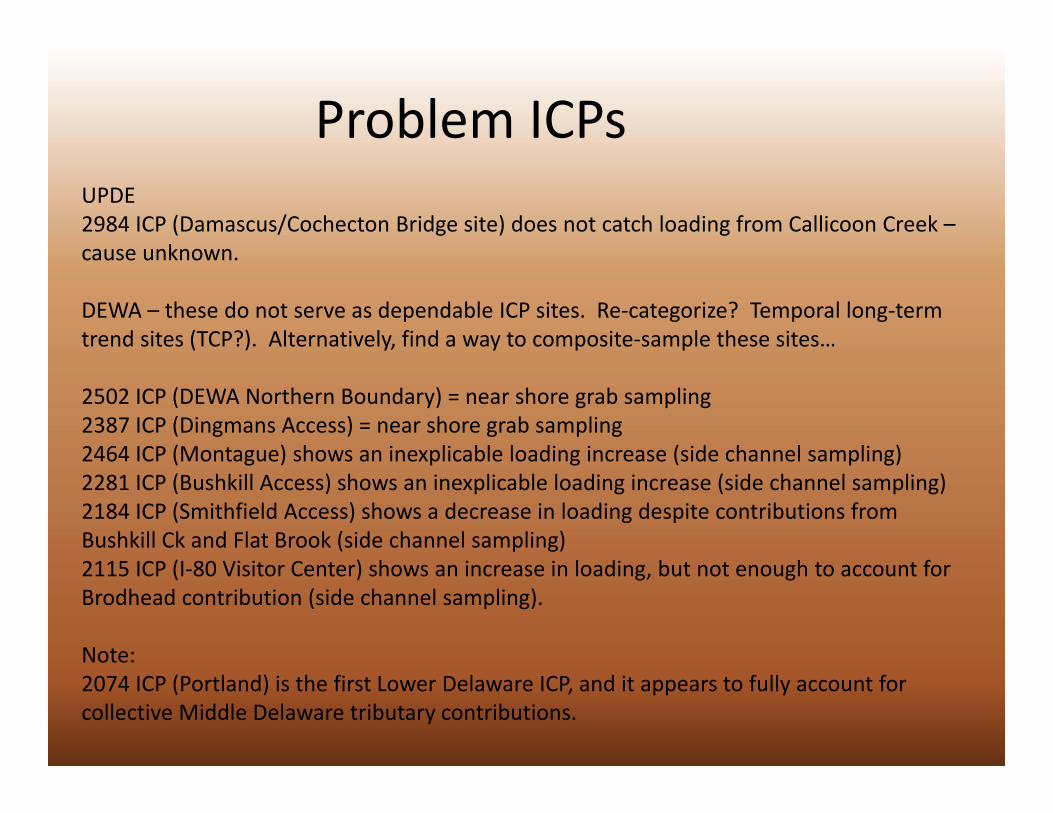
Problem ICPsUPDE2984 ICP (Damascus/Cochecton Bridge site) does not catch loading from Callicoon Creek –cause unknown.
DEWA – these do not serve as dependable ICP sites. Re‐categorize? Temporal long‐term trend sites (TCP?). Alternatively, find a way to composite‐sample these sites…
2502 ICP (DEWA Northern Boundary) = near shore grab sampling2387 ICP (Dingmans Access) = near shore grab sampling2464 ICP (Montague) shows an inexplicable loading increase (side channel sampling)2281 ICP (Bushkill Access) shows an inexplicable loading increase (side channel sampling)2184 ICP (Smithfield Access) shows a decrease in loading despite contributions from Bushkill Ck and Flat Brook (side channel sampling)2115 ICP (I‐80 Visitor Center) shows an increase in loading, but not enough to account for Brodhead contribution (side channel sampling).
Note:2074 ICP (Portland) is the first Lower Delaware ICP, and it appears to fully account for collective Middle Delaware tributary contributions.
Problem Sites 2 – DEWA too high in watershed
Sites of significant (or potentially so) presently too far from Delaware River confluence:
Adams, Hornbecks and Toms are also far from confluence but are smaller watersheds and probably insignificant loadings.
SPW Project Status Report1. UPDE/DEWA EWQ report: near completion of draft 1. EWQ packets are available for
all UPDE and DEWA sites. Eric Wentz is adding title pages, watershed maps and watershed characteristics (including flow duration curves from BaSE and Streamstats). Once review is complete, post on website and notify project review, states, and public of availability.
2. LDEL Measurable Change Assessment 1 report: Now that flow data and flow duration curves are complete, I am classifying all samples (Base set and Round 1) into flow categories (bins) for statistical comparison (t‐tests, Mann Whitney).
3. LDEL – report is not complete; as of now it is a bare‐bones outline.4. LDEL – I am also preparing scatter plots vs. flow showing Base data and Round 1 data
in overlay. I need to figure out how to display 2 regression lines with confidence boundaries, or at least the original Base regression line with confidence boundaries with the Round 1 overlay scatter plot so we can see how many samples fall outside of the Base set…
5. LDEL – set up a comparison method meeting, or at least work with Erik S. on an acceptable comparison method if the two discussed here are insufficient…
Data Availability1. Draft Water Quality Packets are available for review: contact Bob Limbeck for DropBox access ([email protected])
2. The DropBox site also has our Quality Assurance Project Plans; a guide to interpretation of Analyse‐It statistical plots; and Google Earth kml files of SRMP sites.
3. All of this information, once reviewed, will be posted for download on DRBC’s website.